district by district school funding trends - october 2010
TRANSCRIPT

An April 2010 report from Minnesota 2020 documented the change in real per pupil operating levy, aid, and revenue for each Minnesota school district from fiscal year (FY) 2003 through FY 2011. This report expands upon the previous report to include estimated debt service levy and aid amounts.
This new report includes:
• A table with summary information on real per pupil state aids and property tax levies for all Minnesota school districts that incorporates the new debt service information for FY 2003 and FY 2011.
• A statewide graph showing the projected change since FY 2003 in per pupil aid and levy amounts in constant FY 2011 dollars for each year from FY 2004 to FY 2011.
• Graphs for each Minnesota school district showing the projected change since FY 2003 in per pupil aid and levy amounts in constant FY 2011 dollars for each year from FY 2004 to FY 2011.
• Notes describing the data used in this report. (See page 2)
State debt service aid to Minnesota school districts has fallen sharply since FY 2003. However, since FY 2003 debt service aid has been a relatively small portion of debt service revenue, so the decline in debt service aid has not had a large effect on debt service levies. As a result, per pupil debt service levies in FY 2011 are projected to be no more than they were in FY 2003 after adjusting for inflation.
Because statewide debt service levies have been essentially flat since FY 2003, the percentage growth in school levies is considerably lower if debt service levies are included. From FY 2003 to FY 2011, real per pupil school operating levies are projected to grow by 140 percent. However, if debt service levies are included, the rate of school levy growth is 56.3 percent.
The sharp growth in school property taxes is driven largely by a sharp decline in state aid. From FY 2003 to FY 2011, real per pupil state aid to Minnesota school districts has fallen by 13.9 percent, including both operating and debt service aid. On a statewide basis, the increase in property taxes was not sufficient to offset the decline in real per pupil state aid, so real per pupil school revenue decline by 4.0 percent.
District-by-District School Funding Trends
upDaTeD OcTOber 2010
LOOk up FunDing by SchOOL DiSTricT
View STaTe graph
TabLe: aLL DiSTricTS
compiled by Jeff Van wychenMinnesota 2020 Fiscal Policy FellowOctober 2010

Sources and Technical notes:
School revenue in this analysis includes general education, special education, career technical, integration, alternative facilities, deferred maintenance, telecommunications, operating capital technology, and miscellaneous levies. These categories comprise nearly all school operating revenue.
In addition, school debt service levy and aid are included. Conversion to per pupil amounts based on adjusted average daily membership (AADM). With the exception of debt service amounts, all revenue, levy, and aid amounts and AADMs are from the Minnesota Department of Education (MDE) spreadsheet “DistRev02-11Feb10Forecast(1).xls” dated March 15, 2010.
Debt service levy and aid amounts are from the House Research Department. Conversion to constant FY 2011 dollars based on implicit price deflator for state and local government purchases. “Aid” amount for FY 2010 includes $500 million in federal assistance that was used to replace a one-time reduction in general education aid provided by the state.
Minnesota 2020 - www.mn2020.org Page 2

Ada-BorupAdrianAitkinAlbanyAlbert LeaAldenAlexandriaAnnandaleAnoka-HennepinAshbyAtwater-Cosmos-Grove CityAustinBadgerBagleyBarnesvilleBarnumBattle LakeBeckerBelgrade-Brooten-ElrosaBelle PlaineBemidjiBensonBertha-HewittBig LakeBird Is.-Olivia-Lake LillianBlackduckBlooming PrairieBloomingtonBlue Earth AreaBrahamBrainerdBrandonBreckenridgeBrewsterBrooklyn Center
BrowervilleBrowns ValleyBuffaloBuffalo Lake-HectorBurnsvilleButterfieldByronCaledoniaCambridge-IsantiCampbell-TintahCanbyCannon FallsCarltonCass Lake-BenaCedar MountainCentennialChaskaChatfieldChisago Lakes AreaChisholmChokio-AlbertaClearbrook-GonvickClevelandClimaxClinton-Graceville-BeardsleyCloquetColumbia HeightsComfreyCook CountyCromwell-WrightCrookstonCrosby-IrontonCyrusDassel-CokatoDawson-Boyd
Deer RiverDelanoDetroit LakesDilworth-Glyndon-FeltonDover-EyotaDuluthEagle ValleyEast CentralEast Grand ForksEden PrairieEden Valley-WatkinsEdgertonEdinaElk RiverEllsworthElyEskoEvansvilleEveleth-GilbertFairmont AreaFaribaultFarmingtonFergus FallsFertile-BeltramiFillmore CentralFisherFloodwoodFoleyForest LakeFosstonFranconiaFrazee-VergasFridleyFuldaGibbon-Fairfax-Winthrop
SchOOL DiSTricT by name
click on the name of a district to jump to the corresponding pageTo look up a district by number, see page 6
Minnesota 2020 - www.mn2020.org Page 3
Glencoe-Silver LakeGlenville-EmmonsGoodhueGoodridgeGranada-Huntley-East ChainGrand MeadowGrand RapidsGreenbush-Middle RiverGreenwayGrygla-GatzkeHancockHastingsHawleyHayfieldHendricksHenningHerman-NorcrossHermantownHeron Lake-OkabenaHibbingHill CityHills-Beaver CreekHinckley-FinlaysonHoldingfordHopkinsHoustonHoward Lake-Waverly-WinstedHutchinsonInternational FallsInver Grove-Pine BendIsleIvanhoeJackson County CentralJanesville-Waldorf-PembertonJordanKasson-MantorvilleKelliherKenyon-WanamingoKerkhoven-Murdock-SunburgKimball
KingslandKittson CentralLac Qui Parle ValleyLaCrescent-HokahLake BentonLake CityLake Crystal-Wellcome-Mem.Lake of the WoodsLake Park-AudubonLake SuperiorLakeviewLakevilleLancasterLanesboroLaporteLe CenterLeRoy-OstranderLester PrairieLeSueur-HendersonLewiston-AlturaLitchfieldLittle FallsLittlefork-Big FallsLong Prairie-Grey EagleLuverne-MagnoliaLyleLyndMabel-CantonMACCRAYMadeliaMahnomenMahtomediMankatoMaple LakeMaple RiverMarshallMarshall County Central Sch.Martin County WestMcGregorMedford
MelroseMenahgaMesabi EastMilacaMilroyMinneapolisMinneotaMinnetonkaMinnewaskaMontevideoMontgomery-LonsdaleMonticelloMoorheadMoose LakeMoraMorrisMounds ViewMountain Iron-BuhlMountain LakeMurray County CentralN.R.H.E.G.Nashwauk-KeewatinNett LakeNevisNew London-SpicerNew Prague AreaNew Ulm-HanskaNew York MillsNicolletNorman County EastNorman County WestNorth BranchNorth St. Paul-MaplewoodNorthfieldNorthland CommunityNorwood Young AmericaOgilvieOkleeOnamiaOrono
Minnesota 2020 - www.mn2020.org Page 4

Ortonville-BellinghamOsakisOsseoOwatonnaPark RapidsParkers PrairiePaynesvillePelican RapidsPequot LakesPerhamPierzPillagerPine CityPine IslandPine PointPine River-BackusPipestone AreaPlainview-Elgin-MillvillePlummerPrincetonPrior LakeProctorRandolphRed LakeRed Lake FallsRed Rock CentralRed WingRedwood Falls AreaRenville County WestRichfieldRobbinsdaleRochesterRockfordROCORI AreaRoseauRosemount-Apple Valley-EaganRosevilleRothsayRound LakeRoyalton
RTR Public SchoolsRush CityRushford-PetersonSaint Anthony-New BrightonSaint CharlesSaint ClairSaint CloudSaint FrancisSaint JamesSaint Louis CountySaint Louis ParkSaint Michael-AlbertvilleSaint PaulSaint PeterSartellSauk CentreSauk RapidsSebekaShakopeeSibley EastSleepy EyeSouth KoochichingSouth St. PaulSouth WashingtonSouthlandSpring GroveSpring Lake ParkSpringfieldStaples-MotleyStephen-Argyle CentralStewartvilleStillwaterSwanvilleThief River FallsTracy AreaTri-CountyTritonTrumanUlen-HitterdalUnderwood
United South CentralUpsalaVerndaleVirginiaWabasha-KelloggWabassoWaconiaWadena-Deer CreekWalker-Hackensack-AkeleyWarren-Alvarado-OsloWarroadWasecaWatertown-MayerWaterville-Elysian-Morristw.WaubunWayzataWest Central AreaWest Saint PaulWestbrook-Walnut GroveWestonkaWheaton AreaWhite Bear LakeWillmarWillow RiverWindomWin-E-MacWinona Area PublicWorthingtonWrenshallYellow Medicine EastZumbrota-Mazeppa
Minnesota 2020 - www.mn2020.org Page 5

1 Aitkin2 HillCity4 McGregor6 SouthSt.Paul11 Anoka-Hennepin12 Centennial13 ColumbiaHeights14 Fridley15 SaintFrancis16 SpringLakePark22 DetroitLakes23 Frazee-Vergas25 PinePoint31 Bemidji32 Blackduck36 Kelliher38 RedLake47 SaukRapids51 Foley75 SaintClair77 Mankato81 Comfrey84 SleepyEye85 Springfield88 NewUlm-Hanska91 Barnum93 Carlton94 Cloquet95 Cromwell-Wright97 MooseLake99 Esko100 Wrenshall108 NorwoodYoungAmerica110 Waconia111 Watertown-Mayer112 Chaska113 Walker-Hackensack-Akeley115 CassLake-Bena116 Pillager118 NorthlandCommunity129 Montevideo138 NorthBranch139 RushCity146 Barnesville150 Hawley152 Moorhead162 Bagley166 CookCounty173 MountainLake177 Windom181 Brainerd182 Crosby-Ironton186 PequotLakes191 Burnsville
192 Farmington194 Lakeville195 Randolph196 Rosemount-AppleValley-Eagan197 WestSaintPaul199 InverGrove-PineBend200 Hastings203 Hayfield204 Kasson-Mantorville206 Alexandria207 Brandon208 Evansville213 Osakis227 Chatfield229 Lanesboro238 Mabel-Canton239 Rushford-Peterson241 AlbertLea242 Alden252 CannonFalls253 Goodhue255 PineIsland256 RedWing261 Ashby264 Herman-Norcross270 Hopkins271 Bloomington272 EdenPrairie273 Edina276 Minnetonka277 Westonka278 Orono279 Osseo280 Richfield281 Robbinsdale282 SaintAnthony-NewBrighton283 SaintLouisPark284 Wayzata286 BrooklynCenter294 Houston297 SpringGrove299 Caledonia300 LaCrescent-Hokah306 Laporte308 Nevis309 ParkRapids314 Braham316 Greenway317 DeerRiver318 GrandRapids319 Nashwauk-Keewatin323 Franconia330 HeronLake-Okabena332 Mora
333 Ogilvie345 NewLondon-Spicer347 Willmar356 Lancaster361 InternationalFalls362 Littlefork-BigFalls363 SouthKoochiching378 Dawson-Boyd381 LakeSuperior390 LakeoftheWoods391 Cleveland392 LeCenter394 Montgomery-Lonsdale402 Hendricks403 Ivanhoe404 LakeBenton413 Marshall414 Minneota415 Lynd423 Hutchinson424 LesterPrairie432 Mahnomen435 Waubun441 MarshallCountyCentralSch.447 Grygla-Gatzke458 Truman463 EdenValley-Watkins465 Litchfield466 Dassel-Cokato473 Isle477 Princeton480 Onamia482 LittleFalls484 Pierz485 Royalton486 Swanville487 Upsala492 Austin495 GrandMeadow497 Lyle499 LeRoy-Ostrander500 Southland505 Fulda507 Nicollet508 SaintPeter511 Adrian513 Brewster514 Ellsworth516 RoundLake518 Worthington531 Byron533 Dover-Eyota534 Stewartville535 Rochester
SchOOL DiSTricT by DiSTricT number
Minnesota 2020 - www.mn2020.org Page 6

542 BattleLake544 FergusFalls545 Henning547 ParkersPrairie548 PelicanRapids549 Perham550 Underwood553 NewYorkMills561 Goodridge564 ThiefRiverFalls577 WillowRiver578 PineCity581 Edgerton592 Climax593 Crookston595 EastGrandForks599 Fertile-Beltrami600 Fisher601 Fosston611 Cyrus621 MoundsView622 NorthSt.Paul-Maplewood623 Roseville624 WhiteBearLake625 SaintPaul627 Oklee628 Plummer630 RedLakeFalls635 Milroy640 Wabasso656 Faribault659 Northfield671 Hills-BeaverCreek676 Badger682 Roseau690 Warroad695 Chisholm696 Ely698 Floodwood700 Hermantown701 Hibbing704 Proctor706 Virginia707 NettLake709 Duluth712 MountainIron-Buhl716 BellePlaine717 Jordan719 PriorLake720 Shakopee721 NewPragueArea726 Becker727 BigLake728 ElkRiver738 Holdingford739 Kimball740 Melrose741 Paynesville
742 SaintCloud743 SaukCentre745 Albany748 Sartell750 ROCORIArea756 BloomingPrairie761 Owatonna763 Medford768 Hancock769 Morris771 Chokio-Alberta775 Kerkhoven-Murdock-Sunburg777 Benson786 Bertha-Hewitt787 Browerville801 BrownsValley803 WheatonArea811 Wabasha-Kellogg813 LakeCity818 Verndale820 Sebeka821 Menahga829 Waseca831 ForestLake832 Mahtomedi833 SouthWashington834 Stillwater836 Butterfield837 Madelia840 SaintJames846 Breckenridge850 Rothsay852 Campbell-Tintah857 Lewiston-Altura858 SaintCharles861 WinonaAreaPublic876 Annandale877 Buffalo879 Delano881 MapleLake882 Monticello883 Rockford885 SaintMichael-Albertville891 Canby911 Cambridge-Isanti912 Milaca914 Ulen-Hitterdal2071 LakeCrystal-Wellcome-Mem.2125 Triton2134 UnitedSouthCentral2135 MapleRiver2137 Kingsland2142 SaintLouisCounty2143 Waterville-Elysian-Morristw.2144 ChisagoLakesArea2149 Minnewaska2154 Eveleth-Gilbert2155 Wadena-DeerCreek
2159 BuffaloLake-Hector2164 Dilworth-Glyndon-Felton2165 Hinckley-Finlayson2167 Lakeview2168 N.R.H.E.G.2169 MurrayCountyCentral2170 Staples-Motley2171 KittsonCentral2172 Kenyon-Wanamingo2174 PineRiver-Backus2176 Warren-Alvarado-Oslo2180 MACCRAY2184 Luverne-Magnolia2190 YellowMedicineEast2198 FillmoreCentral2215 NormanCountyEast2310 SibleyEast2311 Clearbrook-Gonvick2342 WestCentralArea2358 Tri-County2364 Belgrade-Brooten-Elrosa2365 Gibbon-Fairfax-Winthrop2396 Atwater-Cosmos-GroveCity2397 LeSueur-Henderson2448 MartinCountyWest2527 NormanCountyWest2534 BirdIs.-Olivia-LakeLillian2536 Granada-Huntley-EastChain2580 EastCentral2609 Win-E-Mac2683 Greenbush-MiddleRiver2687 HowardLake-Waverly-Winsted2689 PipestoneArea2711 MesabiEast2752 FairmontArea2753 LongPrairie-GreyEagle2754 CedarMountain2759 EagleValley2805 Zumbrota-Mazeppa2835 Janesville-Waldorf-Pemberton2853 LacQuiParleValley2854 Ada-Borup2856 Stephen-ArgyleCentral2859 Glencoe-SilverLake2860 BlueEarthArea2884 RedRockCentral2886 Glenville-Emmons2888 Clinton-Graceville-Beardsley2889 LakePark-Audubon2890 RenvilleCountyWest2895 JacksonCountyCentral2897 RedwoodFallsArea2898 Westbrook-WalnutGrove2899 Plainview-Elgin-Millville2902 RTRPublicSchools2903 Ortonville-Bellingham2904 TracyArea
Minnesota 2020 - www.mn2020.org Page 7

Dist.Code District Name Aid Levy Rev. Aid Levy Rev. Aid Levy Rev. 2854 Ada-Borup 10,116 267 10,383 9,071 593 9,664 (1,045) 326 (719) -6.9%511 Adrian 9,077 1,114 10,190 8,300 2,105 10,404 (777) 991 214 2.1%1 Aitkin 9,155 299 9,455 7,645 658 8,303 (1,510) 359 (1,151) -12.2%
745 Albany 8,844 940 9,784 7,283 1,657 8,940 (1,561) 717 (844) -8.6%241 Albert Lea 9,452 1,175 10,627 8,772 2,226 10,998 (680) 1,052 371 3.5%242 Alden 8,456 940 9,396 7,864 1,394 9,258 (592) 454 (138) -1.5%206 Alexandria 9,016 699 9,715 7,573 1,661 9,234 (1,443) 962 (481) -5.0%876 Annandale 8,780 977 9,756 7,453 1,467 8,920 (1,327) 491 (836) -8.6%11 Anoka-Hennepin 8,982 1,260 10,241 8,018 2,456 10,474 (964) 1,196 233 2.3%
261 Ashby 9,838 1,545 11,383 7,504 3,758 11,261 (2,334) 2,213 (121) -1.1%2396 Atwater-Cosmos-Grove City 9,488 1,436 10,924 8,140 2,895 11,035 (1,348) 1,459 111 1.0%492 Austin 9,472 770 10,243 8,734 1,276 10,010 (738) 506 (232) -2.3%676 Badger 10,350 773 11,123 8,998 1,097 10,095 (1,352) 324 (1,028) -9.2%162 Bagley 10,112 899 11,011 8,467 1,323 9,791 (1,645) 425 (1,220) -11.1%146 Barnesville 8,988 977 9,965 7,756 1,013 8,770 (1,232) 36 (1,196) -12.0%91 Barnum 9,217 1,437 10,653 7,724 2,335 10,059 (1,493) 899 (594) -5.6%
542 Battle Lake 8,722 1,931 10,653 7,104 1,891 8,995 (1,618) (40) (1,658) -15.6%726 Becker 8,078 3,237 11,314 6,898 2,300 9,197 (1,180) (937) (2,117) -18.7%2364 Belgrade-Brooten-Elrosa 9,998 1,407 11,405 8,080 2,494 10,574 (1,918) 1,086 (832) -7.3%716 Belle Plaine 8,701 668 9,368 7,649 3,089 10,738 (1,052) 2,421 1,369 14.6%31 Bemidji 9,996 1,314 11,310 8,617 1,687 10,304 (1,379) 373 (1,006) -8.9%
777 Benson 9,264 654 9,918 8,196 1,094 9,289 (1,069) 440 (629) -6.3%786 Bertha-Hewitt 10,520 706 11,226 9,187 1,520 10,706 (1,333) 814 (520) -4.6%727 Big Lake 8,421 1,264 9,685 7,516 1,968 9,485 (905) 704 (201) -2.1%2534 Bird Is.-Olivia-Lake Lillian 9,364 935 10,298 7,876 1,596 9,472 (1,488) 661 (827) -8.0%32 Blackduck 10,324 785 11,109 9,220 1,267 10,487 (1,104) 482 (622) -5.6%
756 Blooming Prairie 8,908 722 9,630 7,632 2,706 10,338 (1,277) 1,984 708 7.3%271 Bloomington 9,369 2,769 12,138 8,086 3,529 11,615 (1,282) 760 (523) -4.3%2860 Blue Earth Area 9,184 297 9,480 8,312 957 9,269 (872) 661 (211) -2.2%314 Braham 9,187 1,157 10,344 7,887 1,731 9,618 (1,300) 574 (726) -7.0%181 Brainerd 9,388 1,335 10,723 7,991 1,902 9,893 (1,397) 567 (830) -7.7%207 Brandon 8,709 81 8,790 7,374 1,322 8,696 (1,335) 1,241 (94) -1.1%846 Breckenridge 8,914 483 9,396 8,262 1,122 9,384 (651) 639 (12) -0.1%513 Brewster 9,906 631 10,536 8,156 1,382 9,538 (1,749) 751 (998) -9.5%286 Brooklyn Center 9,732 2,188 11,920 9,181 1,868 11,049 (551) (319) (870) -7.3%787 Browerville 9,518 118 9,636 8,645 839 9,484 (872) 721 (152) -1.6%801 Browns Valley 12,234 670 12,904 10,642 865 11,507 (1,592) 195 (1,397) -10.8%877 Buffalo 8,558 1,011 9,569 7,306 2,013 9,319 (1,252) 1,002 (251) -2.6%2159 Buffalo Lake-Hector 9,241 71 9,311 8,403 1,424 9,827 (838) 1,353 515 5.5%191 Burnsville 9,179 1,774 10,953 8,265 3,092 11,356 (914) 1,318 404 3.7%836 Butterfield 9,940 510 10,450 10,000 1,058 11,058 60 548 608 5.8%531 Byron 8,478 815 9,293 7,065 1,762 8,827 (1,413) 947 (466) -5.0%299 Caledonia 9,386 1,422 10,808 8,248 3,338 11,586 (1,138) 1,916 778 7.2%911 Cambridge-Isanti 8,575 684 9,259 7,244 1,520 8,764 (1,330) 836 (495) -5.3%852 Campbell-Tintah 12,792 340 13,133 10,805 3,080 13,885 (1,987) 2,740 752 5.7%891 Canby 9,654 773 10,426 8,633 1,340 9,974 (1,020) 568 (453) -4.3%
FY 2003 & FY 2011 School District Aid, Levy, and Revenue
FY 2011 Change: FY '03 to FY '11 % Change in Revenue
in Constant FY 2011 Dollars Per PupilRevenue amounts include general education, special education, career technical, integration, alternative facilities, deferred maintenance, telecommunications, operating capital technology, and miscellaneous levies. These categories comprise nearly all school operating revenue. In addition, school debt service levy and aid are included. Conversion to per pupil amounts based on adjusted average daily membership (AADM). With the exception of debt service, all revenue, levy, and aid amounts and AADMs from the MDE spreadsheet "DistRev02-11Feb10Forecast(1).xls" dated March 15, 2010. Debt service levy and aid amounts from the House Research Department. Conversion to constant FY 2011 dollars based on implicit price deflator for state and local government purchases.
FY 2003

Dist.Code District Name Aid Levy Rev. Aid Levy Rev. Aid Levy Rev.
FY 2011 Change: FY '03 to FY '11 % Change in Revenue
FY 2003
252 Cannon Falls 8,312 775 9,087 7,027 1,964 8,992 (1,285) 1,189 (96) -1.1%93 Carlton 8,699 69 8,768 7,787 968 8,755 (912) 899 (13) -0.1%
115 Cass Lake-Bena 12,352 1,214 13,566 10,877 2,179 13,056 (1,475) 965 (510) -3.8%2754 Cedar Mountain 9,852 1,049 10,900 8,417 1,102 9,519 (1,435) 54 (1,381) -12.7%12 Centennial 9,017 1,247 10,263 7,950 2,435 10,385 (1,067) 1,188 122 1.2%
112 Chaska 8,889 2,436 11,324 7,323 3,652 10,975 (1,566) 1,217 (349) -3.1%227 Chatfield 8,706 302 9,008 7,059 2,259 9,318 (1,647) 1,957 310 3.4%2144 Chisago Lakes Area 8,644 1,107 9,750 7,352 1,809 9,160 (1,292) 702 (590) -6.0%695 Chisholm 9,066 570 9,636 8,220 1,205 9,425 (847) 636 (211) -2.2%771 Chokio-Alberta 9,810 658 10,468 8,604 3,009 11,613 (1,206) 2,351 1,145 10.9%2311 Clearbrook-Gonvick 9,815 2,217 12,031 8,550 2,908 11,458 (1,264) 691 (573) -4.8%391 Cleveland 8,805 929 9,734 6,903 1,316 8,219 (1,902) 386 (1,515) -15.6%592 Climax 12,033 459 12,493 10,685 1,442 12,127 (1,348) 982 (365) -2.9%
2888 Clinton-Graceville-Beardsley 10,333 815 11,149 9,643 1,612 11,255 (690) 797 106 1.0%94 Cloquet 9,114 904 10,018 7,668 1,243 8,911 (1,446) 339 (1,107) -11.1%13 Columbia Heights 9,312 2,072 11,384 9,715 2,701 12,416 403 629 1,032 9.1%81 Comfrey 10,696 604 11,300 8,673 1,631 10,304 (2,023) 1,027 (996) -8.8%
166 Cook County 9,563 706 10,269 9,153 1,441 10,594 (409) 734 325 3.2%95 Cromwell-Wright 10,748 1,611 12,360 8,574 2,755 11,329 (2,175) 1,144 (1,031) -8.3%
593 Crookston 9,929 1,428 11,357 8,397 1,531 9,928 (1,532) 103 (1,429) -12.6%182 Crosby-Ironton 9,376 1,820 11,196 8,183 2,480 10,664 (1,193) 661 (532) -4.7%611 Cyrus 9,164 303 9,468 8,082 1,342 9,424 (1,083) 1,038 (44) -0.5%466 Dassel-Cokato 8,662 873 9,536 7,408 1,444 8,852 (1,254) 571 (683) -7.2%378 Dawson-Boyd 9,607 774 10,380 8,574 1,367 9,941 (1,032) 593 (439) -4.2%317 Deer River 9,593 663 10,256 8,507 1,641 10,148 (1,086) 978 (108) -1.1%879 Delano 8,316 1,790 10,106 7,093 2,558 9,651 (1,224) 768 (455) -4.5%22 Detroit Lakes 9,227 844 10,071 7,950 1,239 9,189 (1,278) 395 (883) -8.8%
2164 Dilworth-Glyndon-Felton 8,528 721 9,249 7,354 1,068 8,423 (1,174) 347 (826) -8.9%533 Dover-Eyota 8,801 873 9,674 7,424 1,467 8,891 (1,377) 594 (783) -8.1%709 Duluth 9,996 911 10,906 8,286 2,512 10,798 (1,709) 1,601 (109) -1.0%2759 Eagle Valley 10,240 664 10,904 8,781 1,446 10,227 (1,459) 782 (677) -6.2%2580 East Central 10,216 1,416 11,632 8,994 3,406 12,400 (1,222) 1,990 767 6.6%595 East Grand Forks 8,829 143 8,972 7,644 1,031 8,675 (1,185) 888 (297) -3.3%272 Eden Prairie 8,269 2,274 10,544 7,492 3,179 10,671 (777) 905 127 1.2%463 Eden Valley-Watkins 9,301 1,236 10,537 7,576 1,618 9,194 (1,725) 382 (1,343) -12.7%581 Edgerton 9,484 578 10,062 8,552 1,418 9,970 (932) 841 (92) -0.9%273 Edina 8,185 3,220 11,405 7,222 3,701 10,922 (964) 481 (483) -4.2%728 Elk River 8,979 1,787 10,766 7,442 3,078 10,520 (1,537) 1,292 (245) -2.3%514 Ellsworth 9,404 244 9,648 8,672 911 9,583 (732) 667 (65) -0.7%696 Ely 9,133 368 9,501 7,692 2,148 9,840 (1,441) 1,780 339 3.6%99 Esko 9,380 927 10,307 6,800 1,237 8,036 (2,580) 310 (2,270) -22.0%
208 Evansville 9,495 699 10,194 7,705 2,492 10,196 (1,791) 1,793 2 0.0%2154 Eveleth-Gilbert 9,047 545 9,592 7,686 682 8,368 (1,361) 137 (1,224) -12.8%2752 Fairmont Area 9,416 736 10,153 8,151 2,136 10,287 (1,266) 1,400 135 1.3%656 Faribault 9,916 1,380 11,296 8,256 2,261 10,517 (1,660) 880 (780) -6.9%192 Farmington 8,985 1,437 10,422 8,088 2,972 11,061 (897) 1,535 638 6.1%544 Fergus Falls 9,230 913 10,143 7,493 2,169 9,662 (1,737) 1,256 (481) -4.7%599 Fertile-Beltrami 10,131 860 10,991 8,889 1,304 10,193 (1,242) 445 (797) -7.3%2198 Fillmore Central 9,181 995 10,176 7,848 2,452 10,300 (1,333) 1,457 124 1.2%600 Fisher 9,157 1,570 10,727 7,978 1,680 9,659 (1,179) 110 (1,069) -10.0%698 Floodwood 9,936 1,903 11,839 8,862 3,113 11,974 (1,074) 1,210 135 1.1%51 Foley 8,977 1,289 10,266 7,580 2,093 9,673 (1,397) 804 (592) -5.8%
831 Forest Lake 8,734 1,654 10,387 7,213 1,979 9,192 (1,521) 325 (1,195) -11.5%601 Fosston 9,698 946 10,644 8,877 1,303 10,180 (821) 357 (464) -4.4%323 Franconia 8,262 1,098 9,360 6,431 1,670 8,101 (1,831) 572 (1,259) -13.5%23 Frazee-Vergas 9,399 1,085 10,484 7,855 2,699 10,553 (1,544) 1,614 70 0.7%14 Fridley 9,168 1,355 10,523 8,607 2,374 10,981 (561) 1,019 458 4.3%
505 Fulda 10,076 830 10,906 9,112 1,957 11,069 (965) 1,128 163 1.5%2365 Gibbon-Fairfax-Winthrop 9,550 715 10,266 7,877 1,609 9,486 (1,673) 894 (780) -7.6%

Dist.Code District Name Aid Levy Rev. Aid Levy Rev. Aid Levy Rev.
FY 2011 Change: FY '03 to FY '11 % Change in Revenue
FY 2003
2859 Glencoe-Silver Lake 8,894 364 9,258 7,651 1,240 8,891 (1,243) 876 (367) -4.0%2886 Glenville-Emmons 9,179 250 9,429 7,677 1,068 8,745 (1,502) 818 (684) -7.3%253 Goodhue 8,415 905 9,320 7,073 1,204 8,277 (1,342) 299 (1,043) -11.2%561 Goodridge 12,570 144 12,715 11,071 760 11,832 (1,499) 616 (883) -6.9%2536 Granada-Huntley-East Chain 10,425 567 10,992 9,761 2,874 12,635 (664) 2,307 1,643 14.9%495 Grand Meadow 9,656 2,526 12,182 7,893 2,823 10,715 (1,763) 296 (1,467) -12.0%318 Grand Rapids 9,514 1,537 11,050 7,744 1,267 9,011 (1,770) (270) (2,040) -18.5%2683 Greenbush-Middle River 11,884 406 12,291 10,162 663 10,825 (1,722) 257 (1,466) -11.9%316 Greenway 9,634 688 10,323 8,057 875 8,932 (1,577) 187 (1,390) -13.5%447 Grygla-Gatzke 13,166 635 13,801 11,868 891 12,759 (1,298) 256 (1,042) -7.6%768 Hancock 9,627 1,341 10,968 7,830 1,887 9,717 (1,797) 546 (1,251) -11.4%200 Hastings 8,934 1,139 10,072 7,513 3,128 10,641 (1,420) 1,989 568 5.6%150 Hawley 9,084 620 9,704 7,377 1,441 8,818 (1,707) 821 (886) -9.1%203 Hayfield 8,389 880 9,268 7,733 1,558 9,292 (655) 678 23 0.2%402 Hendricks 9,488 275 9,763 8,312 1,675 9,987 (1,176) 1,401 224 2.3%545 Henning 9,769 1,941 11,710 7,930 2,885 10,815 (1,840) 944 (896) -7.7%264 Herman-Norcross 12,316 848 13,163 11,606 565 12,171 (710) (283) (992) -7.5%700 Hermantown 8,464 835 9,298 6,975 835 7,810 (1,488) 0 (1,488) -16.0%330 Heron Lake-Okabena 10,094 1,498 11,592 8,670 2,787 11,457 (1,424) 1,289 (135) -1.2%701 Hibbing 8,825 143 8,968 7,854 1,061 8,916 (971) 918 (53) -0.6%2 Hill City 10,829 1,056 11,884 9,826 2,145 11,971 (1,003) 1,089 87 0.7%
671 Hills-Beaver Creek 9,010 857 9,867 7,825 1,230 9,055 (1,185) 373 (812) -8.2%2165 Hinckley-Finlayson 8,814 580 9,394 7,895 1,508 9,403 (919) 928 9 0.1%738 Holdingford 9,159 1,031 10,191 7,174 1,602 8,776 (1,986) 571 (1,415) -13.9%270 Hopkins 8,987 3,695 12,682 8,067 5,066 13,133 (920) 1,371 451 3.6%294 Houston 8,408 262 8,670 7,274 523 7,798 (1,134) 261 (873) -10.1%
2687 Howard Lake-Waverly-Winsted 8,749 166 8,915 7,419 3,057 10,476 (1,330) 2,891 1,561 17.5%423 Hutchinson 8,456 1,059 9,515 7,437 1,533 8,971 (1,019) 474 (544) -5.7%361 International Falls 9,379 882 10,261 8,006 1,386 9,392 (1,373) 504 (869) -8.5%199 Inver Grove-Pine Bend 9,145 1,371 10,516 7,763 2,425 10,188 (1,383) 1,054 (329) -3.1%473 Isle 9,175 1,627 10,803 7,801 1,698 9,499 (1,375) 71 (1,304) -12.1%403 Ivanhoe 9,642 299 9,941 8,761 5,294 14,055 (881) 4,995 4,114 41.4%2895 Jackson County Central 9,181 1,716 10,897 7,978 2,531 10,509 (1,203) 815 (388) -3.6%2835 Janesville-Waldorf-Pemberton 9,940 2,420 12,360 7,981 3,041 11,023 (1,958) 621 (1,337) -10.8%717 Jordan 8,955 1,857 10,812 7,397 2,246 9,643 (1,559) 390 (1,169) -10.8%204 Kasson-Mantorville 8,189 741 8,930 7,060 1,475 8,534 (1,129) 733 (395) -4.4%36 Kelliher 14,607 813 15,420 12,150 2,288 14,437 (2,457) 1,475 (982) -6.4%
2172 Kenyon-Wanamingo 9,053 1,785 10,839 7,809 2,660 10,470 (1,244) 875 (369) -3.4%775 Kerkhoven-Murdock-Sunburg 9,517 1,298 10,815 8,474 1,763 10,237 (1,043) 465 (578) -5.3%739 Kimball 8,666 1,404 10,071 7,283 1,743 9,026 (1,384) 339 (1,045) -10.4%2137 Kingsland 9,593 402 9,995 7,806 2,176 9,982 (1,787) 1,774 (13) -0.1%2171 Kittson Central 10,665 2,438 13,103 10,687 3,051 13,738 22 613 635 4.8%2853 Lac Qui Parle Valley 9,848 787 10,634 8,555 1,595 10,151 (1,293) 809 (484) -4.6%300 LaCrescent-Hokah 8,793 677 9,469 7,770 1,554 9,324 (1,023) 877 (145) -1.5%404 Lake Benton 9,088 620 9,708 8,059 4,057 12,117 (1,029) 3,438 2,409 24.8%813 Lake City 8,442 311 8,753 7,378 2,033 9,411 (1,065) 1,722 658 7.5%2071 Lake Crystal-Wellcome-Mem. 9,483 556 10,039 8,315 2,878 11,193 (1,168) 2,322 1,154 11.5%390 Lake of the Woods 9,943 1,732 11,675 9,146 3,958 13,104 (797) 2,225 1,428 12.2%2889 Lake Park-Audubon 8,740 368 9,107 7,180 1,394 8,574 (1,560) 1,027 (533) -5.9%381 Lake Superior 9,669 2,004 11,673 8,091 2,666 10,757 (1,578) 661 (917) -7.9%2167 Lakeview 9,027 1,607 10,634 7,903 2,118 10,021 (1,124) 511 (613) -5.8%194 Lakeville 8,511 1,836 10,347 7,342 2,753 10,096 (1,169) 917 (252) -2.4%356 Lancaster 11,149 459 11,608 9,594 917 10,511 (1,555) 459 (1,097) -9.4%229 Lanesboro 9,202 1,369 10,571 7,220 1,372 8,592 (1,983) 4 (1,979) -18.7%306 Laporte 11,038 2,094 13,132 9,009 4,315 13,324 (2,029) 2,221 192 1.5%392 Le Center 9,048 1,429 10,477 8,115 2,027 10,142 (933) 598 (335) -3.2%499 LeRoy-Ostrander 9,673 1,251 10,924 7,950 2,488 10,438 (1,723) 1,238 (486) -4.4%424 Lester Prairie 8,101 509 8,611 6,866 2,009 8,874 (1,236) 1,499 263 3.1%2397 LeSueur-Henderson 9,076 532 9,608 7,695 2,177 9,872 (1,381) 1,645 264 2.8%

Dist.Code District Name Aid Levy Rev. Aid Levy Rev. Aid Levy Rev.
FY 2011 Change: FY '03 to FY '11 % Change in Revenue
FY 2003
857 Lewiston-Altura 9,085 902 9,987 7,607 1,108 8,715 (1,478) 206 (1,272) -12.7%465 Litchfield 8,847 617 9,464 7,847 1,759 9,606 (999) 1,142 142 1.5%482 Little Falls 9,448 416 9,864 8,266 1,485 9,751 (1,182) 1,069 (113) -1.1%362 Littlefork-Big Falls 11,263 871 12,134 9,752 1,863 11,616 (1,511) 992 (519) -4.3%2753 Long Prairie-Grey Eagle 9,668 1,157 10,825 8,759 2,330 11,089 (909) 1,173 264 2.4%2184 Luverne-Magnolia 9,166 1,279 10,445 7,938 1,813 9,752 (1,228) 534 (694) -6.6%497 Lyle 10,126 392 10,518 8,763 2,691 11,455 (1,362) 2,299 937 8.9%415 Lynd 9,904 108 10,011 8,298 1,943 10,240 (1,606) 1,835 229 2.3%238 Mabel-Canton 9,183 1,540 10,723 7,726 2,961 10,687 (1,457) 1,421 (36) -0.3%2180 MACCRAY 10,248 1,542 11,790 8,278 2,867 11,146 (1,969) 1,326 (644) -5.5%837 Madelia 9,755 1,301 11,055 8,625 2,169 10,795 (1,130) 869 (261) -2.4%432 Mahnomen 11,234 591 11,826 9,240 824 10,063 (1,995) 232 (1,762) -14.9%832 Mahtomedi 8,518 2,257 10,775 7,255 2,722 9,977 (1,263) 465 (797) -7.4%77 Mankato 8,925 722 9,647 7,585 2,014 9,599 (1,340) 1,293 (47) -0.5%
881 Maple Lake 8,862 2,280 11,141 7,671 2,587 10,258 (1,191) 308 (883) -7.9%2135 Maple River 8,826 648 9,474 7,926 1,503 9,428 (901) 855 (46) -0.5%413 Marshall 9,036 934 9,969 8,187 2,421 10,608 (849) 1,487 638 6.4%441 Marshall County Central Sch. 11,404 506 11,910 9,516 805 10,321 (1,888) 300 (1,589) -13.3%2448 Martin County West 9,199 363 9,562 7,989 1,273 9,262 (1,210) 910 (300) -3.1%
4 McGregor 11,293 1,854 13,147 10,041 2,604 12,645 (1,253) 750 (502) -3.8%763 Medford 8,691 1,811 10,502 6,736 1,502 8,238 (1,955) (308) (2,264) -21.6%740 Melrose 9,044 945 9,989 8,159 1,767 9,926 (885) 822 (63) -0.6%821 Menahga 9,338 623 9,961 7,623 1,045 8,668 (1,715) 422 (1,293) -13.0%2711 Mesabi East 9,351 567 9,919 7,940 1,240 9,180 (1,411) 672 (739) -7.4%912 Milaca 8,702 852 9,554 7,529 843 8,373 (1,173) (9) (1,182) -12.4%635 Milroy 8,832 230 9,062 9,163 1,932 11,095 331 1,703 2,034 22.4%1 Minneapolis 12,915 3,044 15,959 10,759 4,540 15,299 (2,156) 1,496 (660) -4.1%
414 Minneota 8,794 774 9,568 7,786 1,573 9,360 (1,007) 799 (208) -2.2%276 Minnetonka 8,450 2,726 11,176 7,093 3,076 10,170 (1,357) 351 (1,006) -9.0%2149 Minnewaska 9,290 909 10,199 8,421 2,624 11,045 (869) 1,715 846 8.3%129 Montevideo 9,494 763 10,258 8,477 1,519 9,996 (1,017) 755 (261) -2.5%394 Montgomery-Lonsdale 8,821 987 9,808 7,385 2,776 10,161 (1,435) 1,789 353 3.6%882 Monticello 8,605 1,668 10,273 7,436 2,537 9,972 (1,169) 869 (300) -2.9%152 Moorhead 9,954 1,429 11,383 8,009 1,492 9,501 (1,945) 63 (1,882) -16.5%97 Moose Lake 8,729 1,033 9,762 7,428 653 8,081 (1,301) (380) (1,681) -17.2%
332 Mora 8,539 535 9,074 7,475 895 8,370 (1,064) 360 (704) -7.8%769 Morris 9,135 1,896 11,031 7,962 3,071 11,033 (1,173) 1,175 2 0.0%621 Mounds View 8,962 1,641 10,603 8,035 3,755 11,790 (927) 2,115 1,187 11.2%712 Mountain Iron-Buhl 9,249 961 10,210 8,679 1,203 9,882 (570) 242 (329) -3.2%173 Mountain Lake 10,122 548 10,670 8,494 1,444 9,938 (1,628) 896 (731) -6.9%2169 Murray County Central 9,386 1,139 10,525 8,231 2,311 10,542 (1,155) 1,172 17 0.2%2168 N.R.H.E.G. 8,727 1,026 9,754 7,618 1,356 8,974 (1,109) 330 (779) -8.0%319 Nashwauk-Keewatin 10,525 152 10,677 9,141 1,235 10,376 (1,384) 1,083 (301) -2.8%707 Nett Lake 13,976 14 13,990 11,328 450 11,778 (2,648) 436 (2,212) -15.8%308 Nevis 9,647 971 10,619 8,198 1,155 9,352 (1,450) 183 (1,266) -11.9%345 New London-Spicer 8,454 1,262 9,716 7,302 2,301 9,603 (1,153) 1,039 (114) -1.2%721 New Prague Area 8,624 1,188 9,813 7,083 2,735 9,818 (1,541) 1,546 5 0.1%88 New Ulm-Hanska 9,149 1,099 10,248 7,662 2,200 9,862 (1,487) 1,101 (386) -3.8%
553 New York Mills 9,267 952 10,219 7,620 1,244 8,864 (1,647) 292 (1,355) -13.3%507 Nicollet 9,592 2,619 12,210 7,512 2,733 10,245 (2,080) 115 (1,965) -16.1%2215 Norman County East 10,711 1,280 11,991 9,822 2,437 12,259 (890) 1,157 268 2.2%2527 Norman County West 11,174 904 12,077 9,651 1,670 11,321 (1,523) 766 (757) -6.3%138 North Branch 8,517 1,167 9,684 7,601 1,685 9,285 (917) 518 (399) -4.1%622 North St. Paul-Maplewood 8,967 1,125 10,092 8,572 3,136 11,708 (395) 2,010 1,616 16.0%659 Northfield 8,767 1,484 10,252 7,493 3,484 10,978 (1,274) 2,000 726 7.1%118 Northland Community 11,967 371 12,338 11,559 1,681 13,239 (408) 1,310 901 7.3%108 Norwood Young America 9,371 1,261 10,632 7,710 2,031 9,741 (1,660) 770 (891) -8.4%333 Ogilvie 9,451 979 10,431 7,920 1,782 9,702 (1,531) 802 (729) -7.0%627 Oklee 12,122 716 12,838 10,234 1,046 11,280 (1,888) 330 (1,558) -12.1%

Dist.Code District Name Aid Levy Rev. Aid Levy Rev. Aid Levy Rev.
FY 2011 Change: FY '03 to FY '11 % Change in Revenue
FY 2003
480 Onamia 10,284 1,319 11,604 10,061 2,371 12,431 (224) 1,052 828 7.1%278 Orono 8,315 2,075 10,390 6,996 3,359 10,355 (1,319) 1,284 (35) -0.3%2903 Ortonville-Bellingham 11,147 1,276 12,423 8,999 2,620 11,619 (2,148) 1,344 (804) -6.5%213 Osakis 8,927 1,485 10,413 7,421 1,839 9,260 (1,507) 354 (1,153) -11.1%279 Osseo 9,363 1,853 11,216 8,538 3,246 11,784 (824) 1,393 568 5.1%761 Owatonna 8,807 1,027 9,834 7,701 1,594 9,295 (1,106) 567 (538) -5.5%309 Park Rapids 9,448 2,033 11,481 7,874 2,834 10,708 (1,573) 801 (773) -6.7%547 Parkers Prairie 9,551 825 10,376 8,152 2,190 10,342 (1,399) 1,364 (34) -0.3%741 Paynesville 8,970 1,008 9,978 7,747 1,588 9,335 (1,223) 579 (643) -6.4%548 Pelican Rapids 8,955 47 9,003 7,670 957 8,627 (1,285) 910 (375) -4.2%186 Pequot Lakes 8,532 1,775 10,308 7,534 2,081 9,615 (998) 305 (693) -6.7%549 Perham 9,395 991 10,386 7,755 1,613 9,368 (1,640) 621 (1,018) -9.8%484 Pierz 9,237 762 9,999 8,104 1,114 9,218 (1,133) 352 (781) -7.8%116 Pillager 9,423 1,042 10,465 7,994 1,298 9,293 (1,429) 256 (1,173) -11.2%578 Pine City 8,836 660 9,496 7,815 1,986 9,800 (1,022) 1,326 304 3.2%255 Pine Island 8,014 723 8,737 6,812 1,415 8,227 (1,202) 692 (510) -5.8%25 Pine Point 11,880 0 11,880 10,851 0 10,851 (1,028) - (1,028) -8.7%
2174 Pine River-Backus 9,991 505 10,496 8,998 1,298 10,296 (993) 793 (200) -1.9%2689 Pipestone Area 9,725 1,710 11,435 8,615 2,387 11,003 (1,109) 677 (432) -3.8%2899 Plainview-Elgin-Millville 8,882 1,100 9,982 7,219 1,283 8,502 (1,663) 183 (1,480) -14.8%628 Plummer 10,774 155 10,929 9,713 1,200 10,914 (1,061) 1,046 (15) -0.1%477 Princeton 8,447 972 9,419 7,503 1,450 8,953 (944) 478 (465) -4.9%719 Prior Lake 8,465 2,084 10,549 7,106 3,633 10,740 (1,358) 1,549 191 1.8%704 Proctor 8,743 926 9,669 7,156 1,276 8,432 (1,588) 350 (1,237) -12.8%195 Randolph 8,285 2,412 10,697 6,672 1,846 8,518 (1,612) (566) (2,179) -20.4%38 Red Lake 13,240 4 13,245 11,820 20 11,840 (1,420) 15 (1,405) -10.6%
630 Red Lake Falls 10,715 905 11,621 9,896 2,163 12,059 (819) 1,257 438 3.8%2884 Red Rock Central 9,336 17 9,352 8,915 1,213 10,128 (421) 1,196 775 8.3%256 Red Wing 9,018 1,860 10,879 7,658 3,150 10,808 (1,360) 1,289 (71) -0.6%2897 Redwood Falls Area 9,084 1,078 10,162 7,961 1,973 9,934 (1,123) 895 (228) -2.2%2890 Renville County West 9,579 365 9,944 8,825 2,645 11,469 (755) 2,280 1,525 15.3%280 Richfield 9,325 2,012 11,337 8,978 3,194 12,173 (347) 1,182 835 7.4%281 Robbinsdale 9,372 2,840 12,212 8,128 4,098 12,226 (1,244) 1,258 15 0.1%535 Rochester 9,030 2,128 11,158 7,432 2,026 9,459 (1,598) (101) (1,699) -15.2%883 Rockford 9,245 1,988 11,233 7,088 2,907 9,995 (2,158) 919 (1,239) -11.0%750 ROCORI Area 8,653 815 9,469 7,299 2,115 9,414 (1,354) 1,300 (54) -0.6%682 Roseau 9,193 1,028 10,221 7,768 1,719 9,487 (1,425) 691 (733) -7.2%196 Rosemount-Apple Valley-Eagan 8,771 2,052 10,824 7,893 2,730 10,623 (878) 678 (201) -1.9%623 Roseville 8,883 2,303 11,187 7,840 2,945 10,785 (1,043) 642 (402) -3.6%850 Rothsay 9,674 295 9,969 8,293 1,734 10,027 (1,380) 1,439 58 0.6%516 Round Lake 9,937 708 10,644 8,146 1,705 9,850 (1,791) 997 (794) -7.5%485 Royalton 9,494 1,052 10,545 7,391 1,159 8,550 (2,103) 107 (1,996) -18.9%2902 RTR Public Schools 9,065 328 9,393 8,727 920 9,647 (338) 591 253 2.7%139 Rush City 8,563 1,557 10,120 7,075 2,112 9,187 (1,489) 555 (934) -9.2%239 Rushford-Peterson 9,484 660 10,144 8,247 1,259 9,506 (1,237) 599 (638) -6.3%282 Saint Anthony-New Brighton 8,372 1,973 10,345 7,278 2,676 9,955 (1,094) 704 (390) -3.8%858 Saint Charles 8,265 967 9,231 6,895 1,054 7,949 (1,370) 87 (1,283) -13.9%75 Saint Clair 10,098 1,605 11,703 6,991 2,299 9,290 (3,107) 695 (2,413) -20.6%
742 Saint Cloud 10,027 888 10,915 8,561 1,688 10,248 (1,466) 800 (667) -6.1%15 Saint Francis 8,574 1,086 9,660 7,698 2,026 9,724 (875) 939 64 0.7%
840 Saint James 9,566 439 10,005 8,527 843 9,371 (1,039) 405 (634) -6.3%2142 Saint Louis County 11,378 241 11,619 10,191 3,977 14,167 (1,187) 3,735 2,549 21.9%283 Saint Louis Park 9,458 4,129 13,587 7,814 4,105 11,919 (1,644) (24) (1,668) -12.3%885 Saint Michael-Albertville 8,255 1,273 9,528 7,327 2,461 9,788 (928) 1,188 260 2.7%625 Saint Paul 11,862 1,391 13,253 10,184 2,594 12,779 (1,678) 1,204 (474) -3.6%508 Saint Peter 9,439 442 9,881 8,233 1,021 9,255 (1,206) 579 (627) -6.3%748 Sartell 8,940 1,675 10,615 7,097 1,775 8,871 (1,844) 100 (1,744) -16.4%743 Sauk Centre 9,039 926 9,965 7,940 2,435 10,375 (1,100) 1,509 409 4.1%47 Sauk Rapids 9,527 1,343 10,870 7,804 1,847 9,651 (1,723) 504 (1,219) -11.2%

Dist.Code District Name Aid Levy Rev. Aid Levy Rev. Aid Levy Rev.
FY 2011 Change: FY '03 to FY '11 % Change in Revenue
FY 2003
820 Sebeka 9,319 64 9,382 8,763 784 9,547 (555) 720 165 1.8%720 Shakopee 8,981 1,867 10,848 7,673 2,897 10,570 (1,309) 1,030 (278) -2.6%2310 Sibley East 8,974 171 9,145 8,039 969 9,007 (935) 797 (138) -1.5%84 Sleepy Eye 9,822 840 10,662 8,645 1,332 9,977 (1,177) 492 (685) -6.4%
363 South Koochiching 13,922 796 14,719 12,617 1,797 14,414 (1,306) 1,001 (305) -2.1%6 South St. Paul 9,096 1,312 10,407 8,076 2,382 10,458 (1,020) 1,070 50 0.5%
833 South Washington 8,501 2,544 11,045 7,330 2,894 10,225 (1,171) 351 (820) -7.4%500 Southland 9,192 723 9,915 8,211 2,027 10,238 (981) 1,304 323 3.3%297 Spring Grove 9,162 1,066 10,228 7,754 1,619 9,373 (1,408) 553 (855) -8.4%16 Spring Lake Park 8,841 1,340 10,182 7,659 3,488 11,147 (1,183) 2,148 965 9.5%85 Springfield 8,596 994 9,591 8,120 1,456 9,577 (476) 462 (14) -0.1%
2170 Staples-Motley 10,206 530 10,735 8,985 1,165 10,150 (1,221) 636 (585) -5.5%2856 Stephen-Argyle Central 10,543 249 10,792 9,944 985 10,930 (599) 737 138 1.3%534 Stewartville 8,839 1,016 9,855 7,473 1,711 9,183 (1,367) 695 (672) -6.8%834 Stillwater 8,600 1,830 10,430 7,160 3,015 10,176 (1,440) 1,186 (254) -2.4%486 Swanville 10,055 463 10,518 8,328 2,269 10,597 (1,727) 1,806 79 0.7%564 Thief River Falls 9,605 938 10,543 7,937 1,514 9,451 (1,667) 576 (1,091) -10.4%2904 Tracy Area 9,826 526 10,352 8,360 1,156 9,516 (1,466) 630 (836) -8.1%2358 Tri-County 12,269 121 12,390 10,738 820 11,558 (1,531) 698 (832) -6.7%2125 Triton 8,800 1,081 9,881 7,858 1,743 9,601 (942) 662 (280) -2.8%458 Truman 9,866 413 10,279 9,004 2,140 11,144 (862) 1,727 865 8.4%914 Ulen-Hitterdal 10,999 2,590 13,589 8,208 3,669 11,877 (2,791) 1,080 (1,711) -12.6%550 Underwood 9,206 1,260 10,466 7,370 1,579 8,949 (1,835) 319 (1,516) -14.5%2134 United South Central 9,771 330 10,101 9,022 1,384 10,406 (749) 1,053 305 3.0%487 Upsala 9,192 1,400 10,593 8,058 2,285 10,343 (1,134) 885 (250) -2.4%818 Verndale 10,289 556 10,846 8,624 745 9,369 (1,665) 189 (1,476) -13.6%706 Virginia 9,147 715 9,861 8,083 1,169 9,252 (1,064) 454 (609) -6.2%811 Wabasha-Kellogg 9,104 963 10,067 7,546 2,776 10,321 (1,559) 1,813 254 2.5%640 Wabasso 9,174 1,244 10,418 8,124 1,872 9,995 (1,051) 628 (423) -4.1%110 Waconia 9,128 1,799 10,927 7,217 2,795 10,013 (1,911) 996 (915) -8.4%2155 Wadena-Deer Creek 9,784 736 10,520 8,546 1,774 10,320 (1,238) 1,038 (200) -1.9%113 Walker-Hackensack-Akeley 10,089 1,768 11,857 8,346 1,765 10,110 (1,744) (3) (1,747) -14.7%2176 Warren-Alvarado-Oslo 11,497 505 12,002 9,773 1,535 11,308 (1,724) 1,030 (694) -5.8%690 Warroad 9,596 1,113 10,709 8,244 1,808 10,052 (1,352) 694 (658) -6.1%829 Waseca 9,151 844 9,994 7,937 1,001 8,938 (1,214) 158 (1,056) -10.6%111 Watertown-Mayer 8,790 1,010 9,799 7,504 3,034 10,539 (1,286) 2,025 739 7.5%2143 Waterville-Elysian-Morristw. 8,795 44 8,838 7,650 1,985 9,635 (1,144) 1,941 797 9.0%435 Waubun 11,296 1,316 12,613 9,246 1,532 10,777 (2,051) 215 (1,835) -14.6%284 Wayzata 8,246 2,949 11,195 7,167 3,340 10,507 (1,079) 390 (688) -6.1%2342 West Central Area 9,399 1,070 10,469 7,735 2,058 9,792 (1,665) 988 (677) -6.5%197 West Saint Paul 9,042 2,135 11,177 7,885 3,723 11,608 (1,157) 1,588 431 3.9%2898 Westbrook-Walnut Grove 9,917 156 10,073 9,453 775 10,228 (464) 619 155 1.5%277 Westonka 8,765 2,680 11,445 7,514 3,007 10,521 (1,250) 327 (924) -8.1%803 Wheaton Area 10,056 672 10,728 8,638 901 9,539 (1,418) 229 (1,190) -11.1%624 White Bear Lake 8,991 1,592 10,583 7,405 2,949 10,354 (1,585) 1,356 (229) -2.2%347 Willmar 10,159 1,385 11,544 8,717 1,551 10,269 (1,441) 166 (1,275) -11.0%577 Willow River 10,083 1,734 11,818 7,955 1,264 9,219 (2,129) (471) (2,599) -22.0%177 Windom 10,342 1,691 12,033 8,429 2,629 11,058 (1,913) 939 (975) -8.1%2609 Win-E-Mac 9,328 1,223 10,551 8,241 2,270 10,511 (1,087) 1,047 (40) -0.4%861 Winona Area Public 9,942 1,587 11,529 8,257 3,175 11,432 (1,685) 1,588 (97) -0.8%518 Worthington 9,995 1,024 11,018 9,298 1,894 11,191 (697) 870 173 1.6%100 Wrenshall 8,880 1,288 10,168 7,483 2,034 9,517 (1,397) 746 (651) -6.4%2190 Yellow Medicine East 9,847 570 10,418 8,961 1,517 10,478 (886) 946 60 0.6%2805 Zumbrota-Mazeppa 9,017 702 9,719 7,280 1,997 9,277 (1,738) 1,295 (443) -4.6%
9,464 1,557 11,021 8,145 2,433 10,578 (1,319) 876 (443) -4.0%
Minnesota 2020, 10/5/10 C:\work\123\schools\School Levy-Aid-Rev\[School Feb 10 + Debt Service.xls]Cons FY 11
State Total

State Aid: -13.9%Levy: 56.3%
Revenue: -4.0%
Percent Change from FY 2003 to FY 2011 (real per pupil dollars):
*Change since FY 2003 in per pupil operating and debt service levy, aid, and revenue in constant FY 2011 dollars.
Change in Per Pupil Funding Since FY 2003State Total*
$(1,500)
$(1,000)
$(500)
$-
$500
$1,000
2003 2004 2005 2006 2007 2008 2009 2010 2011Fiscal Year (FY)
Cha
nge
Sinc
e FY
200
3
LevyRevenueState Aid
Minnesota 2020 - www.mn2020.org Page 14

State Aid: -10.3%Levy: 122.0%
Revenue: -6.9%
Percent Change from FY 2003 to FY 2011 (real per pupil dollars):
*Change since FY 2003 in per pupil operating and debt service levy, aid, and revenue in constant FY 2011 dollars.
Change in Per Pupil Funding Since FY 2003Ada-Borup School District*
$(1,200)
$(1,000)
$(800)
$(600)
$(400)
$(200)
$-
$200
$400
2003 2004 2005 2006 2007 2008 2009 2010 2011Fiscal Year (FY)
Cha
nge
Sinc
e FY
200
3 LevyRevenueState Aid
Minnesota 2020 - www.mn2020.org Page 15

State Aid: -8.6%Levy: 89.0%
Revenue: 2.1%
Percent Change from FY 2003 to FY 2011 (real per pupil dollars):
*Change since FY 2003 in per pupil operating and debt service levy, aid, and revenue in constant FY 2011 dollars.
Change in Per Pupil Funding Since FY 2003Adrian School District*
$(1,500)
$(1,000)
$(500)
$-
$500
$1,000
$1,500
2003 2004 2005 2006 2007 2008 2009 2010 2011Fiscal Year (FY)
Cha
nge
Sinc
e FY
200
3
LevyRevenueState Aid
Minnesota 2020 - www.mn2020.org Page 16
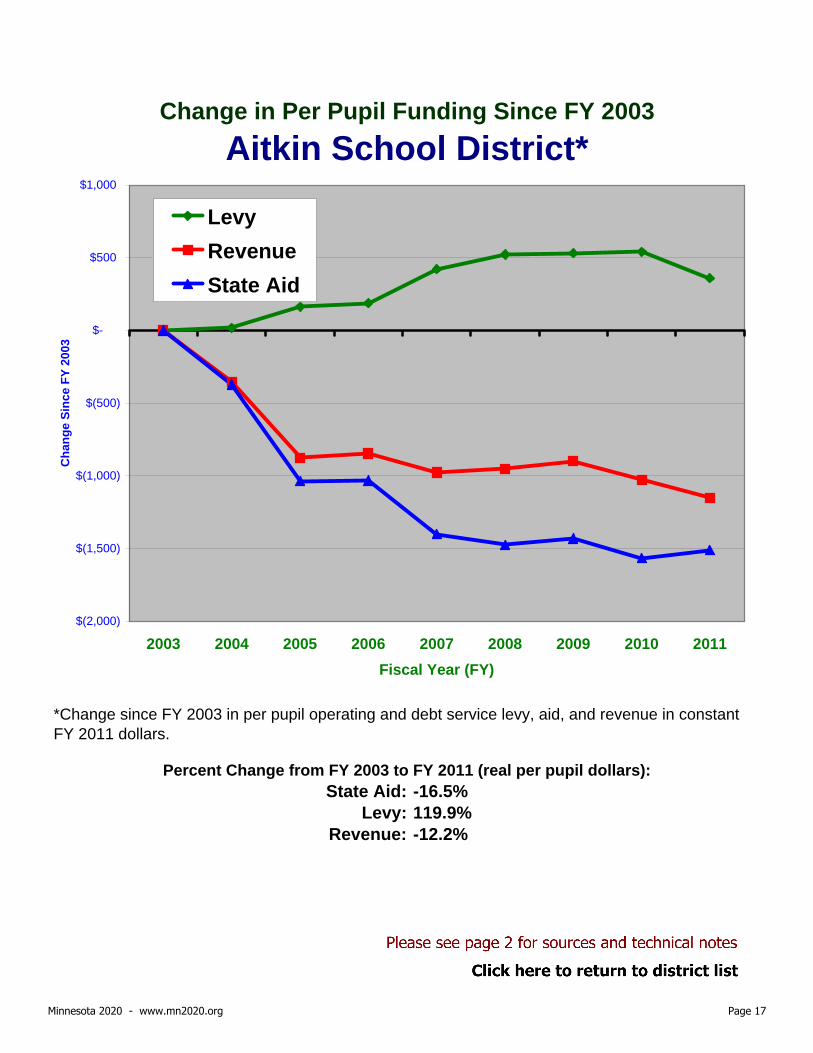
State Aid: -16.5%Levy: 119.9%
Revenue: -12.2%
Percent Change from FY 2003 to FY 2011 (real per pupil dollars):
*Change since FY 2003 in per pupil operating and debt service levy, aid, and revenue in constant FY 2011 dollars.
Change in Per Pupil Funding Since FY 2003Aitkin School District*
$(2,000)
$(1,500)
$(1,000)
$(500)
$-
$500
$1,000
2003 2004 2005 2006 2007 2008 2009 2010 2011Fiscal Year (FY)
Cha
nge
Sinc
e FY
200
3
LevyRevenueState Aid
Minnesota 2020 - www.mn2020.org Page 17
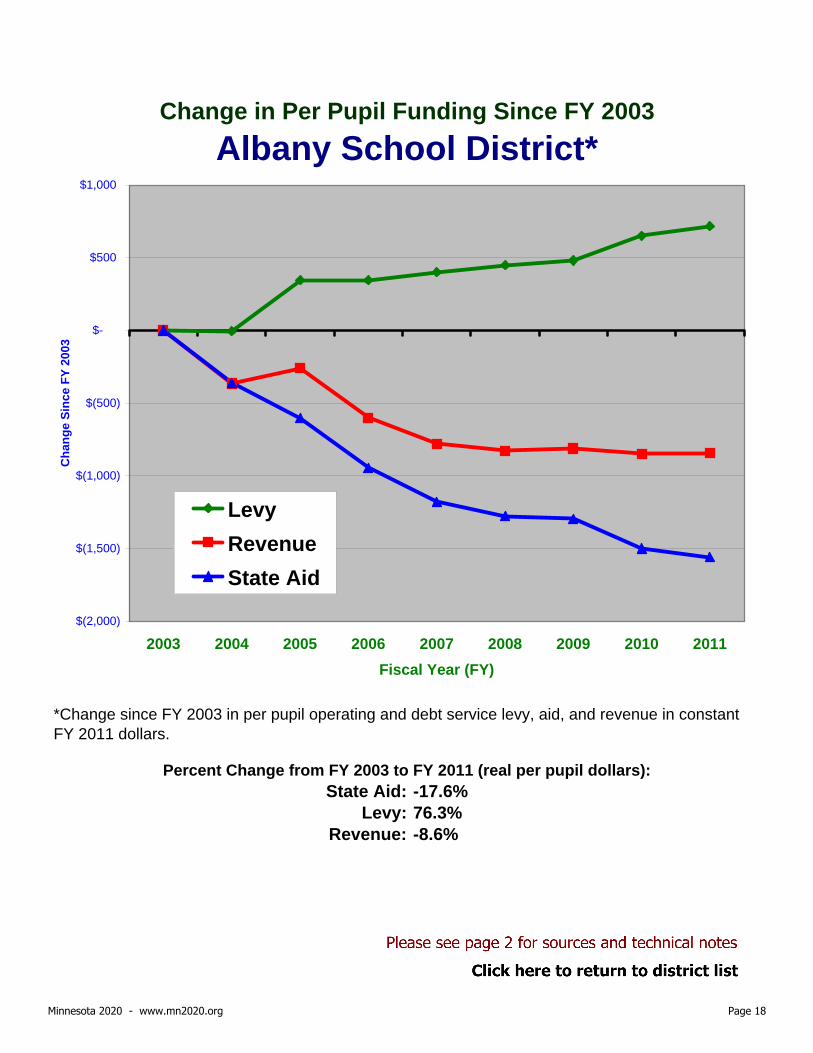
State Aid: -17.6%Levy: 76.3%
Revenue: -8.6%
Percent Change from FY 2003 to FY 2011 (real per pupil dollars):
*Change since FY 2003 in per pupil operating and debt service levy, aid, and revenue in constant FY 2011 dollars.
Change in Per Pupil Funding Since FY 2003Albany School District*
$(2,000)
$(1,500)
$(1,000)
$(500)
$-
$500
$1,000
2003 2004 2005 2006 2007 2008 2009 2010 2011Fiscal Year (FY)
Cha
nge
Sinc
e FY
200
3
LevyRevenueState Aid
Minnesota 2020 - www.mn2020.org Page 18

State Aid: -7.2%Levy: 89.6%
Revenue: 3.5%
Percent Change from FY 2003 to FY 2011 (real per pupil dollars):
*Change since FY 2003 in per pupil operating and debt service levy, aid, and revenue in constant FY 2011 dollars.
Change in Per Pupil Funding Since FY 2003Albert Lea School District*
$(1,000)
$(500)
$-
$500
$1,000
$1,500
2003 2004 2005 2006 2007 2008 2009 2010 2011Fiscal Year (FY)
Cha
nge
Sinc
e FY
200
3
LevyRevenueState Aid
Minnesota 2020 - www.mn2020.org Page 19
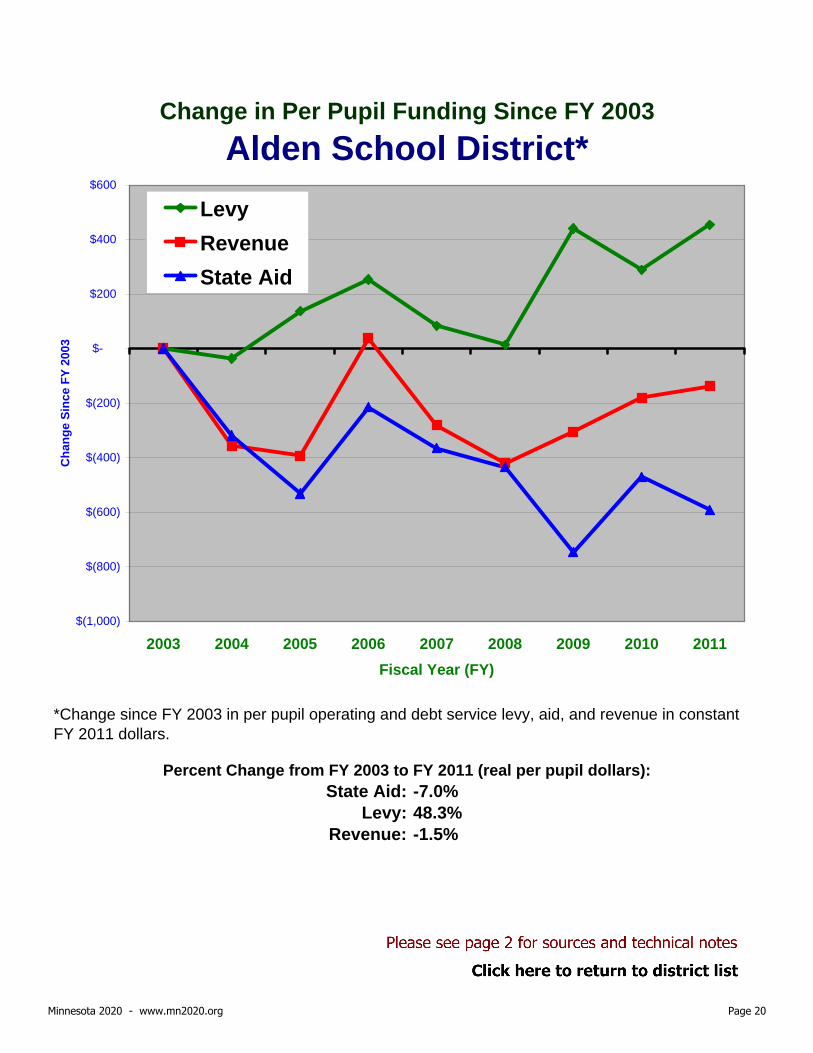
State Aid: -7.0%Levy: 48.3%
Revenue: -1.5%
Percent Change from FY 2003 to FY 2011 (real per pupil dollars):
*Change since FY 2003 in per pupil operating and debt service levy, aid, and revenue in constant FY 2011 dollars.
Change in Per Pupil Funding Since FY 2003Alden School District*
$(1,000)
$(800)
$(600)
$(400)
$(200)
$-
$200
$400
$600
2003 2004 2005 2006 2007 2008 2009 2010 2011Fiscal Year (FY)
Cha
nge
Sinc
e FY
200
3
LevyRevenueState Aid
Minnesota 2020 - www.mn2020.org Page 20

State Aid: -16.0%Levy: 137.6%
Revenue: -5.0%
Percent Change from FY 2003 to FY 2011 (real per pupil dollars):
*Change since FY 2003 in per pupil operating and debt service levy, aid, and revenue in constant FY 2011 dollars.
Change in Per Pupil Funding Since FY 2003Alexandria School District*
$(2,000)
$(1,500)
$(1,000)
$(500)
$-
$500
$1,000
$1,500
2003 2004 2005 2006 2007 2008 2009 2010 2011Fiscal Year (FY)
Cha
nge
Sinc
e FY
200
3
LevyRevenueState Aid
Minnesota 2020 - www.mn2020.org Page 21

State Aid: -15.1%Levy: 50.2%
Revenue: -8.6%
Percent Change from FY 2003 to FY 2011 (real per pupil dollars):
*Change since FY 2003 in per pupil operating and debt service levy, aid, and revenue in constant FY 2011 dollars.
Change in Per Pupil Funding Since FY 2003Annandale School District*
$(2,000)
$(1,500)
$(1,000)
$(500)
$-
$500
$1,000
2003 2004 2005 2006 2007 2008 2009 2010 2011Fiscal Year (FY)
Cha
nge
Sinc
e FY
200
3
LevyRevenueState Aid
Minnesota 2020 - www.mn2020.org Page 22

State Aid: -10.7%Levy: 95.0%
Revenue: 2.3%
Percent Change from FY 2003 to FY 2011 (real per pupil dollars):
*Change since FY 2003 in per pupil operating and debt service levy, aid, and revenue in constant FY 2011 dollars.
Change in Per Pupil Funding Since FY 2003Anoka-Hennepin School District*
$(1,500)
$(1,000)
$(500)
$-
$500
$1,000
$1,500
2003 2004 2005 2006 2007 2008 2009 2010 2011Fiscal Year (FY)
Cha
nge
Sinc
e FY
200
3
LevyRevenueState Aid
Minnesota 2020 - www.mn2020.org Page 23

State Aid: -23.7%Levy: 143.2%
Revenue: -1.1%
Percent Change from FY 2003 to FY 2011 (real per pupil dollars):
*Change since FY 2003 in per pupil operating and debt service levy, aid, and revenue in constant FY 2011 dollars.
Change in Per Pupil Funding Since FY 2003Ashby School District*
$(3,000)
$(2,000)
$(1,000)
$-
$1,000
$2,000
$3,000
2003 2004 2005 2006 2007 2008 2009 2010 2011Fiscal Year (FY)
Cha
nge
Sinc
e FY
200
3
LevyRevenueState Aid
Minnesota 2020 - www.mn2020.org Page 24

State Aid: -14.2%Levy: 101.6%
Revenue: 1.0%
Percent Change from FY 2003 to FY 2011 (real per pupil dollars):
*Change since FY 2003 in per pupil operating and debt service levy, aid, and revenue in constant FY 2011 dollars.
Change in Per Pupil Funding Since FY 2003Atwater-Cosmos-Grove City School District*
$(2,000)
$(1,500)
$(1,000)
$(500)
$-
$500
$1,000
$1,500
$2,000
2003 2004 2005 2006 2007 2008 2009 2010 2011Fiscal Year (FY)
Cha
nge
Sinc
e FY
200
3
LevyRevenueState Aid
Minnesota 2020 - www.mn2020.org Page 25

State Aid: -7.8%Levy: 65.7%
Revenue: -2.3%
Percent Change from FY 2003 to FY 2011 (real per pupil dollars):
*Change since FY 2003 in per pupil operating and debt service levy, aid, and revenue in constant FY 2011 dollars.
Change in Per Pupil Funding Since FY 2003Austin School District*
$(1,000)
$(800)
$(600)
$(400)
$(200)
$-
$200
$400
$600
2003 2004 2005 2006 2007 2008 2009 2010 2011Fiscal Year (FY)
Cha
nge
Sinc
e FY
200
3
LevyRevenueState Aid
Minnesota 2020 - www.mn2020.org Page 26

State Aid: -13.1%Levy: 42.0%
Revenue: -9.2%
Percent Change from FY 2003 to FY 2011 (real per pupil dollars):
*Change since FY 2003 in per pupil operating and debt service levy, aid, and revenue in constant FY 2011 dollars.
Change in Per Pupil Funding Since FY 2003Badger School District*
$(1,600)
$(1,400)
$(1,200)
$(1,000)
$(800)
$(600)
$(400)
$(200)
$-
$200
$400
$600
2003 2004 2005 2006 2007 2008 2009 2010 2011Fiscal Year (FY)
Cha
nge
Sinc
e FY
200
3
LevyRevenueState Aid
Minnesota 2020 - www.mn2020.org Page 27
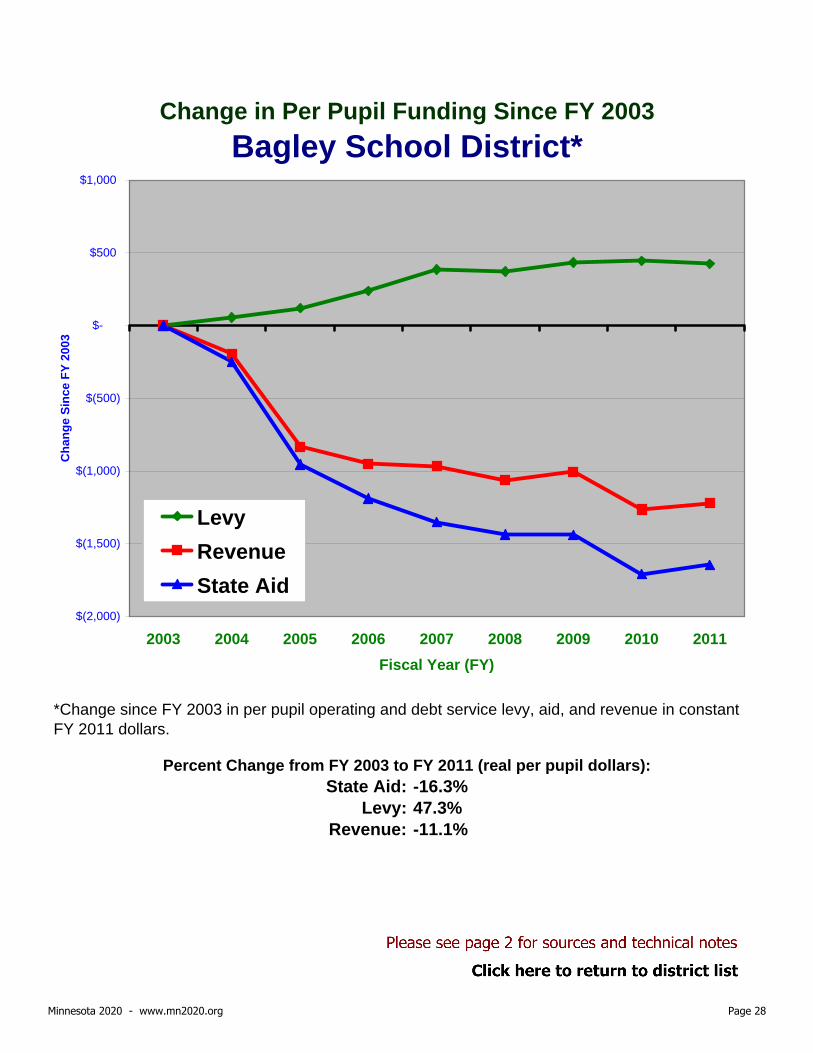
State Aid: -16.3%Levy: 47.3%
Revenue: -11.1%
Percent Change from FY 2003 to FY 2011 (real per pupil dollars):
*Change since FY 2003 in per pupil operating and debt service levy, aid, and revenue in constant FY 2011 dollars.
Change in Per Pupil Funding Since FY 2003Bagley School District*
$(2,000)
$(1,500)
$(1,000)
$(500)
$-
$500
$1,000
2003 2004 2005 2006 2007 2008 2009 2010 2011Fiscal Year (FY)
Cha
nge
Sinc
e FY
200
3
LevyRevenueState Aid
Minnesota 2020 - www.mn2020.org Page 28

State Aid: -13.7%Levy: 3.7%
Revenue: -12.0%
Percent Change from FY 2003 to FY 2011 (real per pupil dollars):
*Change since FY 2003 in per pupil operating and debt service levy, aid, and revenue in constant FY 2011 dollars.
Change in Per Pupil Funding Since FY 2003Barnesville School District*
$(1,400)
$(1,200)
$(1,000)
$(800)
$(600)
$(400)
$(200)
$-
$200
$400
$600
2003 2004 2005 2006 2007 2008 2009 2010 2011Fiscal Year (FY)
Cha
nge
Sinc
e FY
200
3
LevyRevenueState Aid
Minnesota 2020 - www.mn2020.org Page 29

State Aid: -16.2%Levy: 62.6%
Revenue: -5.6%
Percent Change from FY 2003 to FY 2011 (real per pupil dollars):
*Change since FY 2003 in per pupil operating and debt service levy, aid, and revenue in constant FY 2011 dollars.
Change in Per Pupil Funding Since FY 2003Barnum School District*
$(2,000)
$(1,500)
$(1,000)
$(500)
$-
$500
$1,000
$1,500
2003 2004 2005 2006 2007 2008 2009 2010 2011Fiscal Year (FY)
Cha
nge
Sinc
e FY
200
3
LevyRevenueState Aid
Minnesota 2020 - www.mn2020.org Page 30
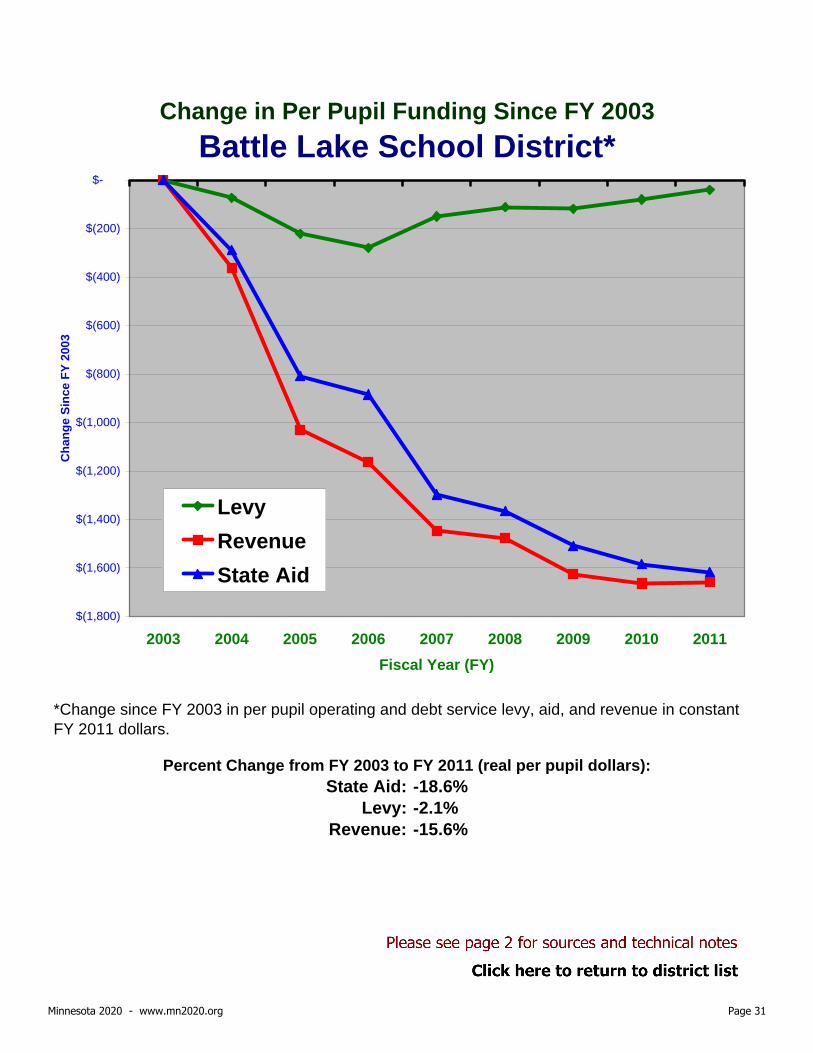
State Aid: -18.6%Levy: -2.1%
Revenue: -15.6%
Percent Change from FY 2003 to FY 2011 (real per pupil dollars):
*Change since FY 2003 in per pupil operating and debt service levy, aid, and revenue in constant FY 2011 dollars.
Change in Per Pupil Funding Since FY 2003Battle Lake School District*
$(1,800)
$(1,600)
$(1,400)
$(1,200)
$(1,000)
$(800)
$(600)
$(400)
$(200)
$-
2003 2004 2005 2006 2007 2008 2009 2010 2011Fiscal Year (FY)
Cha
nge
Sinc
e FY
200
3
LevyRevenueState Aid
Minnesota 2020 - www.mn2020.org Page 31

State Aid: -14.6%Levy: -29.0%
Revenue: -18.7%
Percent Change from FY 2003 to FY 2011 (real per pupil dollars):
*Change since FY 2003 in per pupil operating and debt service levy, aid, and revenue in constant FY 2011 dollars.
Change in Per Pupil Funding Since FY 2003Becker School District*
$(2,500)
$(2,000)
$(1,500)
$(1,000)
$(500)
$-
2003 2004 2005 2006 2007 2008 2009 2010 2011Fiscal Year (FY)
Cha
nge
Sinc
e FY
200
3
LevyRevenueState Aid
Minnesota 2020 - www.mn2020.org Page 32

State Aid: -19.2%Levy: 77.2%
Revenue: -7.3%
Percent Change from FY 2003 to FY 2011 (real per pupil dollars):
*Change since FY 2003 in per pupil operating and debt service levy, aid, and revenue in constant FY 2011 dollars.
Change in Per Pupil Funding Since FY 2003Belgrade-Brooten-Elrosa School District*
$(2,500)
$(2,000)
$(1,500)
$(1,000)
$(500)
$-
$500
$1,000
$1,500
2003 2004 2005 2006 2007 2008 2009 2010 2011Fiscal Year (FY)
Cha
nge
Sinc
e FY
200
3
LevyRevenueState Aid
Minnesota 2020 - www.mn2020.org Page 33

State Aid: -12.1%Levy: 362.7%
Revenue: 14.6%
Percent Change from FY 2003 to FY 2011 (real per pupil dollars):
*Change since FY 2003 in per pupil operating and debt service levy, aid, and revenue in constant FY 2011 dollars.
Change in Per Pupil Funding Since FY 2003Belle Plaine School District*
$(1,500)
$(1,000)
$(500)
$-
$500
$1,000
$1,500
$2,000
$2,500
$3,000
2003 2004 2005 2006 2007 2008 2009 2010 2011Fiscal Year (FY)
Cha
nge
Sinc
e FY
200
3
LevyRevenueState Aid
Minnesota 2020 - www.mn2020.org Page 34

State Aid: -13.8%Levy: 28.4%
Revenue: -8.9%
Percent Change from FY 2003 to FY 2011 (real per pupil dollars):
*Change since FY 2003 in per pupil operating and debt service levy, aid, and revenue in constant FY 2011 dollars.
Change in Per Pupil Funding Since FY 2003Bemidji School District*
$(1,500)
$(1,000)
$(500)
$-
$500
$1,000
2003 2004 2005 2006 2007 2008 2009 2010 2011Fiscal Year (FY)
Cha
nge
Sinc
e FY
200
3
LevyRevenueState Aid
Minnesota 2020 - www.mn2020.org Page 35

State Aid: -11.5%Levy: 67.3%
Revenue: -6.3%
Percent Change from FY 2003 to FY 2011 (real per pupil dollars):
*Change since FY 2003 in per pupil operating and debt service levy, aid, and revenue in constant FY 2011 dollars.
Change in Per Pupil Funding Since FY 2003Benson School District*
$(1,200)
$(1,000)
$(800)
$(600)
$(400)
$(200)
$-
$200
$400
$600
2003 2004 2005 2006 2007 2008 2009 2010 2011Fiscal Year (FY)
Cha
nge
Sinc
e FY
200
3
LevyRevenueState Aid
Minnesota 2020 - www.mn2020.org Page 36

State Aid: -12.7%Levy: 115.2%
Revenue: -4.6%
Percent Change from FY 2003 to FY 2011 (real per pupil dollars):
*Change since FY 2003 in per pupil operating and debt service levy, aid, and revenue in constant FY 2011 dollars.
Change in Per Pupil Funding Since FY 2003Bertha-Hewitt School District*
$(1,500)
$(1,000)
$(500)
$-
$500
$1,000
2003 2004 2005 2006 2007 2008 2009 2010 2011Fiscal Year (FY)
Cha
nge
Sinc
e FY
200
3
LevyRevenueState Aid
Minnesota 2020 - www.mn2020.org Page 37

State Aid: -10.7%Levy: 55.7%
Revenue: -2.1%
Percent Change from FY 2003 to FY 2011 (real per pupil dollars):
*Change since FY 2003 in per pupil operating and debt service levy, aid, and revenue in constant FY 2011 dollars.
Change in Per Pupil Funding Since FY 2003Big Lake School District*
$(1,200)
$(1,000)
$(800)
$(600)
$(400)
$(200)
$-
$200
$400
$600
$800
2003 2004 2005 2006 2007 2008 2009 2010 2011Fiscal Year (FY)
Cha
nge
Sinc
e FY
200
3
LevyRevenueState Aid
Minnesota 2020 - www.mn2020.org Page 38

State Aid: -15.9%Levy: 70.8%
Revenue: -8.0%
Percent Change from FY 2003 to FY 2011 (real per pupil dollars):
*Change since FY 2003 in per pupil operating and debt service levy, aid, and revenue in constant FY 2011 dollars.
Change in Per Pupil Funding Since FY 2003Bird Is.-Olivia-Lake Lillian School District*
$(2,000)
$(1,500)
$(1,000)
$(500)
$-
$500
$1,000
2003 2004 2005 2006 2007 2008 2009 2010 2011Fiscal Year (FY)
Cha
nge
Sinc
e FY
200
3
LevyRevenueState Aid
Minnesota 2020 - www.mn2020.org Page 39

State Aid: -10.7%Levy: 61.4%
Revenue: -5.6%
Percent Change from FY 2003 to FY 2011 (real per pupil dollars):
*Change since FY 2003 in per pupil operating and debt service levy, aid, and revenue in constant FY 2011 dollars.
Change in Per Pupil Funding Since FY 2003Blackduck School District*
$(1,600)
$(1,400)
$(1,200)
$(1,000)
$(800)
$(600)
$(400)
$(200)
$-
$200
$400
$600
2003 2004 2005 2006 2007 2008 2009 2010 2011Fiscal Year (FY)
Cha
nge
Sinc
e FY
200
3
LevyRevenueState Aid
Minnesota 2020 - www.mn2020.org Page 40

State Aid: -14.3%Levy: 274.8%
Revenue: 7.3%
Percent Change from FY 2003 to FY 2011 (real per pupil dollars):
*Change since FY 2003 in per pupil operating and debt service levy, aid, and revenue in constant FY 2011 dollars.
Change in Per Pupil Funding Since FY 2003Blooming Prairie School District*
$(2,000)
$(1,500)
$(1,000)
$(500)
$-
$500
$1,000
$1,500
$2,000
$2,500
2003 2004 2005 2006 2007 2008 2009 2010 2011Fiscal Year (FY)
Cha
nge
Sinc
e FY
200
3
LevyRevenueState Aid
Minnesota 2020 - www.mn2020.org Page 41

State Aid: -13.7%Levy: 27.4%
Revenue: -4.3%
Percent Change from FY 2003 to FY 2011 (real per pupil dollars):
*Change since FY 2003 in per pupil operating and debt service levy, aid, and revenue in constant FY 2011 dollars.
Change in Per Pupil Funding Since FY 2003Bloomington School District*
$(1,500)
$(1,000)
$(500)
$-
$500
$1,000
2003 2004 2005 2006 2007 2008 2009 2010 2011Fiscal Year (FY)
Cha
nge
Sinc
e FY
200
3
LevyRevenueState Aid
Minnesota 2020 - www.mn2020.org Page 42

State Aid: -9.5%Levy: 222.6%
Revenue: -2.2%
Percent Change from FY 2003 to FY 2011 (real per pupil dollars):
*Change since FY 2003 in per pupil operating and debt service levy, aid, and revenue in constant FY 2011 dollars.
Change in Per Pupil Funding Since FY 2003Blue Earth Area School District*
$(1,000)
$(800)
$(600)
$(400)
$(200)
$-
$200
$400
$600
$800
2003 2004 2005 2006 2007 2008 2009 2010 2011Fiscal Year (FY)
Cha
nge
Sinc
e FY
200
3
LevyRevenueState Aid
Minnesota 2020 - www.mn2020.org Page 43

State Aid: -14.2%Levy: 49.6%
Revenue: -7.0%
Percent Change from FY 2003 to FY 2011 (real per pupil dollars):
*Change since FY 2003 in per pupil operating and debt service levy, aid, and revenue in constant FY 2011 dollars.
Change in Per Pupil Funding Since FY 2003Braham School District*
$(2,000)
$(1,500)
$(1,000)
$(500)
$-
$500
$1,000
2003 2004 2005 2006 2007 2008 2009 2010 2011Fiscal Year (FY)
Cha
nge
Sinc
e FY
200
3
LevyRevenueState Aid
Minnesota 2020 - www.mn2020.org Page 44

State Aid: -14.9%Levy: 42.5%
Revenue: -7.7%
Percent Change from FY 2003 to FY 2011 (real per pupil dollars):
*Change since FY 2003 in per pupil operating and debt service levy, aid, and revenue in constant FY 2011 dollars.
Change in Per Pupil Funding Since FY 2003Brainerd School District*
$(2,000)
$(1,500)
$(1,000)
$(500)
$-
$500
$1,000
2003 2004 2005 2006 2007 2008 2009 2010 2011Fiscal Year (FY)
Cha
nge
Sinc
e FY
200
3
LevyRevenueState Aid
Minnesota 2020 - www.mn2020.org Page 45

State Aid: -15.3%Levy: 1531.2%
Revenue: -1.1%
Percent Change from FY 2003 to FY 2011 (real per pupil dollars):
*Change since FY 2003 in per pupil operating and debt service levy, aid, and revenue in constant FY 2011 dollars.
Change in Per Pupil Funding Since FY 2003Brandon School District*
$(1,500)
$(1,000)
$(500)
$-
$500
$1,000
$1,500
2003 2004 2005 2006 2007 2008 2009 2010 2011Fiscal Year (FY)
Cha
nge
Sinc
e FY
200
3
LevyRevenueState Aid
Minnesota 2020 - www.mn2020.org Page 46

State Aid: -7.3%Levy: 132.4%
Revenue: -0.1%
Percent Change from FY 2003 to FY 2011 (real per pupil dollars):
*Change since FY 2003 in per pupil operating and debt service levy, aid, and revenue in constant FY 2011 dollars.
Change in Per Pupil Funding Since FY 2003Breckenridge School District*
$(1,400)
$(1,200)
$(1,000)
$(800)
$(600)
$(400)
$(200)
$-
$200
$400
$600
$800
2003 2004 2005 2006 2007 2008 2009 2010 2011Fiscal Year (FY)
Cha
nge
Sinc
e FY
200
3
LevyRevenueState Aid
Minnesota 2020 - www.mn2020.org Page 47
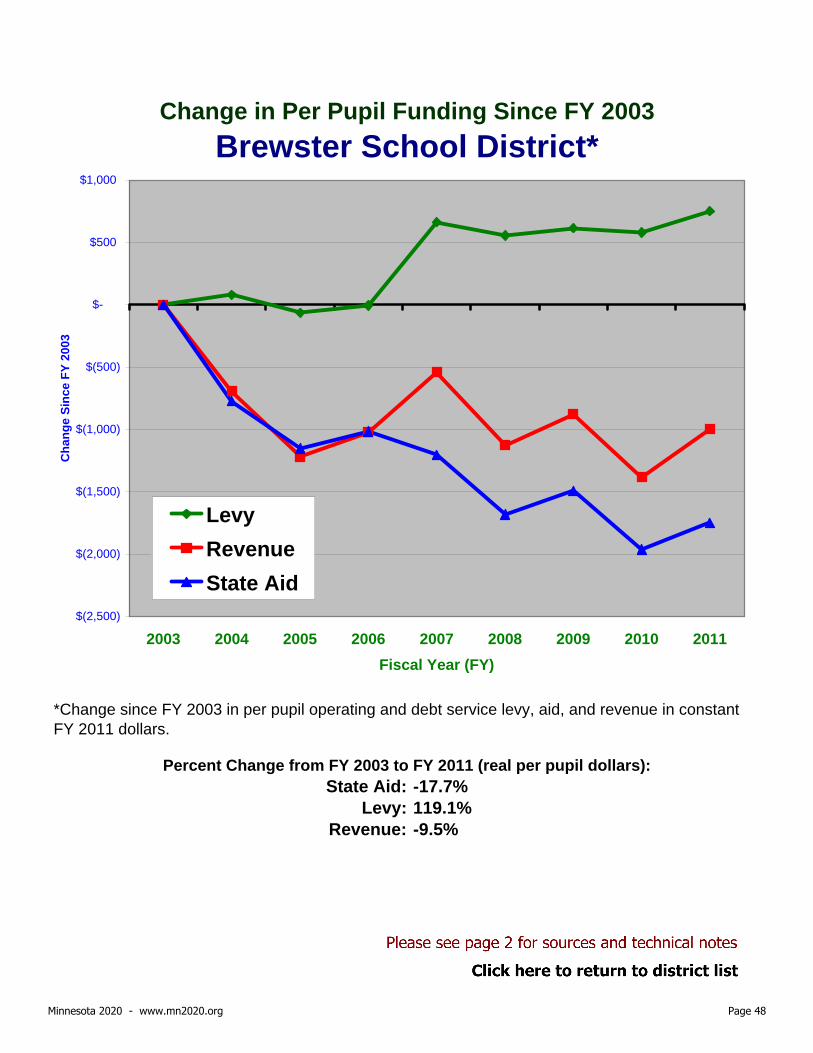
State Aid: -17.7%Levy: 119.1%
Revenue: -9.5%
Percent Change from FY 2003 to FY 2011 (real per pupil dollars):
*Change since FY 2003 in per pupil operating and debt service levy, aid, and revenue in constant FY 2011 dollars.
Change in Per Pupil Funding Since FY 2003Brewster School District*
$(2,500)
$(2,000)
$(1,500)
$(1,000)
$(500)
$-
$500
$1,000
2003 2004 2005 2006 2007 2008 2009 2010 2011Fiscal Year (FY)
Cha
nge
Sinc
e FY
200
3
LevyRevenueState Aid
Minnesota 2020 - www.mn2020.org Page 48

State Aid: -5.7%Levy: -14.6%
Revenue: -7.3%
Percent Change from FY 2003 to FY 2011 (real per pupil dollars):
*Change since FY 2003 in per pupil operating and debt service levy, aid, and revenue in constant FY 2011 dollars.
Change in Per Pupil Funding Since FY 2003Brooklyn Center School District*
$(1,200)
$(1,000)
$(800)
$(600)
$(400)
$(200)
$-
$200
$400
2003 2004 2005 2006 2007 2008 2009 2010 2011Fiscal Year (FY)
Cha
nge
Sinc
e FY
200
3
LevyRevenueState Aid
Minnesota 2020 - www.mn2020.org Page 49

State Aid: -9.2%Levy: 611.1%
Revenue: -1.6%
Percent Change from FY 2003 to FY 2011 (real per pupil dollars):
*Change since FY 2003 in per pupil operating and debt service levy, aid, and revenue in constant FY 2011 dollars.
Change in Per Pupil Funding Since FY 2003Browerville School District*
$(1,500)
$(1,000)
$(500)
$-
$500
$1,000
2003 2004 2005 2006 2007 2008 2009 2010 2011Fiscal Year (FY)
Cha
nge
Sinc
e FY
200
3
LevyRevenueState Aid
Minnesota 2020 - www.mn2020.org Page 50

State Aid: -13.0%Levy: 29.1%
Revenue: -10.8%
Percent Change from FY 2003 to FY 2011 (real per pupil dollars):
*Change since FY 2003 in per pupil operating and debt service levy, aid, and revenue in constant FY 2011 dollars.
Change in Per Pupil Funding Since FY 2003Browns Valley School District*
$(3,000)
$(2,500)
$(2,000)
$(1,500)
$(1,000)
$(500)
$-
$500
$1,000
2003 2004 2005 2006 2007 2008 2009 2010 2011Fiscal Year (FY)
Cha
nge
Sinc
e FY
200
3
LevyRevenueState Aid
Minnesota 2020 - www.mn2020.org Page 51

State Aid: -9.1%Levy: 1914.7%
Revenue: 5.5%
Percent Change from FY 2003 to FY 2011 (real per pupil dollars):
*Change since FY 2003 in per pupil operating and debt service levy, aid, and revenue in constant FY 2011 dollars.
Change in Per Pupil Funding Since FY 2003Buffalo Lake-Hector School District*
$(1,500)
$(1,000)
$(500)
$-
$500
$1,000
$1,500
2003 2004 2005 2006 2007 2008 2009 2010 2011Fiscal Year (FY)
Cha
nge
Sinc
e FY
200
3
LevyRevenueState Aid
Minnesota 2020 - www.mn2020.org Page 52

State Aid: -14.6%Levy: 99.1%
Revenue: -2.6%
Percent Change from FY 2003 to FY 2011 (real per pupil dollars):
*Change since FY 2003 in per pupil operating and debt service levy, aid, and revenue in constant FY 2011 dollars.
Change in Per Pupil Funding Since FY 2003Buffalo School District*
$(1,500)
$(1,000)
$(500)
$-
$500
$1,000
$1,500
2003 2004 2005 2006 2007 2008 2009 2010 2011Fiscal Year (FY)
Cha
nge
Sinc
e FY
200
3
LevyRevenueState Aid
Minnesota 2020 - www.mn2020.org Page 53

State Aid: -10.0%Levy: 74.3%
Revenue: 3.7%
Percent Change from FY 2003 to FY 2011 (real per pupil dollars):
*Change since FY 2003 in per pupil operating and debt service levy, aid, and revenue in constant FY 2011 dollars.
Change in Per Pupil Funding Since FY 2003Burnsville School District*
$(1,500)
$(1,000)
$(500)
$-
$500
$1,000
$1,500
$2,000
2003 2004 2005 2006 2007 2008 2009 2010 2011Fiscal Year (FY)
Cha
nge
Sinc
e FY
200
3
LevyRevenueState Aid
Minnesota 2020 - www.mn2020.org Page 54

State Aid: 0.6%Levy: 107.6%
Revenue: 5.8%
Percent Change from FY 2003 to FY 2011 (real per pupil dollars):
*Change since FY 2003 in per pupil operating and debt service levy, aid, and revenue in constant FY 2011 dollars.
Change in Per Pupil Funding Since FY 2003Butterfield School District*
$(1,000)
$(800)
$(600)
$(400)
$(200)
$-
$200
$400
$600
$800
2003 2004 2005 2006 2007 2008 2009 2010 2011Fiscal Year (FY)
Cha
nge
Sinc
e FY
200
3
LevyRevenueState Aid
Minnesota 2020 - www.mn2020.org Page 55

State Aid: -16.7%Levy: 116.2%
Revenue: -5.0%
Percent Change from FY 2003 to FY 2011 (real per pupil dollars):
*Change since FY 2003 in per pupil operating and debt service levy, aid, and revenue in constant FY 2011 dollars.
Change in Per Pupil Funding Since FY 2003Byron School District*
$(2,000)
$(1,500)
$(1,000)
$(500)
$-
$500
$1,000
$1,500
2003 2004 2005 2006 2007 2008 2009 2010 2011Fiscal Year (FY)
Cha
nge
Sinc
e FY
200
3
LevyRevenueState Aid
Minnesota 2020 - www.mn2020.org Page 56
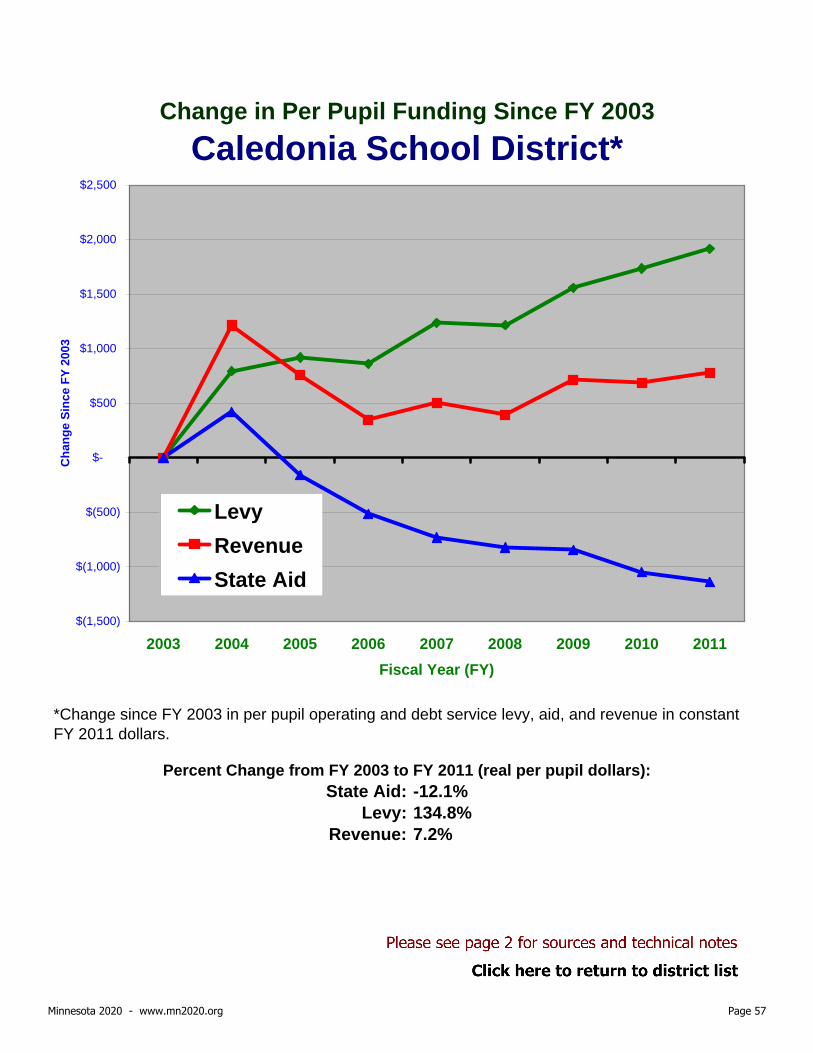
State Aid: -12.1%Levy: 134.8%
Revenue: 7.2%
Percent Change from FY 2003 to FY 2011 (real per pupil dollars):
*Change since FY 2003 in per pupil operating and debt service levy, aid, and revenue in constant FY 2011 dollars.
Change in Per Pupil Funding Since FY 2003Caledonia School District*
$(1,500)
$(1,000)
$(500)
$-
$500
$1,000
$1,500
$2,000
$2,500
2003 2004 2005 2006 2007 2008 2009 2010 2011Fiscal Year (FY)
Cha
nge
Sinc
e FY
200
3
LevyRevenueState Aid
Minnesota 2020 - www.mn2020.org Page 57

State Aid: -15.5%Levy: 122.1%
Revenue: -5.3%
Percent Change from FY 2003 to FY 2011 (real per pupil dollars):
*Change since FY 2003 in per pupil operating and debt service levy, aid, and revenue in constant FY 2011 dollars.
Change in Per Pupil Funding Since FY 2003Cambridge-Isanti School District*
$(1,500)
$(1,000)
$(500)
$-
$500
$1,000
2003 2004 2005 2006 2007 2008 2009 2010 2011Fiscal Year (FY)
Cha
nge
Sinc
e FY
200
3
LevyRevenueState Aid
Minnesota 2020 - www.mn2020.org Page 58

State Aid: -15.5%Levy: 805.4%
Revenue: 5.7%
Percent Change from FY 2003 to FY 2011 (real per pupil dollars):
*Change since FY 2003 in per pupil operating and debt service levy, aid, and revenue in constant FY 2011 dollars.
Change in Per Pupil Funding Since FY 2003Campbell-Tintah School District*
$(3,000)
$(2,000)
$(1,000)
$-
$1,000
$2,000
$3,000
2003 2004 2005 2006 2007 2008 2009 2010 2011Fiscal Year (FY)
Cha
nge
Sinc
e FY
200
3
LevyRevenueState Aid
Minnesota 2020 - www.mn2020.org Page 59

State Aid: -10.6%Levy: 73.5%
Revenue: -4.3%
Percent Change from FY 2003 to FY 2011 (real per pupil dollars):
*Change since FY 2003 in per pupil operating and debt service levy, aid, and revenue in constant FY 2011 dollars.
Change in Per Pupil Funding Since FY 2003Canby School District*
$(1,400)
$(1,200)
$(1,000)
$(800)
$(600)
$(400)
$(200)
$-
$200
$400
$600
$800
2003 2004 2005 2006 2007 2008 2009 2010 2011Fiscal Year (FY)
Cha
nge
Sinc
e FY
200
3
LevyRevenueState Aid
Minnesota 2020 - www.mn2020.org Page 60
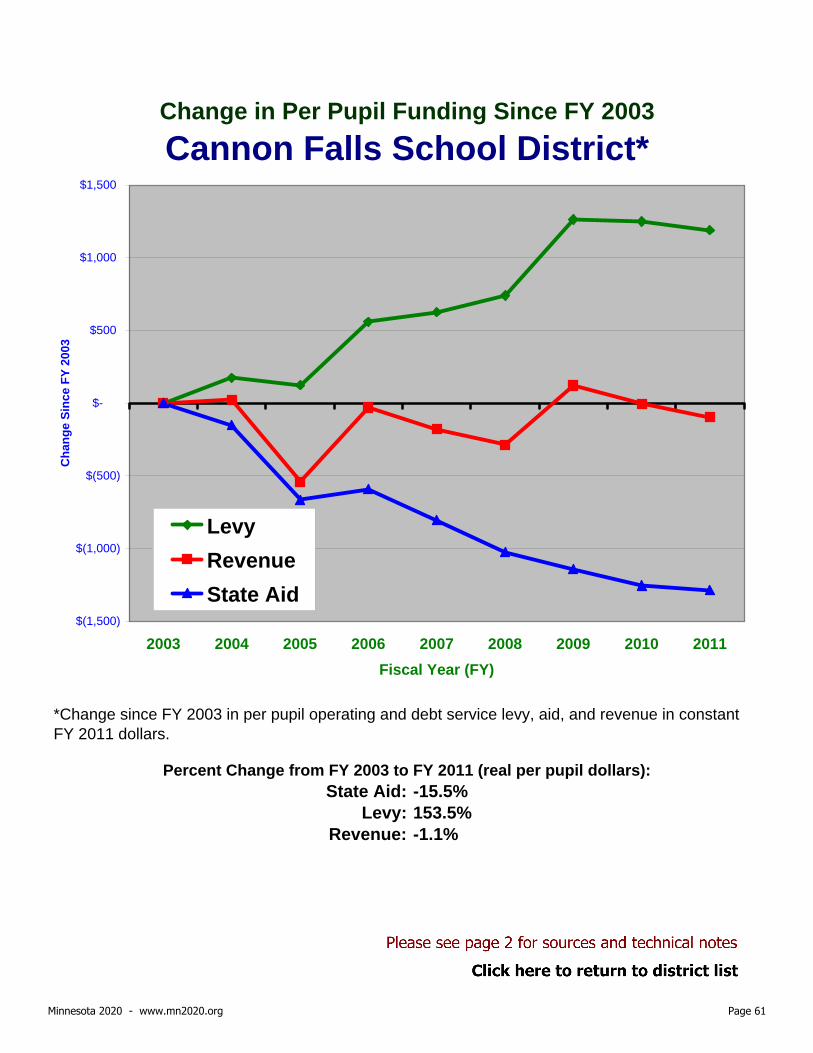
State Aid: -15.5%Levy: 153.5%
Revenue: -1.1%
Percent Change from FY 2003 to FY 2011 (real per pupil dollars):
*Change since FY 2003 in per pupil operating and debt service levy, aid, and revenue in constant FY 2011 dollars.
Change in Per Pupil Funding Since FY 2003Cannon Falls School District*
$(1,500)
$(1,000)
$(500)
$-
$500
$1,000
$1,500
2003 2004 2005 2006 2007 2008 2009 2010 2011Fiscal Year (FY)
Cha
nge
Sinc
e FY
200
3
LevyRevenueState Aid
Minnesota 2020 - www.mn2020.org Page 61
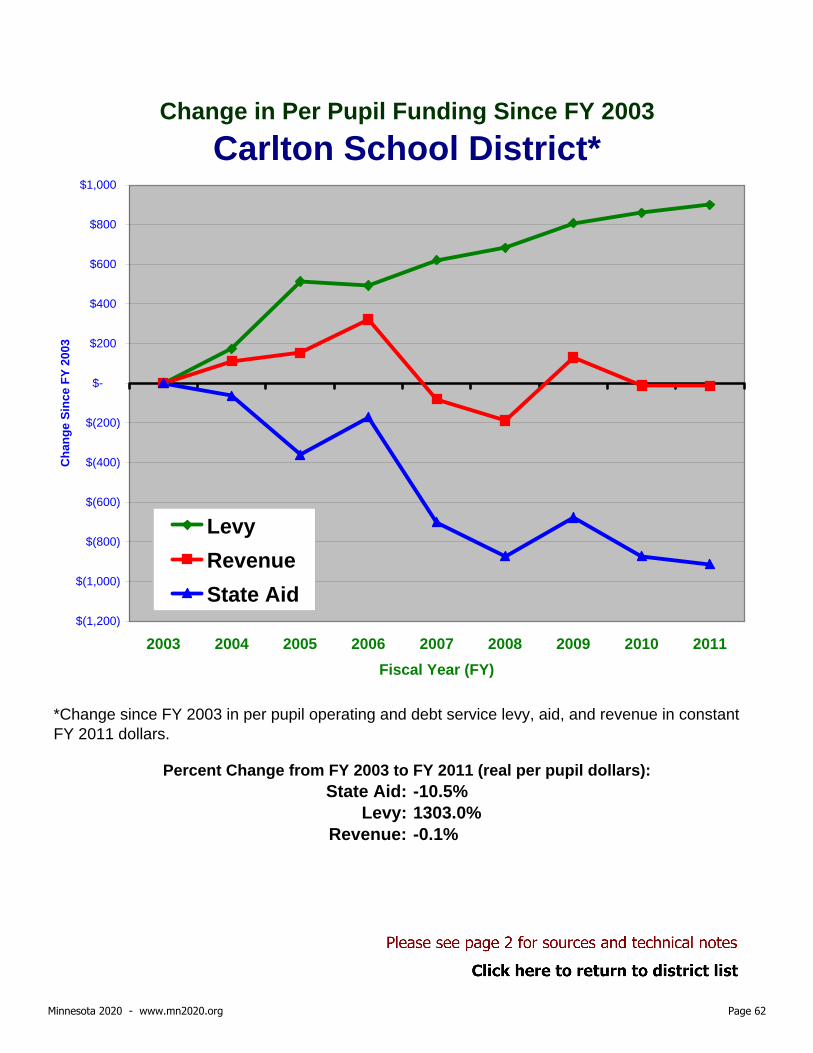
State Aid: -10.5%Levy: 1303.0%
Revenue: -0.1%
Percent Change from FY 2003 to FY 2011 (real per pupil dollars):
*Change since FY 2003 in per pupil operating and debt service levy, aid, and revenue in constant FY 2011 dollars.
Change in Per Pupil Funding Since FY 2003Carlton School District*
$(1,200)
$(1,000)
$(800)
$(600)
$(400)
$(200)
$-
$200
$400
$600
$800
$1,000
2003 2004 2005 2006 2007 2008 2009 2010 2011Fiscal Year (FY)
Cha
nge
Sinc
e FY
200
3
LevyRevenueState Aid
Minnesota 2020 - www.mn2020.org Page 62

State Aid: -11.9%Levy: 79.5%
Revenue: -3.8%
Percent Change from FY 2003 to FY 2011 (real per pupil dollars):
*Change since FY 2003 in per pupil operating and debt service levy, aid, and revenue in constant FY 2011 dollars.
Change in Per Pupil Funding Since FY 2003Cass Lake-Bena School District*
$(2,000)
$(1,500)
$(1,000)
$(500)
$-
$500
$1,000
$1,500
2003 2004 2005 2006 2007 2008 2009 2010 2011Fiscal Year (FY)
Cha
nge
Sinc
e FY
200
3
LevyRevenueState Aid
Minnesota 2020 - www.mn2020.org Page 63

State Aid: -14.6%Levy: 5.1%
Revenue: -12.7%
Percent Change from FY 2003 to FY 2011 (real per pupil dollars):
*Change since FY 2003 in per pupil operating and debt service levy, aid, and revenue in constant FY 2011 dollars.
Change in Per Pupil Funding Since FY 2003Cedar Mountain School District*
$(1,800)
$(1,600)
$(1,400)
$(1,200)
$(1,000)
$(800)
$(600)
$(400)
$(200)
$-
$200
2003 2004 2005 2006 2007 2008 2009 2010 2011Fiscal Year (FY)
Cha
nge
Sinc
e FY
200
3
LevyRevenueState Aid
Minnesota 2020 - www.mn2020.org Page 64

State Aid: -11.8%Levy: 95.3%
Revenue: 1.2%
Percent Change from FY 2003 to FY 2011 (real per pupil dollars):
*Change since FY 2003 in per pupil operating and debt service levy, aid, and revenue in constant FY 2011 dollars.
Change in Per Pupil Funding Since FY 2003Centennial School District*
$(1,500)
$(1,000)
$(500)
$-
$500
$1,000
$1,500
2003 2004 2005 2006 2007 2008 2009 2010 2011Fiscal Year (FY)
Cha
nge
Sinc
e FY
200
3
LevyRevenueState Aid
Minnesota 2020 - www.mn2020.org Page 65

State Aid: -17.6%Levy: 50.0%
Revenue: -3.1%
Percent Change from FY 2003 to FY 2011 (real per pupil dollars):
*Change since FY 2003 in per pupil operating and debt service levy, aid, and revenue in constant FY 2011 dollars.
Change in Per Pupil Funding Since FY 2003Chaska School District*
$(2,000)
$(1,500)
$(1,000)
$(500)
$-
$500
$1,000
$1,500
$2,000
2003 2004 2005 2006 2007 2008 2009 2010 2011Fiscal Year (FY)
Cha
nge
Sinc
e FY
200
3
LevyRevenueState Aid
Minnesota 2020 - www.mn2020.org Page 66

State Aid: -18.9%Levy: 648.1%
Revenue: 3.4%
Percent Change from FY 2003 to FY 2011 (real per pupil dollars):
*Change since FY 2003 in per pupil operating and debt service levy, aid, and revenue in constant FY 2011 dollars.
Change in Per Pupil Funding Since FY 2003Chatfield School District*
$(2,000)
$(1,500)
$(1,000)
$(500)
$-
$500
$1,000
$1,500
$2,000
$2,500
2003 2004 2005 2006 2007 2008 2009 2010 2011Fiscal Year (FY)
Cha
nge
Sinc
e FY
200
3
LevyRevenueState Aid
Minnesota 2020 - www.mn2020.org Page 67

State Aid: -14.9%Levy: 63.5%
Revenue: -6.0%
Percent Change from FY 2003 to FY 2011 (real per pupil dollars):
*Change since FY 2003 in per pupil operating and debt service levy, aid, and revenue in constant FY 2011 dollars.
Change in Per Pupil Funding Since FY 2003Chisago Lakes Area School District*
$(1,500)
$(1,000)
$(500)
$-
$500
$1,000
$1,500
2003 2004 2005 2006 2007 2008 2009 2010 2011Fiscal Year (FY)
Cha
nge
Sinc
e FY
200
3
LevyRevenueState Aid
Minnesota 2020 - www.mn2020.org Page 68

State Aid: -9.3%Levy: 111.6%
Revenue: -2.2%
Percent Change from FY 2003 to FY 2011 (real per pupil dollars):
*Change since FY 2003 in per pupil operating and debt service levy, aid, and revenue in constant FY 2011 dollars.
Change in Per Pupil Funding Since FY 2003Chisholm School District*
$(1,000)
$(800)
$(600)
$(400)
$(200)
$-
$200
$400
$600
$800
2003 2004 2005 2006 2007 2008 2009 2010 2011Fiscal Year (FY)
Cha
nge
Sinc
e FY
200
3
LevyRevenueState Aid
Minnesota 2020 - www.mn2020.org Page 69

State Aid: -12.3%Levy: 357.2%
Revenue: 10.9%
Percent Change from FY 2003 to FY 2011 (real per pupil dollars):
*Change since FY 2003 in per pupil operating and debt service levy, aid, and revenue in constant FY 2011 dollars.
Change in Per Pupil Funding Since FY 2003Chokio-Alberta School District*
$(2,000)
$(1,500)
$(1,000)
$(500)
$-
$500
$1,000
$1,500
$2,000
$2,500
$3,000
2003 2004 2005 2006 2007 2008 2009 2010 2011Fiscal Year (FY)
Cha
nge
Sinc
e FY
200
3
LevyRevenueState Aid
Minnesota 2020 - www.mn2020.org Page 70

State Aid: -12.9%Levy: 31.2%
Revenue: -4.8%
Percent Change from FY 2003 to FY 2011 (real per pupil dollars):
*Change since FY 2003 in per pupil operating and debt service levy, aid, and revenue in constant FY 2011 dollars.
Change in Per Pupil Funding Since FY 2003Clearbrook-Gonvick School District*
$(1,500)
$(1,000)
$(500)
$-
$500
$1,000
2003 2004 2005 2006 2007 2008 2009 2010 2011Fiscal Year (FY)
Cha
nge
Sinc
e FY
200
3
LevyRevenueState Aid
Minnesota 2020 - www.mn2020.org Page 71

State Aid: -21.6%Levy: 41.6%
Revenue: -15.6%
Percent Change from FY 2003 to FY 2011 (real per pupil dollars):
*Change since FY 2003 in per pupil operating and debt service levy, aid, and revenue in constant FY 2011 dollars.
Change in Per Pupil Funding Since FY 2003Cleveland School District*
$(2,500)
$(2,000)
$(1,500)
$(1,000)
$(500)
$-
$500
$1,000
2003 2004 2005 2006 2007 2008 2009 2010 2011Fiscal Year (FY)
Cha
nge
Sinc
e FY
200
3
LevyRevenueState Aid
Minnesota 2020 - www.mn2020.org Page 72

State Aid: -11.2%Levy: 213.9%
Revenue: -2.9%
Percent Change from FY 2003 to FY 2011 (real per pupil dollars):
*Change since FY 2003 in per pupil operating and debt service levy, aid, and revenue in constant FY 2011 dollars.
Change in Per Pupil Funding Since FY 2003Climax School District*
$(2,000)
$(1,500)
$(1,000)
$(500)
$-
$500
$1,000
$1,500
2003 2004 2005 2006 2007 2008 2009 2010 2011Fiscal Year (FY)
Cha
nge
Sinc
e FY
200
3
LevyRevenueState Aid
Minnesota 2020 - www.mn2020.org Page 73

State Aid: -6.7%Levy: 97.7%
Revenue: 1.0%
Percent Change from FY 2003 to FY 2011 (real per pupil dollars):
*Change since FY 2003 in per pupil operating and debt service levy, aid, and revenue in constant FY 2011 dollars.
Change in Per Pupil Funding Since FY 2003Clinton-Graceville-Beardsley School District*
$(1,500)
$(1,000)
$(500)
$-
$500
$1,000
2003 2004 2005 2006 2007 2008 2009 2010 2011Fiscal Year (FY)
Cha
nge
Sinc
e FY
200
3
LevyRevenueState Aid
Minnesota 2020 - www.mn2020.org Page 74

State Aid: -15.9%Levy: 37.5%
Revenue: -11.1%
Percent Change from FY 2003 to FY 2011 (real per pupil dollars):
*Change since FY 2003 in per pupil operating and debt service levy, aid, and revenue in constant FY 2011 dollars.
Change in Per Pupil Funding Since FY 2003Cloquet School District*
$(2,000)
$(1,500)
$(1,000)
$(500)
$-
$500
2003 2004 2005 2006 2007 2008 2009 2010 2011Fiscal Year (FY)
Cha
nge
Sinc
e FY
200
3
LevyRevenueState Aid
Minnesota 2020 - www.mn2020.org Page 75

State Aid: 4.3%Levy: 30.3%
Revenue: 9.1%
Percent Change from FY 2003 to FY 2011 (real per pupil dollars):
*Change since FY 2003 in per pupil operating and debt service levy, aid, and revenue in constant FY 2011 dollars.
Change in Per Pupil Funding Since FY 2003Columbia Heights School District*
$(1,000)
$(800)
$(600)
$(400)
$(200)
$-
$200
$400
$600
$800
$1,000
$1,200
2003 2004 2005 2006 2007 2008 2009 2010 2011Fiscal Year (FY)
Cha
nge
Sinc
e FY
200
3
LevyRevenueState Aid
Minnesota 2020 - www.mn2020.org Page 76

State Aid: -18.9%Levy: 170.1%
Revenue: -8.8%
Percent Change from FY 2003 to FY 2011 (real per pupil dollars):
*Change since FY 2003 in per pupil operating and debt service levy, aid, and revenue in constant FY 2011 dollars.
Change in Per Pupil Funding Since FY 2003Comfrey School District*
$(2,500)
$(2,000)
$(1,500)
$(1,000)
$(500)
$-
$500
$1,000
$1,500
2003 2004 2005 2006 2007 2008 2009 2010 2011Fiscal Year (FY)
Cha
nge
Sinc
e FY
200
3
LevyRevenueState Aid
Minnesota 2020 - www.mn2020.org Page 77

State Aid: -4.3%Levy: 103.9%
Revenue: 3.2%
Percent Change from FY 2003 to FY 2011 (real per pupil dollars):
*Change since FY 2003 in per pupil operating and debt service levy, aid, and revenue in constant FY 2011 dollars.
Change in Per Pupil Funding Since FY 2003Cook County School District*
$(1,000)
$(800)
$(600)
$(400)
$(200)
$-
$200
$400
$600
$800
$1,000
$1,200
2003 2004 2005 2006 2007 2008 2009 2010 2011Fiscal Year (FY)
Cha
nge
Sinc
e FY
200
3
LevyRevenueState Aid
Minnesota 2020 - www.mn2020.org Page 78

State Aid: -20.2%Levy: 71.0%
Revenue: -8.3%
Percent Change from FY 2003 to FY 2011 (real per pupil dollars):
*Change since FY 2003 in per pupil operating and debt service levy, aid, and revenue in constant FY 2011 dollars.
Change in Per Pupil Funding Since FY 2003Cromwell-Wright School District*
$(2,500)
$(2,000)
$(1,500)
$(1,000)
$(500)
$-
$500
$1,000
$1,500
2003 2004 2005 2006 2007 2008 2009 2010 2011Fiscal Year (FY)
Cha
nge
Sinc
e FY
200
3
LevyRevenueState Aid
Minnesota 2020 - www.mn2020.org Page 79

State Aid: -15.4%Levy: 7.2%
Revenue: -12.6%
Percent Change from FY 2003 to FY 2011 (real per pupil dollars):
*Change since FY 2003 in per pupil operating and debt service levy, aid, and revenue in constant FY 2011 dollars.
Change in Per Pupil Funding Since FY 2003Crookston School District*
$(2,000)
$(1,500)
$(1,000)
$(500)
$-
$500
2003 2004 2005 2006 2007 2008 2009 2010 2011Fiscal Year (FY)
Cha
nge
Sinc
e FY
200
3
LevyRevenueState Aid
Minnesota 2020 - www.mn2020.org Page 80
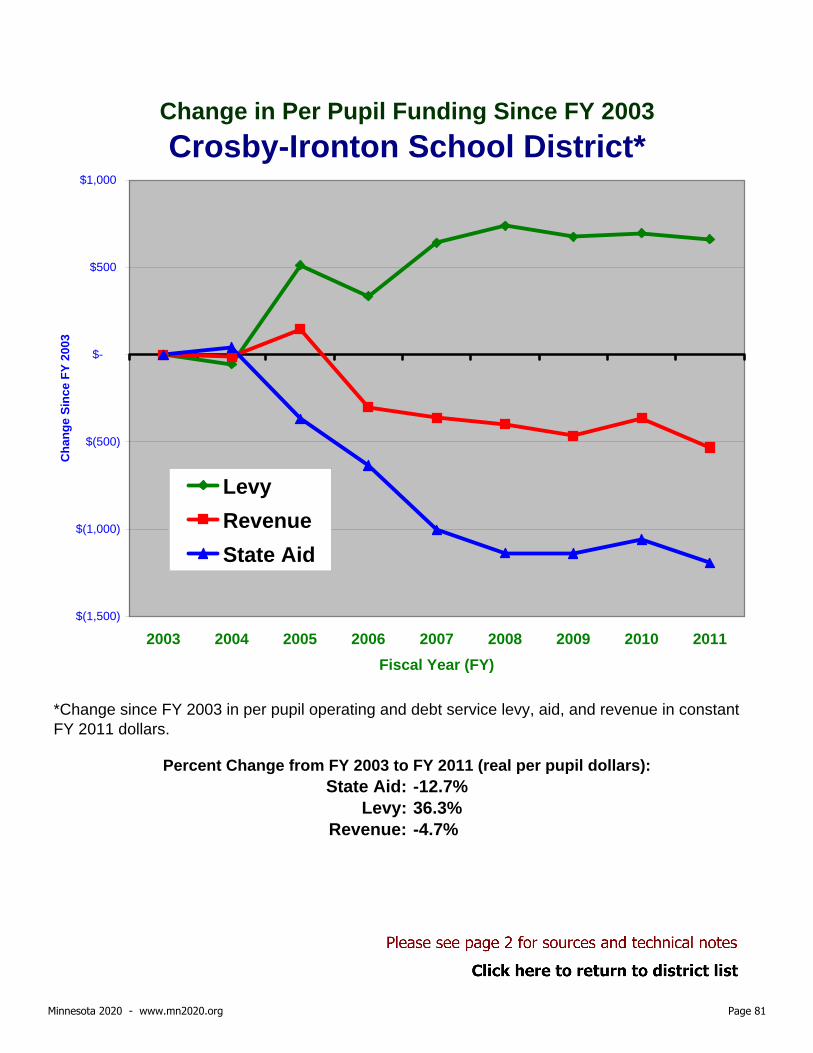
State Aid: -12.7%Levy: 36.3%
Revenue: -4.7%
Percent Change from FY 2003 to FY 2011 (real per pupil dollars):
*Change since FY 2003 in per pupil operating and debt service levy, aid, and revenue in constant FY 2011 dollars.
Change in Per Pupil Funding Since FY 2003Crosby-Ironton School District*
$(1,500)
$(1,000)
$(500)
$-
$500
$1,000
2003 2004 2005 2006 2007 2008 2009 2010 2011Fiscal Year (FY)
Cha
nge
Sinc
e FY
200
3
LevyRevenueState Aid
Minnesota 2020 - www.mn2020.org Page 81

State Aid: -11.8%Levy: 342.2%
Revenue: -0.5%
Percent Change from FY 2003 to FY 2011 (real per pupil dollars):
*Change since FY 2003 in per pupil operating and debt service levy, aid, and revenue in constant FY 2011 dollars.
Change in Per Pupil Funding Since FY 2003Cyrus School District*
$(1,500)
$(1,000)
$(500)
$-
$500
$1,000
$1,500
2003 2004 2005 2006 2007 2008 2009 2010 2011Fiscal Year (FY)
Cha
nge
Sinc
e FY
200
3
LevyRevenueState Aid
Minnesota 2020 - www.mn2020.org Page 82

State Aid: -14.5%Levy: 65.3%
Revenue: -7.2%
Percent Change from FY 2003 to FY 2011 (real per pupil dollars):
*Change since FY 2003 in per pupil operating and debt service levy, aid, and revenue in constant FY 2011 dollars.
Change in Per Pupil Funding Since FY 2003Dassel-Cokato School District*
$(1,500)
$(1,000)
$(500)
$-
$500
$1,000
2003 2004 2005 2006 2007 2008 2009 2010 2011Fiscal Year (FY)
Cha
nge
Sinc
e FY
200
3
LevyRevenueState Aid
Minnesota 2020 - www.mn2020.org Page 83

State Aid: -10.7%Levy: 76.7%
Revenue: -4.2%
Percent Change from FY 2003 to FY 2011 (real per pupil dollars):
*Change since FY 2003 in per pupil operating and debt service levy, aid, and revenue in constant FY 2011 dollars.
Change in Per Pupil Funding Since FY 2003Dawson-Boyd School District*
$(1,200)
$(1,000)
$(800)
$(600)
$(400)
$(200)
$-
$200
$400
$600
$800
2003 2004 2005 2006 2007 2008 2009 2010 2011Fiscal Year (FY)
Cha
nge
Sinc
e FY
200
3
LevyRevenueState Aid
Minnesota 2020 - www.mn2020.org Page 84

State Aid: -11.3%Levy: 147.6%
Revenue: -1.1%
Percent Change from FY 2003 to FY 2011 (real per pupil dollars):
*Change since FY 2003 in per pupil operating and debt service levy, aid, and revenue in constant FY 2011 dollars.
Change in Per Pupil Funding Since FY 2003Deer River School District*
$(1,500)
$(1,000)
$(500)
$-
$500
$1,000
$1,500
2003 2004 2005 2006 2007 2008 2009 2010 2011Fiscal Year (FY)
Cha
nge
Sinc
e FY
200
3
LevyRevenueState Aid
Minnesota 2020 - www.mn2020.org Page 85
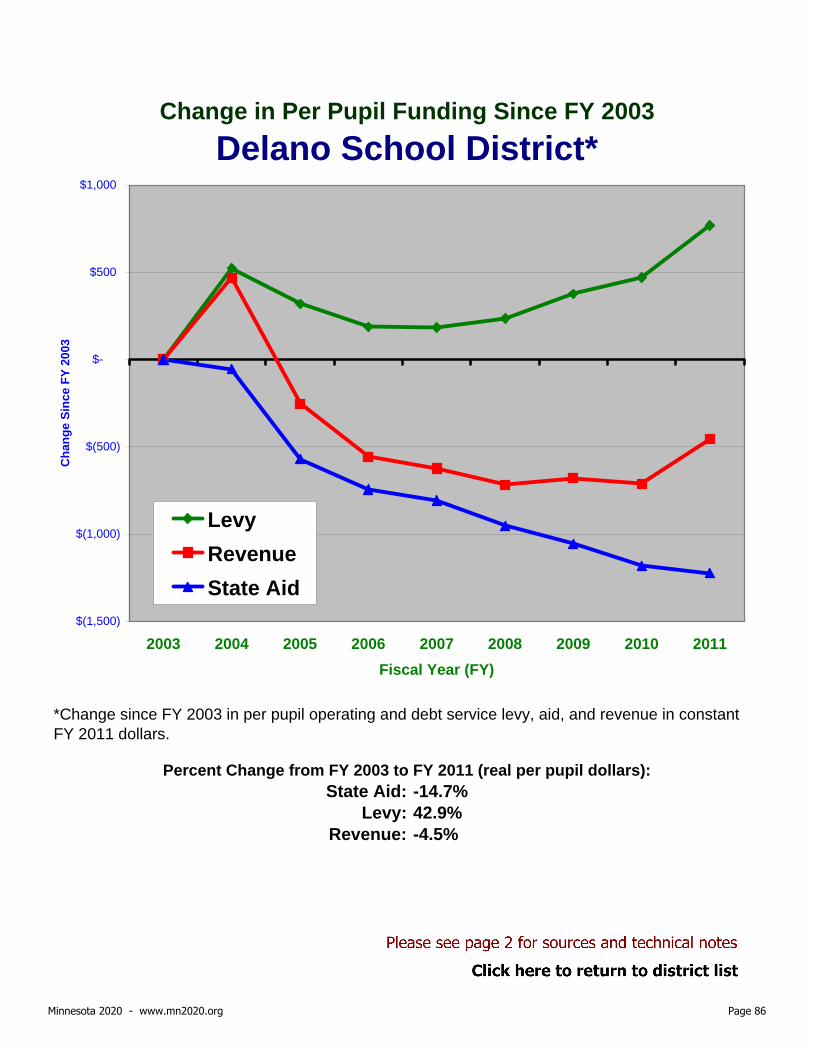
State Aid: -14.7%Levy: 42.9%
Revenue: -4.5%
Percent Change from FY 2003 to FY 2011 (real per pupil dollars):
*Change since FY 2003 in per pupil operating and debt service levy, aid, and revenue in constant FY 2011 dollars.
Change in Per Pupil Funding Since FY 2003Delano School District*
$(1,500)
$(1,000)
$(500)
$-
$500
$1,000
2003 2004 2005 2006 2007 2008 2009 2010 2011Fiscal Year (FY)
Cha
nge
Sinc
e FY
200
3
LevyRevenueState Aid
Minnesota 2020 - www.mn2020.org Page 86

State Aid: -13.8%Levy: 46.8%
Revenue: -8.8%
Percent Change from FY 2003 to FY 2011 (real per pupil dollars):
*Change since FY 2003 in per pupil operating and debt service levy, aid, and revenue in constant FY 2011 dollars.
Change in Per Pupil Funding Since FY 2003Detroit Lakes School District*
$(1,600)
$(1,400)
$(1,200)
$(1,000)
$(800)
$(600)
$(400)
$(200)
$-
$200
$400
$600
2003 2004 2005 2006 2007 2008 2009 2010 2011Fiscal Year (FY)
Cha
nge
Sinc
e FY
200
3
LevyRevenueState Aid
Minnesota 2020 - www.mn2020.org Page 87

State Aid: -13.8%Levy: 48.1%
Revenue: -8.9%
Percent Change from FY 2003 to FY 2011 (real per pupil dollars):
*Change since FY 2003 in per pupil operating and debt service levy, aid, and revenue in constant FY 2011 dollars.
Change in Per Pupil Funding Since FY 2003Dilworth-Glyndon-Felton School District*
$(1,400)
$(1,200)
$(1,000)
$(800)
$(600)
$(400)
$(200)
$-
$200
$400
$600
2003 2004 2005 2006 2007 2008 2009 2010 2011Fiscal Year (FY)
Cha
nge
Sinc
e FY
200
3
LevyRevenueState Aid
Minnesota 2020 - www.mn2020.org Page 88
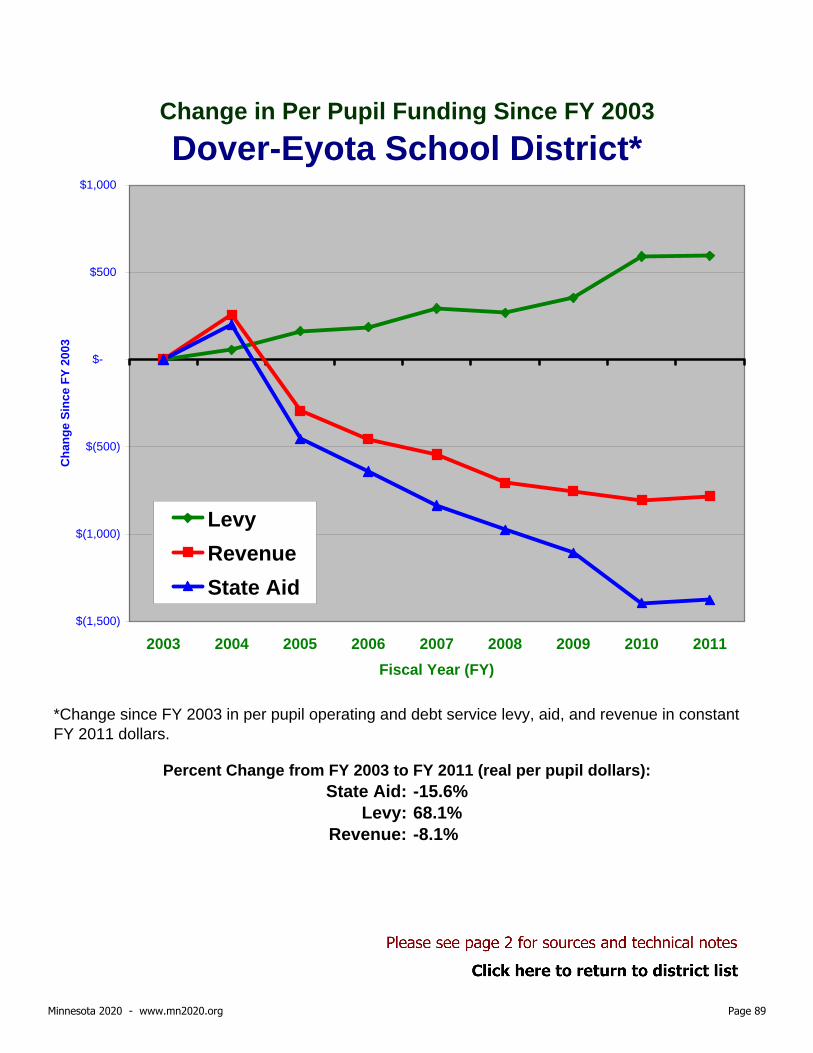
State Aid: -15.6%Levy: 68.1%
Revenue: -8.1%
Percent Change from FY 2003 to FY 2011 (real per pupil dollars):
*Change since FY 2003 in per pupil operating and debt service levy, aid, and revenue in constant FY 2011 dollars.
Change in Per Pupil Funding Since FY 2003Dover-Eyota School District*
$(1,500)
$(1,000)
$(500)
$-
$500
$1,000
2003 2004 2005 2006 2007 2008 2009 2010 2011Fiscal Year (FY)
Cha
nge
Sinc
e FY
200
3
LevyRevenueState Aid
Minnesota 2020 - www.mn2020.org Page 89

State Aid: -17.1%Levy: 175.8%
Revenue: -1.0%
Percent Change from FY 2003 to FY 2011 (real per pupil dollars):
*Change since FY 2003 in per pupil operating and debt service levy, aid, and revenue in constant FY 2011 dollars.
Change in Per Pupil Funding Since FY 2003Duluth School District*
$(2,000)
$(1,500)
$(1,000)
$(500)
$-
$500
$1,000
$1,500
$2,000
2003 2004 2005 2006 2007 2008 2009 2010 2011Fiscal Year (FY)
Cha
nge
Sinc
e FY
200
3
LevyRevenueState Aid
Minnesota 2020 - www.mn2020.org Page 90
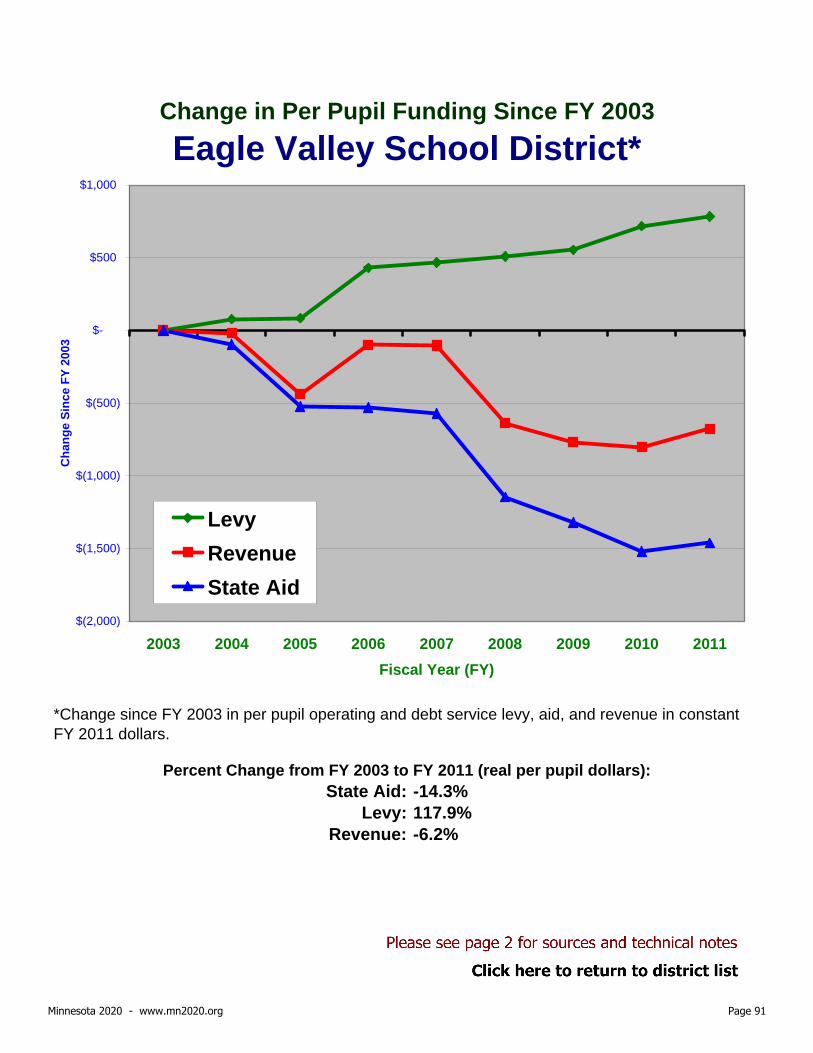
State Aid: -14.3%Levy: 117.9%
Revenue: -6.2%
Percent Change from FY 2003 to FY 2011 (real per pupil dollars):
*Change since FY 2003 in per pupil operating and debt service levy, aid, and revenue in constant FY 2011 dollars.
Change in Per Pupil Funding Since FY 2003Eagle Valley School District*
$(2,000)
$(1,500)
$(1,000)
$(500)
$-
$500
$1,000
2003 2004 2005 2006 2007 2008 2009 2010 2011Fiscal Year (FY)
Cha
nge
Sinc
e FY
200
3
LevyRevenueState Aid
Minnesota 2020 - www.mn2020.org Page 91

State Aid: -12.0%Levy: 140.5%
Revenue: 6.6%
Percent Change from FY 2003 to FY 2011 (real per pupil dollars):
*Change since FY 2003 in per pupil operating and debt service levy, aid, and revenue in constant FY 2011 dollars.
Change in Per Pupil Funding Since FY 2003East Central School District*
$(2,000)
$(1,500)
$(1,000)
$(500)
$-
$500
$1,000
$1,500
$2,000
$2,500
2003 2004 2005 2006 2007 2008 2009 2010 2011Fiscal Year (FY)
Cha
nge
Sinc
e FY
200
3
LevyRevenueState Aid
Minnesota 2020 - www.mn2020.org Page 92

State Aid: -13.4%Levy: 620.6%
Revenue: -3.3%
Percent Change from FY 2003 to FY 2011 (real per pupil dollars):
*Change since FY 2003 in per pupil operating and debt service levy, aid, and revenue in constant FY 2011 dollars.
Change in Per Pupil Funding Since FY 2003East Grand Forks School District*
$(1,500)
$(1,000)
$(500)
$-
$500
$1,000
$1,500
2003 2004 2005 2006 2007 2008 2009 2010 2011Fiscal Year (FY)
Cha
nge
Sinc
e FY
200
3
LevyRevenueState Aid
Minnesota 2020 - www.mn2020.org Page 93

State Aid: -9.4%Levy: 39.8%
Revenue: 1.2%
Percent Change from FY 2003 to FY 2011 (real per pupil dollars):
*Change since FY 2003 in per pupil operating and debt service levy, aid, and revenue in constant FY 2011 dollars.
Change in Per Pupil Funding Since FY 2003Eden Prairie School District*
$(1,000)
$(500)
$-
$500
$1,000
$1,500
2003 2004 2005 2006 2007 2008 2009 2010 2011Fiscal Year (FY)
Cha
nge
Sinc
e FY
200
3
LevyRevenueState Aid
Minnesota 2020 - www.mn2020.org Page 94
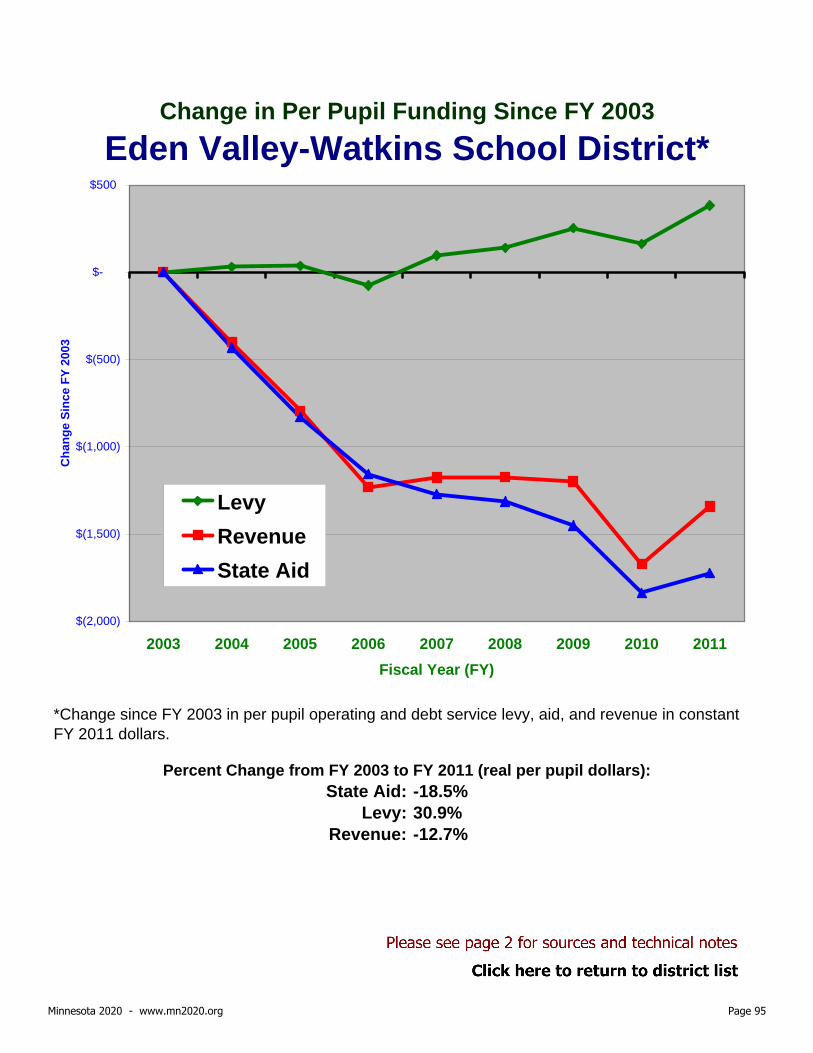
State Aid: -18.5%Levy: 30.9%
Revenue: -12.7%
Percent Change from FY 2003 to FY 2011 (real per pupil dollars):
*Change since FY 2003 in per pupil operating and debt service levy, aid, and revenue in constant FY 2011 dollars.
Change in Per Pupil Funding Since FY 2003Eden Valley-Watkins School District*
$(2,000)
$(1,500)
$(1,000)
$(500)
$-
$500
2003 2004 2005 2006 2007 2008 2009 2010 2011Fiscal Year (FY)
Cha
nge
Sinc
e FY
200
3
LevyRevenueState Aid
Minnesota 2020 - www.mn2020.org Page 95

State Aid: -9.8%Levy: 145.6%
Revenue: -0.9%
Percent Change from FY 2003 to FY 2011 (real per pupil dollars):
*Change since FY 2003 in per pupil operating and debt service levy, aid, and revenue in constant FY 2011 dollars.
Change in Per Pupil Funding Since FY 2003Edgerton School District*
$(1,500)
$(1,000)
$(500)
$-
$500
$1,000
2003 2004 2005 2006 2007 2008 2009 2010 2011Fiscal Year (FY)
Cha
nge
Sinc
e FY
200
3
LevyRevenueState Aid
Minnesota 2020 - www.mn2020.org Page 96

State Aid: -11.8%Levy: 14.9%
Revenue: -4.2%
Percent Change from FY 2003 to FY 2011 (real per pupil dollars):
*Change since FY 2003 in per pupil operating and debt service levy, aid, and revenue in constant FY 2011 dollars.
Change in Per Pupil Funding Since FY 2003Edina School District*
$(1,200)
$(1,000)
$(800)
$(600)
$(400)
$(200)
$-
$200
$400
$600
$800
2003 2004 2005 2006 2007 2008 2009 2010 2011Fiscal Year (FY)
Cha
nge
Sinc
e FY
200
3
LevyRevenueState Aid
Minnesota 2020 - www.mn2020.org Page 97

State Aid: -17.1%Levy: 72.3%
Revenue: -2.3%
Percent Change from FY 2003 to FY 2011 (real per pupil dollars):
*Change since FY 2003 in per pupil operating and debt service levy, aid, and revenue in constant FY 2011 dollars.
Change in Per Pupil Funding Since FY 2003Elk River School District*
$(2,000)
$(1,500)
$(1,000)
$(500)
$-
$500
$1,000
$1,500
2003 2004 2005 2006 2007 2008 2009 2010 2011Fiscal Year (FY)
Cha
nge
Sinc
e FY
200
3
LevyRevenueState Aid
Minnesota 2020 - www.mn2020.org Page 98

State Aid: -7.8%Levy: 273.0%
Revenue: -0.7%
Percent Change from FY 2003 to FY 2011 (real per pupil dollars):
*Change since FY 2003 in per pupil operating and debt service levy, aid, and revenue in constant FY 2011 dollars.
Change in Per Pupil Funding Since FY 2003Ellsworth School District*
$(1,400)
$(1,200)
$(1,000)
$(800)
$(600)
$(400)
$(200)
$-
$200
$400
$600
$800
2003 2004 2005 2006 2007 2008 2009 2010 2011Fiscal Year (FY)
Cha
nge
Sinc
e FY
200
3
LevyRevenueState Aid
Minnesota 2020 - www.mn2020.org Page 99

State Aid: -15.8%Levy: 483.4%
Revenue: 3.6%
Percent Change from FY 2003 to FY 2011 (real per pupil dollars):
*Change since FY 2003 in per pupil operating and debt service levy, aid, and revenue in constant FY 2011 dollars.
Change in Per Pupil Funding Since FY 2003Ely School District*
$(2,000)
$(1,500)
$(1,000)
$(500)
$-
$500
$1,000
$1,500
$2,000
2003 2004 2005 2006 2007 2008 2009 2010 2011Fiscal Year (FY)
Cha
nge
Sinc
e FY
200
3
LevyRevenueState Aid
Minnesota 2020 - www.mn2020.org Page 100

State Aid: -27.5%Levy: 33.4%
Revenue: -22.0%
Percent Change from FY 2003 to FY 2011 (real per pupil dollars):
*Change since FY 2003 in per pupil operating and debt service levy, aid, and revenue in constant FY 2011 dollars.
Change in Per Pupil Funding Since FY 2003Esko School District*
$(3,000)
$(2,500)
$(2,000)
$(1,500)
$(1,000)
$(500)
$-
$500
$1,000
2003 2004 2005 2006 2007 2008 2009 2010 2011Fiscal Year (FY)
Cha
nge
Sinc
e FY
200
3
LevyRevenueState Aid
Minnesota 2020 - www.mn2020.org Page 101

State Aid: -18.9%Levy: 256.6%
Revenue: 0.0%
Percent Change from FY 2003 to FY 2011 (real per pupil dollars):
*Change since FY 2003 in per pupil operating and debt service levy, aid, and revenue in constant FY 2011 dollars.
Change in Per Pupil Funding Since FY 2003Evansville School District*
$(2,000)
$(1,500)
$(1,000)
$(500)
$-
$500
$1,000
$1,500
$2,000
$2,500
2003 2004 2005 2006 2007 2008 2009 2010 2011Fiscal Year (FY)
Cha
nge
Sinc
e FY
200
3
LevyRevenueState Aid
Minnesota 2020 - www.mn2020.org Page 102

State Aid: -15.0%Levy: 25.2%
Revenue: -12.8%
Percent Change from FY 2003 to FY 2011 (real per pupil dollars):
*Change since FY 2003 in per pupil operating and debt service levy, aid, and revenue in constant FY 2011 dollars.
Change in Per Pupil Funding Since FY 2003Eveleth-Gilbert School District*
$(1,600)
$(1,400)
$(1,200)
$(1,000)
$(800)
$(600)
$(400)
$(200)
$-
$200
$400
2003 2004 2005 2006 2007 2008 2009 2010 2011Fiscal Year (FY)
Cha
nge
Sinc
e FY
200
3
LevyRevenueState Aid
Minnesota 2020 - www.mn2020.org Page 103

State Aid: -13.4%Levy: 190.2%
Revenue: 1.3%
Percent Change from FY 2003 to FY 2011 (real per pupil dollars):
*Change since FY 2003 in per pupil operating and debt service levy, aid, and revenue in constant FY 2011 dollars.
Change in Per Pupil Funding Since FY 2003Fairmont Area School District*
$(1,500)
$(1,000)
$(500)
$-
$500
$1,000
$1,500
$2,000
2003 2004 2005 2006 2007 2008 2009 2010 2011Fiscal Year (FY)
Cha
nge
Sinc
e FY
200
3
LevyRevenueState Aid
Minnesota 2020 - www.mn2020.org Page 104

State Aid: -16.7%Levy: 63.8%
Revenue: -6.9%
Percent Change from FY 2003 to FY 2011 (real per pupil dollars):
*Change since FY 2003 in per pupil operating and debt service levy, aid, and revenue in constant FY 2011 dollars.
Change in Per Pupil Funding Since FY 2003Faribault School District*
$(2,000)
$(1,500)
$(1,000)
$(500)
$-
$500
$1,000
$1,500
2003 2004 2005 2006 2007 2008 2009 2010 2011Fiscal Year (FY)
Cha
nge
Sinc
e FY
200
3
LevyRevenueState Aid
Minnesota 2020 - www.mn2020.org Page 105

State Aid: -10.0%Levy: 106.8%
Revenue: 6.1%
Percent Change from FY 2003 to FY 2011 (real per pupil dollars):
*Change since FY 2003 in per pupil operating and debt service levy, aid, and revenue in constant FY 2011 dollars.
Change in Per Pupil Funding Since FY 2003Farmington School District*
$(1,500)
$(1,000)
$(500)
$-
$500
$1,000
$1,500
$2,000
2003 2004 2005 2006 2007 2008 2009 2010 2011Fiscal Year (FY)
Cha
nge
Sinc
e FY
200
3
LevyRevenueState Aid
Minnesota 2020 - www.mn2020.org Page 106

State Aid: -18.8%Levy: 137.5%
Revenue: -4.7%
Percent Change from FY 2003 to FY 2011 (real per pupil dollars):
*Change since FY 2003 in per pupil operating and debt service levy, aid, and revenue in constant FY 2011 dollars.
Change in Per Pupil Funding Since FY 2003Fergus Falls School District*
$(2,000)
$(1,500)
$(1,000)
$(500)
$-
$500
$1,000
$1,500
$2,000
2003 2004 2005 2006 2007 2008 2009 2010 2011Fiscal Year (FY)
Cha
nge
Sinc
e FY
200
3
LevyRevenueState Aid
Minnesota 2020 - www.mn2020.org Page 107

State Aid: -12.3%Levy: 51.7%
Revenue: -7.3%
Percent Change from FY 2003 to FY 2011 (real per pupil dollars):
*Change since FY 2003 in per pupil operating and debt service levy, aid, and revenue in constant FY 2011 dollars.
Change in Per Pupil Funding Since FY 2003Fertile-Beltrami School District*
$(1,500)
$(1,000)
$(500)
$-
$500
$1,000
$1,500
2003 2004 2005 2006 2007 2008 2009 2010 2011Fiscal Year (FY)
Cha
nge
Sinc
e FY
200
3
LevyRevenueState Aid
Minnesota 2020 - www.mn2020.org Page 108

State Aid: -14.5%Levy: 146.5%
Revenue: 1.2%
Percent Change from FY 2003 to FY 2011 (real per pupil dollars):
*Change since FY 2003 in per pupil operating and debt service levy, aid, and revenue in constant FY 2011 dollars.
Change in Per Pupil Funding Since FY 2003Fillmore Central School District*
$(2,000)
$(1,500)
$(1,000)
$(500)
$-
$500
$1,000
$1,500
$2,000
2003 2004 2005 2006 2007 2008 2009 2010 2011Fiscal Year (FY)
Cha
nge
Sinc
e FY
200
3
LevyRevenueState Aid
Minnesota 2020 - www.mn2020.org Page 109

State Aid: -12.9%Levy: 7.0%
Revenue: -10.0%
Percent Change from FY 2003 to FY 2011 (real per pupil dollars):
*Change since FY 2003 in per pupil operating and debt service levy, aid, and revenue in constant FY 2011 dollars.
Change in Per Pupil Funding Since FY 2003Fisher School District*
$(1,400)
$(1,200)
$(1,000)
$(800)
$(600)
$(400)
$(200)
$-
$200
2003 2004 2005 2006 2007 2008 2009 2010 2011Fiscal Year (FY)
Cha
nge
Sinc
e FY
200
3
LevyRevenueState Aid
Minnesota 2020 - www.mn2020.org Page 110

State Aid: -10.8%Levy: 63.6%
Revenue: 1.1%
Percent Change from FY 2003 to FY 2011 (real per pupil dollars):
*Change since FY 2003 in per pupil operating and debt service levy, aid, and revenue in constant FY 2011 dollars.
Change in Per Pupil Funding Since FY 2003Floodwood School District*
$(1,500)
$(1,000)
$(500)
$-
$500
$1,000
$1,500
$2,000
2003 2004 2005 2006 2007 2008 2009 2010 2011Fiscal Year (FY)
Cha
nge
Sinc
e FY
200
3
LevyRevenueState Aid
Minnesota 2020 - www.mn2020.org Page 111

State Aid: -15.6%Levy: 62.4%
Revenue: -5.8%
Percent Change from FY 2003 to FY 2011 (real per pupil dollars):
*Change since FY 2003 in per pupil operating and debt service levy, aid, and revenue in constant FY 2011 dollars.
Change in Per Pupil Funding Since FY 2003Foley School District*
$(2,000)
$(1,500)
$(1,000)
$(500)
$-
$500
$1,000
2003 2004 2005 2006 2007 2008 2009 2010 2011Fiscal Year (FY)
Cha
nge
Sinc
e FY
200
3
LevyRevenueState Aid
Minnesota 2020 - www.mn2020.org Page 112

State Aid: -17.4%Levy: 19.7%
Revenue: -11.5%
Percent Change from FY 2003 to FY 2011 (real per pupil dollars):
*Change since FY 2003 in per pupil operating and debt service levy, aid, and revenue in constant FY 2011 dollars.
Change in Per Pupil Funding Since FY 2003Forest Lake School District*
$(2,000)
$(1,500)
$(1,000)
$(500)
$-
$500
$1,000
2003 2004 2005 2006 2007 2008 2009 2010 2011Fiscal Year (FY)
Cha
nge
Sinc
e FY
200
3
LevyRevenueState Aid
Minnesota 2020 - www.mn2020.org Page 113

State Aid: -8.5%Levy: 37.8%
Revenue: -4.4%
Percent Change from FY 2003 to FY 2011 (real per pupil dollars):
*Change since FY 2003 in per pupil operating and debt service levy, aid, and revenue in constant FY 2011 dollars.
Change in Per Pupil Funding Since FY 2003Fosston School District*
$(1,000)
$(800)
$(600)
$(400)
$(200)
$-
$200
$400
$600
2003 2004 2005 2006 2007 2008 2009 2010 2011Fiscal Year (FY)
Cha
nge
Sinc
e FY
200
3
LevyRevenueState Aid
Minnesota 2020 - www.mn2020.org Page 114

State Aid: -22.2%Levy: 52.0%
Revenue: -13.5%
Percent Change from FY 2003 to FY 2011 (real per pupil dollars):
*Change since FY 2003 in per pupil operating and debt service levy, aid, and revenue in constant FY 2011 dollars.
Change in Per Pupil Funding Since FY 2003Franconia School District*
$(2,500)
$(2,000)
$(1,500)
$(1,000)
$(500)
$-
$500
$1,000
$1,500
$2,000
2003 2004 2005 2006 2007 2008 2009 2010 2011Fiscal Year (FY)
Cha
nge
Sinc
e FY
200
3
LevyRevenueState Aid
Minnesota 2020 - www.mn2020.org Page 115

State Aid: -16.4%Levy: 148.8%
Revenue: 0.7%
Percent Change from FY 2003 to FY 2011 (real per pupil dollars):
*Change since FY 2003 in per pupil operating and debt service levy, aid, and revenue in constant FY 2011 dollars.
Change in Per Pupil Funding Since FY 2003Frazee-Vergas School District*
$(2,000)
$(1,500)
$(1,000)
$(500)
$-
$500
$1,000
$1,500
$2,000
2003 2004 2005 2006 2007 2008 2009 2010 2011Fiscal Year (FY)
Cha
nge
Sinc
e FY
200
3
LevyRevenueState Aid
Minnesota 2020 - www.mn2020.org Page 116

State Aid: -6.1%Levy: 75.2%
Revenue: 4.3%
Percent Change from FY 2003 to FY 2011 (real per pupil dollars):
*Change since FY 2003 in per pupil operating and debt service levy, aid, and revenue in constant FY 2011 dollars.
Change in Per Pupil Funding Since FY 2003Fridley School District*
$(1,000)
$(800)
$(600)
$(400)
$(200)
$-
$200
$400
$600
$800
$1,000
$1,200
2003 2004 2005 2006 2007 2008 2009 2010 2011Fiscal Year (FY)
Cha
nge
Sinc
e FY
200
3
LevyRevenueState Aid
Minnesota 2020 - www.mn2020.org Page 117

State Aid: -9.6%Levy: 135.9%
Revenue: 1.5%
Percent Change from FY 2003 to FY 2011 (real per pupil dollars):
*Change since FY 2003 in per pupil operating and debt service levy, aid, and revenue in constant FY 2011 dollars.
Change in Per Pupil Funding Since FY 2003Fulda School District*
$(1,500)
$(1,000)
$(500)
$-
$500
$1,000
$1,500
2003 2004 2005 2006 2007 2008 2009 2010 2011Fiscal Year (FY)
Cha
nge
Sinc
e FY
200
3
LevyRevenueState Aid
Minnesota 2020 - www.mn2020.org Page 118

State Aid: -17.5%Levy: 124.9%
Revenue: -7.6%
Percent Change from FY 2003 to FY 2011 (real per pupil dollars):
*Change since FY 2003 in per pupil operating and debt service levy, aid, and revenue in constant FY 2011 dollars.
Change in Per Pupil Funding Since FY 2003Gibbon-Fairfax-Winthrop School District*
$(2,000)
$(1,500)
$(1,000)
$(500)
$-
$500
$1,000
$1,500
2003 2004 2005 2006 2007 2008 2009 2010 2011Fiscal Year (FY)
Cha
nge
Sinc
e FY
200
3
LevyRevenueState Aid
Minnesota 2020 - www.mn2020.org Page 119

State Aid: -14.0%Levy: 240.7%
Revenue: -4.0%
Percent Change from FY 2003 to FY 2011 (real per pupil dollars):
*Change since FY 2003 in per pupil operating and debt service levy, aid, and revenue in constant FY 2011 dollars.
Change in Per Pupil Funding Since FY 2003Glencoe-Silver Lake School District*
$(1,500)
$(1,000)
$(500)
$-
$500
$1,000
2003 2004 2005 2006 2007 2008 2009 2010 2011Fiscal Year (FY)
Cha
nge
Sinc
e FY
200
3
LevyRevenueState Aid
Minnesota 2020 - www.mn2020.org Page 120
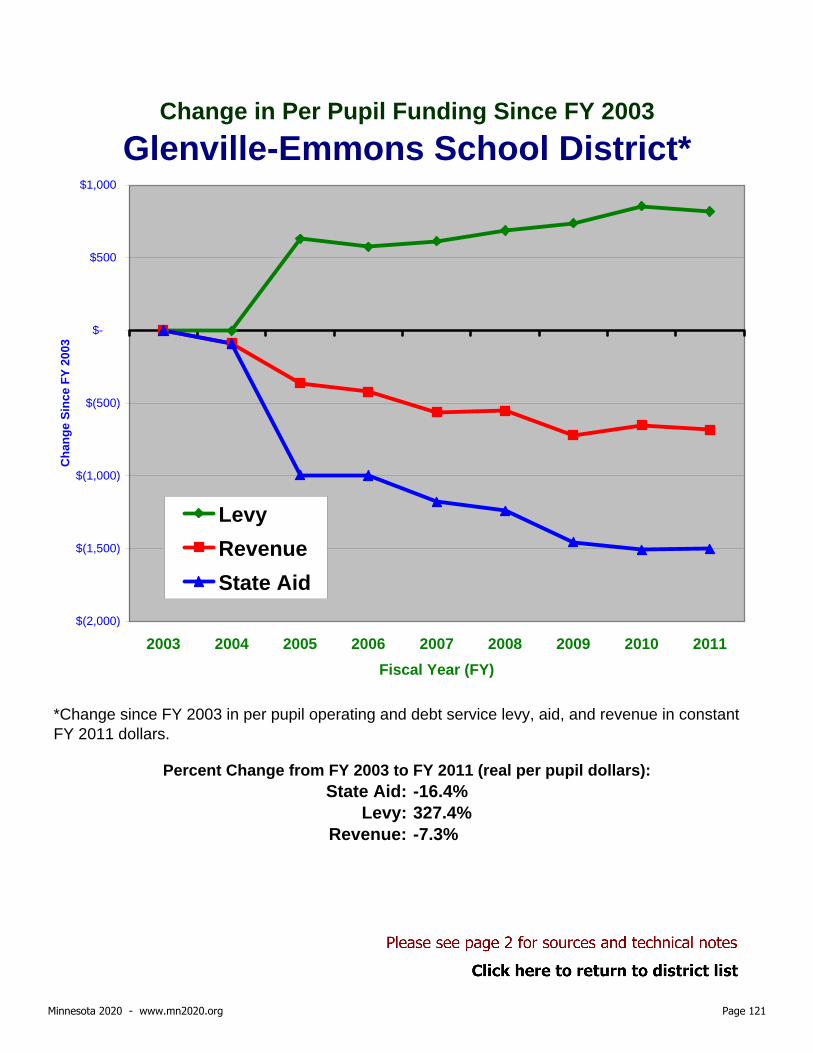
State Aid: -16.4%Levy: 327.4%
Revenue: -7.3%
Percent Change from FY 2003 to FY 2011 (real per pupil dollars):
*Change since FY 2003 in per pupil operating and debt service levy, aid, and revenue in constant FY 2011 dollars.
Change in Per Pupil Funding Since FY 2003Glenville-Emmons School District*
$(2,000)
$(1,500)
$(1,000)
$(500)
$-
$500
$1,000
2003 2004 2005 2006 2007 2008 2009 2010 2011Fiscal Year (FY)
Cha
nge
Sinc
e FY
200
3
LevyRevenueState Aid
Minnesota 2020 - www.mn2020.org Page 121

State Aid: -16.0%Levy: 33.1%
Revenue: -11.2%
Percent Change from FY 2003 to FY 2011 (real per pupil dollars):
*Change since FY 2003 in per pupil operating and debt service levy, aid, and revenue in constant FY 2011 dollars.
Change in Per Pupil Funding Since FY 2003Goodhue School District*
$(1,600)
$(1,400)
$(1,200)
$(1,000)
$(800)
$(600)
$(400)
$(200)
$-
$200
$400
$600
2003 2004 2005 2006 2007 2008 2009 2010 2011Fiscal Year (FY)
Cha
nge
Sinc
e FY
200
3
LevyRevenueState Aid
Minnesota 2020 - www.mn2020.org Page 122
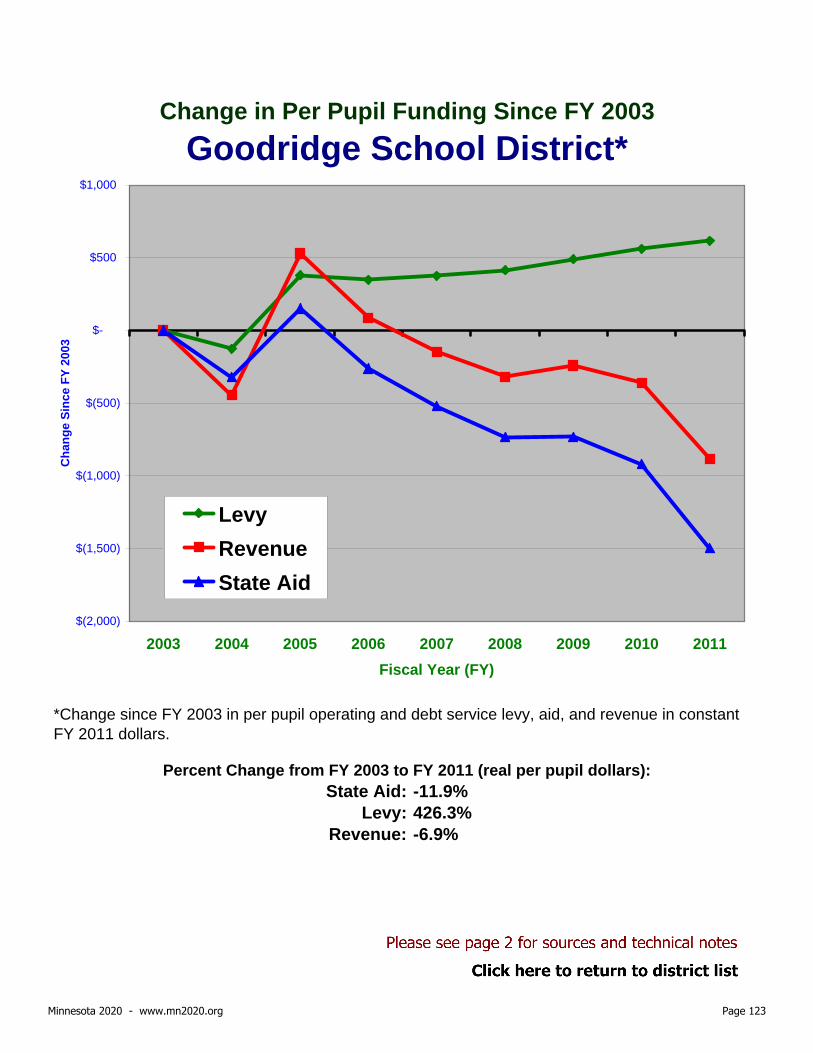
State Aid: -11.9%Levy: 426.3%
Revenue: -6.9%
Percent Change from FY 2003 to FY 2011 (real per pupil dollars):
*Change since FY 2003 in per pupil operating and debt service levy, aid, and revenue in constant FY 2011 dollars.
Change in Per Pupil Funding Since FY 2003Goodridge School District*
$(2,000)
$(1,500)
$(1,000)
$(500)
$-
$500
$1,000
2003 2004 2005 2006 2007 2008 2009 2010 2011Fiscal Year (FY)
Cha
nge
Sinc
e FY
200
3
LevyRevenueState Aid
Minnesota 2020 - www.mn2020.org Page 123

State Aid: -6.4%Levy: 406.5%
Revenue: 14.9%
Percent Change from FY 2003 to FY 2011 (real per pupil dollars):
*Change since FY 2003 in per pupil operating and debt service levy, aid, and revenue in constant FY 2011 dollars.
Change in Per Pupil Funding Since FY 2003Granada-Huntley-East Chain School District*
$(1,500)
$(1,000)
$(500)
$-
$500
$1,000
$1,500
$2,000
$2,500
$3,000
2003 2004 2005 2006 2007 2008 2009 2010 2011Fiscal Year (FY)
Cha
nge
Sinc
e FY
200
3
LevyRevenueState Aid
Minnesota 2020 - www.mn2020.org Page 124
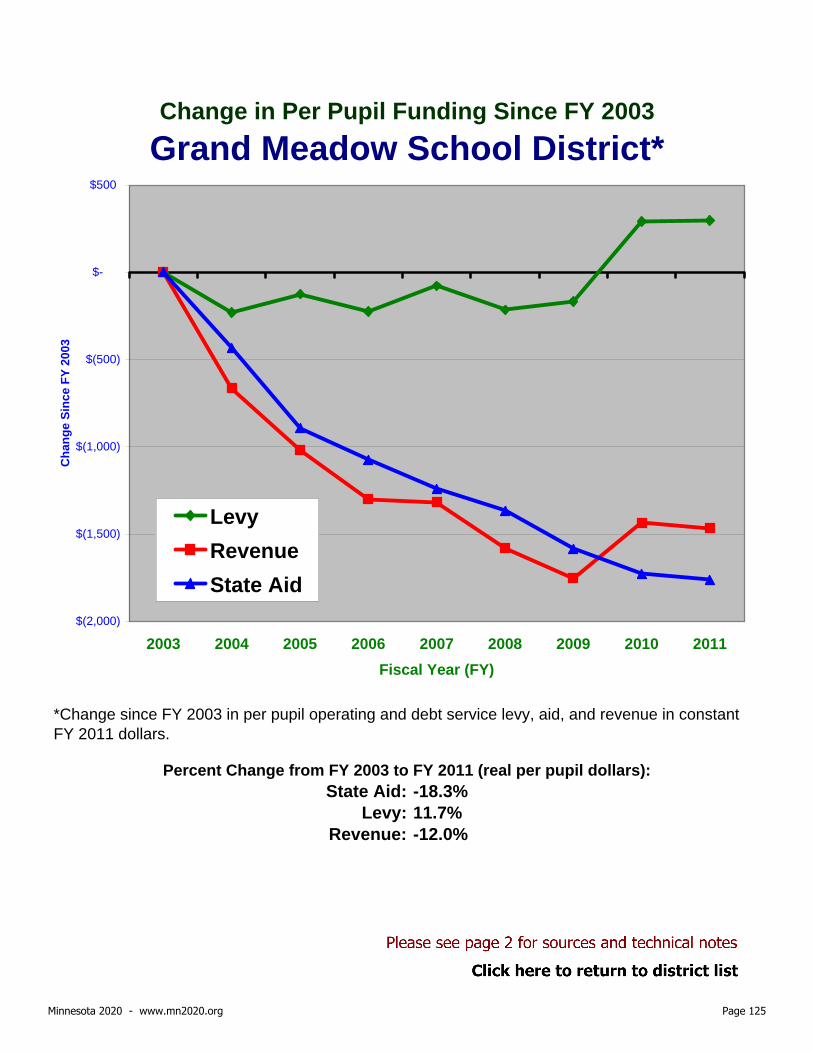
State Aid: -18.3%Levy: 11.7%
Revenue: -12.0%
Percent Change from FY 2003 to FY 2011 (real per pupil dollars):
*Change since FY 2003 in per pupil operating and debt service levy, aid, and revenue in constant FY 2011 dollars.
Change in Per Pupil Funding Since FY 2003Grand Meadow School District*
$(2,000)
$(1,500)
$(1,000)
$(500)
$-
$500
2003 2004 2005 2006 2007 2008 2009 2010 2011Fiscal Year (FY)
Cha
nge
Sinc
e FY
200
3
LevyRevenueState Aid
Minnesota 2020 - www.mn2020.org Page 125

State Aid: -18.6%Levy: -17.6%
Revenue: -18.5%
Percent Change from FY 2003 to FY 2011 (real per pupil dollars):
*Change since FY 2003 in per pupil operating and debt service levy, aid, and revenue in constant FY 2011 dollars.
Change in Per Pupil Funding Since FY 2003Grand Rapids School District*
$(2,500)
$(2,000)
$(1,500)
$(1,000)
$(500)
$-
$500
2003 2004 2005 2006 2007 2008 2009 2010 2011Fiscal Year (FY)
Cha
nge
Sinc
e FY
200
3
LevyRevenueState Aid
Minnesota 2020 - www.mn2020.org Page 126

State Aid: -14.5%Levy: 63.2%
Revenue: -11.9%
Percent Change from FY 2003 to FY 2011 (real per pupil dollars):
*Change since FY 2003 in per pupil operating and debt service levy, aid, and revenue in constant FY 2011 dollars.
Change in Per Pupil Funding Since FY 2003Greenbush-Middle River School District*
$(2,000)
$(1,500)
$(1,000)
$(500)
$-
$500
2003 2004 2005 2006 2007 2008 2009 2010 2011Fiscal Year (FY)
Cha
nge
Sinc
e FY
200
3
LevyRevenueState Aid
Minnesota 2020 - www.mn2020.org Page 127

State Aid: -16.4%Levy: 27.2%
Revenue: -13.5%
Percent Change from FY 2003 to FY 2011 (real per pupil dollars):
*Change since FY 2003 in per pupil operating and debt service levy, aid, and revenue in constant FY 2011 dollars.
Change in Per Pupil Funding Since FY 2003Greenway School District*
$(2,000)
$(1,500)
$(1,000)
$(500)
$-
$500
$1,000
2003 2004 2005 2006 2007 2008 2009 2010 2011Fiscal Year (FY)
Cha
nge
Sinc
e FY
200
3
LevyRevenueState Aid
Minnesota 2020 - www.mn2020.org Page 128

State Aid: -9.9%Levy: 40.3%
Revenue: -7.6%
Percent Change from FY 2003 to FY 2011 (real per pupil dollars):
*Change since FY 2003 in per pupil operating and debt service levy, aid, and revenue in constant FY 2011 dollars.
Change in Per Pupil Funding Since FY 2003Grygla-Gatzke School District*
$(1,400)
$(1,200)
$(1,000)
$(800)
$(600)
$(400)
$(200)
$-
$200
$400
2003 2004 2005 2006 2007 2008 2009 2010 2011Fiscal Year (FY)
Cha
nge
Sinc
e FY
200
3
LevyRevenueState Aid
Minnesota 2020 - www.mn2020.org Page 129

State Aid: -18.7%Levy: 40.7%
Revenue: -11.4%
Percent Change from FY 2003 to FY 2011 (real per pupil dollars):
*Change since FY 2003 in per pupil operating and debt service levy, aid, and revenue in constant FY 2011 dollars.
Change in Per Pupil Funding Since FY 2003Hancock School District*
$(2,000)
$(1,500)
$(1,000)
$(500)
$-
$500
$1,000
2003 2004 2005 2006 2007 2008 2009 2010 2011Fiscal Year (FY)
Cha
nge
Sinc
e FY
200
3
LevyRevenueState Aid
Minnesota 2020 - www.mn2020.org Page 130

State Aid: -15.9%Levy: 174.7%
Revenue: 5.6%
Percent Change from FY 2003 to FY 2011 (real per pupil dollars):
*Change since FY 2003 in per pupil operating and debt service levy, aid, and revenue in constant FY 2011 dollars.
Change in Per Pupil Funding Since FY 2003Hastings School District*
$(2,000)
$(1,500)
$(1,000)
$(500)
$-
$500
$1,000
$1,500
$2,000
$2,500
2003 2004 2005 2006 2007 2008 2009 2010 2011Fiscal Year (FY)
Cha
nge
Sinc
e FY
200
3
LevyRevenueState Aid
Minnesota 2020 - www.mn2020.org Page 131

State Aid: -18.8%Levy: 132.4%
Revenue: -9.1%
Percent Change from FY 2003 to FY 2011 (real per pupil dollars):
*Change since FY 2003 in per pupil operating and debt service levy, aid, and revenue in constant FY 2011 dollars.
Change in Per Pupil Funding Since FY 2003Hawley School District*
$(2,000)
$(1,500)
$(1,000)
$(500)
$-
$500
$1,000
2003 2004 2005 2006 2007 2008 2009 2010 2011Fiscal Year (FY)
Cha
nge
Sinc
e FY
200
3
LevyRevenueState Aid
Minnesota 2020 - www.mn2020.org Page 132

State Aid: -7.8%Levy: 77.1%
Revenue: 0.2%
Percent Change from FY 2003 to FY 2011 (real per pupil dollars):
*Change since FY 2003 in per pupil operating and debt service levy, aid, and revenue in constant FY 2011 dollars.
Change in Per Pupil Funding Since FY 2003Hayfield School District*
$(800)
$(600)
$(400)
$(200)
$-
$200
$400
$600
$800
2003 2004 2005 2006 2007 2008 2009 2010 2011Fiscal Year (FY)
Cha
nge
Sinc
e FY
200
3
LevyRevenueState Aid
Minnesota 2020 - www.mn2020.org Page 133

State Aid: -12.4%Levy: 510.0%
Revenue: 2.3%
Percent Change from FY 2003 to FY 2011 (real per pupil dollars):
*Change since FY 2003 in per pupil operating and debt service levy, aid, and revenue in constant FY 2011 dollars.
Change in Per Pupil Funding Since FY 2003Hendricks School District*
$(1,500)
$(1,000)
$(500)
$-
$500
$1,000
$1,500
$2,000
2003 2004 2005 2006 2007 2008 2009 2010 2011Fiscal Year (FY)
Cha
nge
Sinc
e FY
200
3
LevyRevenueState Aid
Minnesota 2020 - www.mn2020.org Page 134

State Aid: -18.8%Levy: 48.6%
Revenue: -7.7%
Percent Change from FY 2003 to FY 2011 (real per pupil dollars):
*Change since FY 2003 in per pupil operating and debt service levy, aid, and revenue in constant FY 2011 dollars.
Change in Per Pupil Funding Since FY 2003Henning School District*
$(2,000)
$(1,500)
$(1,000)
$(500)
$-
$500
$1,000
$1,500
2003 2004 2005 2006 2007 2008 2009 2010 2011Fiscal Year (FY)
Cha
nge
Sinc
e FY
200
3
LevyRevenueState Aid
Minnesota 2020 - www.mn2020.org Page 135
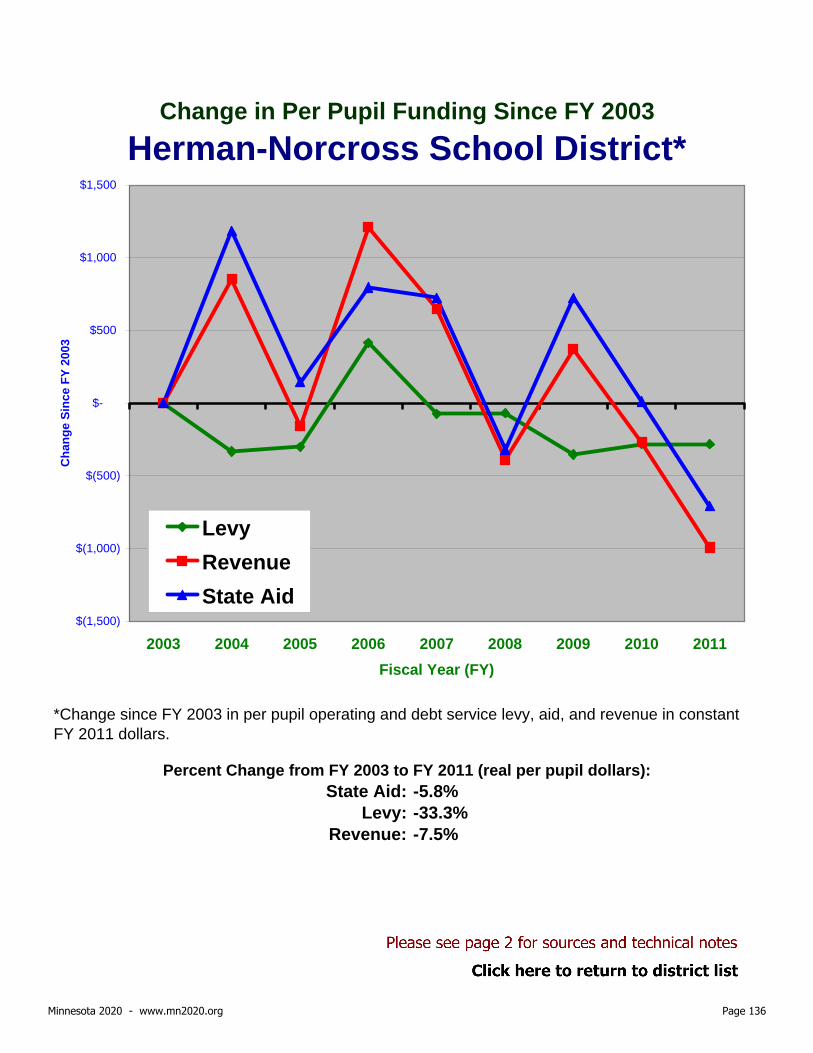
State Aid: -5.8%Levy: -33.3%
Revenue: -7.5%
Percent Change from FY 2003 to FY 2011 (real per pupil dollars):
*Change since FY 2003 in per pupil operating and debt service levy, aid, and revenue in constant FY 2011 dollars.
Change in Per Pupil Funding Since FY 2003Herman-Norcross School District*
$(1,500)
$(1,000)
$(500)
$-
$500
$1,000
$1,500
2003 2004 2005 2006 2007 2008 2009 2010 2011Fiscal Year (FY)
Cha
nge
Sinc
e FY
200
3
LevyRevenueState Aid
Minnesota 2020 - www.mn2020.org Page 136

State Aid: -17.6%Levy: 0.0%
Revenue: -16.0%
Percent Change from FY 2003 to FY 2011 (real per pupil dollars):
*Change since FY 2003 in per pupil operating and debt service levy, aid, and revenue in constant FY 2011 dollars.
Change in Per Pupil Funding Since FY 2003Hermantown School District*
$(1,600)
$(1,400)
$(1,200)
$(1,000)
$(800)
$(600)
$(400)
$(200)
$-
$200
2003 2004 2005 2006 2007 2008 2009 2010 2011Fiscal Year (FY)
Cha
nge
Sinc
e FY
200
3
LevyRevenueState Aid
Minnesota 2020 - www.mn2020.org Page 137

State Aid: -14.1%Levy: 86.0%
Revenue: -1.2%
Percent Change from FY 2003 to FY 2011 (real per pupil dollars):
*Change since FY 2003 in per pupil operating and debt service levy, aid, and revenue in constant FY 2011 dollars.
Change in Per Pupil Funding Since FY 2003Heron Lake-Okabena School District*
$(2,000)
$(1,500)
$(1,000)
$(500)
$-
$500
$1,000
$1,500
2003 2004 2005 2006 2007 2008 2009 2010 2011Fiscal Year (FY)
Cha
nge
Sinc
e FY
200
3
LevyRevenueState Aid
Minnesota 2020 - www.mn2020.org Page 138

State Aid: -11.0%Levy: 640.8%
Revenue: -0.6%
Percent Change from FY 2003 to FY 2011 (real per pupil dollars):
*Change since FY 2003 in per pupil operating and debt service levy, aid, and revenue in constant FY 2011 dollars.
Change in Per Pupil Funding Since FY 2003Hibbing School District*
$(1,500)
$(1,000)
$(500)
$-
$500
$1,000
$1,500
2003 2004 2005 2006 2007 2008 2009 2010 2011Fiscal Year (FY)
Cha
nge
Sinc
e FY
200
3
LevyRevenueState Aid
Minnesota 2020 - www.mn2020.org Page 139

State Aid: -9.3%Levy: 103.2%
Revenue: 0.7%
Percent Change from FY 2003 to FY 2011 (real per pupil dollars):
*Change since FY 2003 in per pupil operating and debt service levy, aid, and revenue in constant FY 2011 dollars.
Change in Per Pupil Funding Since FY 2003Hill City School District*
$(1,500)
$(1,000)
$(500)
$-
$500
$1,000
$1,500
2003 2004 2005 2006 2007 2008 2009 2010 2011Fiscal Year (FY)
Cha
nge
Sinc
e FY
200
3
LevyRevenueState Aid
Minnesota 2020 - www.mn2020.org Page 140

State Aid: -13.1%Levy: 43.5%
Revenue: -8.2%
Percent Change from FY 2003 to FY 2011 (real per pupil dollars):
*Change since FY 2003 in per pupil operating and debt service levy, aid, and revenue in constant FY 2011 dollars.
Change in Per Pupil Funding Since FY 2003Hills-Beaver Creek School District*
$(1,400)
$(1,200)
$(1,000)
$(800)
$(600)
$(400)
$(200)
$-
$200
$400
$600
2003 2004 2005 2006 2007 2008 2009 2010 2011Fiscal Year (FY)
Cha
nge
Sinc
e FY
200
3
LevyRevenueState Aid
Minnesota 2020 - www.mn2020.org Page 141

State Aid: -10.4%Levy: 159.8%
Revenue: 0.1%
Percent Change from FY 2003 to FY 2011 (real per pupil dollars):
*Change since FY 2003 in per pupil operating and debt service levy, aid, and revenue in constant FY 2011 dollars.
Change in Per Pupil Funding Since FY 2003Hinckley-Finlayson School District*
$(1,500)
$(1,000)
$(500)
$-
$500
$1,000
$1,500
2003 2004 2005 2006 2007 2008 2009 2010 2011Fiscal Year (FY)
Cha
nge
Sinc
e FY
200
3
LevyRevenueState Aid
Minnesota 2020 - www.mn2020.org Page 142

State Aid: -21.7%Levy: 55.3%
Revenue: -13.9%
Percent Change from FY 2003 to FY 2011 (real per pupil dollars):
*Change since FY 2003 in per pupil operating and debt service levy, aid, and revenue in constant FY 2011 dollars.
Change in Per Pupil Funding Since FY 2003Holdingford School District*
$(2,500)
$(2,000)
$(1,500)
$(1,000)
$(500)
$-
$500
$1,000
2003 2004 2005 2006 2007 2008 2009 2010 2011Fiscal Year (FY)
Cha
nge
Sinc
e FY
200
3
LevyRevenueState Aid
Minnesota 2020 - www.mn2020.org Page 143

State Aid: -10.2%Levy: 37.1%
Revenue: 3.6%
Percent Change from FY 2003 to FY 2011 (real per pupil dollars):
*Change since FY 2003 in per pupil operating and debt service levy, aid, and revenue in constant FY 2011 dollars.
Change in Per Pupil Funding Since FY 2003Hopkins School District*
$(1,500)
$(1,000)
$(500)
$-
$500
$1,000
$1,500
2003 2004 2005 2006 2007 2008 2009 2010 2011Fiscal Year (FY)
Cha
nge
Sinc
e FY
200
3
LevyRevenueState Aid
Minnesota 2020 - www.mn2020.org Page 144

State Aid: -13.5%Levy: 99.5%
Revenue: -10.1%
Percent Change from FY 2003 to FY 2011 (real per pupil dollars):
*Change since FY 2003 in per pupil operating and debt service levy, aid, and revenue in constant FY 2011 dollars.
Change in Per Pupil Funding Since FY 2003Houston School District*
$(1,400)
$(1,200)
$(1,000)
$(800)
$(600)
$(400)
$(200)
$-
$200
$400
$600
$800
2003 2004 2005 2006 2007 2008 2009 2010 2011Fiscal Year (FY)
Cha
nge
Sinc
e FY
200
3
LevyRevenueState Aid
Minnesota 2020 - www.mn2020.org Page 145

State Aid: -15.2%Levy: 1737.7%
Revenue: 17.5%
Percent Change from FY 2003 to FY 2011 (real per pupil dollars):
*Change since FY 2003 in per pupil operating and debt service levy, aid, and revenue in constant FY 2011 dollars.
Change in Per Pupil Funding Since FY 2003Howard Lake-Waverly-Winsted School District*
$(2,000)
$(1,500)
$(1,000)
$(500)
$-
$500
$1,000
$1,500
$2,000
$2,500
$3,000
$3,500
2003 2004 2005 2006 2007 2008 2009 2010 2011Fiscal Year (FY)
Cha
nge
Sinc
e FY
200
3
LevyRevenueState Aid
Minnesota 2020 - www.mn2020.org Page 146

State Aid: -12.0%Levy: 44.8%
Revenue: -5.7%
Percent Change from FY 2003 to FY 2011 (real per pupil dollars):
*Change since FY 2003 in per pupil operating and debt service levy, aid, and revenue in constant FY 2011 dollars.
Change in Per Pupil Funding Since FY 2003Hutchinson School District*
$(1,200)
$(1,000)
$(800)
$(600)
$(400)
$(200)
$-
$200
$400
$600
2003 2004 2005 2006 2007 2008 2009 2010 2011Fiscal Year (FY)
Cha
nge
Sinc
e FY
200
3
LevyRevenueState Aid
Minnesota 2020 - www.mn2020.org Page 147

State Aid: -14.6%Levy: 57.1%
Revenue: -8.5%
Percent Change from FY 2003 to FY 2011 (real per pupil dollars):
*Change since FY 2003 in per pupil operating and debt service levy, aid, and revenue in constant FY 2011 dollars.
Change in Per Pupil Funding Since FY 2003International Falls School District*
$(1,500)
$(1,000)
$(500)
$-
$500
$1,000
2003 2004 2005 2006 2007 2008 2009 2010 2011Fiscal Year (FY)
Cha
nge
Sinc
e FY
200
3
LevyRevenueState Aid
Minnesota 2020 - www.mn2020.org Page 148

State Aid: -15.1%Levy: 76.9%
Revenue: -3.1%
Percent Change from FY 2003 to FY 2011 (real per pupil dollars):
*Change since FY 2003 in per pupil operating and debt service levy, aid, and revenue in constant FY 2011 dollars.
Change in Per Pupil Funding Since FY 2003Inver Grove-Pine Bend School District*
$(2,000)
$(1,500)
$(1,000)
$(500)
$-
$500
$1,000
$1,500
2003 2004 2005 2006 2007 2008 2009 2010 2011Fiscal Year (FY)
Cha
nge
Sinc
e FY
200
3
LevyRevenueState Aid
Minnesota 2020 - www.mn2020.org Page 149

State Aid: -15.0%Levy: 4.4%
Revenue: -12.1%
Percent Change from FY 2003 to FY 2011 (real per pupil dollars):
*Change since FY 2003 in per pupil operating and debt service levy, aid, and revenue in constant FY 2011 dollars.
Change in Per Pupil Funding Since FY 2003Isle School District*
$(1,600)
$(1,400)
$(1,200)
$(1,000)
$(800)
$(600)
$(400)
$(200)
$-
$200
2003 2004 2005 2006 2007 2008 2009 2010 2011Fiscal Year (FY)
Cha
nge
Sinc
e FY
200
3 LevyRevenueState Aid
Minnesota 2020 - www.mn2020.org Page 150

State Aid: -9.1%Levy: 1671.6%
Revenue: 41.4%
Percent Change from FY 2003 to FY 2011 (real per pupil dollars):
*Change since FY 2003 in per pupil operating and debt service levy, aid, and revenue in constant FY 2011 dollars.
Change in Per Pupil Funding Since FY 2003Ivanhoe School District*
$(2,000)
$(1,000)
$-
$1,000
$2,000
$3,000
$4,000
$5,000
$6,000
2003 2004 2005 2006 2007 2008 2009 2010 2011Fiscal Year (FY)
Cha
nge
Sinc
e FY
200
3
LevyRevenueState Aid
Minnesota 2020 - www.mn2020.org Page 151

State Aid: -13.1%Levy: 47.5%
Revenue: -3.6%
Percent Change from FY 2003 to FY 2011 (real per pupil dollars):
*Change since FY 2003 in per pupil operating and debt service levy, aid, and revenue in constant FY 2011 dollars.
Change in Per Pupil Funding Since FY 2003Jackson County Central School District*
$(1,500)
$(1,000)
$(500)
$-
$500
$1,000
2003 2004 2005 2006 2007 2008 2009 2010 2011Fiscal Year (FY)
Cha
nge
Sinc
e FY
200
3
LevyRevenueState Aid
Minnesota 2020 - www.mn2020.org Page 152

State Aid: -19.7%Levy: 25.7%
Revenue: -10.8%
Percent Change from FY 2003 to FY 2011 (real per pupil dollars):
*Change since FY 2003 in per pupil operating and debt service levy, aid, and revenue in constant FY 2011 dollars.
Change in Per Pupil Funding Since FY 2003Janesville-Waldorf-Pemberton School District*
$(2,500)
$(2,000)
$(1,500)
$(1,000)
$(500)
$-
$500
$1,000
2003 2004 2005 2006 2007 2008 2009 2010 2011Fiscal Year (FY)
Cha
nge
Sinc
e FY
200
3
LevyRevenueState Aid
Minnesota 2020 - www.mn2020.org Page 153
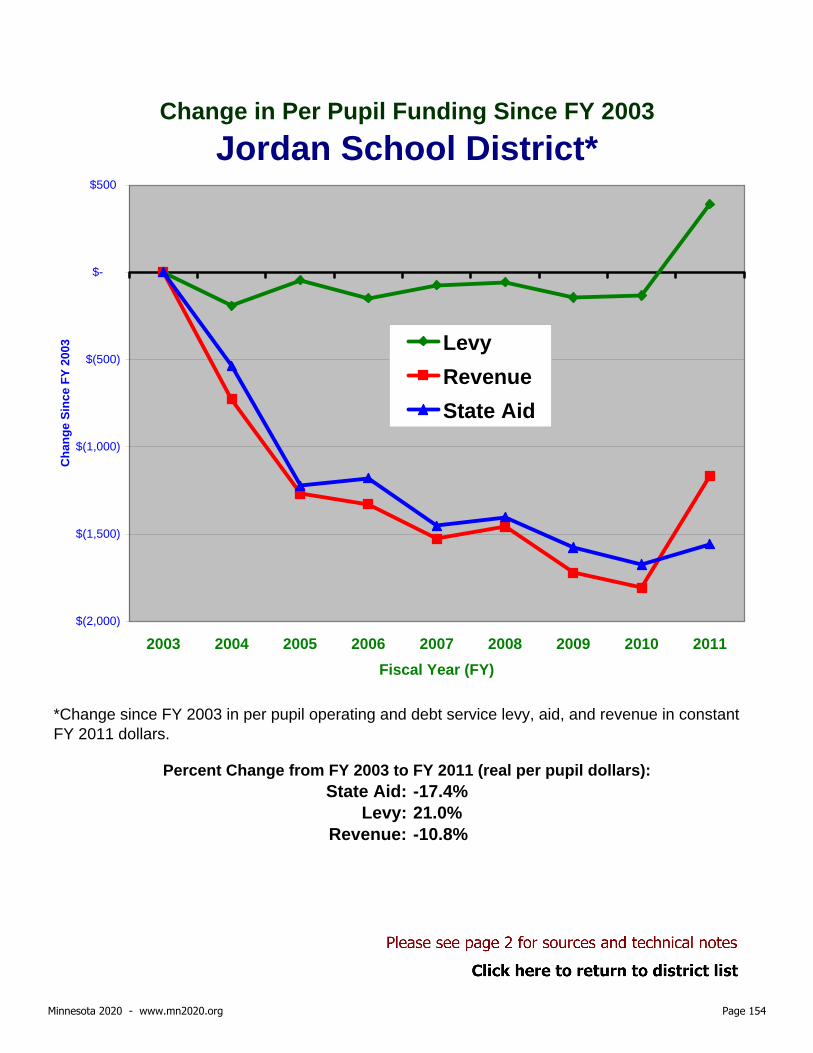
State Aid: -17.4%Levy: 21.0%
Revenue: -10.8%
Percent Change from FY 2003 to FY 2011 (real per pupil dollars):
*Change since FY 2003 in per pupil operating and debt service levy, aid, and revenue in constant FY 2011 dollars.
Change in Per Pupil Funding Since FY 2003Jordan School District*
$(2,000)
$(1,500)
$(1,000)
$(500)
$-
$500
2003 2004 2005 2006 2007 2008 2009 2010 2011Fiscal Year (FY)
Cha
nge
Sinc
e FY
200
3 LevyRevenueState Aid
Minnesota 2020 - www.mn2020.org Page 154

State Aid: -13.8%Levy: 98.9%
Revenue: -4.4%
Percent Change from FY 2003 to FY 2011 (real per pupil dollars):
*Change since FY 2003 in per pupil operating and debt service levy, aid, and revenue in constant FY 2011 dollars.
Change in Per Pupil Funding Since FY 2003Kasson-Mantorville School District*
$(1,500)
$(1,000)
$(500)
$-
$500
$1,000
2003 2004 2005 2006 2007 2008 2009 2010 2011Fiscal Year (FY)
Cha
nge
Sinc
e FY
200
3
LevyRevenueState Aid
Minnesota 2020 - www.mn2020.org Page 155

State Aid: -16.8%Levy: 181.3%
Revenue: -6.4%
Percent Change from FY 2003 to FY 2011 (real per pupil dollars):
*Change since FY 2003 in per pupil operating and debt service levy, aid, and revenue in constant FY 2011 dollars.
Change in Per Pupil Funding Since FY 2003Kelliher School District*
$(3,000)
$(2,500)
$(2,000)
$(1,500)
$(1,000)
$(500)
$-
$500
$1,000
$1,500
$2,000
2003 2004 2005 2006 2007 2008 2009 2010 2011Fiscal Year (FY)
Cha
nge
Sinc
e FY
200
3
LevyRevenueState Aid
Minnesota 2020 - www.mn2020.org Page 156

State Aid: -13.7%Levy: 49.0%
Revenue: -3.4%
Percent Change from FY 2003 to FY 2011 (real per pupil dollars):
*Change since FY 2003 in per pupil operating and debt service levy, aid, and revenue in constant FY 2011 dollars.
Change in Per Pupil Funding Since FY 2003Kenyon-Wanamingo School District*
$(1,500)
$(1,000)
$(500)
$-
$500
$1,000
2003 2004 2005 2006 2007 2008 2009 2010 2011Fiscal Year (FY)
Cha
nge
Sinc
e FY
200
3
LevyRevenueState Aid
Minnesota 2020 - www.mn2020.org Page 157

State Aid: -11.0%Levy: 35.9%
Revenue: -5.3%
Percent Change from FY 2003 to FY 2011 (real per pupil dollars):
*Change since FY 2003 in per pupil operating and debt service levy, aid, and revenue in constant FY 2011 dollars.
Change in Per Pupil Funding Since FY 2003Kerkhoven-Murdock-Sunburg School District*
$(1,400)
$(1,200)
$(1,000)
$(800)
$(600)
$(400)
$(200)
$-
$200
$400
$600
2003 2004 2005 2006 2007 2008 2009 2010 2011Fiscal Year (FY)
Cha
nge
Sinc
e FY
200
3
LevyRevenueState Aid
Minnesota 2020 - www.mn2020.org Page 158

State Aid: -16.0%Levy: 24.1%
Revenue: -10.4%
Percent Change from FY 2003 to FY 2011 (real per pupil dollars):
*Change since FY 2003 in per pupil operating and debt service levy, aid, and revenue in constant FY 2011 dollars.
Change in Per Pupil Funding Since FY 2003Kimball School District*
$(1,500)
$(1,000)
$(500)
$-
$500
$1,000
2003 2004 2005 2006 2007 2008 2009 2010 2011Fiscal Year (FY)
Cha
nge
Sinc
e FY
200
3
LevyRevenueState Aid
Minnesota 2020 - www.mn2020.org Page 159

State Aid: -18.6%Levy: 441.1%
Revenue: -0.1%
Percent Change from FY 2003 to FY 2011 (real per pupil dollars):
*Change since FY 2003 in per pupil operating and debt service levy, aid, and revenue in constant FY 2011 dollars.
Change in Per Pupil Funding Since FY 2003Kingsland School District*
$(2,000)
$(1,500)
$(1,000)
$(500)
$-
$500
$1,000
$1,500
$2,000
2003 2004 2005 2006 2007 2008 2009 2010 2011Fiscal Year (FY)
Cha
nge
Sinc
e FY
200
3
LevyRevenueState Aid
Minnesota 2020 - www.mn2020.org Page 160

State Aid: 0.2%Levy: 25.1%
Revenue: 4.8%
Percent Change from FY 2003 to FY 2011 (real per pupil dollars):
*Change since FY 2003 in per pupil operating and debt service levy, aid, and revenue in constant FY 2011 dollars.
Change in Per Pupil Funding Since FY 2003Kittson Central School District*
$(400)
$(200)
$-
$200
$400
$600
$800
$1,000
$1,200
$1,400
$1,600
2003 2004 2005 2006 2007 2008 2009 2010 2011Fiscal Year (FY)
Cha
nge
Sinc
e FY
200
3
LevyRevenueState Aid
Minnesota 2020 - www.mn2020.org Page 161

State Aid: -13.1%Levy: 102.8%
Revenue: -4.6%
Percent Change from FY 2003 to FY 2011 (real per pupil dollars):
*Change since FY 2003 in per pupil operating and debt service levy, aid, and revenue in constant FY 2011 dollars.
Change in Per Pupil Funding Since FY 2003Lac Qui Parle Valley School District*
$(1,500)
$(1,000)
$(500)
$-
$500
$1,000
2003 2004 2005 2006 2007 2008 2009 2010 2011Fiscal Year (FY)
Cha
nge
Sinc
e FY
200
3
LevyRevenueState Aid
Minnesota 2020 - www.mn2020.org Page 162

State Aid: -11.6%Levy: 129.6%
Revenue: -1.5%
Percent Change from FY 2003 to FY 2011 (real per pupil dollars):
*Change since FY 2003 in per pupil operating and debt service levy, aid, and revenue in constant FY 2011 dollars.
Change in Per Pupil Funding Since FY 2003LaCrescent-Hokah School District*
$(1,500)
$(1,000)
$(500)
$-
$500
$1,000
2003 2004 2005 2006 2007 2008 2009 2010 2011Fiscal Year (FY)
Cha
nge
Sinc
e FY
200
3
LevyRevenueState Aid
Minnesota 2020 - www.mn2020.org Page 163
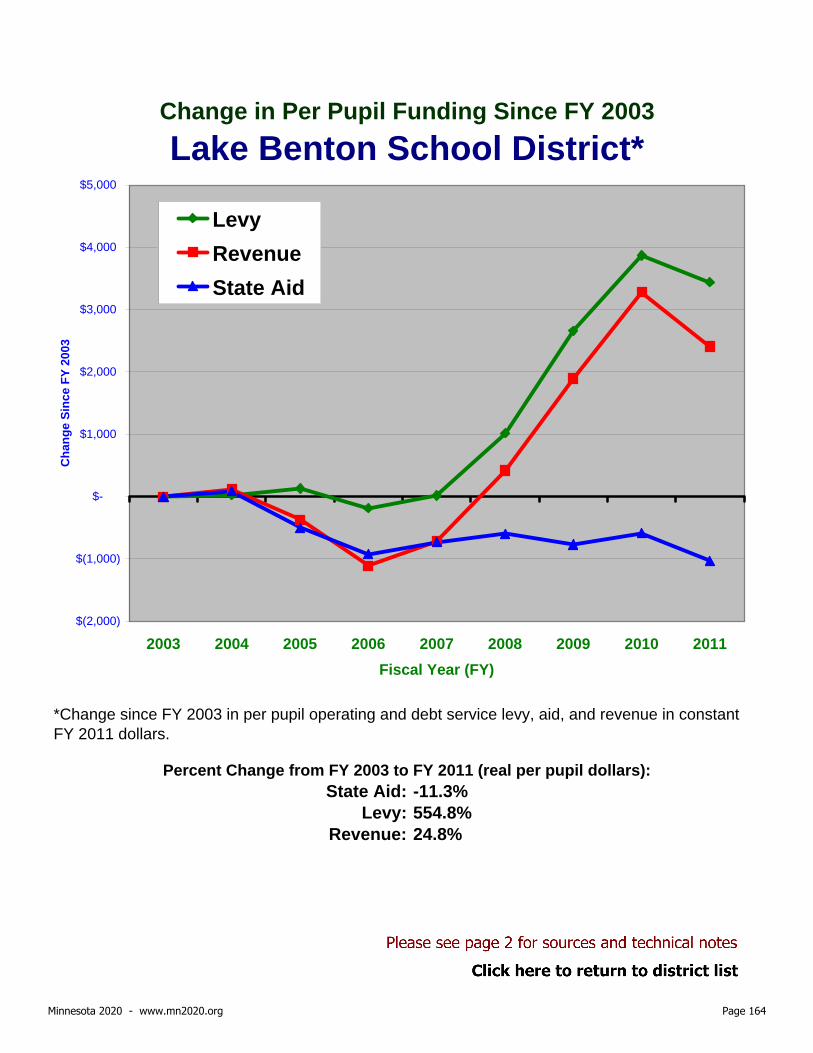
State Aid: -11.3%Levy: 554.8%
Revenue: 24.8%
Percent Change from FY 2003 to FY 2011 (real per pupil dollars):
*Change since FY 2003 in per pupil operating and debt service levy, aid, and revenue in constant FY 2011 dollars.
Change in Per Pupil Funding Since FY 2003Lake Benton School District*
$(2,000)
$(1,000)
$-
$1,000
$2,000
$3,000
$4,000
$5,000
2003 2004 2005 2006 2007 2008 2009 2010 2011Fiscal Year (FY)
Cha
nge
Sinc
e FY
200
3
LevyRevenueState Aid
Minnesota 2020 - www.mn2020.org Page 164

State Aid: -12.6%Levy: 553.2%
Revenue: 7.5%
Percent Change from FY 2003 to FY 2011 (real per pupil dollars):
*Change since FY 2003 in per pupil operating and debt service levy, aid, and revenue in constant FY 2011 dollars.
Change in Per Pupil Funding Since FY 2003Lake City School District*
$(1,500)
$(1,000)
$(500)
$-
$500
$1,000
$1,500
$2,000
2003 2004 2005 2006 2007 2008 2009 2010 2011Fiscal Year (FY)
Cha
nge
Sinc
e FY
200
3
LevyRevenueState Aid
Minnesota 2020 - www.mn2020.org Page 165

State Aid: -12.3%Levy: 417.5%
Revenue: 11.5%
Percent Change from FY 2003 to FY 2011 (real per pupil dollars):
*Change since FY 2003 in per pupil operating and debt service levy, aid, and revenue in constant FY 2011 dollars.
Change in Per Pupil Funding Since FY 2003Lake Crystal-Wellcome-Mem. School District*
$(1,500)
$(1,000)
$(500)
$-
$500
$1,000
$1,500
$2,000
$2,500
$3,000
2003 2004 2005 2006 2007 2008 2009 2010 2011Fiscal Year (FY)
Cha
nge
Sinc
e FY
200
3
LevyRevenueState Aid
Minnesota 2020 - www.mn2020.org Page 166
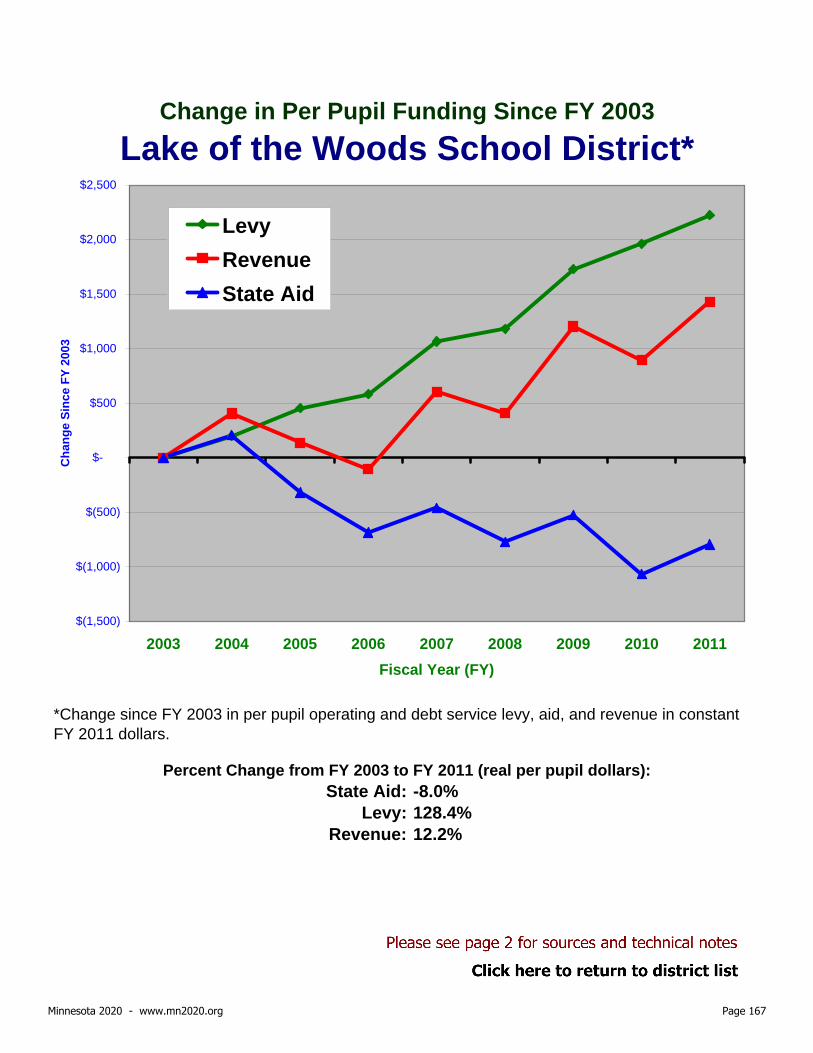
State Aid: -8.0%Levy: 128.4%
Revenue: 12.2%
Percent Change from FY 2003 to FY 2011 (real per pupil dollars):
*Change since FY 2003 in per pupil operating and debt service levy, aid, and revenue in constant FY 2011 dollars.
Change in Per Pupil Funding Since FY 2003Lake of the Woods School District*
$(1,500)
$(1,000)
$(500)
$-
$500
$1,000
$1,500
$2,000
$2,500
2003 2004 2005 2006 2007 2008 2009 2010 2011Fiscal Year (FY)
Cha
nge
Sinc
e FY
200
3
LevyRevenueState Aid
Minnesota 2020 - www.mn2020.org Page 167
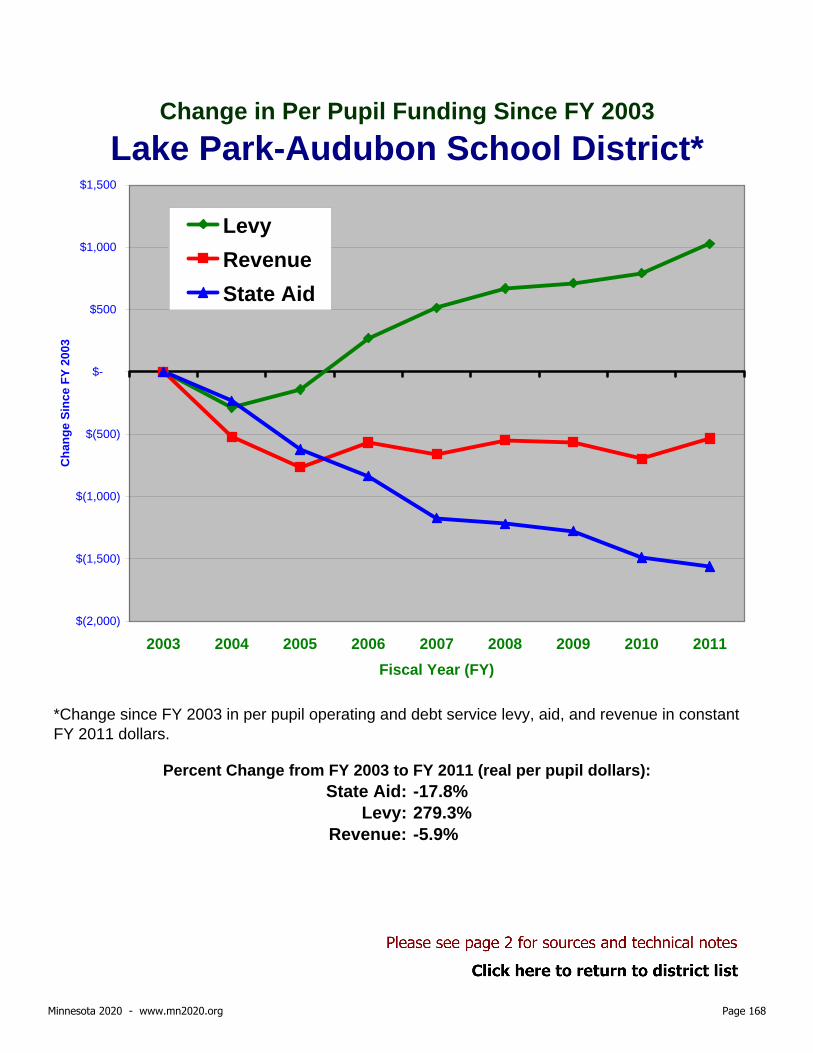
State Aid: -17.8%Levy: 279.3%
Revenue: -5.9%
Percent Change from FY 2003 to FY 2011 (real per pupil dollars):
*Change since FY 2003 in per pupil operating and debt service levy, aid, and revenue in constant FY 2011 dollars.
Change in Per Pupil Funding Since FY 2003Lake Park-Audubon School District*
$(2,000)
$(1,500)
$(1,000)
$(500)
$-
$500
$1,000
$1,500
2003 2004 2005 2006 2007 2008 2009 2010 2011Fiscal Year (FY)
Cha
nge
Sinc
e FY
200
3
LevyRevenueState Aid
Minnesota 2020 - www.mn2020.org Page 168

State Aid: -16.3%Levy: 33.0%
Revenue: -7.9%
Percent Change from FY 2003 to FY 2011 (real per pupil dollars):
*Change since FY 2003 in per pupil operating and debt service levy, aid, and revenue in constant FY 2011 dollars.
Change in Per Pupil Funding Since FY 2003Lake Superior School District*
$(2,000)
$(1,500)
$(1,000)
$(500)
$-
$500
$1,000
2003 2004 2005 2006 2007 2008 2009 2010 2011Fiscal Year (FY)
Cha
nge
Sinc
e FY
200
3
LevyRevenueState Aid
Minnesota 2020 - www.mn2020.org Page 169

State Aid: -12.5%Levy: 31.8%
Revenue: -5.8%
Percent Change from FY 2003 to FY 2011 (real per pupil dollars):
*Change since FY 2003 in per pupil operating and debt service levy, aid, and revenue in constant FY 2011 dollars.
Change in Per Pupil Funding Since FY 2003Lakeview School District*
$(1,400)
$(1,200)
$(1,000)
$(800)
$(600)
$(400)
$(200)
$-
$200
$400
$600
$800
2003 2004 2005 2006 2007 2008 2009 2010 2011Fiscal Year (FY)
Cha
nge
Sinc
e FY
200
3
LevyRevenueState Aid
Minnesota 2020 - www.mn2020.org Page 170
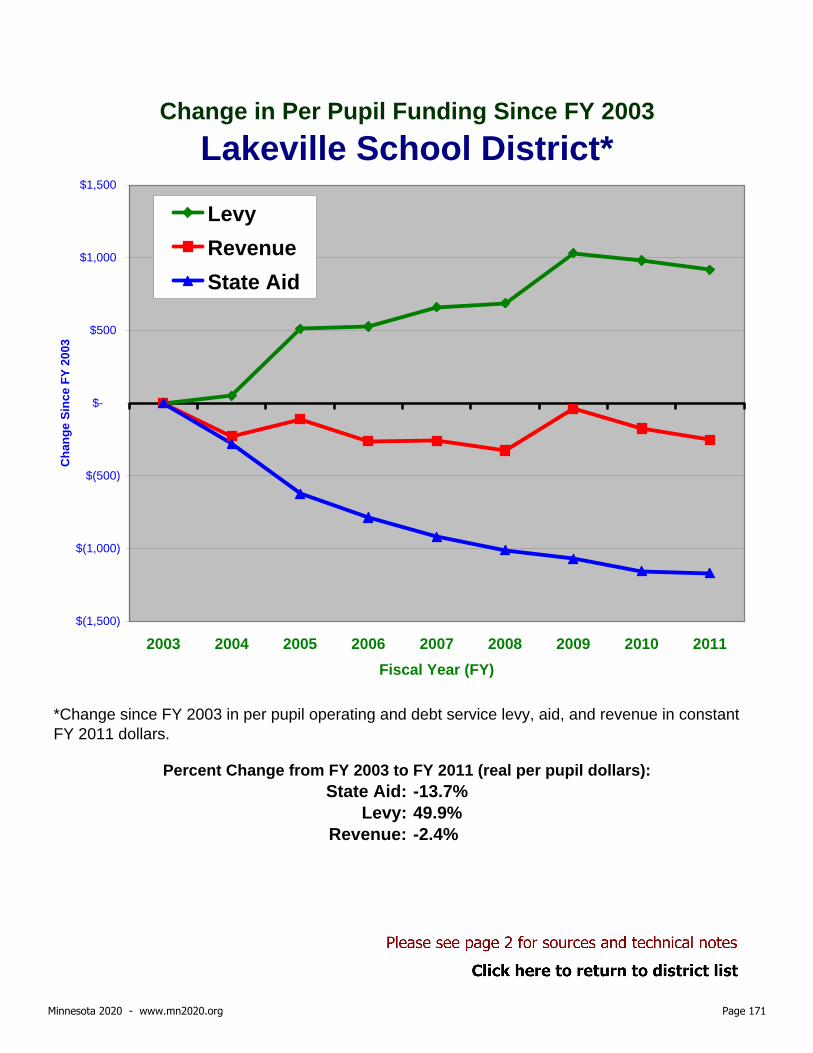
State Aid: -13.7%Levy: 49.9%
Revenue: -2.4%
Percent Change from FY 2003 to FY 2011 (real per pupil dollars):
*Change since FY 2003 in per pupil operating and debt service levy, aid, and revenue in constant FY 2011 dollars.
Change in Per Pupil Funding Since FY 2003Lakeville School District*
$(1,500)
$(1,000)
$(500)
$-
$500
$1,000
$1,500
2003 2004 2005 2006 2007 2008 2009 2010 2011Fiscal Year (FY)
Cha
nge
Sinc
e FY
200
3
LevyRevenueState Aid
Minnesota 2020 - www.mn2020.org Page 171
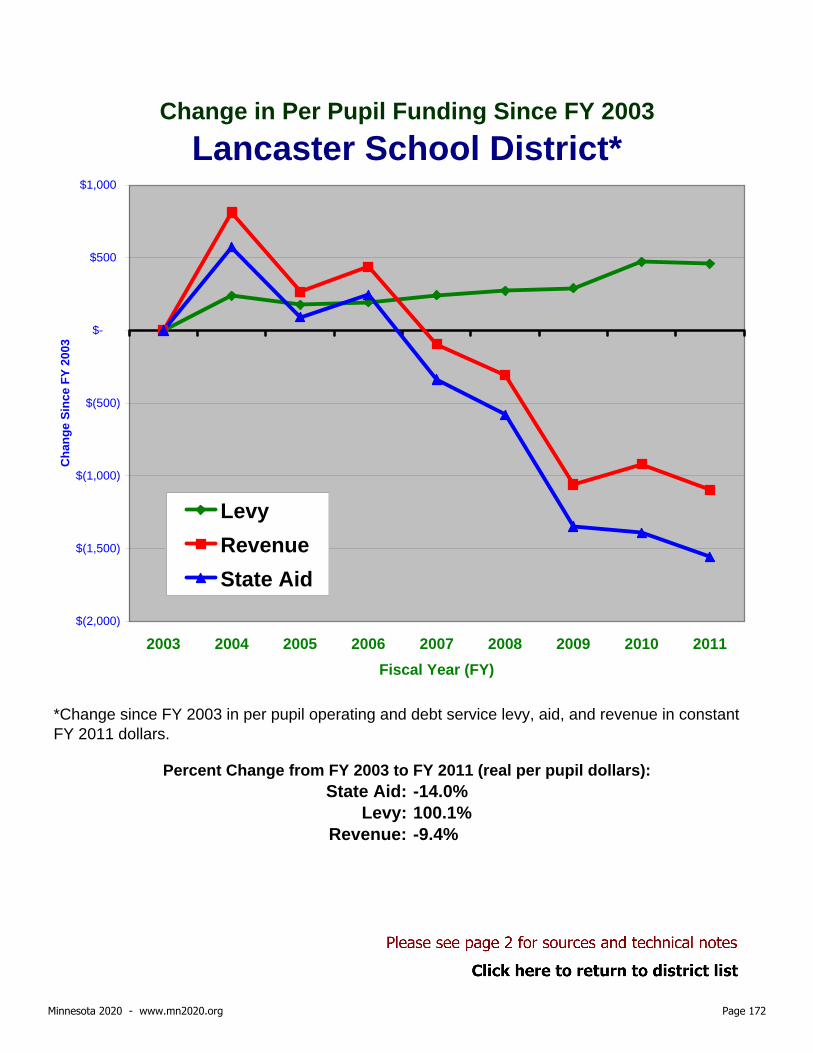
State Aid: -14.0%Levy: 100.1%
Revenue: -9.4%
Percent Change from FY 2003 to FY 2011 (real per pupil dollars):
*Change since FY 2003 in per pupil operating and debt service levy, aid, and revenue in constant FY 2011 dollars.
Change in Per Pupil Funding Since FY 2003Lancaster School District*
$(2,000)
$(1,500)
$(1,000)
$(500)
$-
$500
$1,000
2003 2004 2005 2006 2007 2008 2009 2010 2011Fiscal Year (FY)
Cha
nge
Sinc
e FY
200
3
LevyRevenueState Aid
Minnesota 2020 - www.mn2020.org Page 172

State Aid: -21.5%Levy: 0.3%
Revenue: -18.7%
Percent Change from FY 2003 to FY 2011 (real per pupil dollars):
*Change since FY 2003 in per pupil operating and debt service levy, aid, and revenue in constant FY 2011 dollars.
Change in Per Pupil Funding Since FY 2003Lanesboro School District*
$(2,500)
$(2,000)
$(1,500)
$(1,000)
$(500)
$-
$500
2003 2004 2005 2006 2007 2008 2009 2010 2011Fiscal Year (FY)
Cha
nge
Sinc
e FY
200
3
LevyRevenueState Aid
Minnesota 2020 - www.mn2020.org Page 173

State Aid: -18.4%Levy: 106.1%
Revenue: 1.5%
Percent Change from FY 2003 to FY 2011 (real per pupil dollars):
*Change since FY 2003 in per pupil operating and debt service levy, aid, and revenue in constant FY 2011 dollars.
Change in Per Pupil Funding Since FY 2003Laporte School District*
$(3,000)
$(2,000)
$(1,000)
$-
$1,000
$2,000
$3,000
2003 2004 2005 2006 2007 2008 2009 2010 2011Fiscal Year (FY)
Cha
nge
Sinc
e FY
200
3
LevyRevenueState Aid
Minnesota 2020 - www.mn2020.org Page 174

State Aid: -10.3%Levy: 41.8%
Revenue: -3.2%
Percent Change from FY 2003 to FY 2011 (real per pupil dollars):
*Change since FY 2003 in per pupil operating and debt service levy, aid, and revenue in constant FY 2011 dollars.
Change in Per Pupil Funding Since FY 2003Le Center School District*
$(1,200)
$(1,000)
$(800)
$(600)
$(400)
$(200)
$-
$200
$400
$600
$800
2003 2004 2005 2006 2007 2008 2009 2010 2011Fiscal Year (FY)
Cha
nge
Sinc
e FY
200
3
LevyRevenueState Aid
Minnesota 2020 - www.mn2020.org Page 175

State Aid: -17.8%Levy: 98.9%
Revenue: -4.4%
Percent Change from FY 2003 to FY 2011 (real per pupil dollars):
*Change since FY 2003 in per pupil operating and debt service levy, aid, and revenue in constant FY 2011 dollars.
Change in Per Pupil Funding Since FY 2003LeRoy-Ostrander School District*
$(2,000)
$(1,500)
$(1,000)
$(500)
$-
$500
$1,000
$1,500
2003 2004 2005 2006 2007 2008 2009 2010 2011Fiscal Year (FY)
Cha
nge
Sinc
e FY
200
3
LevyRevenueState Aid
Minnesota 2020 - www.mn2020.org Page 176

State Aid: -15.3%Levy: 294.4%
Revenue: 3.1%
Percent Change from FY 2003 to FY 2011 (real per pupil dollars):
*Change since FY 2003 in per pupil operating and debt service levy, aid, and revenue in constant FY 2011 dollars.
Change in Per Pupil Funding Since FY 2003Lester Prairie School District*
$(1,500)
$(1,000)
$(500)
$-
$500
$1,000
$1,500
$2,000
2003 2004 2005 2006 2007 2008 2009 2010 2011Fiscal Year (FY)
Cha
nge
Sinc
e FY
200
3
LevyRevenueState Aid
Minnesota 2020 - www.mn2020.org Page 177

State Aid: -15.2%Levy: 309.4%
Revenue: 2.8%
Percent Change from FY 2003 to FY 2011 (real per pupil dollars):
*Change since FY 2003 in per pupil operating and debt service levy, aid, and revenue in constant FY 2011 dollars.
Change in Per Pupil Funding Since FY 2003LeSueur-Henderson School District*
$(2,000)
$(1,500)
$(1,000)
$(500)
$-
$500
$1,000
$1,500
$2,000
$2,500
2003 2004 2005 2006 2007 2008 2009 2010 2011Fiscal Year (FY)
Cha
nge
Sinc
e FY
200
3
LevyRevenueState Aid
Minnesota 2020 - www.mn2020.org Page 178

State Aid: -16.3%Levy: 22.8%
Revenue: -12.7%
Percent Change from FY 2003 to FY 2011 (real per pupil dollars):
*Change since FY 2003 in per pupil operating and debt service levy, aid, and revenue in constant FY 2011 dollars.
Change in Per Pupil Funding Since FY 2003Lewiston-Altura School District*
$(1,600)
$(1,400)
$(1,200)
$(1,000)
$(800)
$(600)
$(400)
$(200)
$-
$200
$400
2003 2004 2005 2006 2007 2008 2009 2010 2011Fiscal Year (FY)
Cha
nge
Sinc
e FY
200
3
LevyRevenueState Aid
Minnesota 2020 - www.mn2020.org Page 179

State Aid: -11.3%Levy: 184.9%
Revenue: 1.5%
Percent Change from FY 2003 to FY 2011 (real per pupil dollars):
*Change since FY 2003 in per pupil operating and debt service levy, aid, and revenue in constant FY 2011 dollars.
Change in Per Pupil Funding Since FY 2003Litchfield School District*
$(1,500)
$(1,000)
$(500)
$-
$500
$1,000
$1,500
2003 2004 2005 2006 2007 2008 2009 2010 2011Fiscal Year (FY)
Cha
nge
Sinc
e FY
200
3
LevyRevenueState Aid
Minnesota 2020 - www.mn2020.org Page 180

State Aid: -12.5%Levy: 256.7%
Revenue: -1.1%
Percent Change from FY 2003 to FY 2011 (real per pupil dollars):
*Change since FY 2003 in per pupil operating and debt service levy, aid, and revenue in constant FY 2011 dollars.
Change in Per Pupil Funding Since FY 2003Little Falls School District*
$(1,500)
$(1,000)
$(500)
$-
$500
$1,000
$1,500
2003 2004 2005 2006 2007 2008 2009 2010 2011Fiscal Year (FY)
Cha
nge
Sinc
e FY
200
3
LevyRevenueState Aid
Minnesota 2020 - www.mn2020.org Page 181

State Aid: -13.4%Levy: 113.9%
Revenue: -4.3%
Percent Change from FY 2003 to FY 2011 (real per pupil dollars):
*Change since FY 2003 in per pupil operating and debt service levy, aid, and revenue in constant FY 2011 dollars.
Change in Per Pupil Funding Since FY 2003Littlefork-Big Falls School District*
$(2,000)
$(1,500)
$(1,000)
$(500)
$-
$500
$1,000
$1,500
2003 2004 2005 2006 2007 2008 2009 2010 2011Fiscal Year (FY)
Cha
nge
Sinc
e FY
200
3
LevyRevenueState Aid
Minnesota 2020 - www.mn2020.org Page 182

State Aid: -9.4%Levy: 101.3%
Revenue: 2.4%
Percent Change from FY 2003 to FY 2011 (real per pupil dollars):
*Change since FY 2003 in per pupil operating and debt service levy, aid, and revenue in constant FY 2011 dollars.
Change in Per Pupil Funding Since FY 2003Long Prairie-Grey Eagle School District*
$(1,500)
$(1,000)
$(500)
$-
$500
$1,000
$1,500
2003 2004 2005 2006 2007 2008 2009 2010 2011Fiscal Year (FY)
Cha
nge
Sinc
e FY
200
3
LevyRevenueState Aid
Minnesota 2020 - www.mn2020.org Page 183

State Aid: -13.4%Levy: 41.8%
Revenue: -6.6%
Percent Change from FY 2003 to FY 2011 (real per pupil dollars):
*Change since FY 2003 in per pupil operating and debt service levy, aid, and revenue in constant FY 2011 dollars.
Change in Per Pupil Funding Since FY 2003Luverne-Magnolia School District*
$(1,400)
$(1,200)
$(1,000)
$(800)
$(600)
$(400)
$(200)
$-
$200
$400
$600
$800
2003 2004 2005 2006 2007 2008 2009 2010 2011Fiscal Year (FY)
Cha
nge
Sinc
e FY
200
3
LevyRevenueState Aid
Minnesota 2020 - www.mn2020.org Page 184

State Aid: -13.5%Levy: 585.9%
Revenue: 8.9%
Percent Change from FY 2003 to FY 2011 (real per pupil dollars):
*Change since FY 2003 in per pupil operating and debt service levy, aid, and revenue in constant FY 2011 dollars.
Change in Per Pupil Funding Since FY 2003Lyle School District*
$(2,000)
$(1,500)
$(1,000)
$(500)
$-
$500
$1,000
$1,500
$2,000
$2,500
$3,000
2003 2004 2005 2006 2007 2008 2009 2010 2011Fiscal Year (FY)
Cha
nge
Sinc
e FY
200
3
LevyRevenueState Aid
Minnesota 2020 - www.mn2020.org Page 185

State Aid: -16.2%Levy: 1706.2%
Revenue: 2.3%
Percent Change from FY 2003 to FY 2011 (real per pupil dollars):
*Change since FY 2003 in per pupil operating and debt service levy, aid, and revenue in constant FY 2011 dollars.
Change in Per Pupil Funding Since FY 2003Lynd School District*
$(2,000)
$(1,500)
$(1,000)
$(500)
$-
$500
$1,000
$1,500
$2,000
$2,500
2003 2004 2005 2006 2007 2008 2009 2010 2011Fiscal Year (FY)
Cha
nge
Sinc
e FY
200
3
LevyRevenueState Aid
Minnesota 2020 - www.mn2020.org Page 186

State Aid: -15.9%Levy: 92.2%
Revenue: -0.3%
Percent Change from FY 2003 to FY 2011 (real per pupil dollars):
*Change since FY 2003 in per pupil operating and debt service levy, aid, and revenue in constant FY 2011 dollars.
Change in Per Pupil Funding Since FY 2003Mabel-Canton School District*
$(2,000)
$(1,500)
$(1,000)
$(500)
$-
$500
$1,000
$1,500
$2,000
2003 2004 2005 2006 2007 2008 2009 2010 2011Fiscal Year (FY)
Cha
nge
Sinc
e FY
200
3
LevyRevenueState Aid
Minnesota 2020 - www.mn2020.org Page 187

State Aid: -19.2%Levy: 86.0%
Revenue: -5.5%
Percent Change from FY 2003 to FY 2011 (real per pupil dollars):
*Change since FY 2003 in per pupil operating and debt service levy, aid, and revenue in constant FY 2011 dollars.
Change in Per Pupil Funding Since FY 2003MACCRAY School District*
$(2,500)
$(2,000)
$(1,500)
$(1,000)
$(500)
$-
$500
$1,000
$1,500
2003 2004 2005 2006 2007 2008 2009 2010 2011Fiscal Year (FY)
Cha
nge
Sinc
e FY
200
3
LevyRevenueState Aid
Minnesota 2020 - www.mn2020.org Page 188

State Aid: -11.6%Levy: 66.8%
Revenue: -2.4%
Percent Change from FY 2003 to FY 2011 (real per pupil dollars):
*Change since FY 2003 in per pupil operating and debt service levy, aid, and revenue in constant FY 2011 dollars.
Change in Per Pupil Funding Since FY 2003Madelia School District*
$(1,500)
$(1,000)
$(500)
$-
$500
$1,000
$1,500
2003 2004 2005 2006 2007 2008 2009 2010 2011Fiscal Year (FY)
Cha
nge
Sinc
e FY
200
3
LevyRevenueState Aid
Minnesota 2020 - www.mn2020.org Page 189

State Aid: -17.8%Levy: 39.3%
Revenue: -14.9%
Percent Change from FY 2003 to FY 2011 (real per pupil dollars):
*Change since FY 2003 in per pupil operating and debt service levy, aid, and revenue in constant FY 2011 dollars.
Change in Per Pupil Funding Since FY 2003Mahnomen School District*
$(2,500)
$(2,000)
$(1,500)
$(1,000)
$(500)
$-
$500
2003 2004 2005 2006 2007 2008 2009 2010 2011Fiscal Year (FY)
Cha
nge
Sinc
e FY
200
3
LevyRevenueState Aid
Minnesota 2020 - www.mn2020.org Page 190

State Aid: -14.8%Levy: 20.6%
Revenue: -7.4%
Percent Change from FY 2003 to FY 2011 (real per pupil dollars):
*Change since FY 2003 in per pupil operating and debt service levy, aid, and revenue in constant FY 2011 dollars.
Change in Per Pupil Funding Since FY 2003Mahtomedi School District*
$(1,400)
$(1,200)
$(1,000)
$(800)
$(600)
$(400)
$(200)
$-
$200
$400
$600
2003 2004 2005 2006 2007 2008 2009 2010 2011Fiscal Year (FY)
Cha
nge
Sinc
e FY
200
3
LevyRevenueState Aid
Minnesota 2020 - www.mn2020.org Page 191

State Aid: -15.0%Levy: 179.1%
Revenue: -0.5%
Percent Change from FY 2003 to FY 2011 (real per pupil dollars):
*Change since FY 2003 in per pupil operating and debt service levy, aid, and revenue in constant FY 2011 dollars.
Change in Per Pupil Funding Since FY 2003Mankato School District*
$(2,000)
$(1,500)
$(1,000)
$(500)
$-
$500
$1,000
$1,500
2003 2004 2005 2006 2007 2008 2009 2010 2011Fiscal Year (FY)
Cha
nge
Sinc
e FY
200
3
LevyRevenueState Aid
Minnesota 2020 - www.mn2020.org Page 192

State Aid: -13.4%Levy: 13.5%
Revenue: -7.9%
Percent Change from FY 2003 to FY 2011 (real per pupil dollars):
*Change since FY 2003 in per pupil operating and debt service levy, aid, and revenue in constant FY 2011 dollars.
Change in Per Pupil Funding Since FY 2003Maple Lake School District*
$(1,600)
$(1,400)
$(1,200)
$(1,000)
$(800)
$(600)
$(400)
$(200)
$-
$200
$400
2003 2004 2005 2006 2007 2008 2009 2010 2011Fiscal Year (FY)
Cha
nge
Sinc
e FY
200
3
LevyRevenueState Aid
Minnesota 2020 - www.mn2020.org Page 193

State Aid: -10.2%Levy: 132.0%
Revenue: -0.5%
Percent Change from FY 2003 to FY 2011 (real per pupil dollars):
*Change since FY 2003 in per pupil operating and debt service levy, aid, and revenue in constant FY 2011 dollars.
Change in Per Pupil Funding Since FY 2003Maple River School District*
$(1,000)
$(800)
$(600)
$(400)
$(200)
$-
$200
$400
$600
$800
$1,000
2003 2004 2005 2006 2007 2008 2009 2010 2011Fiscal Year (FY)
Cha
nge
Sinc
e FY
200
3
LevyRevenueState Aid
Minnesota 2020 - www.mn2020.org Page 194

State Aid: -9.4%Levy: 159.3%
Revenue: 6.4%
Percent Change from FY 2003 to FY 2011 (real per pupil dollars):
*Change since FY 2003 in per pupil operating and debt service levy, aid, and revenue in constant FY 2011 dollars.
Change in Per Pupil Funding Since FY 2003Marshall School District*
$(1,000)
$(500)
$-
$500
$1,000
$1,500
$2,000
2003 2004 2005 2006 2007 2008 2009 2010 2011Fiscal Year (FY)
Cha
nge
Sinc
e FY
200
3
LevyRevenueState Aid
Minnesota 2020 - www.mn2020.org Page 195

State Aid: -16.6%Levy: 59.2%
Revenue: -13.3%
Percent Change from FY 2003 to FY 2011 (real per pupil dollars):
*Change since FY 2003 in per pupil operating and debt service levy, aid, and revenue in constant FY 2011 dollars.
Change in Per Pupil Funding Since FY 2003Marshall County Central School District*
$(2,500)
$(2,000)
$(1,500)
$(1,000)
$(500)
$-
$500
2003 2004 2005 2006 2007 2008 2009 2010 2011Fiscal Year (FY)
Cha
nge
Sinc
e FY
200
3
LevyRevenueState Aid
Minnesota 2020 - www.mn2020.org Page 196
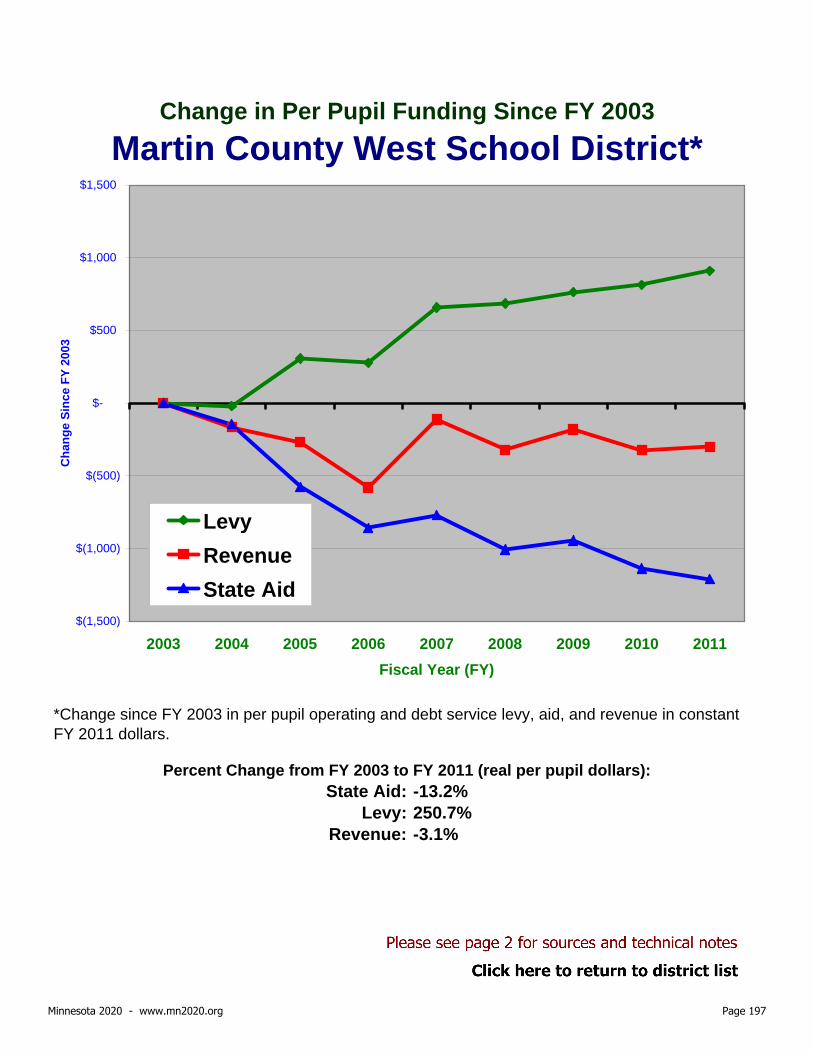
State Aid: -13.2%Levy: 250.7%
Revenue: -3.1%
Percent Change from FY 2003 to FY 2011 (real per pupil dollars):
*Change since FY 2003 in per pupil operating and debt service levy, aid, and revenue in constant FY 2011 dollars.
Change in Per Pupil Funding Since FY 2003Martin County West School District*
$(1,500)
$(1,000)
$(500)
$-
$500
$1,000
$1,500
2003 2004 2005 2006 2007 2008 2009 2010 2011Fiscal Year (FY)
Cha
nge
Sinc
e FY
200
3
LevyRevenueState Aid
Minnesota 2020 - www.mn2020.org Page 197

State Aid: -11.1%Levy: 40.5%
Revenue: -3.8%
Percent Change from FY 2003 to FY 2011 (real per pupil dollars):
*Change since FY 2003 in per pupil operating and debt service levy, aid, and revenue in constant FY 2011 dollars.
Change in Per Pupil Funding Since FY 2003McGregor School District*
$(1,500)
$(1,000)
$(500)
$-
$500
$1,000
$1,500
2003 2004 2005 2006 2007 2008 2009 2010 2011Fiscal Year (FY)
Cha
nge
Sinc
e FY
200
3
LevyRevenueState Aid
Minnesota 2020 - www.mn2020.org Page 198

State Aid: -22.5%Levy: -17.0%
Revenue: -21.6%
Percent Change from FY 2003 to FY 2011 (real per pupil dollars):
*Change since FY 2003 in per pupil operating and debt service levy, aid, and revenue in constant FY 2011 dollars.
Change in Per Pupil Funding Since FY 2003Medford School District*
$(2,500)
$(2,000)
$(1,500)
$(1,000)
$(500)
$-
2003 2004 2005 2006 2007 2008 2009 2010 2011Fiscal Year (FY)
Cha
nge
Sinc
e FY
200
3
LevyRevenueState Aid
Minnesota 2020 - www.mn2020.org Page 199

State Aid: -9.8%Levy: 87.0%
Revenue: -0.6%
Percent Change from FY 2003 to FY 2011 (real per pupil dollars):
*Change since FY 2003 in per pupil operating and debt service levy, aid, and revenue in constant FY 2011 dollars.
Change in Per Pupil Funding Since FY 2003Melrose School District*
$(1,000)
$(800)
$(600)
$(400)
$(200)
$-
$200
$400
$600
$800
$1,000
2003 2004 2005 2006 2007 2008 2009 2010 2011Fiscal Year (FY)
Cha
nge
Sinc
e FY
200
3
LevyRevenueState Aid
Minnesota 2020 - www.mn2020.org Page 200

State Aid: -18.4%Levy: 67.7%
Revenue: -13.0%
Percent Change from FY 2003 to FY 2011 (real per pupil dollars):
*Change since FY 2003 in per pupil operating and debt service levy, aid, and revenue in constant FY 2011 dollars.
Change in Per Pupil Funding Since FY 2003Menahga School District*
$(2,000)
$(1,500)
$(1,000)
$(500)
$-
$500
$1,000
2003 2004 2005 2006 2007 2008 2009 2010 2011Fiscal Year (FY)
Cha
nge
Sinc
e FY
200
3
LevyRevenueState Aid
Minnesota 2020 - www.mn2020.org Page 201
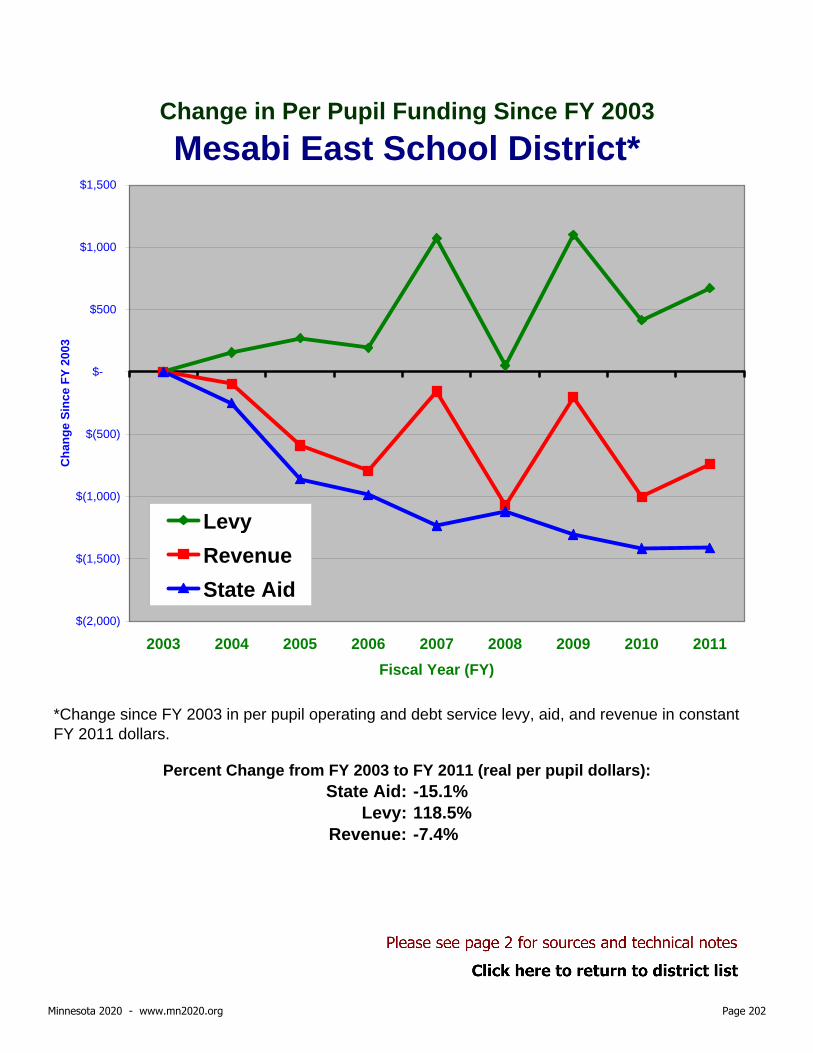
State Aid: -15.1%Levy: 118.5%
Revenue: -7.4%
Percent Change from FY 2003 to FY 2011 (real per pupil dollars):
*Change since FY 2003 in per pupil operating and debt service levy, aid, and revenue in constant FY 2011 dollars.
Change in Per Pupil Funding Since FY 2003Mesabi East School District*
$(2,000)
$(1,500)
$(1,000)
$(500)
$-
$500
$1,000
$1,500
2003 2004 2005 2006 2007 2008 2009 2010 2011Fiscal Year (FY)
Cha
nge
Sinc
e FY
200
3
LevyRevenueState Aid
Minnesota 2020 - www.mn2020.org Page 202

State Aid: -13.5%Levy: -1.0%
Revenue: -12.4%
Percent Change from FY 2003 to FY 2011 (real per pupil dollars):
*Change since FY 2003 in per pupil operating and debt service levy, aid, and revenue in constant FY 2011 dollars.
Change in Per Pupil Funding Since FY 2003Milaca School District*
$(1,400)
$(1,200)
$(1,000)
$(800)
$(600)
$(400)
$(200)
$-
$200
2003 2004 2005 2006 2007 2008 2009 2010 2011Fiscal Year (FY)
Cha
nge
Sinc
e FY
200
3
LevyRevenueState Aid
Minnesota 2020 - www.mn2020.org Page 203

State Aid: 3.7%Levy: 741.7%
Revenue: 22.4%
Percent Change from FY 2003 to FY 2011 (real per pupil dollars):
*Change since FY 2003 in per pupil operating and debt service levy, aid, and revenue in constant FY 2011 dollars.
Change in Per Pupil Funding Since FY 2003Milroy School District*
$(1,000)
$(500)
$-
$500
$1,000
$1,500
$2,000
$2,500
$3,000
2003 2004 2005 2006 2007 2008 2009 2010 2011Fiscal Year (FY)
Cha
nge
Sinc
e FY
200
3
LevyRevenueState Aid
Minnesota 2020 - www.mn2020.org Page 204

State Aid: -16.7%Levy: 49.1%
Revenue: -4.1%
Percent Change from FY 2003 to FY 2011 (real per pupil dollars):
*Change since FY 2003 in per pupil operating and debt service levy, aid, and revenue in constant FY 2011 dollars.
Change in Per Pupil Funding Since FY 2003Minneapolis School District*
$(2,500)
$(2,000)
$(1,500)
$(1,000)
$(500)
$-
$500
$1,000
$1,500
$2,000
2003 2004 2005 2006 2007 2008 2009 2010 2011Fiscal Year (FY)
Cha
nge
Sinc
e FY
200
3
LevyRevenueState Aid
Minnesota 2020 - www.mn2020.org Page 205

State Aid: -11.5%Levy: 103.3%
Revenue: -2.2%
Percent Change from FY 2003 to FY 2011 (real per pupil dollars):
*Change since FY 2003 in per pupil operating and debt service levy, aid, and revenue in constant FY 2011 dollars.
Change in Per Pupil Funding Since FY 2003Minneota School District*
$(1,500)
$(1,000)
$(500)
$-
$500
$1,000
2003 2004 2005 2006 2007 2008 2009 2010 2011Fiscal Year (FY)
Cha
nge
Sinc
e FY
200
3
LevyRevenueState Aid
Minnesota 2020 - www.mn2020.org Page 206
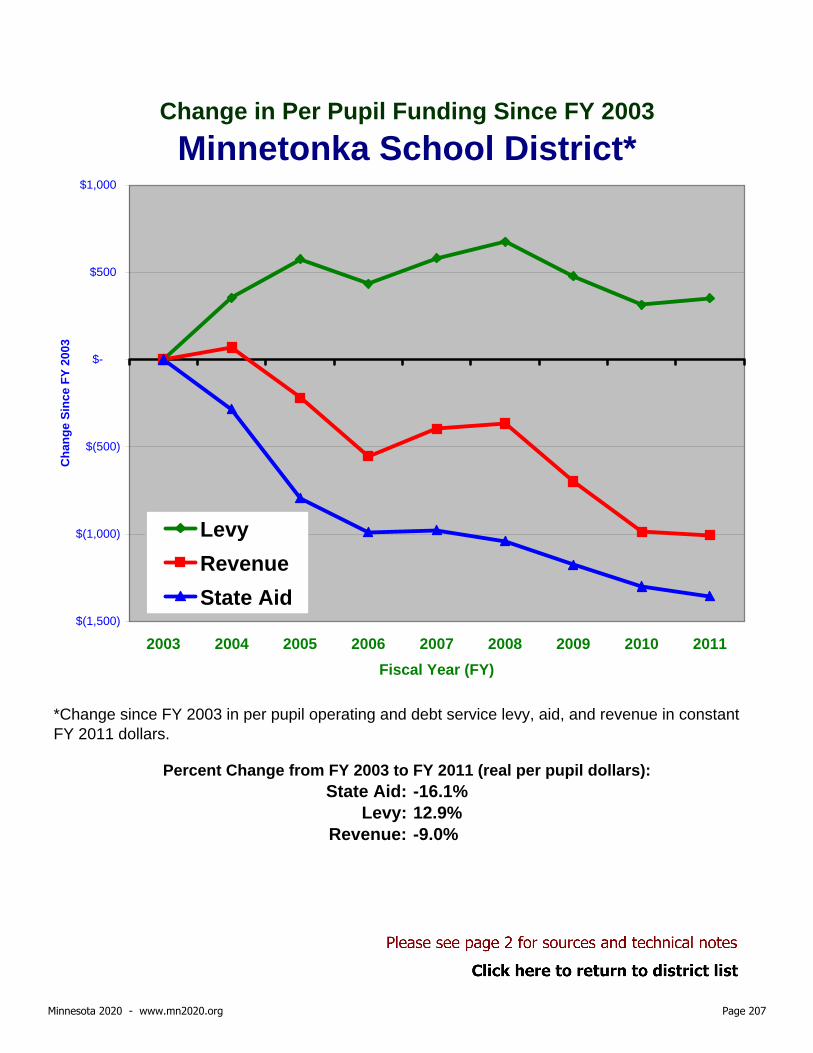
State Aid: -16.1%Levy: 12.9%
Revenue: -9.0%
Percent Change from FY 2003 to FY 2011 (real per pupil dollars):
*Change since FY 2003 in per pupil operating and debt service levy, aid, and revenue in constant FY 2011 dollars.
Change in Per Pupil Funding Since FY 2003Minnetonka School District*
$(1,500)
$(1,000)
$(500)
$-
$500
$1,000
2003 2004 2005 2006 2007 2008 2009 2010 2011Fiscal Year (FY)
Cha
nge
Sinc
e FY
200
3
LevyRevenueState Aid
Minnesota 2020 - www.mn2020.org Page 207

State Aid: -9.4%Levy: 188.7%
Revenue: 8.3%
Percent Change from FY 2003 to FY 2011 (real per pupil dollars):
*Change since FY 2003 in per pupil operating and debt service levy, aid, and revenue in constant FY 2011 dollars.
Change in Per Pupil Funding Since FY 2003Minnewaska School District*
$(1,500)
$(1,000)
$(500)
$-
$500
$1,000
$1,500
$2,000
2003 2004 2005 2006 2007 2008 2009 2010 2011Fiscal Year (FY)
Cha
nge
Sinc
e FY
200
3
LevyRevenueState Aid
Minnesota 2020 - www.mn2020.org Page 208

State Aid: -10.7%Levy: 99.0%
Revenue: -2.5%
Percent Change from FY 2003 to FY 2011 (real per pupil dollars):
*Change since FY 2003 in per pupil operating and debt service levy, aid, and revenue in constant FY 2011 dollars.
Change in Per Pupil Funding Since FY 2003Montevideo School District*
$(1,200)
$(1,000)
$(800)
$(600)
$(400)
$(200)
$-
$200
$400
$600
$800
$1,000
2003 2004 2005 2006 2007 2008 2009 2010 2011Fiscal Year (FY)
Cha
nge
Sinc
e FY
200
3
LevyRevenueState Aid
Minnesota 2020 - www.mn2020.org Page 209

State Aid: -16.3%Levy: 181.2%
Revenue: 3.6%
Percent Change from FY 2003 to FY 2011 (real per pupil dollars):
*Change since FY 2003 in per pupil operating and debt service levy, aid, and revenue in constant FY 2011 dollars.
Change in Per Pupil Funding Since FY 2003Montgomery-Lonsdale School District*
$(2,000)
$(1,500)
$(1,000)
$(500)
$-
$500
$1,000
$1,500
$2,000
2003 2004 2005 2006 2007 2008 2009 2010 2011Fiscal Year (FY)
Cha
nge
Sinc
e FY
200
3
LevyRevenueState Aid
Minnesota 2020 - www.mn2020.org Page 210

State Aid: -13.6%Levy: 52.1%
Revenue: -2.9%
Percent Change from FY 2003 to FY 2011 (real per pupil dollars):
*Change since FY 2003 in per pupil operating and debt service levy, aid, and revenue in constant FY 2011 dollars.
Change in Per Pupil Funding Since FY 2003Monticello School District*
$(1,500)
$(1,000)
$(500)
$-
$500
$1,000
2003 2004 2005 2006 2007 2008 2009 2010 2011Fiscal Year (FY)
Cha
nge
Sinc
e FY
200
3
LevyRevenueState Aid
Minnesota 2020 - www.mn2020.org Page 211

State Aid: -19.5%Levy: 4.4%
Revenue: -16.5%
Percent Change from FY 2003 to FY 2011 (real per pupil dollars):
*Change since FY 2003 in per pupil operating and debt service levy, aid, and revenue in constant FY 2011 dollars.
Change in Per Pupil Funding Since FY 2003Moorhead School District*
$(2,500)
$(2,000)
$(1,500)
$(1,000)
$(500)
$-
$500
2003 2004 2005 2006 2007 2008 2009 2010 2011Fiscal Year (FY)
Cha
nge
Sinc
e FY
200
3
LevyRevenueState Aid
Minnesota 2020 - www.mn2020.org Page 212

State Aid: -14.9%Levy: -36.8%
Revenue: -17.2%
Percent Change from FY 2003 to FY 2011 (real per pupil dollars):
*Change since FY 2003 in per pupil operating and debt service levy, aid, and revenue in constant FY 2011 dollars.
Change in Per Pupil Funding Since FY 2003Moose Lake School District*
$(2,000)
$(1,800)
$(1,600)
$(1,400)
$(1,200)
$(1,000)
$(800)
$(600)
$(400)
$(200)
$-
2003 2004 2005 2006 2007 2008 2009 2010 2011Fiscal Year (FY)
Cha
nge
Sinc
e FY
200
3
LevyRevenueState Aid
Minnesota 2020 - www.mn2020.org Page 213

State Aid: -12.5%Levy: 67.3%
Revenue: -7.8%
Percent Change from FY 2003 to FY 2011 (real per pupil dollars):
*Change since FY 2003 in per pupil operating and debt service levy, aid, and revenue in constant FY 2011 dollars.
Change in Per Pupil Funding Since FY 2003Mora School District*
$(1,200)
$(1,000)
$(800)
$(600)
$(400)
$(200)
$-
$200
$400
$600
2003 2004 2005 2006 2007 2008 2009 2010 2011Fiscal Year (FY)
Cha
nge
Sinc
e FY
200
3
LevyRevenueState Aid
Minnesota 2020 - www.mn2020.org Page 214

State Aid: -12.8%Levy: 62.0%
Revenue: 0.0%
Percent Change from FY 2003 to FY 2011 (real per pupil dollars):
*Change since FY 2003 in per pupil operating and debt service levy, aid, and revenue in constant FY 2011 dollars.
Change in Per Pupil Funding Since FY 2003Morris School District*
$(1,500)
$(1,000)
$(500)
$-
$500
$1,000
$1,500
2003 2004 2005 2006 2007 2008 2009 2010 2011Fiscal Year (FY)
Cha
nge
Sinc
e FY
200
3
LevyRevenueState Aid
Minnesota 2020 - www.mn2020.org Page 215

State Aid: -10.3%Levy: 128.9%
Revenue: 11.2%
Percent Change from FY 2003 to FY 2011 (real per pupil dollars):
*Change since FY 2003 in per pupil operating and debt service levy, aid, and revenue in constant FY 2011 dollars.
Change in Per Pupil Funding Since FY 2003Mounds View School District*
$(1,500)
$(1,000)
$(500)
$-
$500
$1,000
$1,500
$2,000
$2,500
2003 2004 2005 2006 2007 2008 2009 2010 2011Fiscal Year (FY)
Cha
nge
Sinc
e FY
200
3
LevyRevenueState Aid
Minnesota 2020 - www.mn2020.org Page 216

State Aid: -6.2%Levy: 25.2%
Revenue: -3.2%
Percent Change from FY 2003 to FY 2011 (real per pupil dollars):
*Change since FY 2003 in per pupil operating and debt service levy, aid, and revenue in constant FY 2011 dollars.
Change in Per Pupil Funding Since FY 2003Mountain Iron-Buhl School District*
$(1,200)
$(1,000)
$(800)
$(600)
$(400)
$(200)
$-
$200
$400
2003 2004 2005 2006 2007 2008 2009 2010 2011Fiscal Year (FY)
Cha
nge
Sinc
e FY
200
3
LevyRevenueState Aid
Minnesota 2020 - www.mn2020.org Page 217

State Aid: -16.1%Levy: 163.4%
Revenue: -6.9%
Percent Change from FY 2003 to FY 2011 (real per pupil dollars):
*Change since FY 2003 in per pupil operating and debt service levy, aid, and revenue in constant FY 2011 dollars.
Change in Per Pupil Funding Since FY 2003Mountain Lake School District*
$(2,000)
$(1,500)
$(1,000)
$(500)
$-
$500
$1,000
$1,500
2003 2004 2005 2006 2007 2008 2009 2010 2011Fiscal Year (FY)
Cha
nge
Sinc
e FY
200
3
LevyRevenueState Aid
Minnesota 2020 - www.mn2020.org Page 218

State Aid: -12.3%Levy: 102.9%
Revenue: 0.2%
Percent Change from FY 2003 to FY 2011 (real per pupil dollars):
*Change since FY 2003 in per pupil operating and debt service levy, aid, and revenue in constant FY 2011 dollars.
Change in Per Pupil Funding Since FY 2003Murray County Central School District*
$(1,500)
$(1,000)
$(500)
$-
$500
$1,000
$1,500
2003 2004 2005 2006 2007 2008 2009 2010 2011Fiscal Year (FY)
Cha
nge
Sinc
e FY
200
3
LevyRevenueState Aid
Minnesota 2020 - www.mn2020.org Page 219

State Aid: -12.7%Levy: 32.2%
Revenue: -8.0%
Percent Change from FY 2003 to FY 2011 (real per pupil dollars):
*Change since FY 2003 in per pupil operating and debt service levy, aid, and revenue in constant FY 2011 dollars.
Change in Per Pupil Funding Since FY 2003N.R.H.E.G. School District*
$(1,400)
$(1,200)
$(1,000)
$(800)
$(600)
$(400)
$(200)
$-
$200
$400
$600
2003 2004 2005 2006 2007 2008 2009 2010 2011Fiscal Year (FY)
Cha
nge
Sinc
e FY
200
3
LevyRevenueState Aid
Minnesota 2020 - www.mn2020.org Page 220

State Aid: -13.1%Levy: 713.7%
Revenue: -2.8%
Percent Change from FY 2003 to FY 2011 (real per pupil dollars):
*Change since FY 2003 in per pupil operating and debt service levy, aid, and revenue in constant FY 2011 dollars.
Change in Per Pupil Funding Since FY 2003Nashwauk-Keewatin School District*
$(2,500)
$(2,000)
$(1,500)
$(1,000)
$(500)
$-
$500
$1,000
$1,500
2003 2004 2005 2006 2007 2008 2009 2010 2011Fiscal Year (FY)
Cha
nge
Sinc
e FY
200
3
LevyRevenueState Aid
Minnesota 2020 - www.mn2020.org Page 221
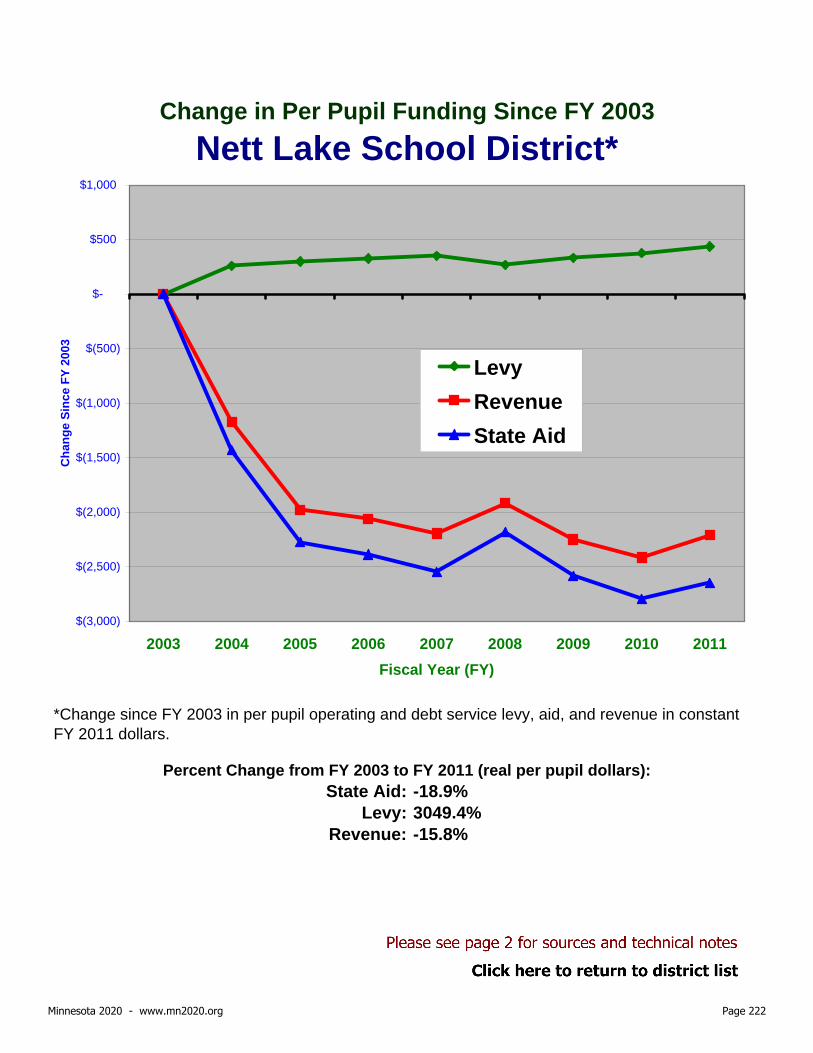
State Aid: -18.9%Levy: 3049.4%
Revenue: -15.8%
Percent Change from FY 2003 to FY 2011 (real per pupil dollars):
*Change since FY 2003 in per pupil operating and debt service levy, aid, and revenue in constant FY 2011 dollars.
Change in Per Pupil Funding Since FY 2003Nett Lake School District*
$(3,000)
$(2,500)
$(2,000)
$(1,500)
$(1,000)
$(500)
$-
$500
$1,000
2003 2004 2005 2006 2007 2008 2009 2010 2011Fiscal Year (FY)
Cha
nge
Sinc
e FY
200
3
LevyRevenueState Aid
Minnesota 2020 - www.mn2020.org Page 222

State Aid: -15.0%Levy: 18.9%
Revenue: -11.9%
Percent Change from FY 2003 to FY 2011 (real per pupil dollars):
*Change since FY 2003 in per pupil operating and debt service levy, aid, and revenue in constant FY 2011 dollars.
Change in Per Pupil Funding Since FY 2003Nevis School District*
$(2,000)
$(1,500)
$(1,000)
$(500)
$-
$500
2003 2004 2005 2006 2007 2008 2009 2010 2011Fiscal Year (FY)
Cha
nge
Sinc
e FY
200
3
LevyRevenueState Aid
Minnesota 2020 - www.mn2020.org Page 223

State Aid: -13.6%Levy: 82.3%
Revenue: -1.2%
Percent Change from FY 2003 to FY 2011 (real per pupil dollars):
*Change since FY 2003 in per pupil operating and debt service levy, aid, and revenue in constant FY 2011 dollars.
Change in Per Pupil Funding Since FY 2003New London-Spicer School District*
$(1,500)
$(1,000)
$(500)
$-
$500
$1,000
$1,500
2003 2004 2005 2006 2007 2008 2009 2010 2011Fiscal Year (FY)
Cha
nge
Sinc
e FY
200
3
LevyRevenueState Aid
Minnesota 2020 - www.mn2020.org Page 224

State Aid: -17.9%Levy: 130.1%
Revenue: 0.1%
Percent Change from FY 2003 to FY 2011 (real per pupil dollars):
*Change since FY 2003 in per pupil operating and debt service levy, aid, and revenue in constant FY 2011 dollars.
Change in Per Pupil Funding Since FY 2003New Prague Area School District*
$(2,000)
$(1,500)
$(1,000)
$(500)
$-
$500
$1,000
$1,500
$2,000
2003 2004 2005 2006 2007 2008 2009 2010 2011Fiscal Year (FY)
Cha
nge
Sinc
e FY
200
3
LevyRevenueState Aid
Minnesota 2020 - www.mn2020.org Page 225

State Aid: -16.3%Levy: 100.2%
Revenue: -3.8%
Percent Change from FY 2003 to FY 2011 (real per pupil dollars):
*Change since FY 2003 in per pupil operating and debt service levy, aid, and revenue in constant FY 2011 dollars.
Change in Per Pupil Funding Since FY 2003New Ulm-Hanska School District*
$(2,000)
$(1,500)
$(1,000)
$(500)
$-
$500
$1,000
$1,500
2003 2004 2005 2006 2007 2008 2009 2010 2011Fiscal Year (FY)
Cha
nge
Sinc
e FY
200
3
LevyRevenueState Aid
Minnesota 2020 - www.mn2020.org Page 226

State Aid: -17.8%Levy: 30.7%
Revenue: -13.3%
Percent Change from FY 2003 to FY 2011 (real per pupil dollars):
*Change since FY 2003 in per pupil operating and debt service levy, aid, and revenue in constant FY 2011 dollars.
Change in Per Pupil Funding Since FY 2003New York Mills School District*
$(2,000)
$(1,500)
$(1,000)
$(500)
$-
$500
$1,000
2003 2004 2005 2006 2007 2008 2009 2010 2011Fiscal Year (FY)
Cha
nge
Sinc
e FY
200
3
LevyRevenueState Aid
Minnesota 2020 - www.mn2020.org Page 227

State Aid: -21.7%Levy: 4.4%
Revenue: -16.1%
Percent Change from FY 2003 to FY 2011 (real per pupil dollars):
*Change since FY 2003 in per pupil operating and debt service levy, aid, and revenue in constant FY 2011 dollars.
Change in Per Pupil Funding Since FY 2003Nicollet School District*
$(2,500)
$(2,000)
$(1,500)
$(1,000)
$(500)
$-
$500
2003 2004 2005 2006 2007 2008 2009 2010 2011Fiscal Year (FY)
Cha
nge
Sinc
e FY
200
3
LevyRevenueState Aid
Minnesota 2020 - www.mn2020.org Page 228

State Aid: -8.3%Levy: 90.4%
Revenue: 2.2%
Percent Change from FY 2003 to FY 2011 (real per pupil dollars):
*Change since FY 2003 in per pupil operating and debt service levy, aid, and revenue in constant FY 2011 dollars.
Change in Per Pupil Funding Since FY 2003Norman County East School District*
$(1,500)
$(1,000)
$(500)
$-
$500
$1,000
$1,500
2003 2004 2005 2006 2007 2008 2009 2010 2011Fiscal Year (FY)
Cha
nge
Sinc
e FY
200
3
LevyRevenueState Aid
Minnesota 2020 - www.mn2020.org Page 229

State Aid: -13.6%Levy: 84.7%
Revenue: -6.3%
Percent Change from FY 2003 to FY 2011 (real per pupil dollars):
*Change since FY 2003 in per pupil operating and debt service levy, aid, and revenue in constant FY 2011 dollars.
Change in Per Pupil Funding Since FY 2003Norman County West School District*
$(2,000)
$(1,500)
$(1,000)
$(500)
$-
$500
$1,000
2003 2004 2005 2006 2007 2008 2009 2010 2011Fiscal Year (FY)
Cha
nge
Sinc
e FY
200
3
LevyRevenueState Aid
Minnesota 2020 - www.mn2020.org Page 230

State Aid: -10.8%Levy: 44.4%
Revenue: -4.1%
Percent Change from FY 2003 to FY 2011 (real per pupil dollars):
*Change since FY 2003 in per pupil operating and debt service levy, aid, and revenue in constant FY 2011 dollars.
Change in Per Pupil Funding Since FY 2003North Branch School District*
$(1,200)
$(1,000)
$(800)
$(600)
$(400)
$(200)
$-
$200
$400
$600
$800
2003 2004 2005 2006 2007 2008 2009 2010 2011Fiscal Year (FY)
Cha
nge
Sinc
e FY
200
3
LevyRevenueState Aid
Minnesota 2020 - www.mn2020.org Page 231

State Aid: -4.4%Levy: 178.7%
Revenue: 16.0%
Percent Change from FY 2003 to FY 2011 (real per pupil dollars):
*Change since FY 2003 in per pupil operating and debt service levy, aid, and revenue in constant FY 2011 dollars.
Change in Per Pupil Funding Since FY 2003North St. Paul-Maplewood School District*
$(1,500)
$(1,000)
$(500)
$-
$500
$1,000
$1,500
$2,000
$2,500
2003 2004 2005 2006 2007 2008 2009 2010 2011Fiscal Year (FY)
Cha
nge
Sinc
e FY
200
3
LevyRevenueState Aid
Minnesota 2020 - www.mn2020.org Page 232

State Aid: -14.5%Levy: 134.8%
Revenue: 7.1%
Percent Change from FY 2003 to FY 2011 (real per pupil dollars):
*Change since FY 2003 in per pupil operating and debt service levy, aid, and revenue in constant FY 2011 dollars.
Change in Per Pupil Funding Since FY 2003Northfield School District*
$(2,000)
$(1,500)
$(1,000)
$(500)
$-
$500
$1,000
$1,500
$2,000
$2,500
2003 2004 2005 2006 2007 2008 2009 2010 2011Fiscal Year (FY)
Cha
nge
Sinc
e FY
200
3
LevyRevenueState Aid
Minnesota 2020 - www.mn2020.org Page 233

State Aid: -3.4%Levy: 353.0%
Revenue: 7.3%
Percent Change from FY 2003 to FY 2011 (real per pupil dollars):
*Change since FY 2003 in per pupil operating and debt service levy, aid, and revenue in constant FY 2011 dollars.
Change in Per Pupil Funding Since FY 2003Northland Community School District*
$(2,000)
$(1,500)
$(1,000)
$(500)
$-
$500
$1,000
$1,500
2003 2004 2005 2006 2007 2008 2009 2010 2011Fiscal Year (FY)
Cha
nge
Sinc
e FY
200
3
LevyRevenueState Aid
Minnesota 2020 - www.mn2020.org Page 234

State Aid: -17.7%Levy: 61.0%
Revenue: -8.4%
Percent Change from FY 2003 to FY 2011 (real per pupil dollars):
*Change since FY 2003 in per pupil operating and debt service levy, aid, and revenue in constant FY 2011 dollars.
Change in Per Pupil Funding Since FY 2003Norwood Young America School District*
$(2,000)
$(1,500)
$(1,000)
$(500)
$-
$500
$1,000
2003 2004 2005 2006 2007 2008 2009 2010 2011Fiscal Year (FY)
Cha
nge
Sinc
e FY
200
3
LevyRevenueState Aid
Minnesota 2020 - www.mn2020.org Page 235

State Aid: -16.2%Levy: 81.9%
Revenue: -7.0%
Percent Change from FY 2003 to FY 2011 (real per pupil dollars):
*Change since FY 2003 in per pupil operating and debt service levy, aid, and revenue in constant FY 2011 dollars.
Change in Per Pupil Funding Since FY 2003Ogilvie School District*
$(2,000)
$(1,500)
$(1,000)
$(500)
$-
$500
$1,000
$1,500
2003 2004 2005 2006 2007 2008 2009 2010 2011Fiscal Year (FY)
Cha
nge
Sinc
e FY
200
3
LevyRevenueState Aid
Minnesota 2020 - www.mn2020.org Page 236
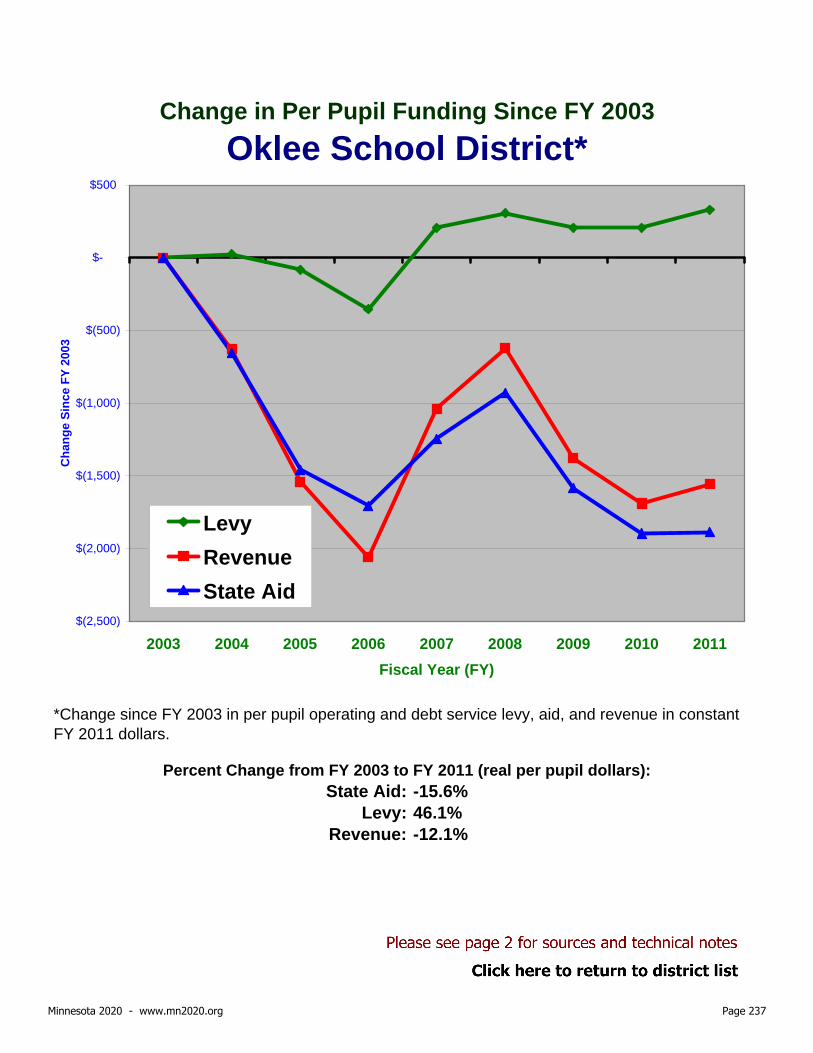
State Aid: -15.6%Levy: 46.1%
Revenue: -12.1%
Percent Change from FY 2003 to FY 2011 (real per pupil dollars):
*Change since FY 2003 in per pupil operating and debt service levy, aid, and revenue in constant FY 2011 dollars.
Change in Per Pupil Funding Since FY 2003Oklee School District*
$(2,500)
$(2,000)
$(1,500)
$(1,000)
$(500)
$-
$500
2003 2004 2005 2006 2007 2008 2009 2010 2011Fiscal Year (FY)
Cha
nge
Sinc
e FY
200
3
LevyRevenueState Aid
Minnesota 2020 - www.mn2020.org Page 237
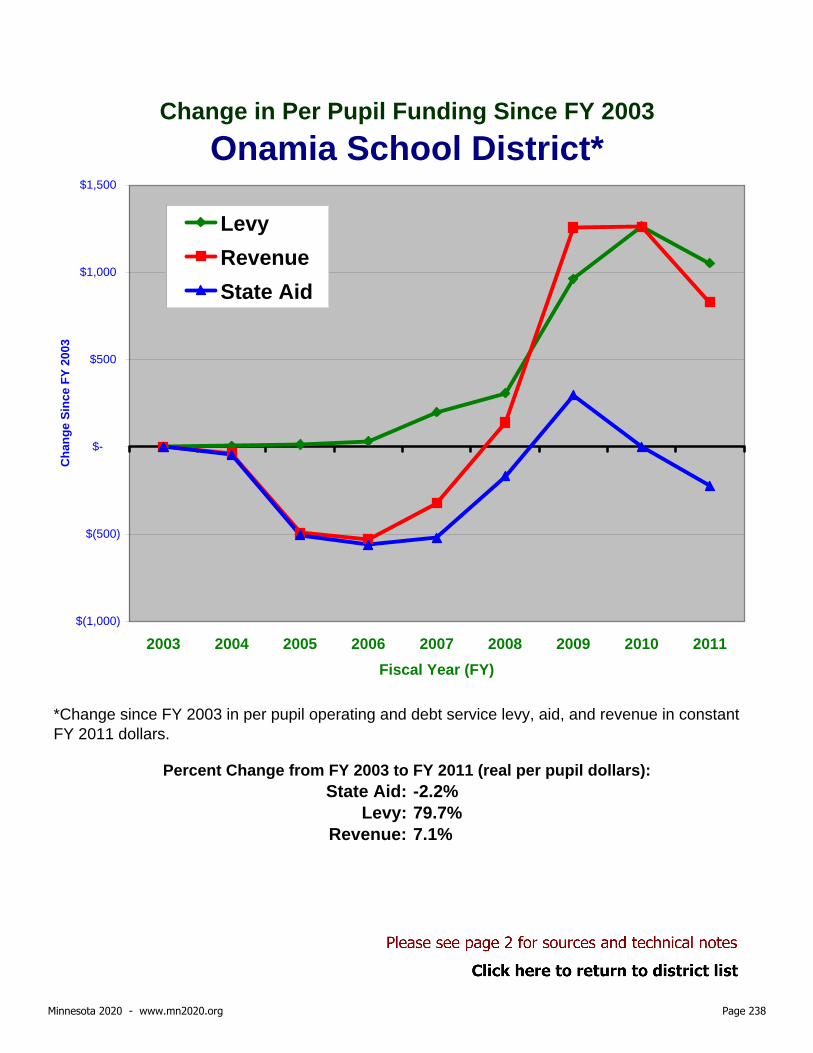
State Aid: -2.2%Levy: 79.7%
Revenue: 7.1%
Percent Change from FY 2003 to FY 2011 (real per pupil dollars):
*Change since FY 2003 in per pupil operating and debt service levy, aid, and revenue in constant FY 2011 dollars.
Change in Per Pupil Funding Since FY 2003Onamia School District*
$(1,000)
$(500)
$-
$500
$1,000
$1,500
2003 2004 2005 2006 2007 2008 2009 2010 2011Fiscal Year (FY)
Cha
nge
Sinc
e FY
200
3
LevyRevenueState Aid
Minnesota 2020 - www.mn2020.org Page 238

State Aid: -15.9%Levy: 61.9%
Revenue: -0.3%
Percent Change from FY 2003 to FY 2011 (real per pupil dollars):
*Change since FY 2003 in per pupil operating and debt service levy, aid, and revenue in constant FY 2011 dollars.
Change in Per Pupil Funding Since FY 2003Orono School District*
$(2,000)
$(1,500)
$(1,000)
$(500)
$-
$500
$1,000
$1,500
2003 2004 2005 2006 2007 2008 2009 2010 2011Fiscal Year (FY)
Cha
nge
Sinc
e FY
200
3
LevyRevenueState Aid
Minnesota 2020 - www.mn2020.org Page 239

State Aid: -19.3%Levy: 105.4%
Revenue: -6.5%
Percent Change from FY 2003 to FY 2011 (real per pupil dollars):
*Change since FY 2003 in per pupil operating and debt service levy, aid, and revenue in constant FY 2011 dollars.
Change in Per Pupil Funding Since FY 2003Ortonville-Bellingham School District*
$(2,500)
$(2,000)
$(1,500)
$(1,000)
$(500)
$-
$500
$1,000
$1,500
$2,000
2003 2004 2005 2006 2007 2008 2009 2010 2011Fiscal Year (FY)
Cha
nge
Sinc
e FY
200
3
LevyRevenueState Aid
Minnesota 2020 - www.mn2020.org Page 240

State Aid: -16.9%Levy: 23.8%
Revenue: -11.1%
Percent Change from FY 2003 to FY 2011 (real per pupil dollars):
*Change since FY 2003 in per pupil operating and debt service levy, aid, and revenue in constant FY 2011 dollars.
Change in Per Pupil Funding Since FY 2003Osakis School District*
$(2,000)
$(1,500)
$(1,000)
$(500)
$-
$500
$1,000
2003 2004 2005 2006 2007 2008 2009 2010 2011Fiscal Year (FY)
Cha
nge
Sinc
e FY
200
3
LevyRevenueState Aid
Minnesota 2020 - www.mn2020.org Page 241

State Aid: -8.8%Levy: 75.1%
Revenue: 5.1%
Percent Change from FY 2003 to FY 2011 (real per pupil dollars):
*Change since FY 2003 in per pupil operating and debt service levy, aid, and revenue in constant FY 2011 dollars.
Change in Per Pupil Funding Since FY 2003Osseo School District*
$(1,500)
$(1,000)
$(500)
$-
$500
$1,000
$1,500
$2,000
2003 2004 2005 2006 2007 2008 2009 2010 2011Fiscal Year (FY)
Cha
nge
Sinc
e FY
200
3
LevyRevenueState Aid
Minnesota 2020 - www.mn2020.org Page 242

State Aid: -12.6%Levy: 55.3%
Revenue: -5.5%
Percent Change from FY 2003 to FY 2011 (real per pupil dollars):
*Change since FY 2003 in per pupil operating and debt service levy, aid, and revenue in constant FY 2011 dollars.
Change in Per Pupil Funding Since FY 2003Owatonna School District*
$(1,500)
$(1,000)
$(500)
$-
$500
$1,000
2003 2004 2005 2006 2007 2008 2009 2010 2011Fiscal Year (FY)
Cha
nge
Sinc
e FY
200
3
LevyRevenueState Aid
Minnesota 2020 - www.mn2020.org Page 243

State Aid: -16.7%Levy: 39.4%
Revenue: -6.7%
Percent Change from FY 2003 to FY 2011 (real per pupil dollars):
*Change since FY 2003 in per pupil operating and debt service levy, aid, and revenue in constant FY 2011 dollars.
Change in Per Pupil Funding Since FY 2003Park Rapids School District*
$(2,000)
$(1,500)
$(1,000)
$(500)
$-
$500
$1,000
$1,500
2003 2004 2005 2006 2007 2008 2009 2010 2011Fiscal Year (FY)
Cha
nge
Sinc
e FY
200
3
LevyRevenueState Aid
Minnesota 2020 - www.mn2020.org Page 244

State Aid: -14.6%Levy: 165.3%
Revenue: -0.3%
Percent Change from FY 2003 to FY 2011 (real per pupil dollars):
*Change since FY 2003 in per pupil operating and debt service levy, aid, and revenue in constant FY 2011 dollars.
Change in Per Pupil Funding Since FY 2003Parkers Prairie School District*
$(2,000)
$(1,500)
$(1,000)
$(500)
$-
$500
$1,000
$1,500
$2,000
2003 2004 2005 2006 2007 2008 2009 2010 2011Fiscal Year (FY)
Cha
nge
Sinc
e FY
200
3
LevyRevenueState Aid
Minnesota 2020 - www.mn2020.org Page 245

State Aid: -13.6%Levy: 57.5%
Revenue: -6.4%
Percent Change from FY 2003 to FY 2011 (real per pupil dollars):
*Change since FY 2003 in per pupil operating and debt service levy, aid, and revenue in constant FY 2011 dollars.
Change in Per Pupil Funding Since FY 2003Paynesville School District*
$(1,500)
$(1,000)
$(500)
$-
$500
$1,000
2003 2004 2005 2006 2007 2008 2009 2010 2011Fiscal Year (FY)
Cha
nge
Sinc
e FY
200
3
LevyRevenueState Aid
Minnesota 2020 - www.mn2020.org Page 246

State Aid: -14.4%Levy: 1915.6%
Revenue: -4.2%
Percent Change from FY 2003 to FY 2011 (real per pupil dollars):
*Change since FY 2003 in per pupil operating and debt service levy, aid, and revenue in constant FY 2011 dollars.
Change in Per Pupil Funding Since FY 2003Pelican Rapids School District*
$(1,500)
$(1,000)
$(500)
$-
$500
$1,000
$1,500
2003 2004 2005 2006 2007 2008 2009 2010 2011Fiscal Year (FY)
Cha
nge
Sinc
e FY
200
3
LevyRevenueState Aid
Minnesota 2020 - www.mn2020.org Page 247

State Aid: -11.7%Levy: 17.2%
Revenue: -6.7%
Percent Change from FY 2003 to FY 2011 (real per pupil dollars):
*Change since FY 2003 in per pupil operating and debt service levy, aid, and revenue in constant FY 2011 dollars.
Change in Per Pupil Funding Since FY 2003Pequot Lakes School District*
$(1,600)
$(1,400)
$(1,200)
$(1,000)
$(800)
$(600)
$(400)
$(200)
$-
$200
$400
2003 2004 2005 2006 2007 2008 2009 2010 2011Fiscal Year (FY)
Cha
nge
Sinc
e FY
200
3
LevyRevenueState Aid
Minnesota 2020 - www.mn2020.org Page 248

State Aid: -17.5%Levy: 62.7%
Revenue: -9.8%
Percent Change from FY 2003 to FY 2011 (real per pupil dollars):
*Change since FY 2003 in per pupil operating and debt service levy, aid, and revenue in constant FY 2011 dollars.
Change in Per Pupil Funding Since FY 2003Perham School District*
$(2,000)
$(1,500)
$(1,000)
$(500)
$-
$500
$1,000
2003 2004 2005 2006 2007 2008 2009 2010 2011Fiscal Year (FY)
Cha
nge
Sinc
e FY
200
3
LevyRevenueState Aid
Minnesota 2020 - www.mn2020.org Page 249

State Aid: -12.3%Levy: 46.3%
Revenue: -7.8%
Percent Change from FY 2003 to FY 2011 (real per pupil dollars):
*Change since FY 2003 in per pupil operating and debt service levy, aid, and revenue in constant FY 2011 dollars.
Change in Per Pupil Funding Since FY 2003Pierz School District*
$(1,400)
$(1,200)
$(1,000)
$(800)
$(600)
$(400)
$(200)
$-
$200
$400
$600
2003 2004 2005 2006 2007 2008 2009 2010 2011Fiscal Year (FY)
Cha
nge
Sinc
e FY
200
3
LevyRevenueState Aid
Minnesota 2020 - www.mn2020.org Page 250

State Aid: -15.2%Levy: 24.6%
Revenue: -11.2%
Percent Change from FY 2003 to FY 2011 (real per pupil dollars):
*Change since FY 2003 in per pupil operating and debt service levy, aid, and revenue in constant FY 2011 dollars.
Change in Per Pupil Funding Since FY 2003Pillager School District*
$(2,000)
$(1,500)
$(1,000)
$(500)
$-
$500
2003 2004 2005 2006 2007 2008 2009 2010 2011Fiscal Year (FY)
Cha
nge
Sinc
e FY
200
3
LevyRevenueState Aid
Minnesota 2020 - www.mn2020.org Page 251

State Aid: -11.6%Levy: 200.9%
Revenue: 3.2%
Percent Change from FY 2003 to FY 2011 (real per pupil dollars):
*Change since FY 2003 in per pupil operating and debt service levy, aid, and revenue in constant FY 2011 dollars.
Change in Per Pupil Funding Since FY 2003Pine City School District*
$(1,500)
$(1,000)
$(500)
$-
$500
$1,000
$1,500
2003 2004 2005 2006 2007 2008 2009 2010 2011Fiscal Year (FY)
Cha
nge
Sinc
e FY
200
3
LevyRevenueState Aid
Minnesota 2020 - www.mn2020.org Page 252

State Aid: -15.0%Levy: 95.7%
Revenue: -5.8%
Percent Change from FY 2003 to FY 2011 (real per pupil dollars):
*Change since FY 2003 in per pupil operating and debt service levy, aid, and revenue in constant FY 2011 dollars.
Change in Per Pupil Funding Since FY 2003Pine Island School District*
$(1,500)
$(1,000)
$(500)
$-
$500
$1,000
2003 2004 2005 2006 2007 2008 2009 2010 2011Fiscal Year (FY)
Cha
nge
Sinc
e FY
200
3
LevyRevenueState Aid
Minnesota 2020 - www.mn2020.org Page 253

State Aid: -8.7%Levy: -
Revenue: -8.7%
Percent Change from FY 2003 to FY 2011 (real per pupil dollars):
*Change since FY 2003 in per pupil operating and debt service levy, aid, and revenue in constant FY 2011 dollars.
Change in Per Pupil Funding Since FY 2003Pine Point School District*
$(1,500)
$(1,000)
$(500)
$-
$500
$1,000
$1,500
2003 2004 2005 2006 2007 2008 2009 2010 2011Fiscal Year (FY)
Cha
nge
Sinc
e FY
200
3
LevyRevenueState Aid
Minnesota 2020 - www.mn2020.org Page 254

State Aid: -9.9%Levy: 157.0%
Revenue: -1.9%
Percent Change from FY 2003 to FY 2011 (real per pupil dollars):
*Change since FY 2003 in per pupil operating and debt service levy, aid, and revenue in constant FY 2011 dollars.
Change in Per Pupil Funding Since FY 2003Pine River-Backus School District*
$(1,500)
$(1,000)
$(500)
$-
$500
$1,000
2003 2004 2005 2006 2007 2008 2009 2010 2011Fiscal Year (FY)
Cha
nge
Sinc
e FY
200
3
LevyRevenueState Aid
Minnesota 2020 - www.mn2020.org Page 255

State Aid: -11.4%Levy: 39.6%
Revenue: -3.8%
Percent Change from FY 2003 to FY 2011 (real per pupil dollars):
*Change since FY 2003 in per pupil operating and debt service levy, aid, and revenue in constant FY 2011 dollars.
Change in Per Pupil Funding Since FY 2003Pipestone Area School District*
$(2,000)
$(1,500)
$(1,000)
$(500)
$-
$500
$1,000
2003 2004 2005 2006 2007 2008 2009 2010 2011Fiscal Year (FY)
Cha
nge
Sinc
e FY
200
3
LevyRevenueState Aid
Minnesota 2020 - www.mn2020.org Page 256

State Aid: -18.7%Levy: 16.6%
Revenue: -14.8%
Percent Change from FY 2003 to FY 2011 (real per pupil dollars):
*Change since FY 2003 in per pupil operating and debt service levy, aid, and revenue in constant FY 2011 dollars.
Change in Per Pupil Funding Since FY 2003Plainview-Elgin-Millville School District*
$(2,000)
$(1,500)
$(1,000)
$(500)
$-
$500
2003 2004 2005 2006 2007 2008 2009 2010 2011Fiscal Year (FY)
Cha
nge
Sinc
e FY
200
3
LevyRevenueState Aid
Minnesota 2020 - www.mn2020.org Page 257
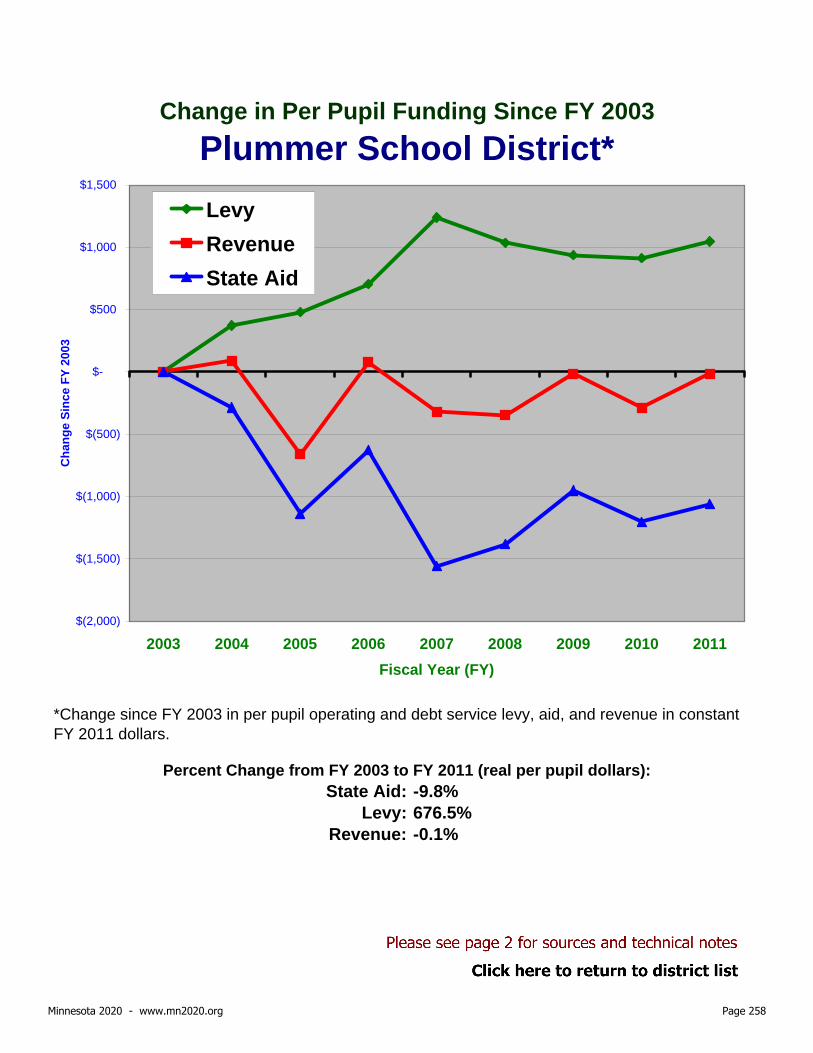
State Aid: -9.8%Levy: 676.5%
Revenue: -0.1%
Percent Change from FY 2003 to FY 2011 (real per pupil dollars):
*Change since FY 2003 in per pupil operating and debt service levy, aid, and revenue in constant FY 2011 dollars.
Change in Per Pupil Funding Since FY 2003Plummer School District*
$(2,000)
$(1,500)
$(1,000)
$(500)
$-
$500
$1,000
$1,500
2003 2004 2005 2006 2007 2008 2009 2010 2011Fiscal Year (FY)
Cha
nge
Sinc
e FY
200
3
LevyRevenueState Aid
Minnesota 2020 - www.mn2020.org Page 258

State Aid: -11.2%Levy: 49.2%
Revenue: -4.9%
Percent Change from FY 2003 to FY 2011 (real per pupil dollars):
*Change since FY 2003 in per pupil operating and debt service levy, aid, and revenue in constant FY 2011 dollars.
Change in Per Pupil Funding Since FY 2003Princeton School District*
$(1,200)
$(1,000)
$(800)
$(600)
$(400)
$(200)
$-
$200
$400
$600
2003 2004 2005 2006 2007 2008 2009 2010 2011Fiscal Year (FY)
Cha
nge
Sinc
e FY
200
3
LevyRevenueState Aid
Minnesota 2020 - www.mn2020.org Page 259

State Aid: -16.0%Levy: 74.3%
Revenue: 1.8%
Percent Change from FY 2003 to FY 2011 (real per pupil dollars):
*Change since FY 2003 in per pupil operating and debt service levy, aid, and revenue in constant FY 2011 dollars.
Change in Per Pupil Funding Since FY 2003Prior Lake School District*
$(2,000)
$(1,500)
$(1,000)
$(500)
$-
$500
$1,000
$1,500
$2,000
2003 2004 2005 2006 2007 2008 2009 2010 2011Fiscal Year (FY)
Cha
nge
Sinc
e FY
200
3
LevyRevenueState Aid
Minnesota 2020 - www.mn2020.org Page 260

State Aid: -18.2%Levy: 37.8%
Revenue: -12.8%
Percent Change from FY 2003 to FY 2011 (real per pupil dollars):
*Change since FY 2003 in per pupil operating and debt service levy, aid, and revenue in constant FY 2011 dollars.
Change in Per Pupil Funding Since FY 2003Proctor School District*
$(2,000)
$(1,500)
$(1,000)
$(500)
$-
$500
2003 2004 2005 2006 2007 2008 2009 2010 2011Fiscal Year (FY)
Cha
nge
Sinc
e FY
200
3
LevyRevenueState Aid
Minnesota 2020 - www.mn2020.org Page 261

State Aid: -19.5%Levy: -23.5%
Revenue: -20.4%
Percent Change from FY 2003 to FY 2011 (real per pupil dollars):
*Change since FY 2003 in per pupil operating and debt service levy, aid, and revenue in constant FY 2011 dollars.
Change in Per Pupil Funding Since FY 2003Randolph School District*
$(2,500)
$(2,000)
$(1,500)
$(1,000)
$(500)
$-
2003 2004 2005 2006 2007 2008 2009 2010 2011Fiscal Year (FY)
Cha
nge
Sinc
e FY
200
3
LevyRevenueState Aid
Minnesota 2020 - www.mn2020.org Page 262

State Aid: -10.7%Levy: 334.5%
Revenue: -10.6%
Percent Change from FY 2003 to FY 2011 (real per pupil dollars):
*Change since FY 2003 in per pupil operating and debt service levy, aid, and revenue in constant FY 2011 dollars.
Change in Per Pupil Funding Since FY 2003Red Lake School District*
$(1,800)
$(1,600)
$(1,400)
$(1,200)
$(1,000)
$(800)
$(600)
$(400)
$(200)
$-
$200
2003 2004 2005 2006 2007 2008 2009 2010 2011Fiscal Year (FY)
Cha
nge
Sinc
e FY
200
3
LevyRevenueState Aid
Minnesota 2020 - www.mn2020.org Page 263

State Aid: -7.6%Levy: 138.9%
Revenue: 3.8%
Percent Change from FY 2003 to FY 2011 (real per pupil dollars):
*Change since FY 2003 in per pupil operating and debt service levy, aid, and revenue in constant FY 2011 dollars.
Change in Per Pupil Funding Since FY 2003Red Lake Falls School District*
$(1,000)
$(500)
$-
$500
$1,000
$1,500
2003 2004 2005 2006 2007 2008 2009 2010 2011Fiscal Year (FY)
Cha
nge
Sinc
e FY
200
3
LevyRevenueState Aid
Minnesota 2020 - www.mn2020.org Page 264

State Aid: -4.5%Levy: 7154.4%
Revenue: 8.3%
Percent Change from FY 2003 to FY 2011 (real per pupil dollars):
*Change since FY 2003 in per pupil operating and debt service levy, aid, and revenue in constant FY 2011 dollars.
Change in Per Pupil Funding Since FY 2003Red Rock Central School District*
$(600)
$(400)
$(200)
$-
$200
$400
$600
$800
$1,000
$1,200
$1,400
2003 2004 2005 2006 2007 2008 2009 2010 2011Fiscal Year (FY)
Cha
nge
Sinc
e FY
200
3
LevyRevenueState Aid
Minnesota 2020 - www.mn2020.org Page 265

State Aid: -15.1%Levy: 69.3%
Revenue: -0.6%
Percent Change from FY 2003 to FY 2011 (real per pupil dollars):
*Change since FY 2003 in per pupil operating and debt service levy, aid, and revenue in constant FY 2011 dollars.
Change in Per Pupil Funding Since FY 2003Red Wing School District*
$(1,500)
$(1,000)
$(500)
$-
$500
$1,000
$1,500
2003 2004 2005 2006 2007 2008 2009 2010 2011Fiscal Year (FY)
Cha
nge
Sinc
e FY
200
3
LevyRevenueState Aid
Minnesota 2020 - www.mn2020.org Page 266

State Aid: -12.4%Levy: 83.1%
Revenue: -2.2%
Percent Change from FY 2003 to FY 2011 (real per pupil dollars):
*Change since FY 2003 in per pupil operating and debt service levy, aid, and revenue in constant FY 2011 dollars.
Change in Per Pupil Funding Since FY 2003Redwood Falls Area School District*
$(1,500)
$(1,000)
$(500)
$-
$500
$1,000
2003 2004 2005 2006 2007 2008 2009 2010 2011Fiscal Year (FY)
Cha
nge
Sinc
e FY
200
3
LevyRevenueState Aid
Minnesota 2020 - www.mn2020.org Page 267

State Aid: -7.9%Levy: 625.3%
Revenue: 15.3%
Percent Change from FY 2003 to FY 2011 (real per pupil dollars):
*Change since FY 2003 in per pupil operating and debt service levy, aid, and revenue in constant FY 2011 dollars.
Change in Per Pupil Funding Since FY 2003Renville County West School District*
$(1,000)
$(500)
$-
$500
$1,000
$1,500
$2,000
$2,500
2003 2004 2005 2006 2007 2008 2009 2010 2011Fiscal Year (FY)
Cha
nge
Sinc
e FY
200
3
LevyRevenueState Aid
Minnesota 2020 - www.mn2020.org Page 268

State Aid: -3.7%Levy: 58.8%
Revenue: 7.4%
Percent Change from FY 2003 to FY 2011 (real per pupil dollars):
*Change since FY 2003 in per pupil operating and debt service levy, aid, and revenue in constant FY 2011 dollars.
Change in Per Pupil Funding Since FY 2003Richfield School District*
$(1,000)
$(500)
$-
$500
$1,000
$1,500
2003 2004 2005 2006 2007 2008 2009 2010 2011Fiscal Year (FY)
Cha
nge
Sinc
e FY
200
3
LevyRevenueState Aid
Minnesota 2020 - www.mn2020.org Page 269
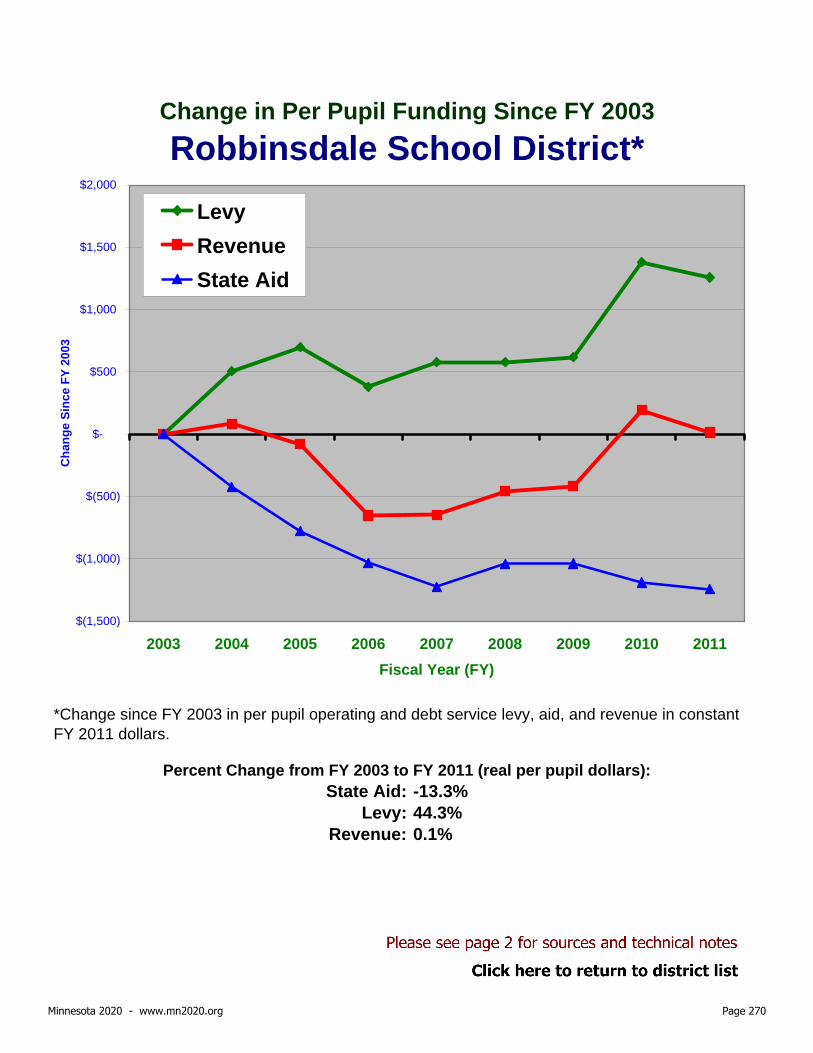
State Aid: -13.3%Levy: 44.3%
Revenue: 0.1%
Percent Change from FY 2003 to FY 2011 (real per pupil dollars):
*Change since FY 2003 in per pupil operating and debt service levy, aid, and revenue in constant FY 2011 dollars.
Change in Per Pupil Funding Since FY 2003Robbinsdale School District*
$(1,500)
$(1,000)
$(500)
$-
$500
$1,000
$1,500
$2,000
2003 2004 2005 2006 2007 2008 2009 2010 2011Fiscal Year (FY)
Cha
nge
Sinc
e FY
200
3
LevyRevenueState Aid
Minnesota 2020 - www.mn2020.org Page 270

State Aid: -17.7%Levy: -4.8%
Revenue: -15.2%
Percent Change from FY 2003 to FY 2011 (real per pupil dollars):
*Change since FY 2003 in per pupil operating and debt service levy, aid, and revenue in constant FY 2011 dollars.
Change in Per Pupil Funding Since FY 2003Rochester School District*
$(2,000)
$(1,500)
$(1,000)
$(500)
$-
$500
2003 2004 2005 2006 2007 2008 2009 2010 2011Fiscal Year (FY)
Cha
nge
Sinc
e FY
200
3
LevyRevenueState Aid
Minnesota 2020 - www.mn2020.org Page 271

State Aid: -23.3%Levy: 46.2%
Revenue: -11.0%
Percent Change from FY 2003 to FY 2011 (real per pupil dollars):
*Change since FY 2003 in per pupil operating and debt service levy, aid, and revenue in constant FY 2011 dollars.
Change in Per Pupil Funding Since FY 2003Rockford School District*
$(2,500)
$(2,000)
$(1,500)
$(1,000)
$(500)
$-
$500
$1,000
$1,500
2003 2004 2005 2006 2007 2008 2009 2010 2011Fiscal Year (FY)
Cha
nge
Sinc
e FY
200
3
LevyRevenueState Aid
Minnesota 2020 - www.mn2020.org Page 272

State Aid: -15.6%Levy: 159.5%
Revenue: -0.6%
Percent Change from FY 2003 to FY 2011 (real per pupil dollars):
*Change since FY 2003 in per pupil operating and debt service levy, aid, and revenue in constant FY 2011 dollars.
Change in Per Pupil Funding Since FY 2003ROCORI Area School District*
$(1,500)
$(1,000)
$(500)
$-
$500
$1,000
$1,500
2003 2004 2005 2006 2007 2008 2009 2010 2011Fiscal Year (FY)
Cha
nge
Sinc
e FY
200
3
LevyRevenueState Aid
Minnesota 2020 - www.mn2020.org Page 273

State Aid: -15.5%Levy: 67.2%
Revenue: -7.2%
Percent Change from FY 2003 to FY 2011 (real per pupil dollars):
*Change since FY 2003 in per pupil operating and debt service levy, aid, and revenue in constant FY 2011 dollars.
Change in Per Pupil Funding Since FY 2003Roseau School District*
$(2,000)
$(1,500)
$(1,000)
$(500)
$-
$500
$1,000
2003 2004 2005 2006 2007 2008 2009 2010 2011Fiscal Year (FY)
Cha
nge
Sinc
e FY
200
3
LevyRevenueState Aid
Minnesota 2020 - www.mn2020.org Page 274

State Aid: -10.0%Levy: 33.0%
Revenue: -1.9%
Percent Change from FY 2003 to FY 2011 (real per pupil dollars):
*Change since FY 2003 in per pupil operating and debt service levy, aid, and revenue in constant FY 2011 dollars.
Change in Per Pupil Funding Since FY 2003Rosemount-Apple Valley-Eagan School District*
$(1,000)
$(800)
$(600)
$(400)
$(200)
$-
$200
$400
$600
$800
$1,000
2003 2004 2005 2006 2007 2008 2009 2010 2011Fiscal Year (FY)
Cha
nge
Sinc
e FY
200
3
LevyRevenueState Aid
Minnesota 2020 - www.mn2020.org Page 275
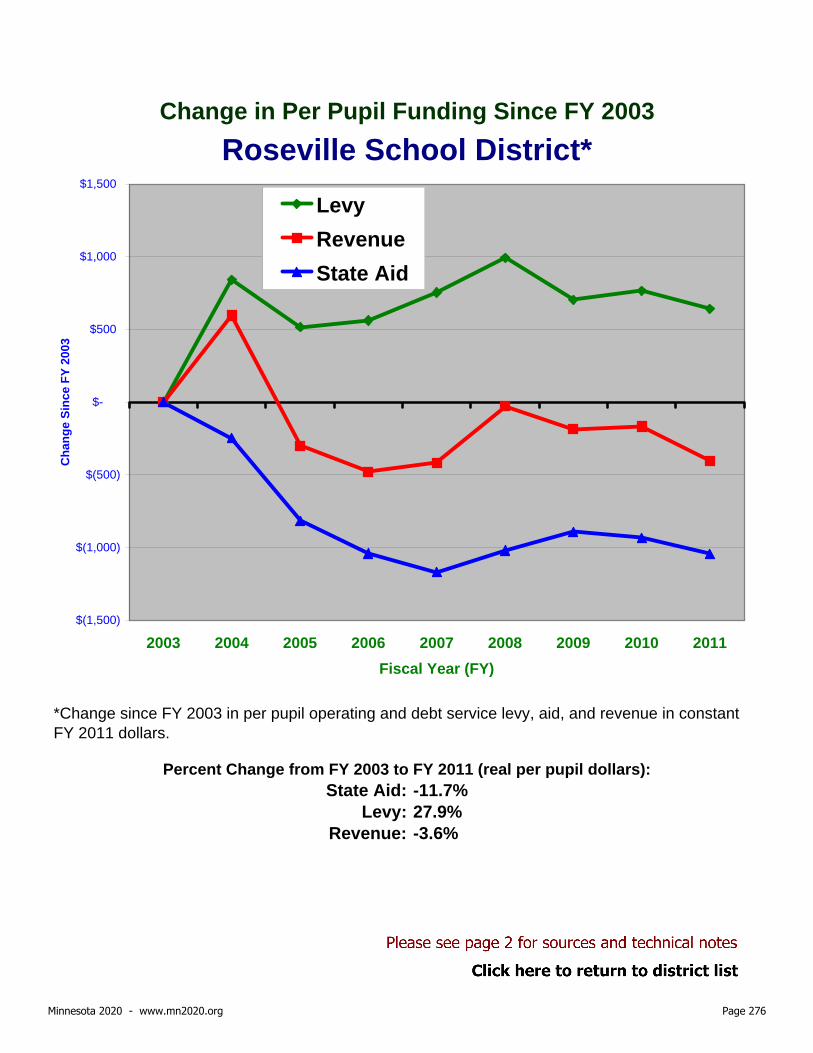
State Aid: -11.7%Levy: 27.9%
Revenue: -3.6%
Percent Change from FY 2003 to FY 2011 (real per pupil dollars):
*Change since FY 2003 in per pupil operating and debt service levy, aid, and revenue in constant FY 2011 dollars.
Change in Per Pupil Funding Since FY 2003Roseville School District*
$(1,500)
$(1,000)
$(500)
$-
$500
$1,000
$1,500
2003 2004 2005 2006 2007 2008 2009 2010 2011Fiscal Year (FY)
Cha
nge
Sinc
e FY
200
3
LevyRevenueState Aid
Minnesota 2020 - www.mn2020.org Page 276

State Aid: -14.3%Levy: 487.8%
Revenue: 0.6%
Percent Change from FY 2003 to FY 2011 (real per pupil dollars):
*Change since FY 2003 in per pupil operating and debt service levy, aid, and revenue in constant FY 2011 dollars.
Change in Per Pupil Funding Since FY 2003Rothsay School District*
$(2,000)
$(1,500)
$(1,000)
$(500)
$-
$500
$1,000
$1,500
$2,000
2003 2004 2005 2006 2007 2008 2009 2010 2011Fiscal Year (FY)
Cha
nge
Sinc
e FY
200
3
LevyRevenueState Aid
Minnesota 2020 - www.mn2020.org Page 277

State Aid: -18.0%Levy: 140.9%
Revenue: -7.5%
Percent Change from FY 2003 to FY 2011 (real per pupil dollars):
*Change since FY 2003 in per pupil operating and debt service levy, aid, and revenue in constant FY 2011 dollars.
Change in Per Pupil Funding Since FY 2003Round Lake School District*
$(2,000)
$(1,500)
$(1,000)
$(500)
$-
$500
$1,000
$1,500
2003 2004 2005 2006 2007 2008 2009 2010 2011Fiscal Year (FY)
Cha
nge
Sinc
e FY
200
3
LevyRevenueState Aid
Minnesota 2020 - www.mn2020.org Page 278

State Aid: -22.1%Levy: 10.2%
Revenue: -18.9%
Percent Change from FY 2003 to FY 2011 (real per pupil dollars):
*Change since FY 2003 in per pupil operating and debt service levy, aid, and revenue in constant FY 2011 dollars.
Change in Per Pupil Funding Since FY 2003Royalton School District*
$(2,500)
$(2,000)
$(1,500)
$(1,000)
$(500)
$-
$500
$1,000
2003 2004 2005 2006 2007 2008 2009 2010 2011Fiscal Year (FY)
Cha
nge
Sinc
e FY
200
3
LevyRevenueState Aid
Minnesota 2020 - www.mn2020.org Page 279

State Aid: -3.7%Levy: 180.0%
Revenue: 2.7%
Percent Change from FY 2003 to FY 2011 (real per pupil dollars):
*Change since FY 2003 in per pupil operating and debt service levy, aid, and revenue in constant FY 2011 dollars.
Change in Per Pupil Funding Since FY 2003RTR Public School District*
$(1,200)
$(1,000)
$(800)
$(600)
$(400)
$(200)
$-
$200
$400
$600
$800
2003 2004 2005 2006 2007 2008 2009 2010 2011Fiscal Year (FY)
Cha
nge
Sinc
e FY
200
3
LevyRevenueState Aid
Minnesota 2020 - www.mn2020.org Page 280

State Aid: -17.4%Levy: 35.6%
Revenue: -9.2%
Percent Change from FY 2003 to FY 2011 (real per pupil dollars):
*Change since FY 2003 in per pupil operating and debt service levy, aid, and revenue in constant FY 2011 dollars.
Change in Per Pupil Funding Since FY 2003Rush City School District*
$(2,000)
$(1,500)
$(1,000)
$(500)
$-
$500
$1,000
2003 2004 2005 2006 2007 2008 2009 2010 2011Fiscal Year (FY)
Cha
nge
Sinc
e FY
200
3
LevyRevenueState Aid
Minnesota 2020 - www.mn2020.org Page 281

State Aid: -13.0%Levy: 90.8%
Revenue: -6.3%
Percent Change from FY 2003 to FY 2011 (real per pupil dollars):
*Change since FY 2003 in per pupil operating and debt service levy, aid, and revenue in constant FY 2011 dollars.
Change in Per Pupil Funding Since FY 2003Rushford-Peterson School District*
$(2,000)
$(1,500)
$(1,000)
$(500)
$-
$500
$1,000
2003 2004 2005 2006 2007 2008 2009 2010 2011Fiscal Year (FY)
Cha
nge
Sinc
e FY
200
3
LevyRevenueState Aid
Minnesota 2020 - www.mn2020.org Page 282

State Aid: -13.1%Levy: 35.7%
Revenue: -3.8%
Percent Change from FY 2003 to FY 2011 (real per pupil dollars):
*Change since FY 2003 in per pupil operating and debt service levy, aid, and revenue in constant FY 2011 dollars.
Change in Per Pupil Funding Since FY 2003Saint Anthony-New Brighton School District*
$(2,000)
$(1,500)
$(1,000)
$(500)
$-
$500
$1,000
2003 2004 2005 2006 2007 2008 2009 2010 2011Fiscal Year (FY)
Cha
nge
Sinc
e FY
200
3
LevyRevenueState Aid
Minnesota 2020 - www.mn2020.org Page 283

State Aid: -16.6%Levy: 9.0%
Revenue: -13.9%
Percent Change from FY 2003 to FY 2011 (real per pupil dollars):
*Change since FY 2003 in per pupil operating and debt service levy, aid, and revenue in constant FY 2011 dollars.
Change in Per Pupil Funding Since FY 2003Saint Charles School District*
$(1,600)
$(1,400)
$(1,200)
$(1,000)
$(800)
$(600)
$(400)
$(200)
$-
$200
2003 2004 2005 2006 2007 2008 2009 2010 2011Fiscal Year (FY)
Cha
nge
Sinc
e FY
200
3
LevyRevenueState Aid
Minnesota 2020 - www.mn2020.org Page 284

State Aid: -30.8%Levy: 43.3%
Revenue: -20.6%
Percent Change from FY 2003 to FY 2011 (real per pupil dollars):
*Change since FY 2003 in per pupil operating and debt service levy, aid, and revenue in constant FY 2011 dollars.
Change in Per Pupil Funding Since FY 2003Saint Clair School District*
$(3,500)
$(3,000)
$(2,500)
$(2,000)
$(1,500)
$(1,000)
$(500)
$-
$500
$1,000
2003 2004 2005 2006 2007 2008 2009 2010 2011Fiscal Year (FY)
Cha
nge
Sinc
e FY
200
3
LevyRevenueState Aid
Minnesota 2020 - www.mn2020.org Page 285

State Aid: -14.6%Levy: 90.0%
Revenue: -6.1%
Percent Change from FY 2003 to FY 2011 (real per pupil dollars):
*Change since FY 2003 in per pupil operating and debt service levy, aid, and revenue in constant FY 2011 dollars.
Change in Per Pupil Funding Since FY 2003Saint Cloud School District*
$(2,000)
$(1,500)
$(1,000)
$(500)
$-
$500
$1,000
$1,500
2003 2004 2005 2006 2007 2008 2009 2010 2011Fiscal Year (FY)
Cha
nge
Sinc
e FY
200
3
LevyRevenueState Aid
Minnesota 2020 - www.mn2020.org Page 286

State Aid: -10.2%Levy: 86.5%
Revenue: 0.7%
Percent Change from FY 2003 to FY 2011 (real per pupil dollars):
*Change since FY 2003 in per pupil operating and debt service levy, aid, and revenue in constant FY 2011 dollars.
Change in Per Pupil Funding Since FY 2003Saint Francis School District*
$(1,000)
$(500)
$-
$500
$1,000
$1,500
2003 2004 2005 2006 2007 2008 2009 2010 2011Fiscal Year (FY)
Cha
nge
Sinc
e FY
200
3
LevyRevenueState Aid
Minnesota 2020 - www.mn2020.org Page 287
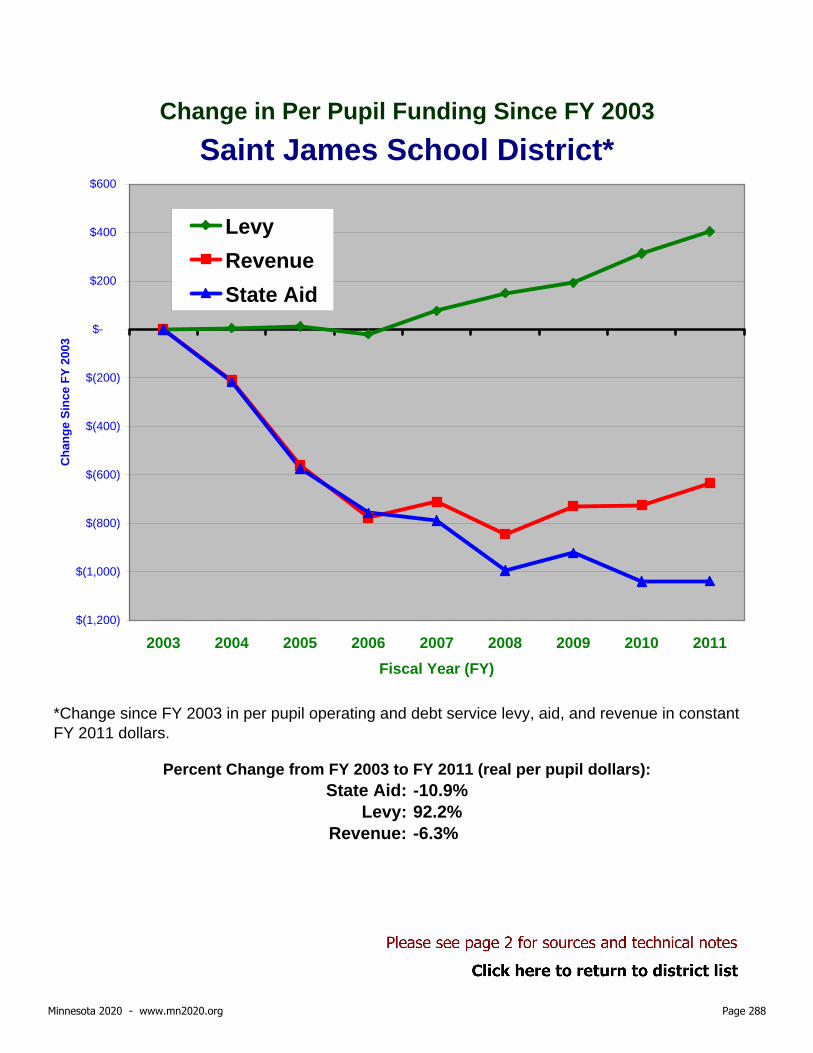
State Aid: -10.9%Levy: 92.2%
Revenue: -6.3%
Percent Change from FY 2003 to FY 2011 (real per pupil dollars):
*Change since FY 2003 in per pupil operating and debt service levy, aid, and revenue in constant FY 2011 dollars.
Change in Per Pupil Funding Since FY 2003Saint James School District*
$(1,200)
$(1,000)
$(800)
$(600)
$(400)
$(200)
$-
$200
$400
$600
2003 2004 2005 2006 2007 2008 2009 2010 2011Fiscal Year (FY)
Cha
nge
Sinc
e FY
200
3
LevyRevenueState Aid
Minnesota 2020 - www.mn2020.org Page 288

State Aid: -10.4%Levy: 1549.4%
Revenue: 21.9%
Percent Change from FY 2003 to FY 2011 (real per pupil dollars):
*Change since FY 2003 in per pupil operating and debt service levy, aid, and revenue in constant FY 2011 dollars.
Change in Per Pupil Funding Since FY 2003Saint Louis County School District*
$(2,000)
$(1,000)
$-
$1,000
$2,000
$3,000
$4,000
2003 2004 2005 2006 2007 2008 2009 2010 2011Fiscal Year (FY)
Cha
nge
Sinc
e FY
200
3
LevyRevenueState Aid
Minnesota 2020 - www.mn2020.org Page 289

State Aid: -17.4%Levy: -0.6%
Revenue: -12.3%
Percent Change from FY 2003 to FY 2011 (real per pupil dollars):
*Change since FY 2003 in per pupil operating and debt service levy, aid, and revenue in constant FY 2011 dollars.
Change in Per Pupil Funding Since FY 2003Saint Louis Park School District*
$(2,000)
$(1,500)
$(1,000)
$(500)
$-
$500
2003 2004 2005 2006 2007 2008 2009 2010 2011Fiscal Year (FY)
Cha
nge
Sinc
e FY
200
3
LevyRevenueState Aid
Minnesota 2020 - www.mn2020.org Page 290

State Aid: -11.2%Levy: 93.3%
Revenue: 2.7%
Percent Change from FY 2003 to FY 2011 (real per pupil dollars):
*Change since FY 2003 in per pupil operating and debt service levy, aid, and revenue in constant FY 2011 dollars.
Change in Per Pupil Funding Since FY 2003Saint Michael-Albertville School District*
$(1,500)
$(1,000)
$(500)
$-
$500
$1,000
$1,500
2003 2004 2005 2006 2007 2008 2009 2010 2011Fiscal Year (FY)
Cha
nge
Sinc
e FY
200
3
LevyRevenueState Aid
Minnesota 2020 - www.mn2020.org Page 291

State Aid: -14.1%Levy: 86.5%
Revenue: -3.6%
Percent Change from FY 2003 to FY 2011 (real per pupil dollars):
*Change since FY 2003 in per pupil operating and debt service levy, aid, and revenue in constant FY 2011 dollars.
Change in Per Pupil Funding Since FY 2003Saint Paul School District*
$(2,000)
$(1,500)
$(1,000)
$(500)
$-
$500
$1,000
$1,500
2003 2004 2005 2006 2007 2008 2009 2010 2011Fiscal Year (FY)
Cha
nge
Sinc
e FY
200
3
LevyRevenueState Aid
Minnesota 2020 - www.mn2020.org Page 292

State Aid: -12.8%Levy: 131.0%
Revenue: -6.3%
Percent Change from FY 2003 to FY 2011 (real per pupil dollars):
*Change since FY 2003 in per pupil operating and debt service levy, aid, and revenue in constant FY 2011 dollars.
Change in Per Pupil Funding Since FY 2003Saint Peter School District*
$(1,500)
$(1,000)
$(500)
$-
$500
$1,000
2003 2004 2005 2006 2007 2008 2009 2010 2011Fiscal Year (FY)
Cha
nge
Sinc
e FY
200
3
LevyRevenueState Aid
Minnesota 2020 - www.mn2020.org Page 293

State Aid: -20.6%Levy: 6.0%
Revenue: -16.4%
Percent Change from FY 2003 to FY 2011 (real per pupil dollars):
*Change since FY 2003 in per pupil operating and debt service levy, aid, and revenue in constant FY 2011 dollars.
Change in Per Pupil Funding Since FY 2003Sartell School District*
$(2,000)
$(1,500)
$(1,000)
$(500)
$-
$500
$1,000
2003 2004 2005 2006 2007 2008 2009 2010 2011Fiscal Year (FY)
Cha
nge
Sinc
e FY
200
3
LevyRevenueState Aid
Minnesota 2020 - www.mn2020.org Page 294

State Aid: -12.2%Levy: 163.0%
Revenue: 4.1%
Percent Change from FY 2003 to FY 2011 (real per pupil dollars):
*Change since FY 2003 in per pupil operating and debt service levy, aid, and revenue in constant FY 2011 dollars.
Change in Per Pupil Funding Since FY 2003Sauk Centre School District*
$(1,500)
$(1,000)
$(500)
$-
$500
$1,000
$1,500
$2,000
2003 2004 2005 2006 2007 2008 2009 2010 2011Fiscal Year (FY)
Cha
nge
Sinc
e FY
200
3
LevyRevenueState Aid
Minnesota 2020 - www.mn2020.org Page 295

State Aid: -18.1%Levy: 37.5%
Revenue: -11.2%
Percent Change from FY 2003 to FY 2011 (real per pupil dollars):
*Change since FY 2003 in per pupil operating and debt service levy, aid, and revenue in constant FY 2011 dollars.
Change in Per Pupil Funding Since FY 2003Sauk Rapids School District*
$(2,000)
$(1,500)
$(1,000)
$(500)
$-
$500
$1,000
2003 2004 2005 2006 2007 2008 2009 2010 2011Fiscal Year (FY)
Cha
nge
Sinc
e FY
200
3
LevyRevenueState Aid
Minnesota 2020 - www.mn2020.org Page 296

State Aid: -6.0%Levy: 1128.3%
Revenue: 1.8%
Percent Change from FY 2003 to FY 2011 (real per pupil dollars):
*Change since FY 2003 in per pupil operating and debt service levy, aid, and revenue in constant FY 2011 dollars.
Change in Per Pupil Funding Since FY 2003Sebeka School District*
$(800)
$(600)
$(400)
$(200)
$-
$200
$400
$600
$800
2003 2004 2005 2006 2007 2008 2009 2010 2011Fiscal Year (FY)
Cha
nge
Sinc
e FY
200
3
LevyRevenueState Aid
Minnesota 2020 - www.mn2020.org Page 297

State Aid: -14.6%Levy: 55.2%
Revenue: -2.6%
Percent Change from FY 2003 to FY 2011 (real per pupil dollars):
*Change since FY 2003 in per pupil operating and debt service levy, aid, and revenue in constant FY 2011 dollars.
Change in Per Pupil Funding Since FY 2003Shakopee School District*
$(1,500)
$(1,000)
$(500)
$-
$500
$1,000
$1,500
2003 2004 2005 2006 2007 2008 2009 2010 2011Fiscal Year (FY)
Cha
nge
Sinc
e FY
200
3
LevyRevenueState Aid
Minnesota 2020 - www.mn2020.org Page 298
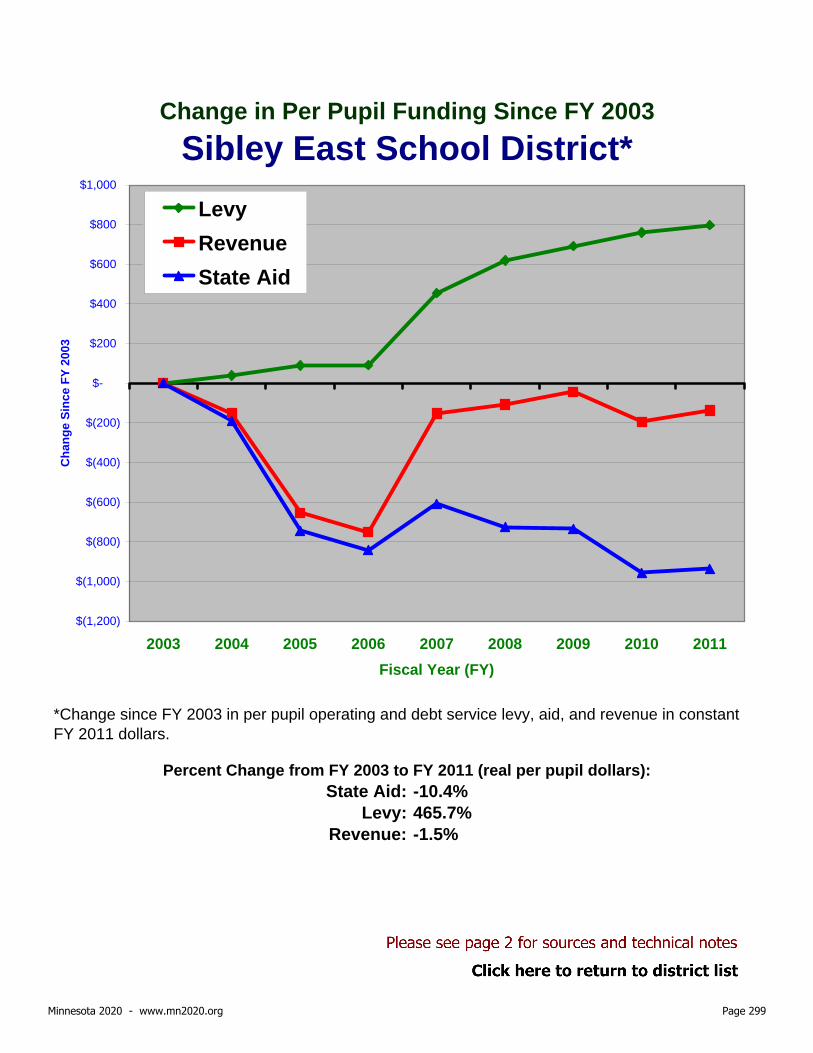
State Aid: -10.4%Levy: 465.7%
Revenue: -1.5%
Percent Change from FY 2003 to FY 2011 (real per pupil dollars):
*Change since FY 2003 in per pupil operating and debt service levy, aid, and revenue in constant FY 2011 dollars.
Change in Per Pupil Funding Since FY 2003Sibley East School District*
$(1,200)
$(1,000)
$(800)
$(600)
$(400)
$(200)
$-
$200
$400
$600
$800
$1,000
2003 2004 2005 2006 2007 2008 2009 2010 2011Fiscal Year (FY)
Cha
nge
Sinc
e FY
200
3
LevyRevenueState Aid
Minnesota 2020 - www.mn2020.org Page 299

State Aid: -12.0%Levy: 58.6%
Revenue: -6.4%
Percent Change from FY 2003 to FY 2011 (real per pupil dollars):
*Change since FY 2003 in per pupil operating and debt service levy, aid, and revenue in constant FY 2011 dollars.
Change in Per Pupil Funding Since FY 2003Sleepy Eye School District*
$(1,400)
$(1,200)
$(1,000)
$(800)
$(600)
$(400)
$(200)
$-
$200
$400
$600
2003 2004 2005 2006 2007 2008 2009 2010 2011Fiscal Year (FY)
Cha
nge
Sinc
e FY
200
3
LevyRevenueState Aid
Minnesota 2020 - www.mn2020.org Page 300

State Aid: -9.4%Levy: 125.7%
Revenue: -2.1%
Percent Change from FY 2003 to FY 2011 (real per pupil dollars):
*Change since FY 2003 in per pupil operating and debt service levy, aid, and revenue in constant FY 2011 dollars.
Change in Per Pupil Funding Since FY 2003South Koochiching School District*
$(2,000)
$(1,500)
$(1,000)
$(500)
$-
$500
$1,000
$1,500
2003 2004 2005 2006 2007 2008 2009 2010 2011Fiscal Year (FY)
Cha
nge
Sinc
e FY
200
3
LevyRevenueState Aid
Minnesota 2020 - www.mn2020.org Page 301

State Aid: -11.2%Levy: 81.6%
Revenue: 0.5%
Percent Change from FY 2003 to FY 2011 (real per pupil dollars):
*Change since FY 2003 in per pupil operating and debt service levy, aid, and revenue in constant FY 2011 dollars.
Change in Per Pupil Funding Since FY 2003South St. Paul School District*
$(1,500)
$(1,000)
$(500)
$-
$500
$1,000
$1,500
2003 2004 2005 2006 2007 2008 2009 2010 2011Fiscal Year (FY)
Cha
nge
Sinc
e FY
200
3
LevyRevenueState Aid
Minnesota 2020 - www.mn2020.org Page 302

State Aid: -13.8%Levy: 13.8%
Revenue: -7.4%
Percent Change from FY 2003 to FY 2011 (real per pupil dollars):
*Change since FY 2003 in per pupil operating and debt service levy, aid, and revenue in constant FY 2011 dollars.
Change in Per Pupil Funding Since FY 2003South Washington School District*
$(1,400)
$(1,200)
$(1,000)
$(800)
$(600)
$(400)
$(200)
$-
$200
$400
$600
2003 2004 2005 2006 2007 2008 2009 2010 2011Fiscal Year (FY)
Cha
nge
Sinc
e FY
200
3
LevyRevenueState Aid
Minnesota 2020 - www.mn2020.org Page 303

State Aid: -10.7%Levy: 180.4%
Revenue: 3.3%
Percent Change from FY 2003 to FY 2011 (real per pupil dollars):
*Change since FY 2003 in per pupil operating and debt service levy, aid, and revenue in constant FY 2011 dollars.
Change in Per Pupil Funding Since FY 2003Southland School District*
$(1,500)
$(1,000)
$(500)
$-
$500
$1,000
$1,500
2003 2004 2005 2006 2007 2008 2009 2010 2011Fiscal Year (FY)
Cha
nge
Sinc
e FY
200
3
LevyRevenueState Aid
Minnesota 2020 - www.mn2020.org Page 304

State Aid: -15.4%Levy: 51.9%
Revenue: -8.4%
Percent Change from FY 2003 to FY 2011 (real per pupil dollars):
*Change since FY 2003 in per pupil operating and debt service levy, aid, and revenue in constant FY 2011 dollars.
Change in Per Pupil Funding Since FY 2003Spring Grove School District*
$(2,000)
$(1,500)
$(1,000)
$(500)
$-
$500
$1,000
2003 2004 2005 2006 2007 2008 2009 2010 2011Fiscal Year (FY)
Cha
nge
Sinc
e FY
200
3
LevyRevenueState Aid
Minnesota 2020 - www.mn2020.org Page 305

State Aid: -13.4%Levy: 160.2%
Revenue: 9.5%
Percent Change from FY 2003 to FY 2011 (real per pupil dollars):
*Change since FY 2003 in per pupil operating and debt service levy, aid, and revenue in constant FY 2011 dollars.
Change in Per Pupil Funding Since FY 2003Spring Lake Park School District*
$(1,500)
$(1,000)
$(500)
$-
$500
$1,000
$1,500
$2,000
$2,500
2003 2004 2005 2006 2007 2008 2009 2010 2011Fiscal Year (FY)
Cha
nge
Sinc
e FY
200
3
LevyRevenueState Aid
Minnesota 2020 - www.mn2020.org Page 306

State Aid: -5.5%Levy: 46.5%
Revenue: -0.1%
Percent Change from FY 2003 to FY 2011 (real per pupil dollars):
*Change since FY 2003 in per pupil operating and debt service levy, aid, and revenue in constant FY 2011 dollars.
Change in Per Pupil Funding Since FY 2003Springfield School District*
$(600)
$(400)
$(200)
$-
$200
$400
$600
2003 2004 2005 2006 2007 2008 2009 2010 2011Fiscal Year (FY)
Cha
nge
Sinc
e FY
200
3
LevyRevenueState Aid
Minnesota 2020 - www.mn2020.org Page 307

State Aid: -12.0%Levy: 120.0%
Revenue: -5.5%
Percent Change from FY 2003 to FY 2011 (real per pupil dollars):
*Change since FY 2003 in per pupil operating and debt service levy, aid, and revenue in constant FY 2011 dollars.
Change in Per Pupil Funding Since FY 2003Staples-Motley School District*
$(1,500)
$(1,000)
$(500)
$-
$500
$1,000
2003 2004 2005 2006 2007 2008 2009 2010 2011Fiscal Year (FY)
Cha
nge
Sinc
e FY
200
3
LevyRevenueState Aid
Minnesota 2020 - www.mn2020.org Page 308

State Aid: -5.7%Levy: 296.5%
Revenue: 1.3%
Percent Change from FY 2003 to FY 2011 (real per pupil dollars):
*Change since FY 2003 in per pupil operating and debt service levy, aid, and revenue in constant FY 2011 dollars.
Change in Per Pupil Funding Since FY 2003Stephen-Argyle Central School District*
$(1,000)
$(800)
$(600)
$(400)
$(200)
$-
$200
$400
$600
$800
$1,000
2003 2004 2005 2006 2007 2008 2009 2010 2011Fiscal Year (FY)
Cha
nge
Sinc
e FY
200
3
LevyRevenueState Aid
Minnesota 2020 - www.mn2020.org Page 309

State Aid: -15.5%Levy: 68.4%
Revenue: -6.8%
Percent Change from FY 2003 to FY 2011 (real per pupil dollars):
*Change since FY 2003 in per pupil operating and debt service levy, aid, and revenue in constant FY 2011 dollars.
Change in Per Pupil Funding Since FY 2003Stewartville School District*
$(1,500)
$(1,000)
$(500)
$-
$500
$1,000
2003 2004 2005 2006 2007 2008 2009 2010 2011Fiscal Year (FY)
Cha
nge
Sinc
e FY
200
3
LevyRevenueState Aid
Minnesota 2020 - www.mn2020.org Page 310
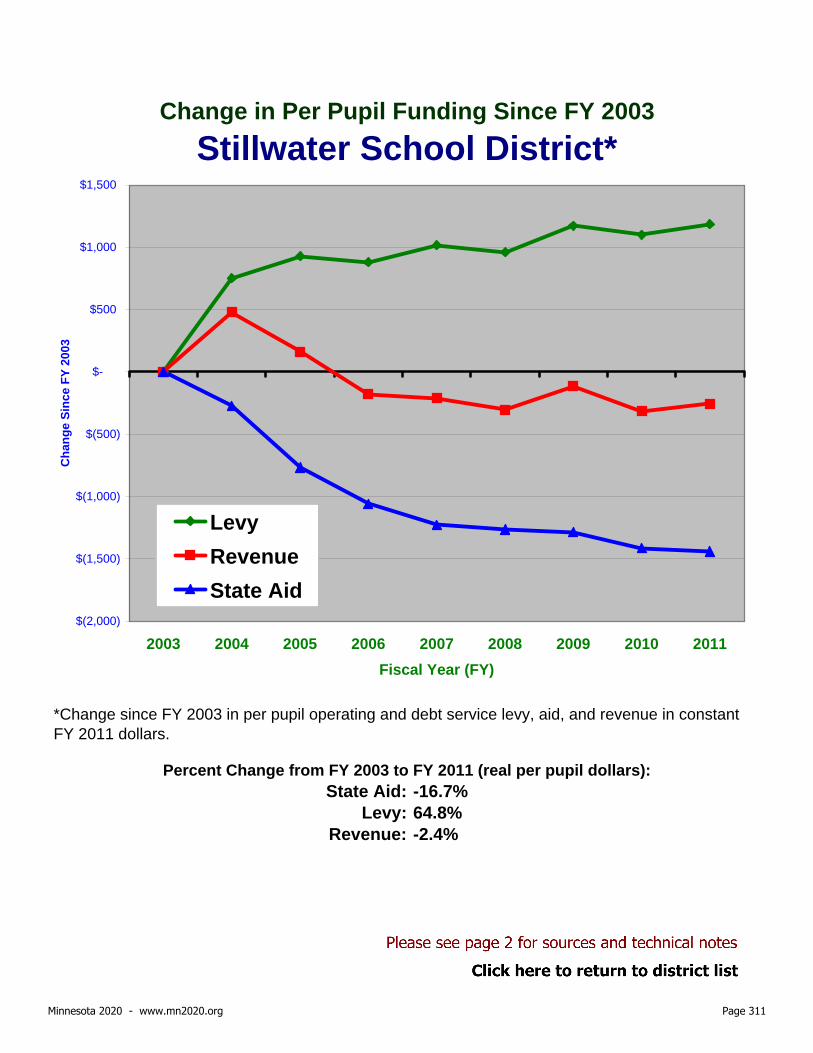
State Aid: -16.7%Levy: 64.8%
Revenue: -2.4%
Percent Change from FY 2003 to FY 2011 (real per pupil dollars):
*Change since FY 2003 in per pupil operating and debt service levy, aid, and revenue in constant FY 2011 dollars.
Change in Per Pupil Funding Since FY 2003Stillwater School District*
$(2,000)
$(1,500)
$(1,000)
$(500)
$-
$500
$1,000
$1,500
2003 2004 2005 2006 2007 2008 2009 2010 2011Fiscal Year (FY)
Cha
nge
Sinc
e FY
200
3
LevyRevenueState Aid
Minnesota 2020 - www.mn2020.org Page 311

State Aid: -17.2%Levy: 390.0%
Revenue: 0.7%
Percent Change from FY 2003 to FY 2011 (real per pupil dollars):
*Change since FY 2003 in per pupil operating and debt service levy, aid, and revenue in constant FY 2011 dollars.
Change in Per Pupil Funding Since FY 2003Swanville School District*
$(2,000)
$(1,500)
$(1,000)
$(500)
$-
$500
$1,000
$1,500
$2,000
2003 2004 2005 2006 2007 2008 2009 2010 2011Fiscal Year (FY)
Cha
nge
Sinc
e FY
200
3
LevyRevenueState Aid
Minnesota 2020 - www.mn2020.org Page 312

State Aid: -17.4%Levy: 61.4%
Revenue: -10.4%
Percent Change from FY 2003 to FY 2011 (real per pupil dollars):
*Change since FY 2003 in per pupil operating and debt service levy, aid, and revenue in constant FY 2011 dollars.
Change in Per Pupil Funding Since FY 2003Thief River Falls School District*
$(2,000)
$(1,500)
$(1,000)
$(500)
$-
$500
$1,000
2003 2004 2005 2006 2007 2008 2009 2010 2011Fiscal Year (FY)
Cha
nge
Sinc
e FY
200
3
LevyRevenueState Aid
Minnesota 2020 - www.mn2020.org Page 313

State Aid: -14.9%Levy: 119.8%
Revenue: -8.1%
Percent Change from FY 2003 to FY 2011 (real per pupil dollars):
*Change since FY 2003 in per pupil operating and debt service levy, aid, and revenue in constant FY 2011 dollars.
Change in Per Pupil Funding Since FY 2003Tracy Area School District*
$(2,000)
$(1,500)
$(1,000)
$(500)
$-
$500
$1,000
2003 2004 2005 2006 2007 2008 2009 2010 2011Fiscal Year (FY)
Cha
nge
Sinc
e FY
200
3
LevyRevenueState Aid
Minnesota 2020 - www.mn2020.org Page 314

State Aid: -12.5%Levy: 575.0%
Revenue: -6.7%
Percent Change from FY 2003 to FY 2011 (real per pupil dollars):
*Change since FY 2003 in per pupil operating and debt service levy, aid, and revenue in constant FY 2011 dollars.
Change in Per Pupil Funding Since FY 2003Tri-County School District*
$(2,000)
$(1,500)
$(1,000)
$(500)
$-
$500
$1,000
2003 2004 2005 2006 2007 2008 2009 2010 2011Fiscal Year (FY)
Cha
nge
Sinc
e FY
200
3
LevyRevenueState Aid
Minnesota 2020 - www.mn2020.org Page 315

State Aid: -10.7%Levy: 61.3%
Revenue: -2.8%
Percent Change from FY 2003 to FY 2011 (real per pupil dollars):
*Change since FY 2003 in per pupil operating and debt service levy, aid, and revenue in constant FY 2011 dollars.
Change in Per Pupil Funding Since FY 2003Triton School District*
$(1,500)
$(1,000)
$(500)
$-
$500
$1,000
2003 2004 2005 2006 2007 2008 2009 2010 2011Fiscal Year (FY)
Cha
nge
Sinc
e FY
200
3
LevyRevenueState Aid
Minnesota 2020 - www.mn2020.org Page 316

State Aid: -8.7%Levy: 417.7%
Revenue: 8.4%
Percent Change from FY 2003 to FY 2011 (real per pupil dollars):
*Change since FY 2003 in per pupil operating and debt service levy, aid, and revenue in constant FY 2011 dollars.
Change in Per Pupil Funding Since FY 2003Truman School District*
$(1,500)
$(1,000)
$(500)
$-
$500
$1,000
$1,500
$2,000
2003 2004 2005 2006 2007 2008 2009 2010 2011Fiscal Year (FY)
Cha
nge
Sinc
e FY
200
3
LevyRevenueState Aid
Minnesota 2020 - www.mn2020.org Page 317

State Aid: -25.4%Levy: 41.7%
Revenue: -12.6%
Percent Change from FY 2003 to FY 2011 (real per pupil dollars):
*Change since FY 2003 in per pupil operating and debt service levy, aid, and revenue in constant FY 2011 dollars.
Change in Per Pupil Funding Since FY 2003Ulen-Hitterdal School District*
$(3,500)
$(3,000)
$(2,500)
$(2,000)
$(1,500)
$(1,000)
$(500)
$-
$500
$1,000
$1,500
2003 2004 2005 2006 2007 2008 2009 2010 2011Fiscal Year (FY)
Cha
nge
Sinc
e FY
200
3
LevyRevenueState Aid
Minnesota 2020 - www.mn2020.org Page 318
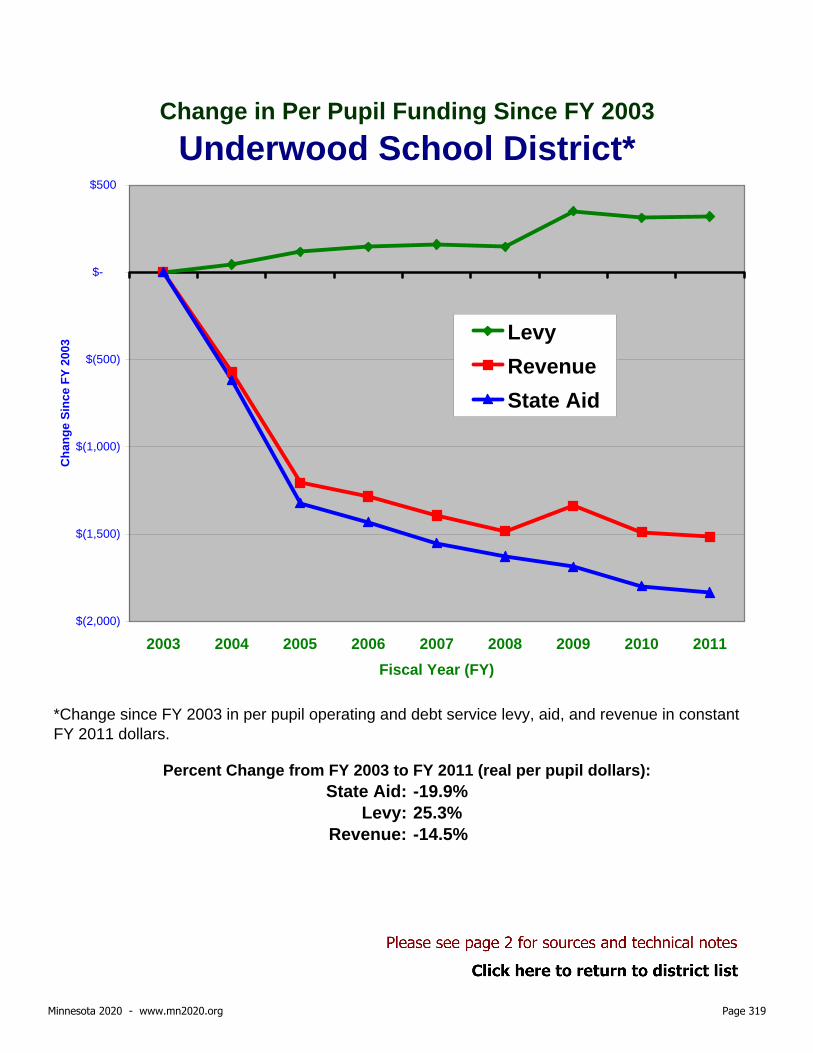
State Aid: -19.9%Levy: 25.3%
Revenue: -14.5%
Percent Change from FY 2003 to FY 2011 (real per pupil dollars):
*Change since FY 2003 in per pupil operating and debt service levy, aid, and revenue in constant FY 2011 dollars.
Change in Per Pupil Funding Since FY 2003Underwood School District*
$(2,000)
$(1,500)
$(1,000)
$(500)
$-
$500
2003 2004 2005 2006 2007 2008 2009 2010 2011Fiscal Year (FY)
Cha
nge
Sinc
e FY
200
3 LevyRevenueState Aid
Minnesota 2020 - www.mn2020.org Page 319
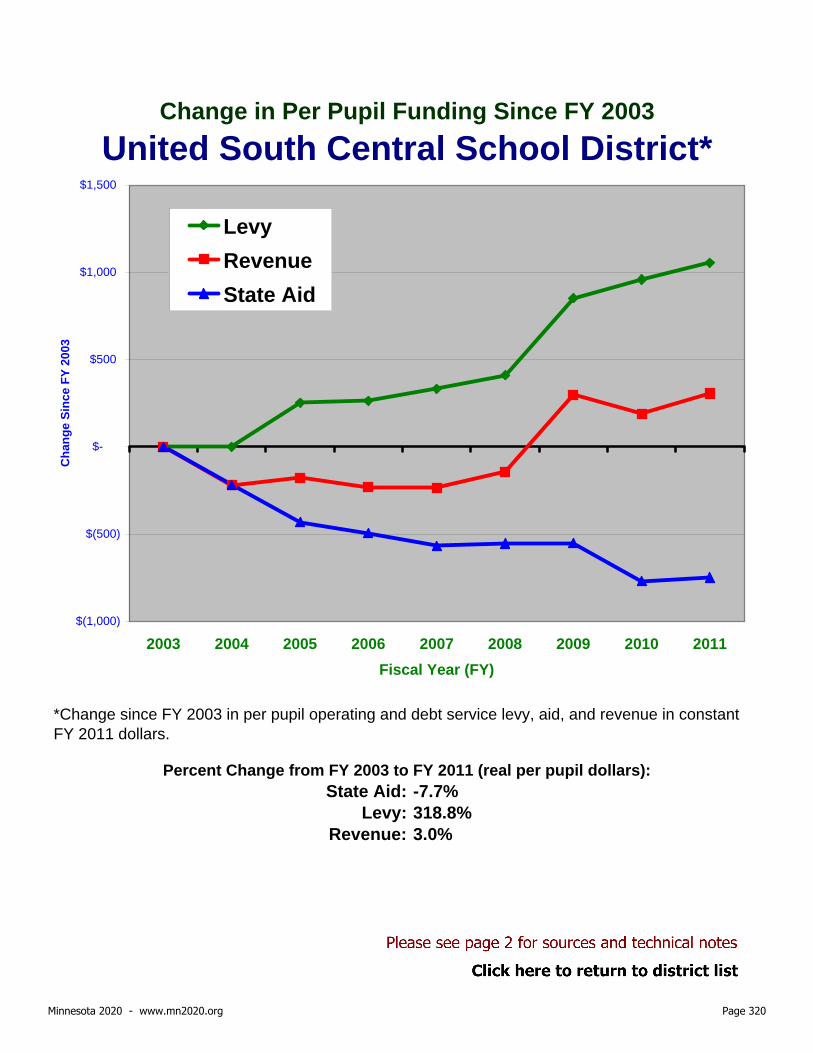
State Aid: -7.7%Levy: 318.8%
Revenue: 3.0%
Percent Change from FY 2003 to FY 2011 (real per pupil dollars):
*Change since FY 2003 in per pupil operating and debt service levy, aid, and revenue in constant FY 2011 dollars.
Change in Per Pupil Funding Since FY 2003United South Central School District*
$(1,000)
$(500)
$-
$500
$1,000
$1,500
2003 2004 2005 2006 2007 2008 2009 2010 2011Fiscal Year (FY)
Cha
nge
Sinc
e FY
200
3
LevyRevenueState Aid
Minnesota 2020 - www.mn2020.org Page 320

State Aid: -12.3%Levy: 63.2%
Revenue: -2.4%
Percent Change from FY 2003 to FY 2011 (real per pupil dollars):
*Change since FY 2003 in per pupil operating and debt service levy, aid, and revenue in constant FY 2011 dollars.
Change in Per Pupil Funding Since FY 2003Upsala School District*
$(1,500)
$(1,000)
$(500)
$-
$500
$1,000
2003 2004 2005 2006 2007 2008 2009 2010 2011Fiscal Year (FY)
Cha
nge
Sinc
e FY
200
3
LevyRevenueState Aid
Minnesota 2020 - www.mn2020.org Page 321

State Aid: -16.2%Levy: 34.0%
Revenue: -13.6%
Percent Change from FY 2003 to FY 2011 (real per pupil dollars):
*Change since FY 2003 in per pupil operating and debt service levy, aid, and revenue in constant FY 2011 dollars.
Change in Per Pupil Funding Since FY 2003Verndale School District*
$(2,500)
$(2,000)
$(1,500)
$(1,000)
$(500)
$-
$500
2003 2004 2005 2006 2007 2008 2009 2010 2011Fiscal Year (FY)
Cha
nge
Sinc
e FY
200
3
LevyRevenueState Aid
Minnesota 2020 - www.mn2020.org Page 322
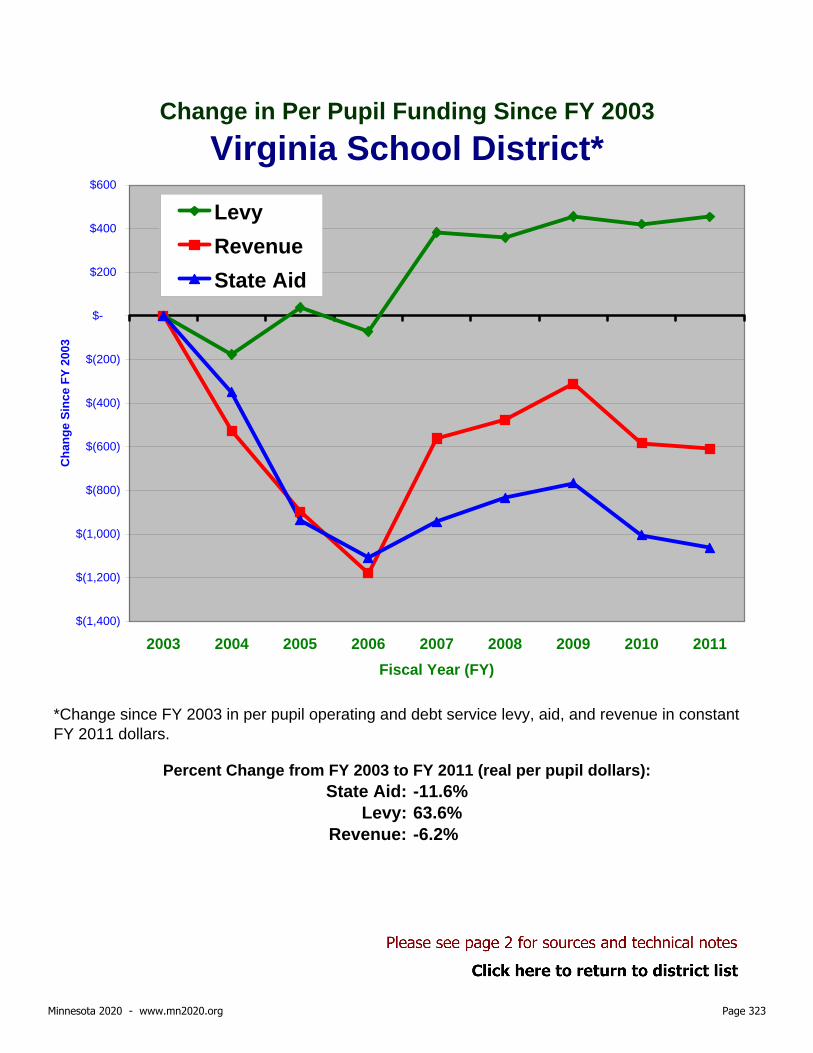
State Aid: -11.6%Levy: 63.6%
Revenue: -6.2%
Percent Change from FY 2003 to FY 2011 (real per pupil dollars):
*Change since FY 2003 in per pupil operating and debt service levy, aid, and revenue in constant FY 2011 dollars.
Change in Per Pupil Funding Since FY 2003Virginia School District*
$(1,400)
$(1,200)
$(1,000)
$(800)
$(600)
$(400)
$(200)
$-
$200
$400
$600
2003 2004 2005 2006 2007 2008 2009 2010 2011Fiscal Year (FY)
Cha
nge
Sinc
e FY
200
3
LevyRevenueState Aid
Minnesota 2020 - www.mn2020.org Page 323
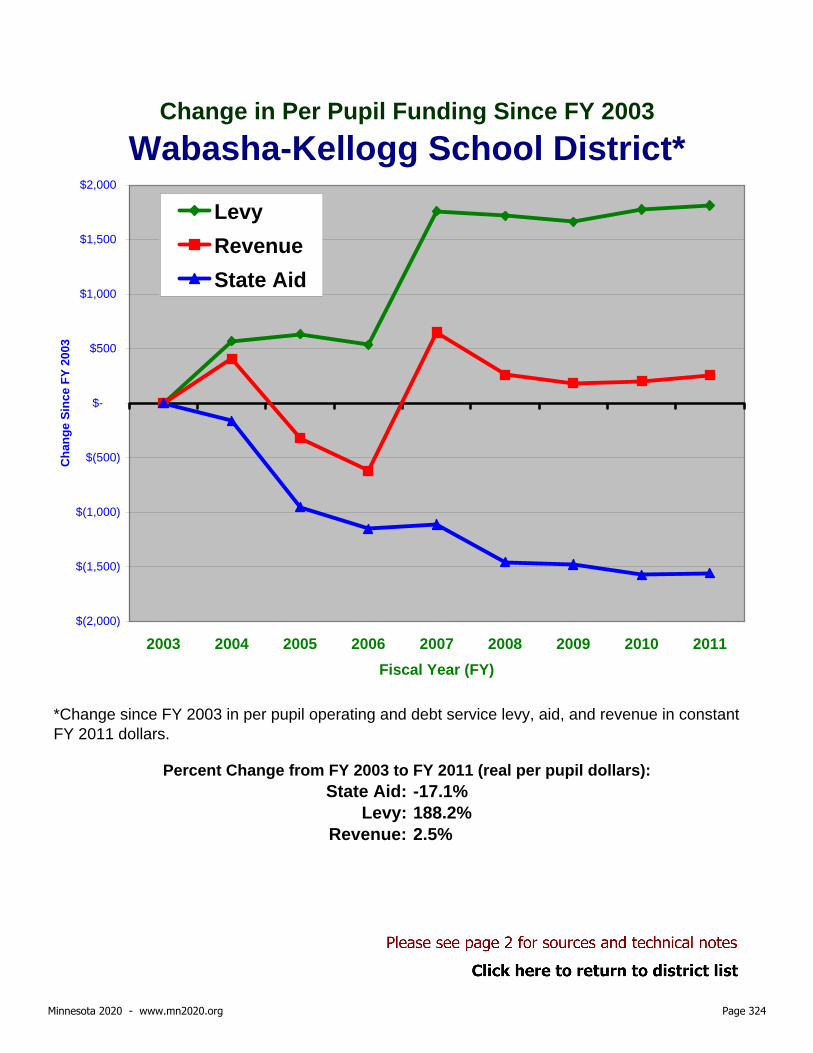
State Aid: -17.1%Levy: 188.2%
Revenue: 2.5%
Percent Change from FY 2003 to FY 2011 (real per pupil dollars):
*Change since FY 2003 in per pupil operating and debt service levy, aid, and revenue in constant FY 2011 dollars.
Change in Per Pupil Funding Since FY 2003Wabasha-Kellogg School District*
$(2,000)
$(1,500)
$(1,000)
$(500)
$-
$500
$1,000
$1,500
$2,000
2003 2004 2005 2006 2007 2008 2009 2010 2011Fiscal Year (FY)
Cha
nge
Sinc
e FY
200
3
LevyRevenueState Aid
Minnesota 2020 - www.mn2020.org Page 324

State Aid: -11.5%Levy: 50.5%
Revenue: -4.1%
Percent Change from FY 2003 to FY 2011 (real per pupil dollars):
*Change since FY 2003 in per pupil operating and debt service levy, aid, and revenue in constant FY 2011 dollars.
Change in Per Pupil Funding Since FY 2003Wabasso School District*
$(1,200)
$(1,000)
$(800)
$(600)
$(400)
$(200)
$-
$200
$400
$600
$800
2003 2004 2005 2006 2007 2008 2009 2010 2011Fiscal Year (FY)
Cha
nge
Sinc
e FY
200
3
LevyRevenueState Aid
Minnesota 2020 - www.mn2020.org Page 325

State Aid: -20.9%Levy: 55.4%
Revenue: -8.4%
Percent Change from FY 2003 to FY 2011 (real per pupil dollars):
*Change since FY 2003 in per pupil operating and debt service levy, aid, and revenue in constant FY 2011 dollars.
Change in Per Pupil Funding Since FY 2003Waconia School District*
$(2,500)
$(2,000)
$(1,500)
$(1,000)
$(500)
$-
$500
$1,000
$1,500
2003 2004 2005 2006 2007 2008 2009 2010 2011Fiscal Year (FY)
Cha
nge
Sinc
e FY
200
3
LevyRevenueState Aid
Minnesota 2020 - www.mn2020.org Page 326

State Aid: -12.7%Levy: 141.0%
Revenue: -1.9%
Percent Change from FY 2003 to FY 2011 (real per pupil dollars):
*Change since FY 2003 in per pupil operating and debt service levy, aid, and revenue in constant FY 2011 dollars.
Change in Per Pupil Funding Since FY 2003Wadena-Deer Creek School District*
$(1,500)
$(1,000)
$(500)
$-
$500
$1,000
$1,500
2003 2004 2005 2006 2007 2008 2009 2010 2011Fiscal Year (FY)
Cha
nge
Sinc
e FY
200
3
LevyRevenueState Aid
Minnesota 2020 - www.mn2020.org Page 327

State Aid: -17.3%Levy: -0.2%
Revenue: -14.7%
Percent Change from FY 2003 to FY 2011 (real per pupil dollars):
*Change since FY 2003 in per pupil operating and debt service levy, aid, and revenue in constant FY 2011 dollars.
Change in Per Pupil Funding Since FY 2003Walker-Hackensack-Akeley School District*
$(2,000)
$(1,500)
$(1,000)
$(500)
$-
$500
2003 2004 2005 2006 2007 2008 2009 2010 2011Fiscal Year (FY)
Cha
nge
Sinc
e FY
200
3
LevyRevenueState Aid
Minnesota 2020 - www.mn2020.org Page 328

State Aid: -15.0%Levy: 203.9%
Revenue: -5.8%
Percent Change from FY 2003 to FY 2011 (real per pupil dollars):
*Change since FY 2003 in per pupil operating and debt service levy, aid, and revenue in constant FY 2011 dollars.
Change in Per Pupil Funding Since FY 2003Warren-Alvarado-Oslo School District*
$(2,000)
$(1,500)
$(1,000)
$(500)
$-
$500
$1,000
$1,500
2003 2004 2005 2006 2007 2008 2009 2010 2011Fiscal Year (FY)
Cha
nge
Sinc
e FY
200
3
LevyRevenueState Aid
Minnesota 2020 - www.mn2020.org Page 329

State Aid: -14.1%Levy: 62.4%
Revenue: -6.1%
Percent Change from FY 2003 to FY 2011 (real per pupil dollars):
*Change since FY 2003 in per pupil operating and debt service levy, aid, and revenue in constant FY 2011 dollars.
Change in Per Pupil Funding Since FY 2003Warroad School District*
$(2,000)
$(1,500)
$(1,000)
$(500)
$-
$500
$1,000
2003 2004 2005 2006 2007 2008 2009 2010 2011Fiscal Year (FY)
Cha
nge
Sinc
e FY
200
3
LevyRevenueState Aid
Minnesota 2020 - www.mn2020.org Page 330

State Aid: -13.3%Levy: 18.7%
Revenue: -10.6%
Percent Change from FY 2003 to FY 2011 (real per pupil dollars):
*Change since FY 2003 in per pupil operating and debt service levy, aid, and revenue in constant FY 2011 dollars.
Change in Per Pupil Funding Since FY 2003Waseca School District*
$(1,500)
$(1,000)
$(500)
$-
$500
$1,000
2003 2004 2005 2006 2007 2008 2009 2010 2011Fiscal Year (FY)
Cha
nge
Sinc
e FY
200
3
LevyRevenueState Aid
Minnesota 2020 - www.mn2020.org Page 331

State Aid: -14.6%Levy: 200.5%
Revenue: 7.5%
Percent Change from FY 2003 to FY 2011 (real per pupil dollars):
*Change since FY 2003 in per pupil operating and debt service levy, aid, and revenue in constant FY 2011 dollars.
Change in Per Pupil Funding Since FY 2003Watertown-Mayer School District*
$(1,500)
$(1,000)
$(500)
$-
$500
$1,000
$1,500
$2,000
$2,500
2003 2004 2005 2006 2007 2008 2009 2010 2011Fiscal Year (FY)
Cha
nge
Sinc
e FY
200
3
LevyRevenueState Aid
Minnesota 2020 - www.mn2020.org Page 332

State Aid: -13.0%Levy: 4456.6%
Revenue: 9.0%
Percent Change from FY 2003 to FY 2011 (real per pupil dollars):
*Change since FY 2003 in per pupil operating and debt service levy, aid, and revenue in constant FY 2011 dollars.
Change in Per Pupil Funding Since FY 2003Waterville-Elysian-Morristw. School District*
$(1,500)
$(1,000)
$(500)
$-
$500
$1,000
$1,500
$2,000
$2,500
2003 2004 2005 2006 2007 2008 2009 2010 2011Fiscal Year (FY)
Cha
nge
Sinc
e FY
200
3
LevyRevenueState Aid
Minnesota 2020 - www.mn2020.org Page 333

State Aid: -18.2%Levy: 16.4%
Revenue: -14.6%
Percent Change from FY 2003 to FY 2011 (real per pupil dollars):
*Change since FY 2003 in per pupil operating and debt service levy, aid, and revenue in constant FY 2011 dollars.
Change in Per Pupil Funding Since FY 2003Waubun School District*
$(2,500)
$(2,000)
$(1,500)
$(1,000)
$(500)
$-
$500
2003 2004 2005 2006 2007 2008 2009 2010 2011Fiscal Year (FY)
Cha
nge
Sinc
e FY
200
3
LevyRevenueState Aid
Minnesota 2020 - www.mn2020.org Page 334

State Aid: -13.1%Levy: 13.2%
Revenue: -6.1%
Percent Change from FY 2003 to FY 2011 (real per pupil dollars):
*Change since FY 2003 in per pupil operating and debt service levy, aid, and revenue in constant FY 2011 dollars.
Change in Per Pupil Funding Since FY 2003Wayzata School District*
$(1,400)
$(1,200)
$(1,000)
$(800)
$(600)
$(400)
$(200)
$-
$200
$400
$600
2003 2004 2005 2006 2007 2008 2009 2010 2011Fiscal Year (FY)
Cha
nge
Sinc
e FY
200
3
LevyRevenueState Aid
Minnesota 2020 - www.mn2020.org Page 335

State Aid: -17.7%Levy: 92.4%
Revenue: -6.5%
Percent Change from FY 2003 to FY 2011 (real per pupil dollars):
*Change since FY 2003 in per pupil operating and debt service levy, aid, and revenue in constant FY 2011 dollars.
Change in Per Pupil Funding Since FY 2003West Central Area School District*
$(2,000)
$(1,500)
$(1,000)
$(500)
$-
$500
$1,000
$1,500
2003 2004 2005 2006 2007 2008 2009 2010 2011Fiscal Year (FY)
Cha
nge
Sinc
e FY
200
3
LevyRevenueState Aid
Minnesota 2020 - www.mn2020.org Page 336

State Aid: -12.8%Levy: 74.3%
Revenue: 3.9%
Percent Change from FY 2003 to FY 2011 (real per pupil dollars):
*Change since FY 2003 in per pupil operating and debt service levy, aid, and revenue in constant FY 2011 dollars.
Change in Per Pupil Funding Since FY 2003West Saint Paul School District*
$(1,500)
$(1,000)
$(500)
$-
$500
$1,000
$1,500
$2,000
2003 2004 2005 2006 2007 2008 2009 2010 2011Fiscal Year (FY)
Cha
nge
Sinc
e FY
200
3
LevyRevenueState Aid
Minnesota 2020 - www.mn2020.org Page 337

State Aid: -4.7%Levy: 396.3%
Revenue: 1.5%
Percent Change from FY 2003 to FY 2011 (real per pupil dollars):
*Change since FY 2003 in per pupil operating and debt service levy, aid, and revenue in constant FY 2011 dollars.
Change in Per Pupil Funding Since FY 2003Westbrook-Walnut Grove School District*
$(1,000)
$(800)
$(600)
$(400)
$(200)
$-
$200
$400
$600
$800
2003 2004 2005 2006 2007 2008 2009 2010 2011Fiscal Year (FY)
Cha
nge
Sinc
e FY
200
3
LevyRevenueState Aid
Minnesota 2020 - www.mn2020.org Page 338

State Aid: -14.3%Levy: 12.2%
Revenue: -8.1%
Percent Change from FY 2003 to FY 2011 (real per pupil dollars):
*Change since FY 2003 in per pupil operating and debt service levy, aid, and revenue in constant FY 2011 dollars.
Change in Per Pupil Funding Since FY 2003Westonka School District*
$(1,400)
$(1,200)
$(1,000)
$(800)
$(600)
$(400)
$(200)
$-
$200
$400
$600
2003 2004 2005 2006 2007 2008 2009 2010 2011Fiscal Year (FY)
Cha
nge
Sinc
e FY
200
3
LevyRevenueState Aid
Minnesota 2020 - www.mn2020.org Page 339

State Aid: -14.1%Levy: 34.1%
Revenue: -11.1%
Percent Change from FY 2003 to FY 2011 (real per pupil dollars):
*Change since FY 2003 in per pupil operating and debt service levy, aid, and revenue in constant FY 2011 dollars.
Change in Per Pupil Funding Since FY 2003Wheaton Area School District*
$(2,000)
$(1,500)
$(1,000)
$(500)
$-
$500
$1,000
2003 2004 2005 2006 2007 2008 2009 2010 2011Fiscal Year (FY)
Cha
nge
Sinc
e FY
200
3
LevyRevenueState Aid
Minnesota 2020 - www.mn2020.org Page 340

State Aid: -17.6%Levy: 85.2%
Revenue: -2.2%
Percent Change from FY 2003 to FY 2011 (real per pupil dollars):
*Change since FY 2003 in per pupil operating and debt service levy, aid, and revenue in constant FY 2011 dollars.
Change in Per Pupil Funding Since FY 2003White Bear Lake School District*
$(2,000)
$(1,500)
$(1,000)
$(500)
$-
$500
$1,000
$1,500
$2,000
2003 2004 2005 2006 2007 2008 2009 2010 2011Fiscal Year (FY)
Cha
nge
Sinc
e FY
200
3
LevyRevenueState Aid
Minnesota 2020 - www.mn2020.org Page 341

State Aid: -14.2%Levy: 12.0%
Revenue: -11.0%
Percent Change from FY 2003 to FY 2011 (real per pupil dollars):
*Change since FY 2003 in per pupil operating and debt service levy, aid, and revenue in constant FY 2011 dollars.
Change in Per Pupil Funding Since FY 2003Willmar School District*
$(1,800)
$(1,600)
$(1,400)
$(1,200)
$(1,000)
$(800)
$(600)
$(400)
$(200)
$-
$200
$400
2003 2004 2005 2006 2007 2008 2009 2010 2011Fiscal Year (FY)
Cha
nge
Sinc
e FY
200
3
LevyRevenueState Aid
Minnesota 2020 - www.mn2020.org Page 342
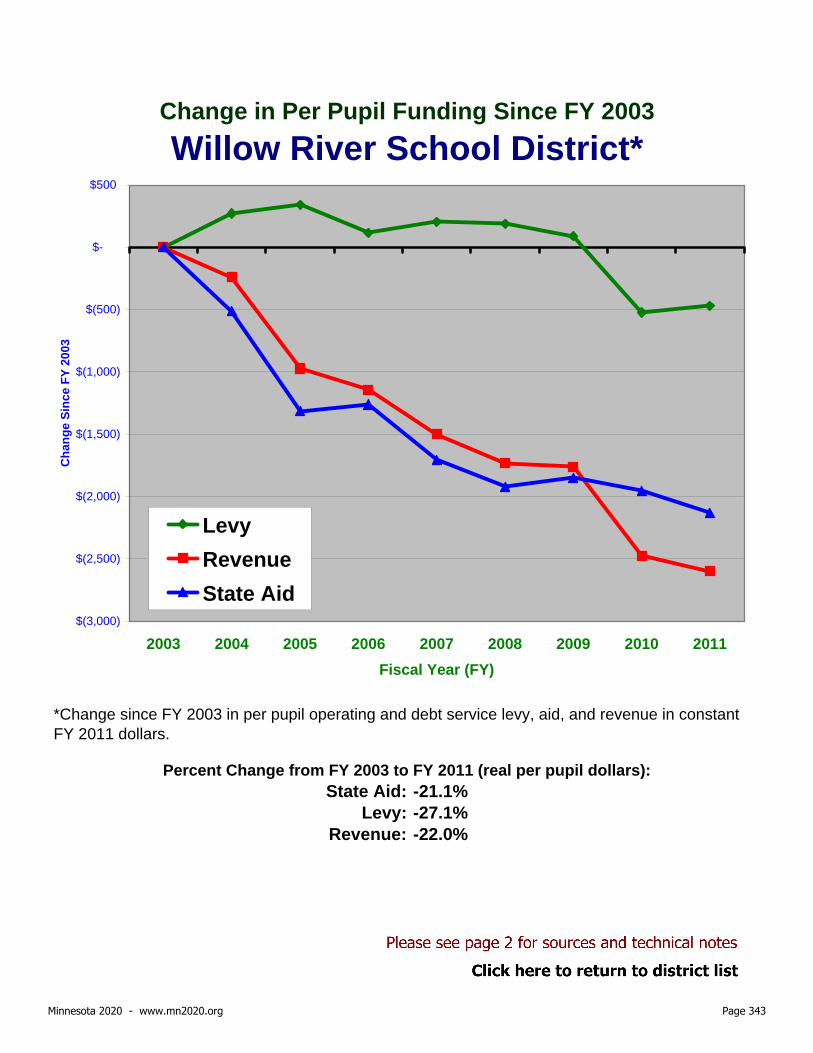
State Aid: -21.1%Levy: -27.1%
Revenue: -22.0%
Percent Change from FY 2003 to FY 2011 (real per pupil dollars):
*Change since FY 2003 in per pupil operating and debt service levy, aid, and revenue in constant FY 2011 dollars.
Change in Per Pupil Funding Since FY 2003Willow River School District*
$(3,000)
$(2,500)
$(2,000)
$(1,500)
$(1,000)
$(500)
$-
$500
2003 2004 2005 2006 2007 2008 2009 2010 2011Fiscal Year (FY)
Cha
nge
Sinc
e FY
200
3
LevyRevenueState Aid
Minnesota 2020 - www.mn2020.org Page 343

State Aid: -18.5%Levy: 55.5%
Revenue: -8.1%
Percent Change from FY 2003 to FY 2011 (real per pupil dollars):
*Change since FY 2003 in per pupil operating and debt service levy, aid, and revenue in constant FY 2011 dollars.
Change in Per Pupil Funding Since FY 2003Windom School District*
$(2,500)
$(2,000)
$(1,500)
$(1,000)
$(500)
$-
$500
$1,000
$1,500
2003 2004 2005 2006 2007 2008 2009 2010 2011Fiscal Year (FY)
Cha
nge
Sinc
e FY
200
3
LevyRevenueState Aid
Minnesota 2020 - www.mn2020.org Page 344

State Aid: -11.6%Levy: 85.6%
Revenue: -0.4%
Percent Change from FY 2003 to FY 2011 (real per pupil dollars):
*Change since FY 2003 in per pupil operating and debt service levy, aid, and revenue in constant FY 2011 dollars.
Change in Per Pupil Funding Since FY 2003Win-E-Mac School District*
$(1,500)
$(1,000)
$(500)
$-
$500
$1,000
$1,500
2003 2004 2005 2006 2007 2008 2009 2010 2011Fiscal Year (FY)
Cha
nge
Sinc
e FY
200
3
LevyRevenueState Aid
Minnesota 2020 - www.mn2020.org Page 345

State Aid: -16.9%Levy: 100.1%
Revenue: -0.8%
Percent Change from FY 2003 to FY 2011 (real per pupil dollars):
*Change since FY 2003 in per pupil operating and debt service levy, aid, and revenue in constant FY 2011 dollars.
Change in Per Pupil Funding Since FY 2003Winona Area Public School District*
$(2,000)
$(1,500)
$(1,000)
$(500)
$-
$500
$1,000
$1,500
$2,000
2003 2004 2005 2006 2007 2008 2009 2010 2011Fiscal Year (FY)
Cha
nge
Sinc
e FY
200
3
LevyRevenueState Aid
Minnesota 2020 - www.mn2020.org Page 346
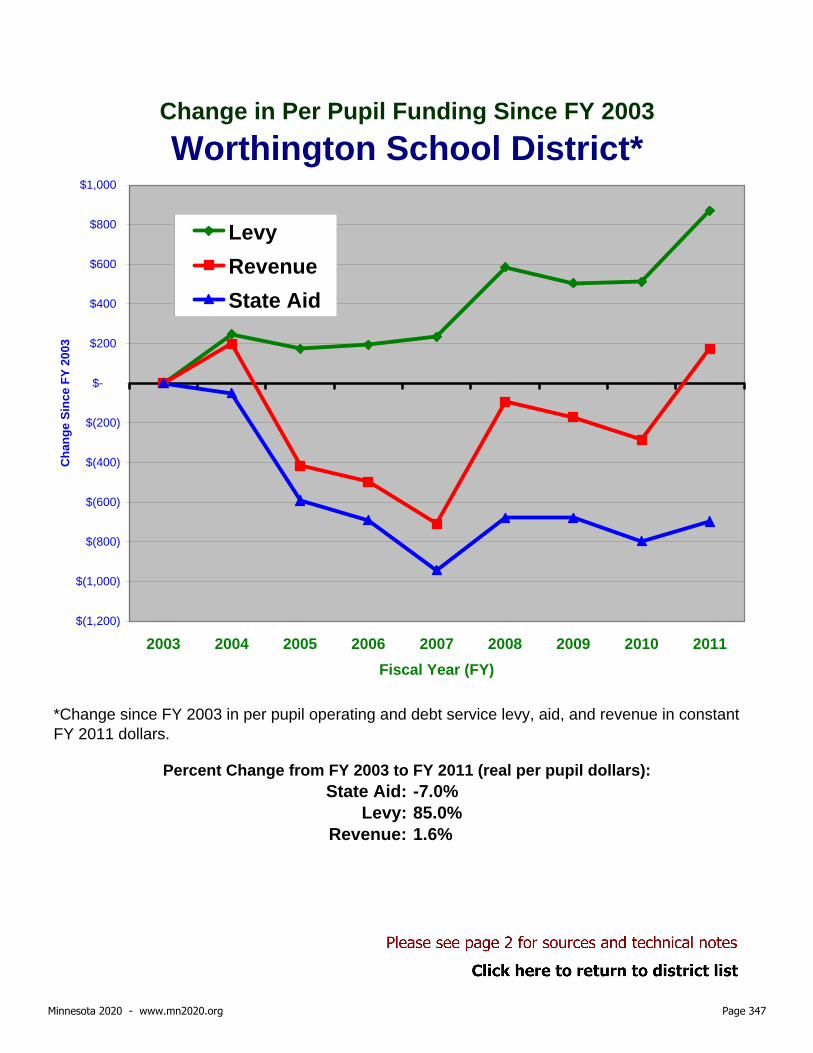
State Aid: -7.0%Levy: 85.0%
Revenue: 1.6%
Percent Change from FY 2003 to FY 2011 (real per pupil dollars):
*Change since FY 2003 in per pupil operating and debt service levy, aid, and revenue in constant FY 2011 dollars.
Change in Per Pupil Funding Since FY 2003Worthington School District*
$(1,200)
$(1,000)
$(800)
$(600)
$(400)
$(200)
$-
$200
$400
$600
$800
$1,000
2003 2004 2005 2006 2007 2008 2009 2010 2011Fiscal Year (FY)
Cha
nge
Sinc
e FY
200
3
LevyRevenueState Aid
Minnesota 2020 - www.mn2020.org Page 347

State Aid: -15.7%Levy: 57.9%
Revenue: -6.4%
Percent Change from FY 2003 to FY 2011 (real per pupil dollars):
*Change since FY 2003 in per pupil operating and debt service levy, aid, and revenue in constant FY 2011 dollars.
Change in Per Pupil Funding Since FY 2003Wrenshall School District*
$(2,000)
$(1,500)
$(1,000)
$(500)
$-
$500
$1,000
2003 2004 2005 2006 2007 2008 2009 2010 2011Fiscal Year (FY)
Cha
nge
Sinc
e FY
200
3
LevyRevenueState Aid
Minnesota 2020 - www.mn2020.org Page 348

State Aid: -9.0%Levy: 165.9%
Revenue: 0.6%
Percent Change from FY 2003 to FY 2011 (real per pupil dollars):
*Change since FY 2003 in per pupil operating and debt service levy, aid, and revenue in constant FY 2011 dollars.
Change in Per Pupil Funding Since FY 2003Yellow Medicine East School District*
$(1,500)
$(1,000)
$(500)
$-
$500
$1,000
$1,500
2003 2004 2005 2006 2007 2008 2009 2010 2011Fiscal Year (FY)
Cha
nge
Sinc
e FY
200
3
LevyRevenueState Aid
Minnesota 2020 - www.mn2020.org Page 349
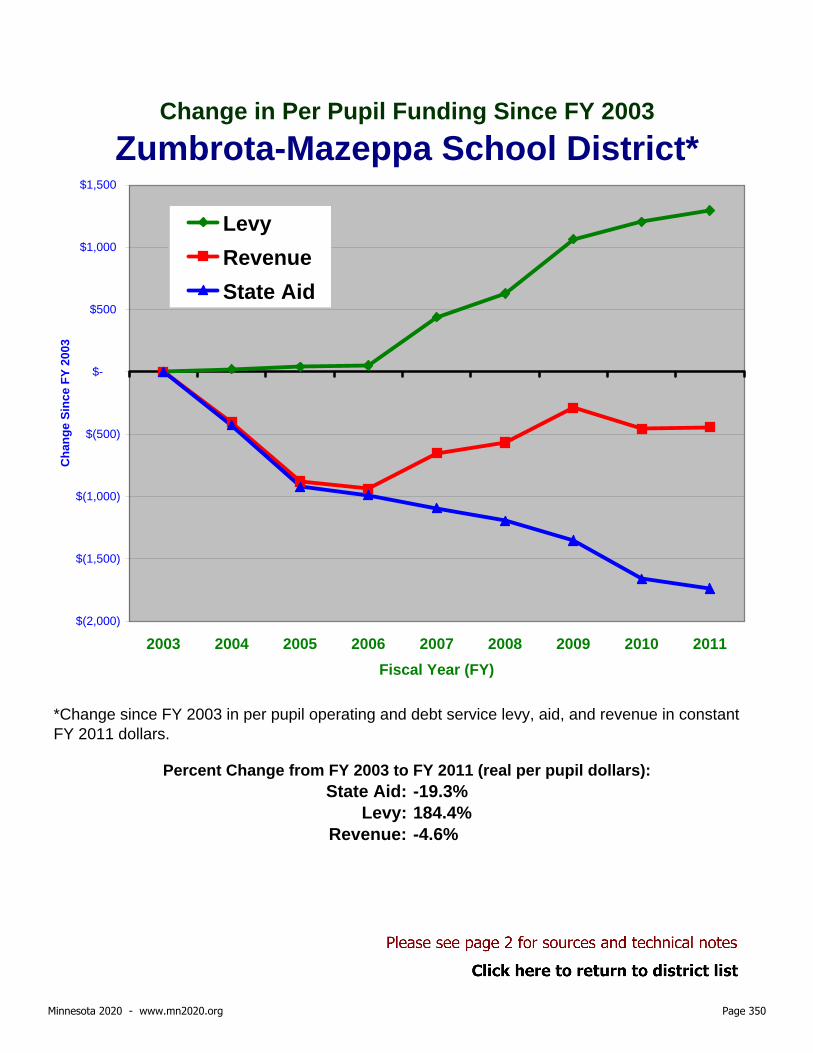
State Aid: -19.3%Levy: 184.4%
Revenue: -4.6%
Percent Change from FY 2003 to FY 2011 (real per pupil dollars):
*Change since FY 2003 in per pupil operating and debt service levy, aid, and revenue in constant FY 2011 dollars.
Change in Per Pupil Funding Since FY 2003Zumbrota-Mazeppa School District*
$(2,000)
$(1,500)
$(1,000)
$(500)
$-
$500
$1,000
$1,500
2003 2004 2005 2006 2007 2008 2009 2010 2011Fiscal Year (FY)
Cha
nge
Sinc
e FY
200
3
LevyRevenueState Aid
Minnesota 2020 - www.mn2020.org Page 350