district irrigation plan for aurangabad district of ... · district irrigation plan for aurangabad...
TRANSCRIPT

PRADHAN MANTRI KRISHI
District Irrigation Plan
for Aurangabad District
of Maharashtra State
(India) under PMKSY
DISTRICT:
D I S T R I C T S U P E R I N T E N D I N G
KRISHI SINCHAI YOJANA
District Irrigation Plan
for Aurangabad District
of Maharashtra State
(India) under PMKSY
2016-2020
DISTRICT: - AURANGABAD
S U P E R I N T E N D I N G A G R I C U L T U R E O F F I C E R ,
2016-2020
O F F I C E R , A U R A N G A B A D
District Irrigation Plan for Aurangabad District of Maharashtra State (India) under PMKSY 2016-2020
Page 2
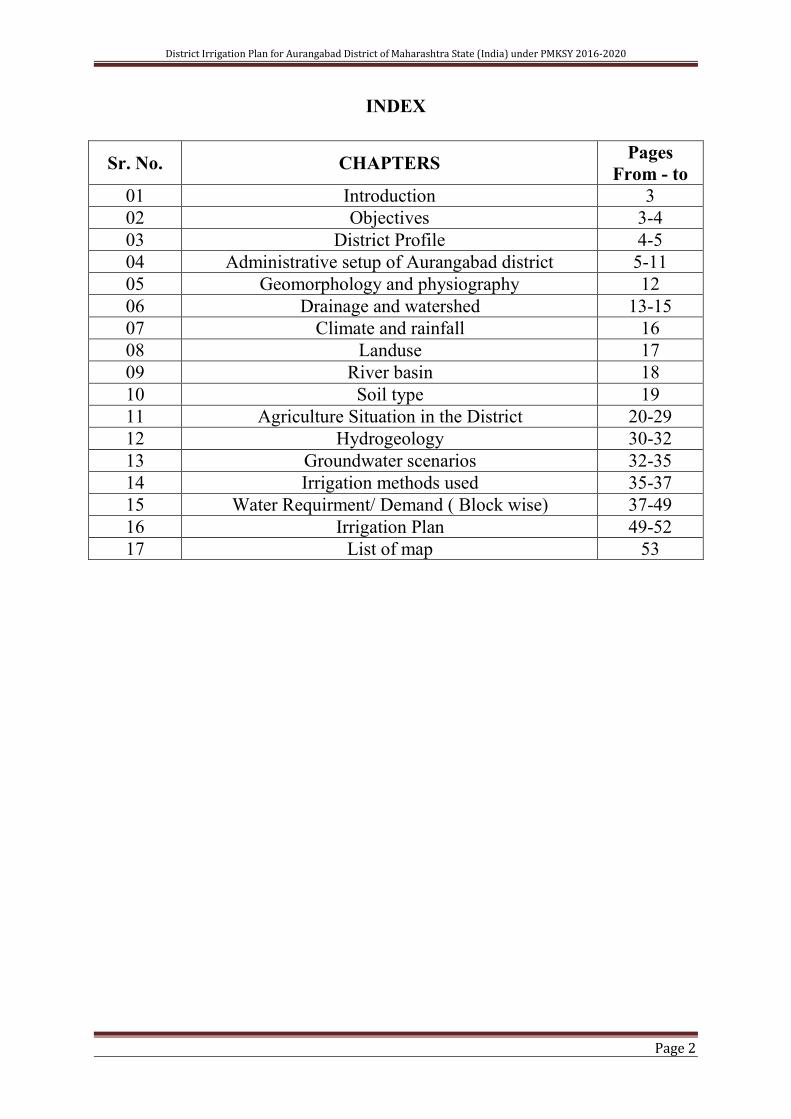
INDEX
Sr. No. CHAPTERS Pages
From - to
01 Introduction 3
02 Objectives 3-4
03 District Profile 4-5
04 Administrative setup of Aurangabad district 5-11
05 Geomorphology and physiography 12
06 Drainage and watershed 13-15
07 Climate and rainfall 16
08 Landuse 17
09 River basin 18
10 Soil type 19
11 Agriculture Situation in the District 20-29
12 Hydrogeology 30-32
13 Groundwater scenarios 32-35
14 Irrigation methods used 35-37
15 Water Requirment/ Demand ( Block wise) 37-49
16 Irrigation Plan 49-52
17 List of map 53

District Irrigation Plan for Aurangabad District of Maharashtra State (India) under PMKSY 2016-2020
Page 3
1. INTRODUCTION
The overreaching vision of Pradhan Mantri Krishi Sinchayai Yojana
(PMKSY) will be to ensure access to some means of protective irrigation to all
agricultural farms in the country (Har Khet Ko Paani) and to produce ‘More
crop per drop’, thus bringing much desired rural prosperity.
The scheme will ensure the completion of long pending irrigation projects
on priority and launch the ‘Pradhan Mantri Krishi Sinchayai Yojana’ with the
motto of ‘Har Khet Ko Paani’. By harnessing rain water through ‘Jal Sanchay’
and ‘Jal Sinchan’, nurture water conservation and ground water recharge.
Micro irrigation will be popularized and its coverage will be
increased to ensure ‘More crop per drop’. The activities like creation of new
water sources; repair, restoration and renovation of defunct water sources;
construction of water harvesting structures, secondary & micro storage,
groundwater development, enhancing potentials of traditional water bodies will
be focused and given priority. Roof top water harvesting at village & municipal
level will be promoted on priority.
2. OBJECTIVE
The broad objectives of PMKSY will be:-
A. Enhance the physical access of water on the farm and expand
cultivable area under assured irrigation (Har Khet Ko Pani).
B. Integration of water source, distribution and its efficient use, to
make best use of water through appropriate technologies and
practices.
C. Improve on-farm water use efficiency to reduce wastage and
increase availability both in duration and extent.
D. Enhance the adoption of precision-irrigation and other water
saving technologies (More crop per drop).
E. To inculcate Water Literacy among every farmer of the district.
F. To popularize roof top water harvesting concept among citizens of
the District.
G. To familiarize the concept of ‘Farm pond for every farmer’.
The above objectives will be conceived through the central and state
government schemes namely,

District Irrigation Plan for Aurangabad District of Maharashtra State (India) under PMKSY 2016-2020
Page 4
1. AIBP (Accelerated Irrigation Benefit Programme)
2. IWMP (Integrated Watershed Management Programme)
3. MGNREGA (Mahatma Gandhi National Rural Employment Guarantee
Act)
4. RKVY (Rashtriya Krishi Vikas Yojana)
5. NRDWP (National Rural Drinking Water Programme)
6. JALYUKT SHIVAR ABHIYAAN ( DPC )
7. CSR activities
8. Mahatma Phule Jal Bhumi Sandharan Abhiyan
9. Adarsha Gram Yojana
10. Pradhan Mantri Krishi Sinchai Yojana
11. Sub-Mission on Agricultural Mechanization
Departments involved
1. Irrigation ( State, local sector, Zilla Parishad)
2. Agriculture (State, Zilla Parishad)
3. Zilla Parishad
4. Forest/ Social Forestry
5. GSDA
6. NGOs, Banks (CSR)
7. Agricultural Universities/ KVK
3. DISTRICT PROFILE
Aurangabad district is named after, its headquarters place of Aurangzeb.
The City was founded in 1610 A.D. by Malik Ambhar, the Prime Minister of
MurtazaNizam Shah of Ahmadnagar on the sight of Village called Khirki.
Malik Ambar was succeeded by his son Fateh Khan, who changed the name of
Khadki to Fatehnagar. With the capture Daulatabad by the imperial troops in
1633, the Nizamshahi dominions including Fatehnagar came under the
possession of the Moghals. In 1653 when Aurangzab was appointed, the
Viceroy of the Deccan, he made Fatehnagar his capital and called it
Aurangabad. Since then the city came to be known as Aurangabad. Aurangabad
is known for tourist place as well as historical place. Ellora and Ajanta caves
are world famous for sculpture and art. National and International tourists
seldomly visit these places.
The Aurangabad is a district in Marathwada division of Maharashtra
state. The district is bordered by Ahemadnagar, Nashik, Beed and Jalna district.
District Irrigation Plan for Aurangabad District of Maharashtra State (India) under PMKSY 2016-2020
Page 5
On North Jalgaon districts, on East Jalna district, on south Ahemadnagar district
and Nashik district on West. The district head quarter Aurangabad is well
connected to other parts of the state by a number of major roads, Railway and
Airways. The National Highway No.211 leading to Dhule – Solapur passes
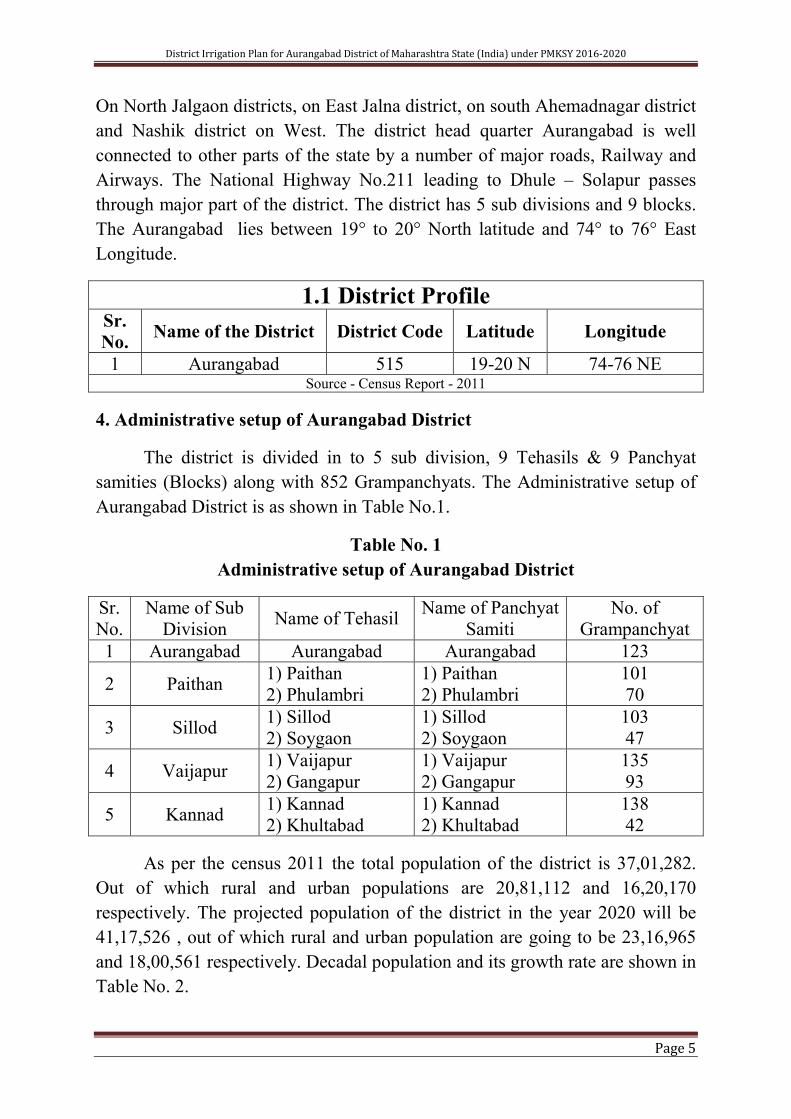
through major part of the district. The district has 5 sub divisions and 9 blocks.
The Aurangabad lies between 19° to 20° North latitude and 74° to 76° East
Longitude.
1.1 District Profile Sr.
No. Name of the District District Code Latitude Longitude
1 Aurangabad 515 19-20 N 74-76 NE Source - Census Report - 2011
4. Administrative setup of Aurangabad District
The district is divided in to 5 sub division, 9 Tehasils & 9 Panchyat
samities (Blocks) along with 852 Grampanchyats. The Administrative setup of
Aurangabad District is as shown in Table No.1.
Table No. 1
Administrative setup of Aurangabad District
Sr.
No.
Name of Sub
Division Name of Tehasil
Name of Panchyat
Samiti
No. of
Grampanchyat
1 Aurangabad Aurangabad Aurangabad 123
2 Paithan 1) Paithan
2) Phulambri
1) Paithan
2) Phulambri
101
70
3 Sillod 1) Sillod
2) Soygaon
1) Sillod
2) Soygaon
103
47
4 Vaijapur 1) Vaijapur
2) Gangapur
1) Vaijapur
2) Gangapur
135
93
5 Kannad 1) Kannad
2) Khultabad
1) Kannad
2) Khultabad
138
42
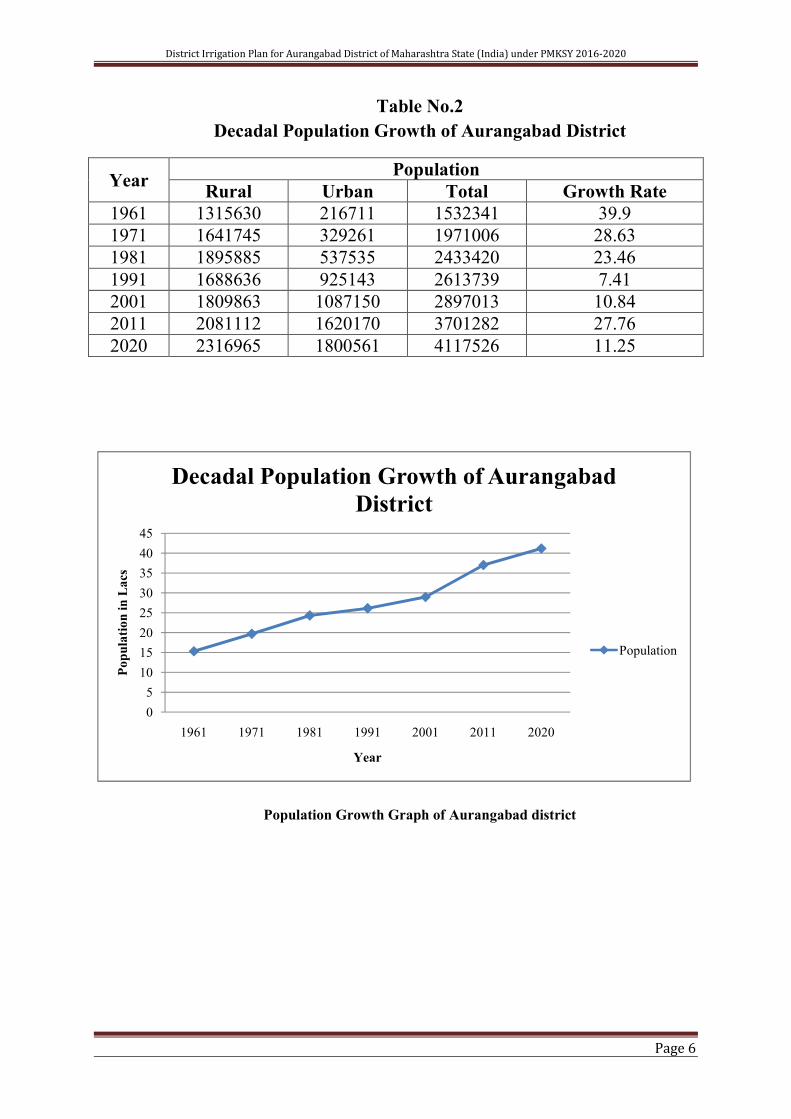
As per the census 2011 the total population of the district is 37,01,282.
Out of which rural and urban populations are 20,81,112 and 16,20,170
respectively. The projected population of the district in the year 2020 will be
41,17,526 , out of which rural and urban population are going to be 23,16,965
and 18,00,561 respectively. Decadal population and its growth rate are shown in
Table No. 2.
District Irrigation Plan for Aurangabad District of Maharashtra State (India) under PMKSY 2016-2020
Page 6
Table No.2
Decadal Population Growth of Aurangabad District
Year Population
Rural Urban Total Growth Rate
1961 1315630 216711 1532341 39.9
1971 1641745 329261 1971006 28.63
1981 1895885 537535 2433420 23.46
1991 1688636 925143 2613739 7.41
2001 1809863 1087150 2897013 10.84
2011 2081112 1620170 3701282 27.76
2020 2316965 1800561 4117526 11.25
Population Growth Graph of Aurangabad district
0
5
10
15
20
25
30
35
40
45
1961 1971 1981 1991 2001 2011 2020
Po
pu
lati
on
in
La
cs
Year
Decadal Population Growth of Aurangabad
District
Population
District Irrigation Plan for Aurangabad District of Maharashtra State (India) under PMKSY 2016-2020
Page 7
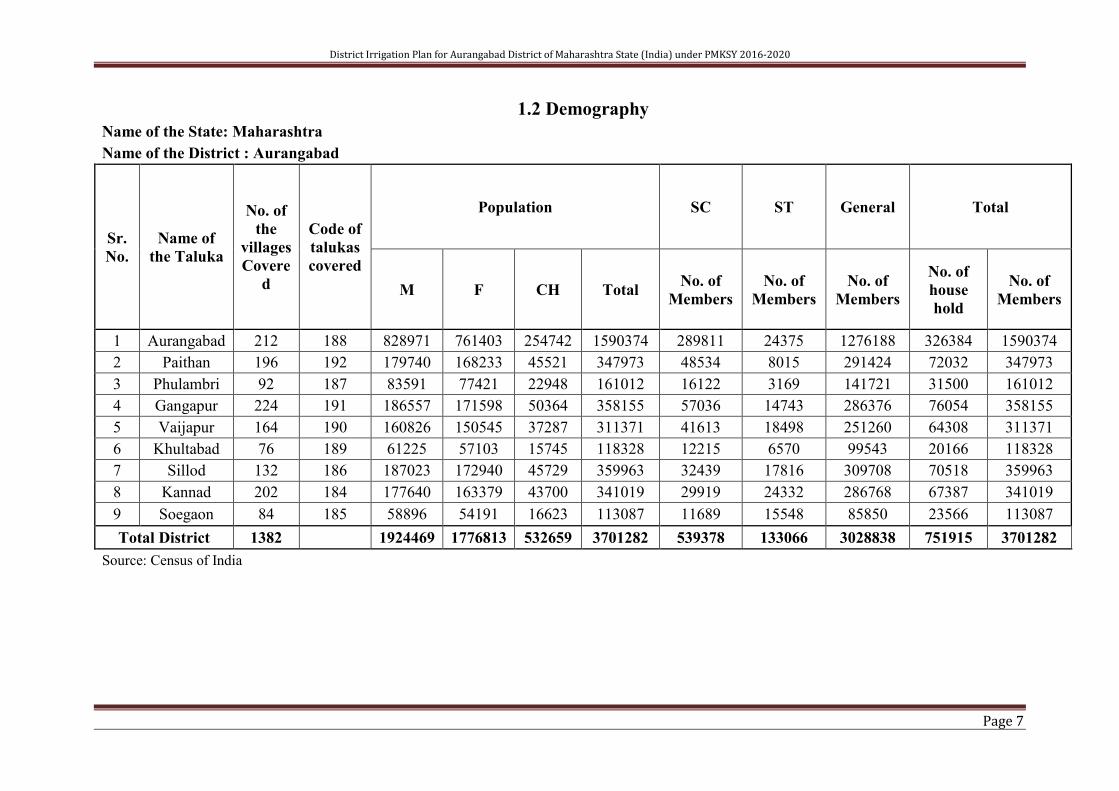
1.2 Demography
Name of the State: Maharashtra
Name of the District : Aurangabad
Sr.
No.
Name of
the Taluka
No. of
the
villages
Covere
d
Code of
talukas
covered
Population SC ST General Total
M F CH Total No. of
Members
No. of
Members
No. of
Members
No. of
house
hold
No. of
Members
1 Aurangabad 212 188 828971 761403 254742 1590374 289811 24375 1276188 326384 1590374
2 Paithan 196 192 179740 168233 45521 347973 48534 8015 291424 72032 347973
3 Phulambri 92 187 83591 77421 22948 161012 16122 3169 141721 31500 161012
4 Gangapur 224 191 186557 171598 50364 358155 57036 14743 286376 76054 358155
5 Vaijapur 164 190 160826 150545 37287 311371 41613 18498 251260 64308 311371
6 Khultabad 76 189 61225 57103 15745 118328 12215 6570 99543 20166 118328
7 Sillod 132 186 187023 172940 45729 359963 32439 17816 309708 70518 359963
8 Kannad 202 184 177640 163379 43700 341019 29919 24332 286768 67387 341019
9 Soegaon 84 185 58896 54191 16623 113087 11689 15548 85850 23566 113087
Total District 1382 1924469 1776813 532659 3701282 539378 133066 3028838 751915 3701282
Source: Census of India

District Irrigation Plan for Aurangabad District of Maharashtra State (India) under PMKSY 2016-2020
Page 8
As per livestock census 2012 the cattle population of Aurangabad district
is 676180. During last five years from 2005-2012 the cattle population
increased by 7.56%. However upto 2020 there is possibility of either increase or
population may remain static due to prohibition of cattle culling act. The
indigenous cows are 149939 while hybrid cows are equally caring up with a
number of 126667. Buffalos are mostly indescriptive (low) 84465.
During 2007-2012 censuses, the cattle population has been increased by
7.56%.
Draft animals mostly bulls are 306056 due to recent prevention of low
slaughter ban act the cattle population may raise in 2020 at about 10%. The
projected cattle population in 2020 would be around 743798.
District is having 194416 poultry. Due to frequent drought
situatli8o farmers are preferring poultry over dairy enterprise. This trend may
increase and poultry can become a substantial allied activity to rainfed farmer’s
dairy activities are mainly under taken in Phulambri, Khultabad, Kannad and
Aurangabad blocks.
District Irrigation Plan for Aurangabad District of Maharashtra State (India) under PMKSY 2016-2020
Page 9
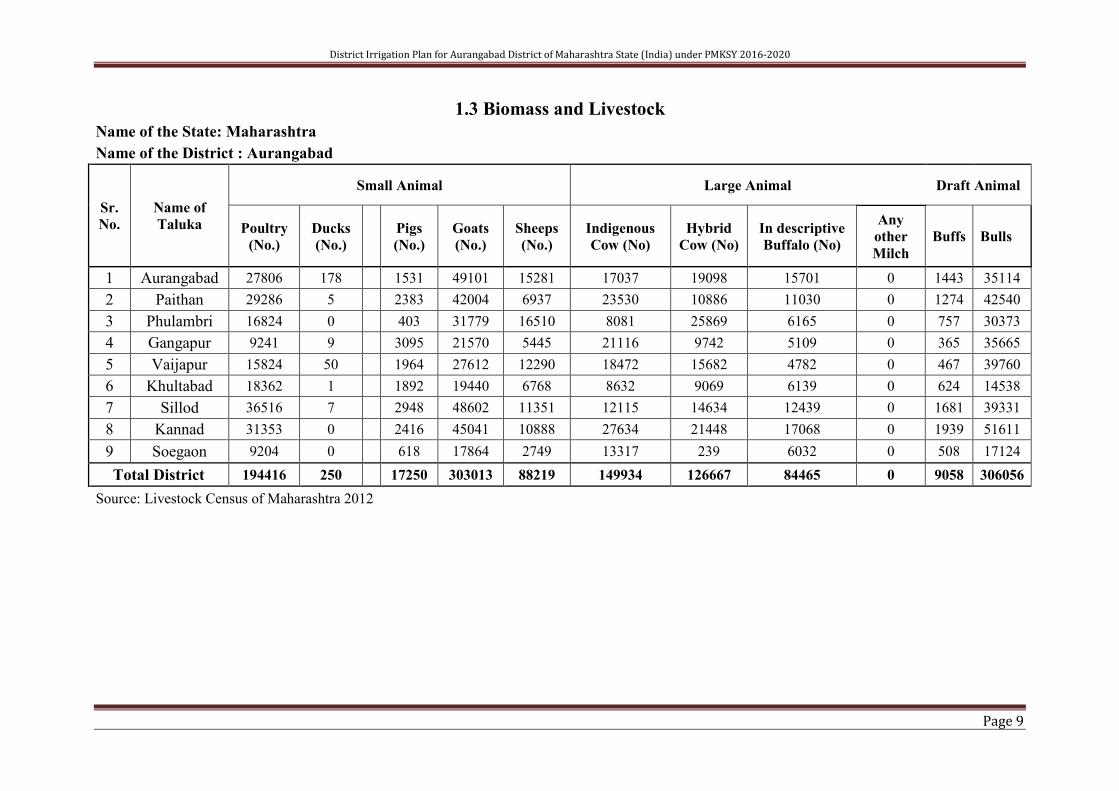
1.3 Biomass and Livestock
Name of the State: Maharashtra
Name of the District : Aurangabad
Sr.
No.
Name of
Taluka
Small Animal Large Animal Draft Animal
Poultry
(No.)
Ducks
(No.)
Pigs
(No.)
Goats
(No.)
Sheeps
(No.)
Indigenous
Cow (No)
Hybrid
Cow (No)
In descriptive
Buffalo (No)
Any
other
Milch
Buffs Bulls
1 Aurangabad 27806 178 1531 49101 15281 17037 19098 15701 0 1443 35114
2 Paithan 29286 5 2383 42004 6937 23530 10886 11030 0 1274 42540
3 Phulambri 16824 0 403 31779 16510 8081 25869 6165 0 757 30373
4 Gangapur 9241 9 3095 21570 5445 21116 9742 5109 0 365 35665
5 Vaijapur 15824 50 1964 27612 12290 18472 15682 4782 0 467 39760
6 Khultabad 18362 1 1892 19440 6768 8632 9069 6139 0 624 14538
7 Sillod 36516 7 2948 48602 11351 12115 14634 12439 0 1681 39331
8 Kannad 31353 0 2416 45041 10888 27634 21448 17068 0 1939 51611
9 Soegaon 9204 0 618 17864 2749 13317 239 6032 0 508 17124
Total District 194416 250 17250 303013 88219 149934 126667 84465 0 9058 306056
Source: Livestock Census of Maharashtra 2012

District Irrigation Plan for Aurangabad District of Maharashtra State (India) under PMKSY 2016-2020
Page 10
Agriculture of Aurangabad district is dependent on monsoon to a great
extent. District has one big dam that is Jayakwadi, the Aurangabad city and
nearby villages depends on the water of Jayakwadi Dam. District is having
predominantly rainfed agriculture. Kharif and Rabi are two important seasons.
The major Kharif crop includes Maize, Bajra, Tur, Udid, Moong, and Cotton
and in Rabbi Farmers grows Wheat, Jowar, Maize, and Safflower. In
Vegetables predominant crops are onions, Cabbage, Cauliflower, Capsicum
where as in Fruit section Aurangabad is hub for Sweet Orange, Pomegranate,
Custard apple, and Mango. Ginger is growing in recent years.
Aurangabad district has ample industrial potential and is the major hub
for auto-mobiles components, pharmaceuticals, and beverage industries.
Aurangabad has two five star MIDC namely Waluj and Shendra contributing
well to GDP of the Nation. Recently central government launched DMIC in
Aurangabad and AURIC (Aurangabad Industrial City) is announced hence
industrial prospect of the Aurangabad district is brightened.

District Irrigation Plan for Aurangabad District of Maharashtra State (India) under PMKSY 2016-2020
Page 11
Table No.3
Aurangabad District at a Glance
1 Geographical Area 10,10,700 ha
2 Forest Area 81,378 ha
3 Population (as per 2011) 37,01,282
A Male 19,24,469
B Female 17,76,813
4 Live Stock Population 7,26,479
5 No. of Tehsils 09
6 No. of Blocks 09
7 No. of Grampanchyat 852
8 Total Culturable Area 7,94,200 ha
9 Average Annual Rainfall 675.46 mm
10 Details Of Storage
Capacities (MCM)
Type No Live
Storage
Major Dam 1 348.80
Medium Dam 16 235.42
Minor Dam 90 208.12
Minor Structures 4136 350.29
Total 4243 1142.63
11
Water Availability
(MCM)
(a) Surface Water 793.83
(b) Ground Water 1136.46
(c) From other districts
( Jayakwadi) 348.80
(d) Rain water available 2536.66
Total 4815.75
12 Water Demand
( MCM)
(A) Non-Agricultural
(a) Domestic Use 130.05
(b) Live Stock 12.11
(c) Industries 24.31
Total (A) 166.47
(B) Agricultural 5417.86
Total (A+B) 5584.33
15 Gap (MCM) - 768.58

District Irrigation Plan for Aurangabad District of Maharashtra State (India) under PMKSY 2016-2020
Page 12
Map: 1 Location Map of Aurangabad District
5. GEOMORPHOLOGY AND PHYSIOGRAPHY
Geomorphologically, the district comprises of varied topographic features
and landscape consisting of high hills and plains and low lying hills. Most of the
hill ranges are located in the northern part of the district. The Satmala hills and
Ajanta hills extend from east to west. The hills near Verul in Khultabad taluka
are part of these ranges which extend to Chowka ranges and Aurangabad hills.
The Satmala range encompasses several hills overlooking the Tapi valley. From
west to east they are Antur (826 m amsl), Satonda (552 m amsl), Abasgand (671
m amsl) and Ajantha (578 m amsl). The Satmala hill (493 m amsl) from which
name of the range is derived is situated north to Kannad town.
The district is a part of the Deccan Plateau. In general the slopes in the
district are towards south and southeast. The average elevation of the district is
in the order of 500 m amsl. Within it are flat topped hill ranges extending over
wide area and also hills separated by broad valleys.

District Irrigation Plan for Aurangabad District of Maharashtra State (India) under PMKSY 2016-2020
Page 13
Map: 2 Geomorphology Map of Aurangabad District
6. DRAINAGE AND WATERSHEDS
Major part of the district falls in Godavari basin with a small area in north
eastern parts falling Tapi Basin. The major river in the district is the Godavari
with its tributaries namely; Purna, Dudhna and Shivna rivers. The other
important tributaries are Sukna, Khelna, Kham, Gulathi, Shivbhadra and Girija
rivers.
Godavari River:
The Godavari River rises in Sahyadri ranges near Triambakeshwar in
Nasik district and flows from west to east through Nasik and Ahmednagar
districts. It enters the Aurangabad district in same trend and passes to adjacent
Beed and district.
Purna River:
The river Purna, a tributary of the Godavari River rises in the hills of
Aurangabad district and after a winding course of about 400km in Aurangabad,
Jalna and Parbhani districts. It joins the main river below Purna railway junction
in Parbhani district.
District Irrigation Plan for Aurangabad District of Maharashtra State (India) under PMKSY 2016-2020
Page 14
Dudhna River:
It rises in hills north of Aurangabad town and flows in northwest-
southwest direction. It crosses to Jalna district, and joins the Godavari river in
Parbhani district just north of Parbhani town.
In the north east marginal portion of the district, due to surface slopes, the
rivers and nalas rising from Ajantha hills are flowing towards the Tapi or its
tributaries. This portion falls under the Tapi basin. Most of the ephemeral
streams exhibit dendritic drainage pattern.
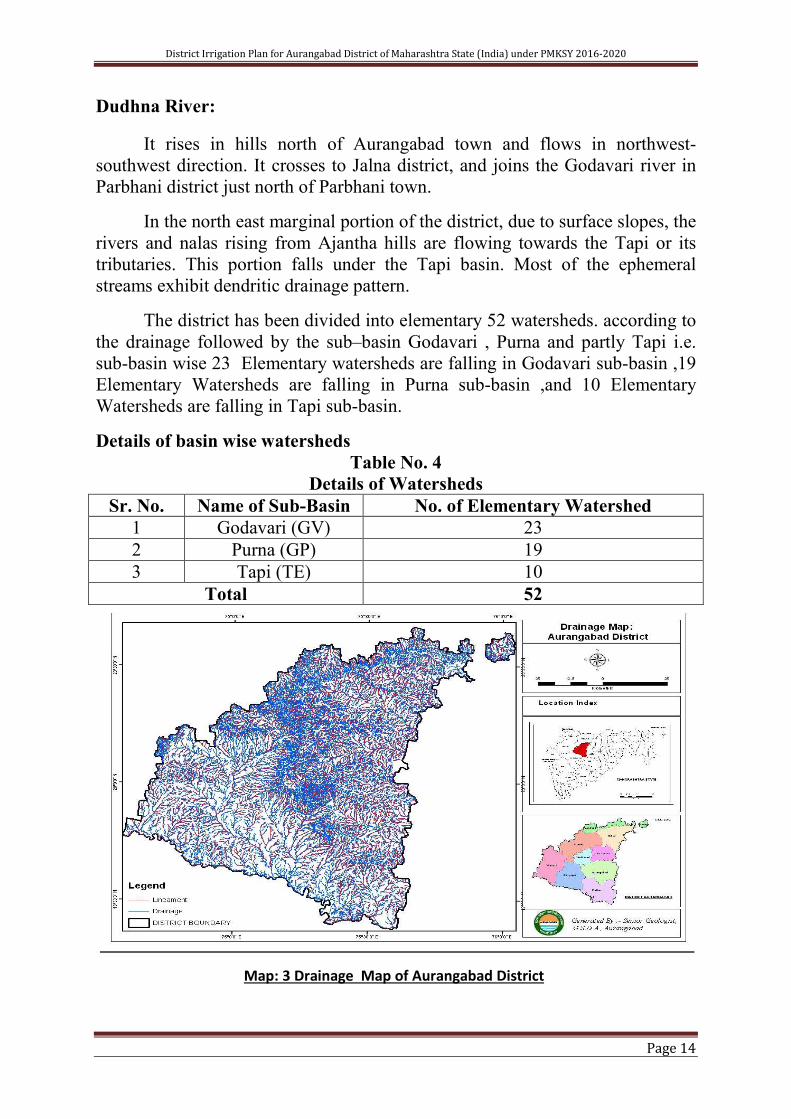
The district has been divided into elementary 52 watersheds. according to
the drainage followed by the sub–basin Godavari , Purna and partly Tapi i.e.
sub-basin wise 23 Elementary watersheds are falling in Godavari sub-basin ,19
Elementary Watersheds are falling in Purna sub-basin ,and 10 Elementary
Watersheds are falling in Tapi sub-basin.
Details of basin wise watersheds
Table No. 4
Details of Watersheds
Sr. No. Name of Sub-Basin No. of Elementary Watershed
1 Godavari (GV) 23
2 Purna (GP) 19
3 Tapi (TE) 10
Total 52
Map: 3 Drainage Map of Aurangabad District
District Irrigation Plan for Aurangabad District of Maharashtra State (India) under PMKSY 2016-2020
Page 15
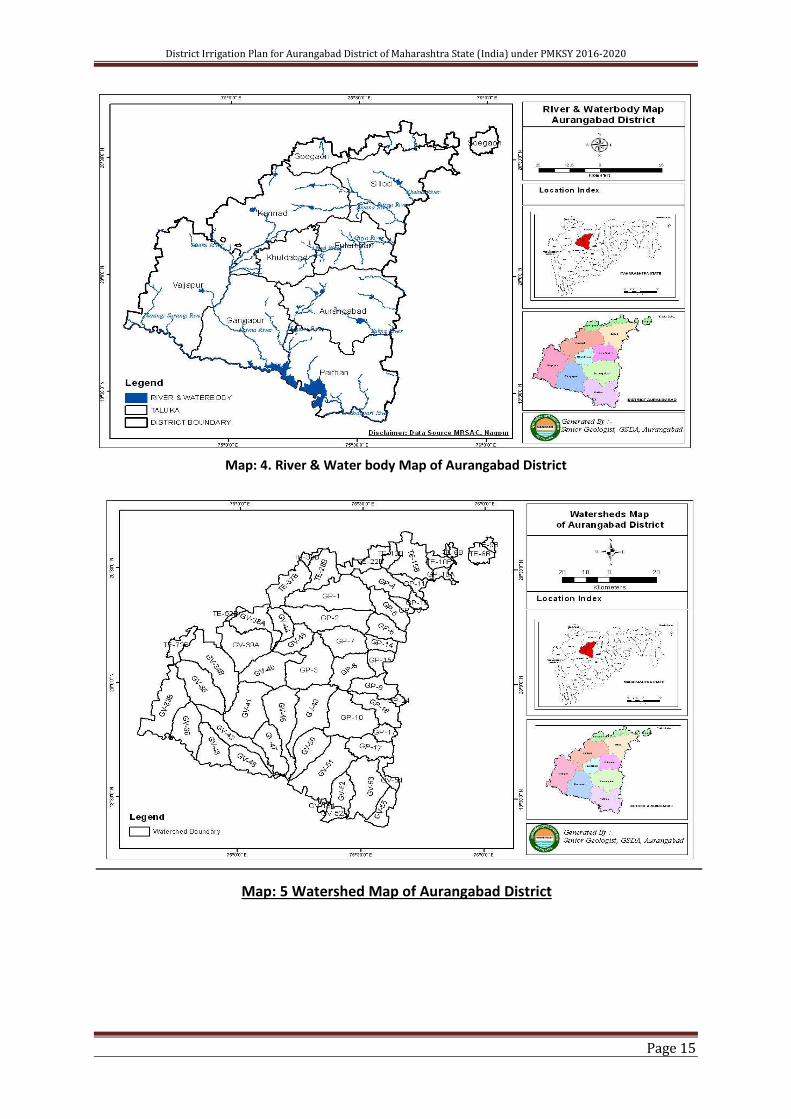
Map: 4. River & Water body Map of Aurangabad District
Map: 5 Watershed Map of Aurangabad District

District Irrigation Plan for Aurangabad District of Maharashtra State (India) under PMKSY 2016-2020
Page 16
7. CLIMATE AND RAINFALL
The climate of the district is characterized by a hot summer and a general
dryness throughout the year except during the south west monsoon season,
which is from June to September while October and November constitute the
post monsoon season. The winter season commences towards the end of
November when temperatures begin to fall rapidly. December is the coldest
month with the mean maximum temperature of 32.7° C, while the minimum
temperature is 12.2°C (2015). From the beginning of March, the daily
temperature increases continuously. May is the hottest month with the mean
maximum temperature of 40.9°C and the mean minimum temperature of 24.6°
C. With the onset of the south-west monsoon by about the second week of June,
the temperature falls appreciably. However the onset of monsoon is getting
delayed to 3rd
or 4th week of June. Except during the southwest monsoon season,
when the relative humidity is high, the air is generally dry over the district. The
summer months are the driest when the relative humidity is generally between
20 and 25 % in the afternoon. Winds are generally light to moderate with
increase in speed during the latter half of the hot season and in the monsoon
season. The winds flow predominantly from directions between west and north
during the hot season. They are mostly from directions between south west and
northwest during the south west monsoon season. They blow mostly from the
directions between northeast and southeast during the rest of the year becoming
southwesterly to north westerly in January and February. The normal annual
rainfall over the district varies from about 500 mm to about 840 mm. It is
minimum in the western part of the district around Vaijapur (510.6 mm). This
increases towards east and reaches a maximum in the central part of the district
around Khultabad (835 mm) and in the north eastern part of the district around
Soygaon (810 mm). The study of negative departures of the annual rainfall over
normal reveals that extreme western parts around Vaijapur and Southern parts
around Paithan and Chikalthana experienced moderate and severe drought
conditions for more than 20 % of years. Hence these parts can be categorized as
“Drought Area”.

District Irrigation Plan for Aurangabad District of Maharashtra State (India) under PMKSY 2016-2020
Page 17
Map: 6 Rainfall Map of Aurangabad District
8. LANDUSE IN THE DISTRICT
The total area of district 10,02035 hector out of which net sown area is
7,22,424 ha, Forest area is 81415 ha and area under non agriculture purpose is
96643ha.
Table No.5
LANDUSE IN THE DISTRICT
Sr. No. Land use Land cover Area ha
1 Agriculture (Gross) 8,74,435
2 Built-up 17613
3 Forest 93322
4 Wasteland 42333
5 Water Bodies 39368
Total 10,02035

District Irrigation Plan for Aurangabad District of Maharashtra State (India) under PMKSY 2016-2020
Page 18
Map: 7 Landuse / Landcover Map of Aurangabad District
9. RIVER BASINS
Map.8 Basin Map of Aurangabad district
District Irrigation Plan for Aurangabad District of Maharashtra State (India) under PMKSY 2016-2020
Page 19
10. SOIL TYPE
Soil plays a very important role in the agricultural activities and forest
growth of the area. The fertility of the soil from agricultural point of view
depends upon the texture and structure which controls the retaining and
transmitting capacity of moisture and various nutrients such as nitrogen,
phosphorous and potassium present in the soil. The formation of the soil in the
area is influenced\ by the climate, geology, vegetation and topography. The
major part of the district is covered by black cotton soil or ‘Regur’ formed by
the weathering of Deccan Trap Basalt. It is rich in plant nutrients such as lime,
magnesium, iron and alkalis on which cotton and dry crops like Jowar, Bajra
and Tur etc flourish. It swells and becomes sticky on watering while on drying
it contracts and develops many cracks. The soil varies both in texture and depth.
In northern portion of the district the soils are shallow and relatively poor while
in south they become deep and fairly rich in nutrients.
Sandy soil and older alluvial deposits of Godavari and other rivers is also
observed in the Godavari valley especially along its banks forming the upper
layers. It is also fertile and suitable for growing cereals and pulses.
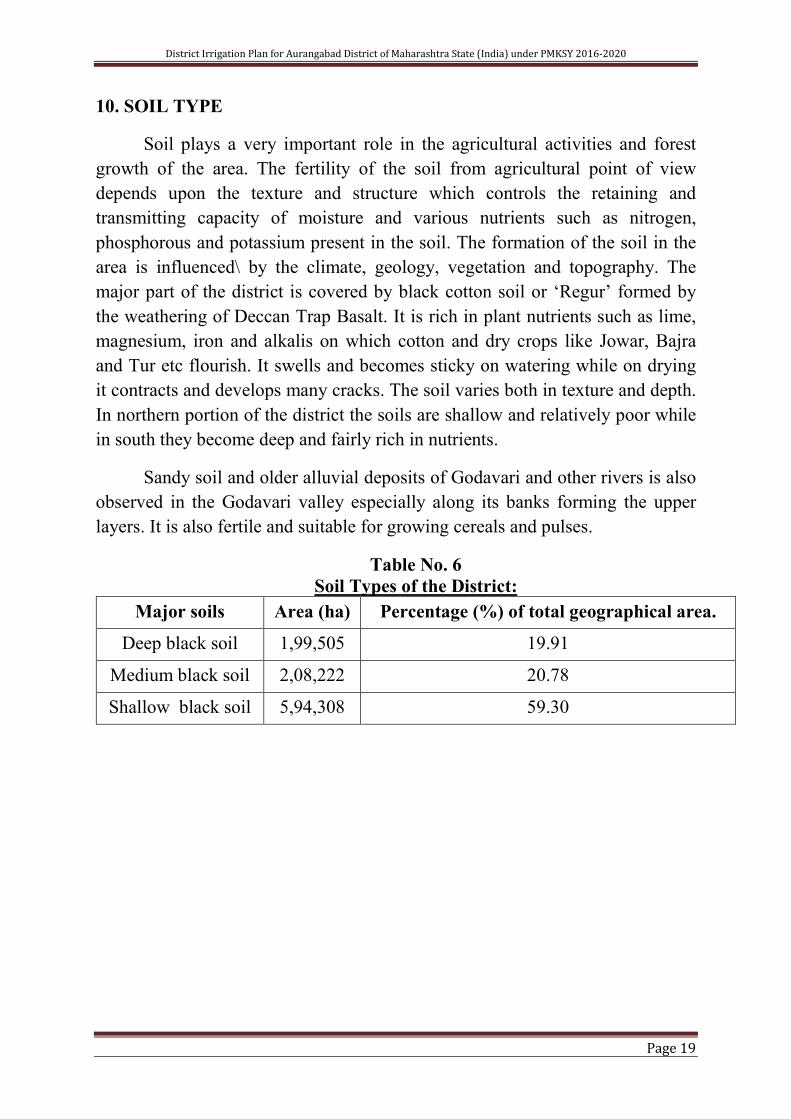
Table No. 6
Soil Types of the District:
Major soils Area (ha) Percentage (%) of total geographical area.
Deep black soil 1,99,505 19.91
Medium black soil 2,08,222 20.78
Shallow black soil 5,94,308 59.30

District Irrigation Plan for Aurangabad District of Maharashtra State (India) under PMKSY 2016-2020
Page 20
Map: 9 Soil Map of Aurangabad District
11. AGRICULTURE SITUATION IN THE DISTRICT
Agriculture activities of Aurangabad district are mostly dependant on
monsoon. District has one major project that is Jayakwadi Dam, the entire
Aurangabad city and near by villages depends on the water of Jayakwadi Dam.
Farmers are dependent on rainfed agriculture to a great extent. Farmers grow
crops in two seasons i.e Kharif and Rabbi. Mainly Kharif crops include Maize,
Bajara, Jowar, Tur, Cotton, Udid, Moong, and Groundnut and in Rabi Farmers
grow Wheat, Jowar, Maize, and Gram. In summer season some vegetables are
grown but area is limited due to low water availability. In Vegetables pre-
dominant crops are onion, Cabbage, Cauliflower, Capsicum where as in Fruit
crops Aurangabad is hub for Sweet Orange, Pomegranate, Mango and Custard
apple.
Major crops of the district are Cotton, Maize, Gram and Wheat and next
to them other major crops are Tur, Jowar, Bajra, Green Gram, Black Gram and
other crops are Sunflower, Safflower, Sesamum, Groundnut etc.
District Irrigation Plan for Aurangabad District of Maharashtra State (India) under PMKSY 2016-2020
Page 21
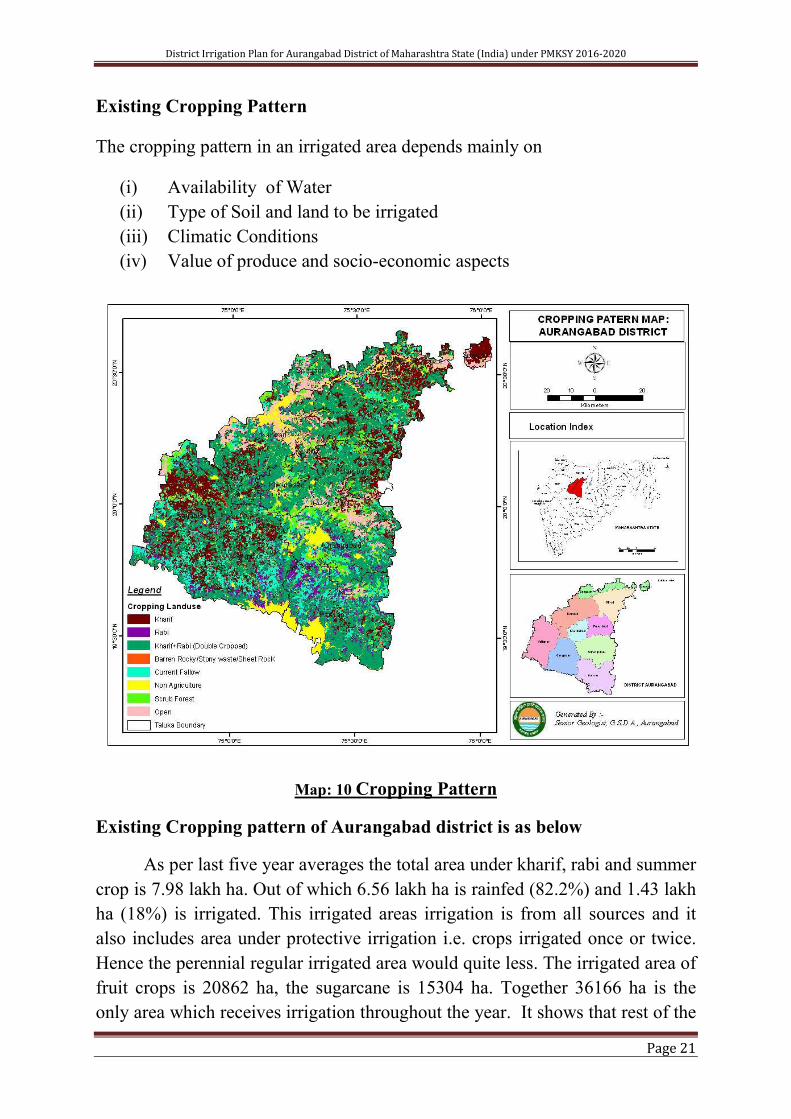
Existing Cropping Pattern
The cropping pattern in an irrigated area depends mainly on
(i) Availability of Water
(ii) Type of Soil and land to be irrigated
(iii) Climatic Conditions
(iv) Value of produce and socio-economic aspects
Map: 10 Cropping Pattern
Existing Cropping pattern of Aurangabad district is as below
As per last five year averages the total area under kharif, rabi and summer
crop is 7.98 lakh ha. Out of which 6.56 lakh ha is rainfed (82.2%) and 1.43 lakh
ha (18%) is irrigated. This irrigated areas irrigation is from all sources and it
also includes area under protective irrigation i.e. crops irrigated once or twice.
Hence the perennial regular irrigated area would quite less. The irrigated area of
fruit crops is 20862 ha, the sugarcane is 15304 ha. Together 36166 ha is the
only area which receives irrigation throughout the year. It shows that rest of the

District Irrigation Plan for Aurangabad District of Maharashtra State (India) under PMKSY 2016-2020
Page 22
127982 ha area is either under seasonal irrigation or protective irrigation. This
irrigation is totally depends upon rainfall, if rainfall received less than average
then the irrigation area reduces elastically. In recent few years the trend of
protective irrigation to Kharif crops is increasing. In the district the area under
Kharif irrigation is 92336 i.e. 14% of total Kharif area. This area is highly
fluctuating as per rainfall.
The surface irrigation is 36671 ha. The major projects in the district are
jayakwadi and Nandur Madhameshwar however the water availability depends
on rainfall in Nasik district. The availability of irrigation in medium and minor
projects is uncertain and in last five year these project could not provide
irrigation as potential created.
Out of gross cropped area 8.97 lakh ha Kharif area is 6.68 lakh ha (74 %)
and area under Rabi crops is 1.31 lakh ha (26%). Area under coarse cereals is
2.61 lakh ha out of which only 0.16 lakh ha (8.4%) area is irrigated. The
proportion of irrigated area in pulses is 15.4 % which is mainly due to
increasing trends of irrigating gram in Rabi and red gram to some extent in
Kharif. However the Cotton has highest area under irrigation 0.55 lakh ha which
is 16%. Out of this almost all area is under protective irrigation, and farmers
give protective / supplementary irrigation to cotton and there is no real irrigated
cotton crop i.e. preseasonal sown.
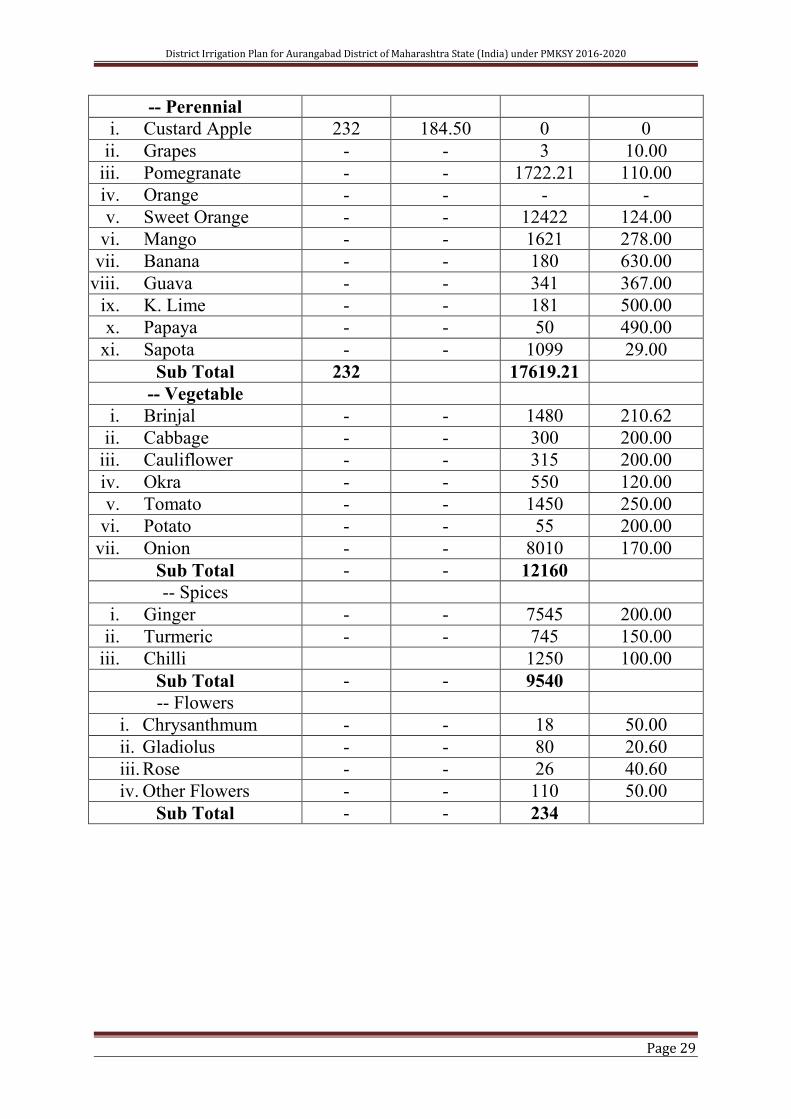
The area under sugarcane is just 15306 ha and area under summer crops is
negligible, only 896 ha. Irrigated fruit crops mainly sweet orange, pomegranate,
Sapota and mango are grown on area of 29260 ha. Onion, Brinjal, Tomato,
Cabbage and Cauliflower are important vegetables grown on 12160 ha area.
Ginger, Turmeric and Chillies are major spices grown on 9540ha area. Farmers
are already preferring crops requiring less water.

District Irrigation Plan for Aurangabad District of Maharashtra State (India) under PMKSY 2016-2020
Page 23
2.1 Area wise, crop-wise Irrigation status
Name of the State : Maharashtra
Name of the District : Aurangabad
Name of the Block : Aurangabad
Crop Type Kharif (Area in ha) Rabi (Area in ha) Summer Crop (Area in ha) Total (Area in ha)
Horticulture & Plantation Crop (
area in ha)
Irrigated Rainfed Total Irrigated Rainfed Total Irrigated Rainfed Total Irrigated Rainfed Total Irrigated Rainfed Total
A) Cereals 0 0 2167 0 2167 0 0 0 2167 0 2167
B) Coarse
Cereals 1005 17718 18723 953 9520 10473 10 0 10 1968 27238 29206
C) Pulses 110 5000 5110 572 2100 2672 0 0 0 682 7100 7782
D) Oilseeds 35 1250 1285 0 0 0 30 0 30 65 1250 1315
E) Fibre 6460 39693 46153 0 0 0 0 0 0 6460 39693 46153
F) Any other
crop 930 70 1000 0 0 0 0 0 0 930 70 1000 4889.95 114.32 5004.27
Total 8540 63731 72271 3692 11620 15312 40 0 40 12272 75351 87623 4890.37 114.32 5004.27
Source : Department of Agriculture Ststistic of state, agristat
Name of the Block : Paithan
Crop Type Kharif (Area in ha) Rabi (Area in ha) Summer Crop (Area in ha) Total (Area in ha)
Horticulture & Plantation Crop (
area in ha)
Irrigated Rainfed Total Irrigated Rainfed Total Irrigated Rainfed Total Irrigated Rainfed Total Irrigated Rainfed Total
A) Cereals 0 0 2653 0 2653 0 0 0 2653 0 2653
B) Coarse
Cereals 110 10987 11097 1800 14794 16594 5 0 5 1915 25781 27696
C) Pulses 725 7976 8701 1200 2085 3285 4 0 4 1929 10061 11990
D) Oilseeds 0 1087 1087 0 76 76 20 0 20 20 1163 1183
E) Fibre 8100 45719 53819 0 0 0 0 0 0 8100 45719 53819
F) Any other
crop 6500 0 6500 100 0 100 0 0 0 6600 0 6600 5346.82 60.03 5406.85
Total 15435 65769 81204 5753 16955 22708 29 0 29 21217 82724 103941 5348.82 60.03 5406.85

District Irrigation Plan for Aurangabad District of Maharashtra State (India) under PMKSY 2016-2020
Page 24
Name of the Block : Phulambri
Crop Type Kharif (Area in ha) Rabi (Area in ha) Summer Crop (Area in ha) Total (Area in ha)
Horticulture & Plantation Crop (
area in ha)
Irrigated Rainfed Total Irrigated Rainfed Total Irrigated Rainfed Total Irrigated Rainfed Total Irrigated Rainfed Total
A) Cereals 0 0 2600 0 2600 0 0 0 2600 0 2600
B) Coarse
Cereals 1400 21787 23187 97 1117 1214 10 0 10 1507 22904 24411
C) Pulses 90 1409 1499 870 2820 3690 2 0 2 962 4229 5191
D) Oilseeds 35 581 616 0 0 0 12 0 12 47 581 628
E) Fibre 2500 27721 30221 0 0 0 0 0 0 2500 27721 30221
F) Any other
crop 550 0 550 0 0 0 0 0 0 550 0 550 842.45 167.11 1009.56
Total 4575 51498 56073 3567 3937 7504 24 0 24 8166 55435 63601 842.45 167.11 1009.56
Name of the Block : Vaijapur
Crop Type Kharif (Area in ha) Rabi (Area in ha) Summer Crop (Area in ha) Total (Area in ha)
Horticulture & Plantation Crop (
area in ha)
Irrigated Rainfed Total Irrigated Rainfed Total Irrigated Rainfed Total Irrigated Rainfed Total Irrigated Rainfed Total
A) Cereals 0 0 1996 0 1996 0 0 0 1996 0 1996
B) Coarse
Cereals 2200 22380 24580 1100 4727 5827 8 0 8 3308 27107 30415
C) Pulses 150 2993 3143 700 2466 3166 5 0 5 855 5459 6314
D) Oilseeds 300 1611 1911 0 44 44 30 0 30 330 1655 1985
E) Fibre 13300 60666 73966 0 0 0 0 0 0 13300 60666 73966
F) Any other
crop 1626 126 1752 0 0 0 0 0 0 1626 126 1752 3297.19 15.65 3312.84
Total 17576 87776 105352 3796 7237 11033 43 0 43 21415 95013 116428 3297.69 15.65 3312.84
Name of the Block : Gangapur
Crop Type Kharif (Area in ha) Rabi (Area in ha) Summer Crop (Area in ha) Total (Area in ha)
Horticulture & Plantation Crop (
area in ha)
Irrigated Rainfed Total Irrigated Rainfed Total Irrigated Rainfed Total Irrigated Rainfed Total Irrigated Rainfed Total
A) Cereals 0 0 0 2287 0 2287 0 0 0 2287 0 2287
B) Coarse
Cereals 1900 14476 16376 600 10356 10956 5 0 5 2505 24832 27337
C) Pulses 900 3353 4253 900 3091 3991 10 0 10 1810 6444 8254
D) Oilseeds 410 1564 1974 0 0 0 5 0 5 415 1564 1979
E) Fibre 7700 51452 59152 0 0 0 0 0 0 7700 51452 59152
F) Any other
crop 4492 108 4600 0 0 0 0 0 0 4492 108 4600 2400.61 37.61 2438.22
Total 15402 70953 86355 3787 13447 17234 20 0 20 19209 84400 103609 2400.61 37.61 2438.22
District Irrigation Plan for Aurangabad District of Maharashtra State (India) under PMKSY 2016-2020
Page 25
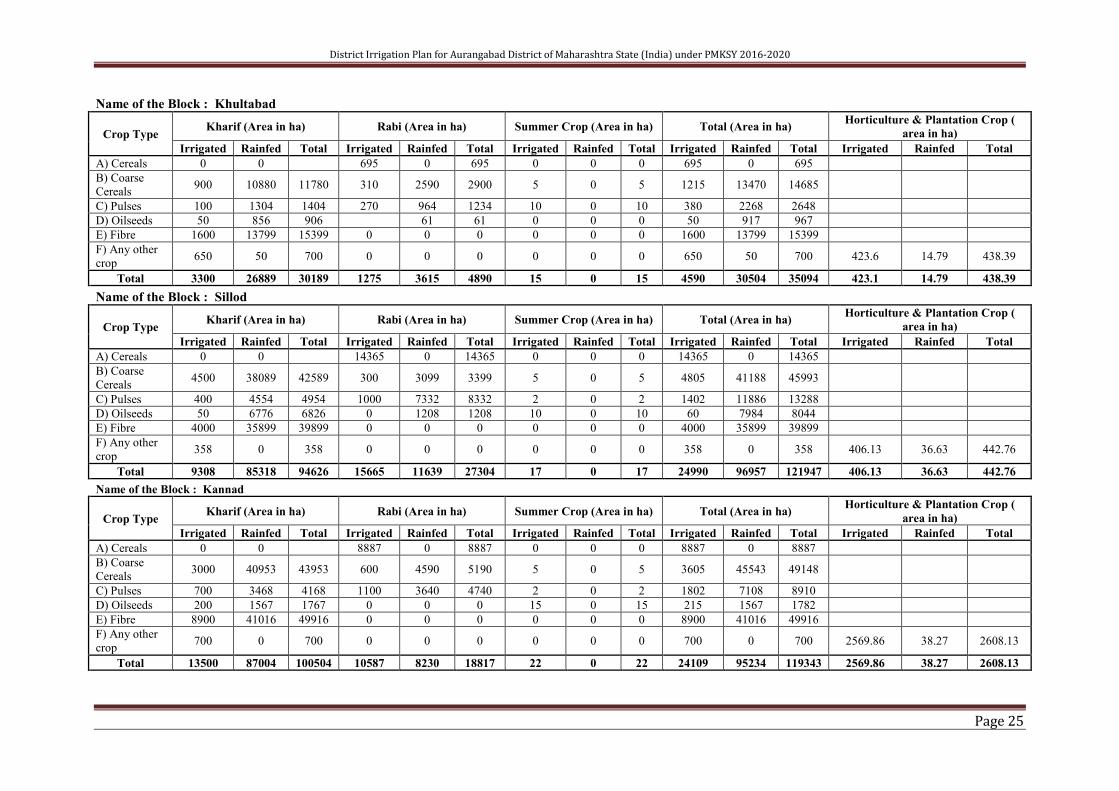
Name of the Block : Khultabad
Crop Type Kharif (Area in ha) Rabi (Area in ha) Summer Crop (Area in ha) Total (Area in ha)
Horticulture & Plantation Crop (
area in ha)
Irrigated Rainfed Total Irrigated Rainfed Total Irrigated Rainfed Total Irrigated Rainfed Total Irrigated Rainfed Total
A) Cereals 0 0 695 0 695 0 0 0 695 0 695
B) Coarse
Cereals 900 10880 11780 310 2590 2900 5 0 5 1215 13470 14685
C) Pulses 100 1304 1404 270 964 1234 10 0 10 380 2268 2648
D) Oilseeds 50 856 906 61 61 0 0 0 50 917 967
E) Fibre 1600 13799 15399 0 0 0 0 0 0 1600 13799 15399
F) Any other
crop 650 50 700 0 0 0 0 0 0 650 50 700 423.6 14.79 438.39
Total 3300 26889 30189 1275 3615 4890 15 0 15 4590 30504 35094 423.1 14.79 438.39
Name of the Block : Sillod
Crop Type Kharif (Area in ha) Rabi (Area in ha) Summer Crop (Area in ha) Total (Area in ha)
Horticulture & Plantation Crop (
area in ha)
Irrigated Rainfed Total Irrigated Rainfed Total Irrigated Rainfed Total Irrigated Rainfed Total Irrigated Rainfed Total
A) Cereals 0 0 14365 0 14365 0 0 0 14365 0 14365
B) Coarse
Cereals 4500 38089 42589 300 3099 3399 5 0 5 4805 41188 45993
C) Pulses 400 4554 4954 1000 7332 8332 2 0 2 1402 11886 13288
D) Oilseeds 50 6776 6826 0 1208 1208 10 0 10 60 7984 8044
E) Fibre 4000 35899 39899 0 0 0 0 0 0 4000 35899 39899
F) Any other
crop 358 0 358 0 0 0 0 0 0 358 0 358 406.13 36.63 442.76
Total 9308 85318 94626 15665 11639 27304 17 0 17 24990 96957 121947 406.13 36.63 442.76
Name of the Block : Kannad
Crop Type Kharif (Area in ha) Rabi (Area in ha) Summer Crop (Area in ha) Total (Area in ha)
Horticulture & Plantation Crop (
area in ha)
Irrigated Rainfed Total Irrigated Rainfed Total Irrigated Rainfed Total Irrigated Rainfed Total Irrigated Rainfed Total
A) Cereals 0 0 8887 0 8887 0 0 0 8887 0 8887
B) Coarse
Cereals 3000 40953 43953 600 4590 5190 5 0 5 3605 45543 49148
C) Pulses 700 3468 4168 1100 3640 4740 2 0 2 1802 7108 8910
D) Oilseeds 200 1567 1767 0 0 0 15 0 15 215 1567 1782
E) Fibre 8900 41016 49916 0 0 0 0 0 0 8900 41016 49916
F) Any other
crop 700 0 700 0 0 0 0 0 0 700 0 700 2569.86 38.27 2608.13
Total 13500 87004 100504 10587 8230 18817 22 0 22 24109 95234 119343 2569.86 38.27 2608.13

District Irrigation Plan for Aurangabad District of Maharashtra State (India) under PMKSY 2016-2020
Page 26
Name of the Block : Soegaon
Crop Type Kharif (Area in ha) Rabi (Area in ha) Summer Crop (Area in ha) Total (Area in ha)
Horticulture & Plantation Crop (
area in ha)
Irrigated Rainfed Total Irrigated Rainfed Total Irrigated Rainfed Total Irrigated Rainfed Total Irrigated Rainfed Total
A) Cereals 0 0 1519 0 1519 0 0 0 1519 0 1519
B) Coarse
Cereals 650 7293 7943 300 2377 2677 5 0 5 955 9670 10625
C) Pulses 200 2481 2681 180 1362 1542 2 0 2 382 3843 4225
D) Oilseeds 50 2586 2636 0 24 24 12 0 12 62 2610 2672
E) Fibre 2200 23935 26135 0 0 0 0 0 0 2200 23935 26135
F) Any other
crop 1600 0 1600 600 0 600 0 0 0 2200 0 2200 683.3 100.21 783.51
Total 4700 36295 40995 2599 3763 6362 19 0 19 7318 40058 47376 683.3 100.21 783.51
Name of the District : Aurangabad
Crop Type Kharif (Area in ha) Rabi (Area in ha) Summer Crop (Area in ha) Total (Area in ha)
Horticulture & Plantation Crop (
area in ha)
Irrigated Rainfed Total Irrigated Rainfed Total Irrigated Rainfed Total Irrigated Rainfed Total Irrigated Rainfed Total
A) Cereals 0 0 0 37169 0 37169 0 0 0 37169 0 37169 0 0 0
B) Coarse
Cereals 15665 184563 200228 6060 53170 59230 58 0 58 21783 237733 259516 0 0 0
C) Pulses 3375 32538 35913 6792 25860 32652 37 0 37 10204 58398 68602 0 0 0
D) Oilseeds 1130 17878 19008 0 1413 1413 134 0 134 1264 19291 20555 0 0 0
E) Fibre 54760 339900 394660 0 0 0 0 0 0 54760 339900 394660 0 0 0
F) Any other
crop 17406 354 17760 700 0 700 0 0 0 18106 354 18460 20859.9 584.62 21444.5
Total 92336 575233 667569 50721 80443 131164 229 0 229 143286 655676 798962 20862.3 584.62 21444.5
District Irrigation Plan for Aurangabad District of Maharashtra State (India) under PMKSY 2016-2020
Page 27
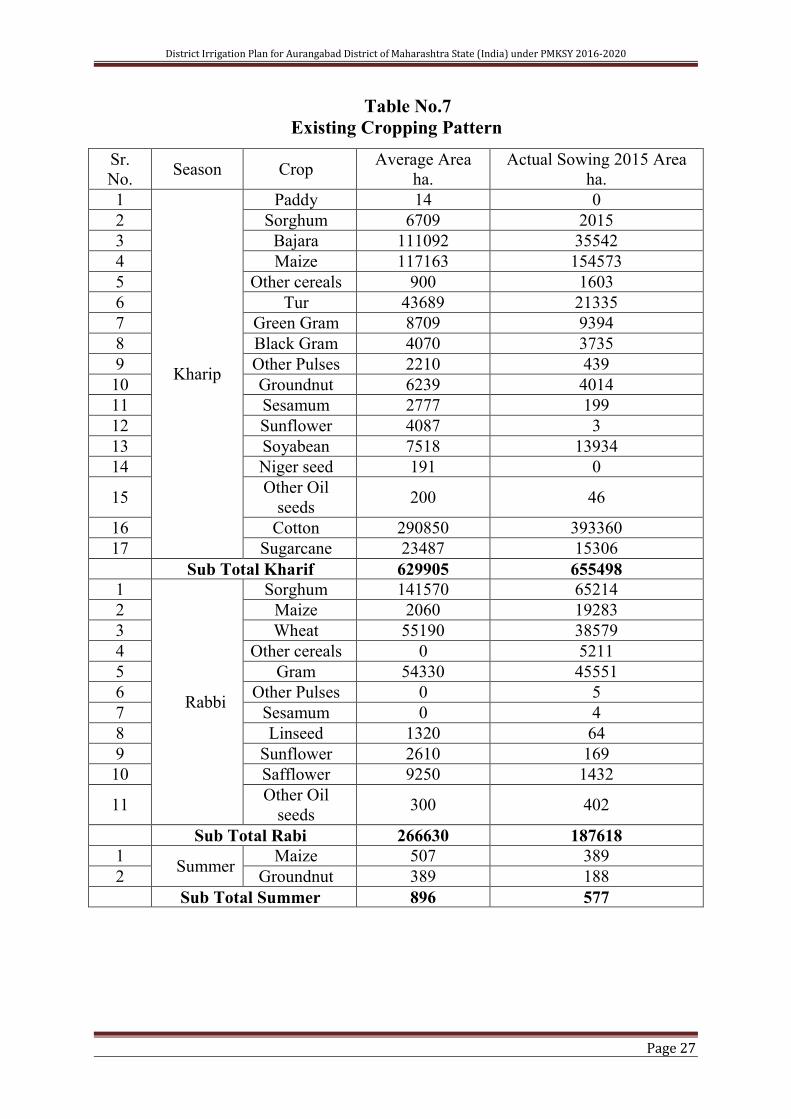
Table No.7
Existing Cropping Pattern
Sr.
No. Season Crop
Average Area
ha.
Actual Sowing 2015 Area
ha.
1
Kharip
Paddy 14 0
2 Sorghum 6709 2015
3 Bajara 111092 35542
4 Maize 117163 154573
5 Other cereals 900 1603
6 Tur 43689 21335
7 Green Gram 8709 9394
8 Black Gram 4070 3735
9 Other Pulses 2210 439
10 Groundnut 6239 4014
11 Sesamum 2777 199
12 Sunflower 4087 3
13 Soyabean 7518 13934
14 Niger seed 191 0
15 Other Oil
seeds 200 46
16 Cotton 290850 393360
17 Sugarcane 23487 15306
Sub Total Kharif 629905 655498
1
Rabbi
Sorghum 141570 65214
2 Maize 2060 19283
3 Wheat 55190 38579
4 Other cereals 0 5211
5 Gram 54330 45551
6 Other Pulses 0 5
7 Sesamum 0 4
8 Linseed 1320 64
9 Sunflower 2610 169
10 Safflower 9250 1432
11 Other Oil
seeds 300 402
Sub Total Rabi 266630 187618
1 Summer
Maize 507 389
2 Groundnut 389 188
Sub Total Summer 896 577

District Irrigation Plan for Aurangabad District of Maharashtra State (India) under PMKSY 2016-2020
Page 28
Existing Area under Rainfed / irrigated Cultivation
Table No.8
Area under Irrigated and Rainfed Crops
Crops
Rainfed Irrigated
Area
(ha) Yield (q/ha)
Area
(ha) Yield (q /ha)
--- Kharif Crop
i. Sorghum 2015 4.03 0 0
ii. Bajra 36042 5.03 0 0
iii. Maize 144908 10.51 15655 12.52
iv. Other cereals 1598 2.48 - -
v. Tur 18970 2.78 3375 3.03
vi. Green Gram 9394 1.91 0 0
vii. Black Gram 3735 1.59 - -
viii. Other Pulses 439 1.29 - -
ix. Groundnut 3195 4.22 1130 4.32
x. Sesamum 199 1.18 - -
xi. Sunflower 3 2.05 - -
xii. Soybean 14435 4.05 - -
xiv. Niger seed - - - -
xv. Other Oil seeds 46 2.00 - -
xvi. Cotton 339900 0.99 54760 1.50
xvii. Sugarcane - - 15656 609.40
Sub Total 574879 90576
-- Rabbi Crop
i. Sorghum 42822 4.72 4970 6.15
ii. Maize 8304 17.78 890 19.63
iii. Wheat - - 37169 10.38
iv. Other cereals 2044 2.75 - -
v. Gram 25860 4.52 6792 4.80
vi. Other Pulses 0 0 - -
vii. Linseed 63 1.20 - -
viii. Sunflower 96 2.45 - -
ix. Safflower 1548 4.13 - -
x. Other Oil seeds 13 1.54 - -
xi. Sugarcane - -
Sub Total 80750 49821
District Irrigation Plan for Aurangabad District of Maharashtra State (India) under PMKSY 2016-2020
Page 29
-- Perennial
i. Custard Apple 232 184.50 0 0
ii. Grapes - - 3 10.00
iii. Pomegranate - - 1722.21 110.00
iv. Orange - - - -
v. Sweet Orange - - 12422 124.00
vi. Mango - - 1621 278.00
vii. Banana - - 180 630.00
viii. Guava - - 341 367.00
ix. K. Lime - - 181 500.00
x. Papaya - - 50 490.00
xi. Sapota - - 1099 29.00
Sub Total 232 17619.21
-- Vegetable
i. Brinjal - - 1480 210.62
ii. Cabbage - - 300 200.00
iii. Cauliflower - - 315 200.00
iv. Okra - - 550 120.00
v. Tomato - - 1450 250.00
vi. Potato - - 55 200.00
vii. Onion - - 8010 170.00
Sub Total - - 12160
-- Spices
i. Ginger - - 7545 200.00
ii. Turmeric - - 745 150.00
iii. Chilli 1250 100.00
Sub Total - - 9540
-- Flowers
i. Chrysanthmum - - 18 50.00
ii. Gladiolus - - 80 20.60
iii. Rose - - 26 40.60
iv. Other Flowers - - 110 50.00
Sub Total - - 234
District Irrigation Plan for Aurangabad District of Maharashtra State (India) under PMKSY 2016-2020
Page 30
Rainfall analysis of Aurangabad district
(a) Rainfall during Monsoon :
Wettest Monsoon – 836.7 mm (in 2006)
Driest Monsoon – 320 mm (in 2012)
Average – 675.46 mm
(b) Rainfall during non-monsoon:
Wettest Non- monsoon year – 198.1 mm (in 2009)
Driest Non-monsoon year – 22.2 mm (in 2007)
Average – 53.82 mm
12. Hydrogeology
The major part (95%) of the district constitutes a sequence of basaltic
lava flows (Deccan Trap) while alluvium occupies a small portion. There are
two distinct hydro geological units in the district i.e. fissured formations
(different units of basaltic lava flows) and porous formations (isolated patches
of alluvial deposits). The occurrence and movement of ground water is
controlled by variation in water bearing properties of these formations.
Deccan Trap Basalt
Deccan traps are a thick pile of basaltic flows, horizontally disposed and
apparently more or less uniform in composition. Each individual flow is a
typical section, which varies from porous weathered base to a massive middle
unit, becoming increasingly vesicular towards the top. The ground water occurs
under water table and semi confined to confined conditions in Deccan Trap
Basalt. The vesicular units in different trappean flows range in thickness from
2-8 meters and have primary porosity. However, the nature and density of the
vesicles, their distribution, interconnection between the vesicles, and depth of
weathering and topography of the area are the decisive factor for occurrence and
movement of ground water in these units. Since the zeolitic units in vesicular
traps are highly susceptible to weathering, the vesicular units comprising
weathered zeolitic traps occurring in topographic lows are the main water
bearing formation in hard rock terrain of the district. In massive unit of Deccan
Trap Basalt, ground water occurs in soil cum weathered mantle, joints, cracks
and other weaker zones. The upper portion of the massive traps show persistent
spheroidal weathering and exfoliation which helps in retaining more ground

District Irrigation Plan for Aurangabad District of Maharashtra State (India) under PMKSY 2016-2020
Page 31
water in these rocks in comparison to compact massive unit. The storage of
ground water in compact massive unit totally depends upon the presence of
joints and their nature, distribution and interconnection. The average depth
range of dugwells is 12.00 m to 15.00 m and that of bore wells is 50.00 to 60.00
m in hard rock areas.
Map.11. Geological map of Aurangabad district.
Alluvium
The ground water in isolated alluvial pockets in the Godavari, Shivna,
Purna and their tributaries occur under both water table and semi-confined
conditions. The exploration of shallow alluvial area of the Shivna basin reveals
that the saturated thickness of the alluvial material comprising silty clay, sand
and gravel ranges from 1-7 meters. The depth to basement ranges between
16.25 to 26.45 m bgl. The aquifer horizons were encountered as coarse sand
mixed with clay and silt between 15.00 and 26.00 m bgl, which constitute the
potential aquifer in the area with discharge of up to 4.50 lps. The dugwells are
generally down to 20 m depth and yields varying between 0.5 and 0.8 lps.

District Irrigation Plan for Aurangabad District of Maharashtra State (India) under PMKSY 2016-2020
Page 32
Aquifer Parameters
Aquifer parameters are available from ground water exploration carried
out in the alluvial area of the district as well as from the pumping tests carried
out on dugwells in Basaltic and Alluvial terrain. The transmissivity of shallow
basaltic aquifers in the district is generally less than 80 m2/day. The specific
capacity of well also gives an idea about the productivity of well and is
controlled by diameter and depth. In basaltic formation the specific capacity of
dugwells is generally less than 200 lpm/m of drawdown with an average of 110
lpm/m of drawdown. In Alluvium it ranges from 130-2043 lpm/m of drawdown.
Yields of Dugwells and Borewells
The yields of the wells are function of the permeability and transmissivity
of aquifer encountered and it varies with location, diameter and depth of wells
etc. There are mainly two types of ground water abstraction structures in the
district i.e., dugwells and borewells, however the yield of wells also vary
according to nature of formation tapped and its saturated thickness. Therefore,
the dugwells located in the topographic lows, morphological depressions and on
or near the lineaments yield comparatively more water than the located
elsewhere, which is particularly true in basaltic terrain. The yield of dugwell
also varies depending on the season. The yields of dugwells for different
formations are presented in Table No. 9.
Table No. 9
Yield of Well
Sr.
No. Formation
G.W.
Structures
Depth Range (m
bgl)
Yield Range
(lps)
1 Alluvium
(porous) Dugwell 7-20 0.5-0.8
2 Basalt (Fissured) Dugwell
Bore well
12-20
50-60
1.5-3.1
0.6-2.4
13. Groundwater Scenarios
The dugwells were used as primary groundwater withdrawal structure
before the invention of the bore well technology. Therefore the extraction of
water from the greater depth was limited in historical time. But as the
technology is getting advance day by day, the bore well technology is used to

District Irrigation Plan for Aurangabad District of Maharashtra State (India) under PMKSY 2016-2020
Page 33
dig the boreholes at greater depth. Therefore the groundwater availability is
getting depleted as a result of this extraction.
Groundwater Recharge, Draft and Irrigation wells details from the year
1973 to 2011 as per groundwater assessment
Table No. 10
1973 1988 1990 1998 2004 2007 2008 2011
Annual Recharge in BCM 0.877 0.806 1.013 1.013 1.208 1.276 1.256 1.196
Annual Draft in BCM 0.518 0.353 0.410 0.451 0.729 0.739 0.739 0.818
Total Irrigation Wells
69270 83286 83286 102403
Balance In BCM 0.452 0.604 0.563 0.428 0.452 0.474 0.467
The number of irrigation wells from the year 1973 to 2011 has been
increasing regularly in the district. The above table shows consistent growth in
groundwater irrigation draft and the number of wells.
The numbers of bore wells in the districts are substantial. Huge amount of
water is being lifted from bore wells. But authentic data is not available. Hence
the water draft is not taken in to consideration.
13.1 Present scenarios
The district abstract showing details of Dynamic Ground water recourses
of the Aurangabad district is given below
Table No.11
The district abstract showing details of Dynamic Ground water Resources
2011-12
Total Number of Watersheds 52
Overexploited Watersheds 01
Semi – Critical watersheds 03
Safe watersheds 48
Total No of Talukas 09
Total Assessment Area in Hectare 950174
Command Area in Hectare 152345
Non Command Area in Hectare 797829
Irrigation wells 102403
Total Annual GW Recharge in MCM 1196.80
Net annual GW availability 1136.46
Gross Draft in MCM 817.56
Stage of Development of the District 69.43 %

District Irrigation Plan for Aurangabad District of Maharashtra State (India) under PMKSY 2016-2020
Page 34
3.2 Status of Ground water Availability
Name of the state : Maharashtra
Name of the District : Aurangabad
Name of the
Bolock
Status of Block as per Central
Ground Water Board
Notification
Ground water (BCM)
Critical Semi-Critical Safe Draft Recharge Gap
Aurangabad √ 0.1023 0.16158 0.05928
Paithan √ 0.13791 0.20636 0.06845
Phulambri √ 0.04065 0.04938 0.00873
Vaijapur √ 0.13671 0.18399 0.04728
Gangapur √ 0.11039 0.14727 0.03688
Khultabad √ 0.04216 0.06827 0.02611
Sillod √ 0.98055 0.14214 -0.83841
Kannad √ 0.11368 0.17777 0.06409
Soegaon √ 0.03567 0.05999 0.02432
Total District 1.70002 1.19675 -0.50327
Source : CGWB
Table 3.2 shows that ground water recharge from rainfall which is computed in ground water
assesment carried out by Ground Water Survey & Development Agency (GSDA). This table
also shows draft means ground water withdrawal from aquifer by water abstracting structures
like well and tube well.
(Ref - Ground Water Assessment report 2011-12)
Ground Water Assessment report 2011-12 indicates that all the blocks of
the district falls in “safe” category as per central ground water notification.
However highest draft is seen in Vaijapur followed by Kannad and Gangapur.
In Sillod block surprisingly recharge is less than draft. District is having 52
watersheds out of which one watershed is overexploited and 3 are semi critical,
while majority of 48 watersheds are safe.

District Irrigation Plan for Aurangabad District of Maharashtra State (India) under PMKSY 2016-2020
Page 35
13.2 Irrigation Projects (Major/Medium/Minor)
Table No. 12
Details of Irrigation Projects
14. Irrigation Methods used o Canal Irrigation (Major project) - 51350 ha
o Canal irrigation (medium project) - 38958 ha
o Canal irrigation (minor project) - 32162 ha
o Minor structures ( 0 – 250 ha) (KT Weir/ PT) - 93437 ha
o Lift Irrigation - 18787 ha
o Open well - 121643 ha
o Total - 356337 ha
Status of command area
The canal based surface irrigation potential created of all major,
medium and minor project in district is 1,26,815 ha. Community ponds
including small created irrigation potential of 3178 ha while individual private
pond have potential of 2514 ha and all type of well provide net potential of
82,949 ha as per ground water assessment report 2011-12. While by using
protective irrigation to various Kharif and Rabi crops the gross irrigated area by
way of open well reach to 1,21,643 ha. The total irrigation potential created in
the district is to the tune of 2,26,935 ha. However the actual surface irrigation
realized is for less than the potential created. Due to frequent drought like
situation the canal irrigation of many minor projects is not realized so also is the
case with the Jayakwadi project which depends solely on water inflow from
other district i.e. Nasik and Ahmednagar. The damaged structures / distribution
Name of the
project status
No of
projects
Live storage
(BCM)
Culturable command
area (CCA) Ha.
Major
completed 1 0.34880 51350
ongoing - - -
total 1 0.34880 51350
Medium
completed 16 0.23542 38958
ongoing - - -
total 16 0.23542 38958
Minor
completed 90 0.20812 32162
ongoing - - -
total 90 0.20812 32162
Water bodies
(0 to 250 Ha.)
completed 4136 0.35029 88573
ongoing 304 0.02179 4864
total 4440 0.37208 93437
Total 4547 1.16442 215907

District Irrigation Plan for Aurangabad District of Maharashtra State (India) under PMKSY 2016-2020
Page 36
systems also poses serious hurdle in attaining designed irrigation potential.
Besides this in most of the project some quantity of water is reserved for
drinking water or industrial use which reduces availability of water for
irrigation.
The potential created in minor structures (0-250ha) (KT weirs / PT
/ Tanks) only one or two irrigations become available as protective irrigation.
Area under micro irrigation methods
There is increasing trend towards use of micro irrigation methods. In
addition to fruit crops farmers are using drip irrigation to cotton and maize.
Sprinkler is used for crops like wheat, gram. At present the area under micro
irrigation methods is as below.
A) Drip irrigation - 45895.94 ha
B) Sprinkler irrigation - 3350 ha
Total - 49245.94
15. WATER REQUIREMENT/DEMAND (BLOCK WISE)
A. Water availability in the Districts
Blocks wise Water availability is calculated depending upon the 50
% possibility. It is depicted in table no. 13.
Block wise water availability is calculated depending upon 50%
probability except Sillod and Soygaon other 7 blocks in district are
drought prone. In last 5 years the most hit block due to inadequate rainfall
are Gangapur, Vaijapur and Paithan. In all these drought prone blocks the
water availability from rainfall gets drastically reduced.

District Irrigation Plan for Aurangabad District of Maharashtra State (India) under PMKSY 2016-2020
Page 37
Table No. 13
Taluka wise water available from Rainfall
Taluka Area in
Hector
Rainfall
(M)
Water available
from Rainfall in
hector mtr
Water available
(50% dependability)
BCM
Aurangabad 134603 0.672 90453.22 0.45227
Phulambri 68901 0.660 45474.66 0.22737
Gangapur 131766 0.625 82353.75 0.41176
Kannad 151876 0.749 113755.12 0.56878
Khultabad 49257 0.800 39405.60 0.19703
Paithan 142468 0.655 93316.54 0.46658
Sillod 119024 0.650 77365.60 0.38683
Soygaon 65319 0.769 50230.31 0.25115
Vaijapur 147486 0.500 73743.00 0.36871
Total 1010700 -- 666097.80 3.33049
Table No. 14
Potential Water that can be utilized through various sources
Sr. No. Source of water Water available BCM
1 Ground Water Available 1.13646
2 Surface Storage 0.79383
3 In flow from other Districts ( Jayakwadi) 0.34880
4 Water available for further use from rainfall 2.53666
Total 4.81575
B. Water requirement
Water demands for various sectors have been computed. Following
categories of demands have been considered in this plan:
1. Non-agricultural demand
a. Domestic demand
b. Live stock demand
c. Industrial demand
2. Agricultural demand
a) Domestic Water Demand Computation
For computing domestic water demand for rural areas, per capita
consumption has been considered as 70 lpcd (litre per capita per day) and for
urban areas it has been considered as 135 lpcd (IS 1172:1993 annexure-2). On
District Irrigation Plan for Aurangabad District of Maharashtra State (India) under PMKSY 2016-2020
Page 38
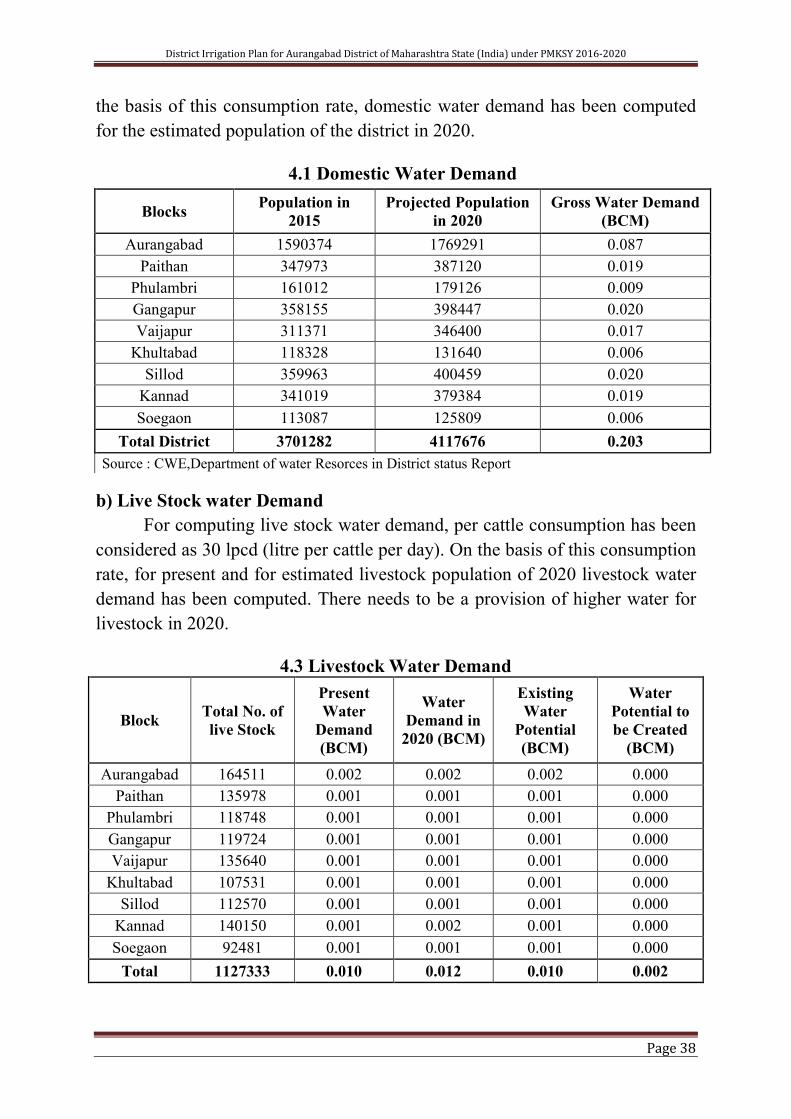
the basis of this consumption rate, domestic water demand has been computed
for the estimated population of the district in 2020.
4.1 Domestic Water Demand
Blocks Population in
2015
Projected Population
in 2020
Gross Water Demand
(BCM)
Aurangabad 1590374 1769291 0.087
Paithan 347973 387120 0.019
Phulambri 161012 179126 0.009
Gangapur 358155 398447 0.020
Vaijapur 311371 346400 0.017
Khultabad 118328 131640 0.006
Sillod 359963 400459 0.020
Kannad 341019 379384 0.019
Soegaon 113087 125809 0.006
Total District 3701282 4117676 0.203
Source : CWE,Department of water Resorces in District status Report
b) Live Stock water Demand
For computing live stock water demand, per cattle consumption has been
considered as 30 lpcd (litre per cattle per day). On the basis of this consumption
rate, for present and for estimated livestock population of 2020 livestock water
demand has been computed. There needs to be a provision of higher water for
livestock in 2020.
4.3 Livestock Water Demand
Block Total No. of
live Stock
Present
Water
Demand
(BCM)
Water
Demand in
2020 (BCM)
Existing
Water
Potential
(BCM)
Water
Potential to
be Created
(BCM)
Aurangabad 164511 0.002 0.002 0.002 0.000
Paithan 135978 0.001 0.001 0.001 0.000
Phulambri 118748 0.001 0.001 0.001 0.000
Gangapur 119724 0.001 0.001 0.001 0.000
Vaijapur 135640 0.001 0.001 0.001 0.000
Khultabad 107531 0.001 0.001 0.001 0.000
Sillod 112570 0.001 0.001 0.001 0.000
Kannad 140150 0.001 0.002 0.001 0.000
Soegaon 92481 0.001 0.001 0.001 0.000
Total 1127333 0.010 0.012 0.010 0.002

District Irrigation Plan for Aurangabad District of Maharashtra State (India) under PMKSY 2016-2020
Page 39
c) Industrial Water Demand
Industrial water demand has been taken from the office of MIDC
Aurangabad as mentioned below in table No. 17
4.4 Industrial Water Demand
Block Name of the
Industry
Water
Demand
(BCM)
Water
Demand
2020 (BCM)
Existing
Water
Potential
(BCM)
Water
Potential to be
Created
(BCM)
Aurangabad MIDC 0.01013 0.01441 0.01013 0.00428
Paithan MIDC 0.00066 0.00079 0.00066 0.00013
Phulambri 0 0 0 0
Gangapur 0 0 0 0
Vaijapur 0 0 0 0
Khultabad 0 0 0 0
Sillod 0 0 0 0
Kannad 0 0 0 0
Soegaon 0 0 0 0
TOTAL 0.01079 0.0152 0.01079 0.00441
Water demand for power generation in the district is zero. There is only
one hydroelectric power plant at Jayakwadi Paithan which is not functional and
there is a system created for reuse of water for power generation if any.
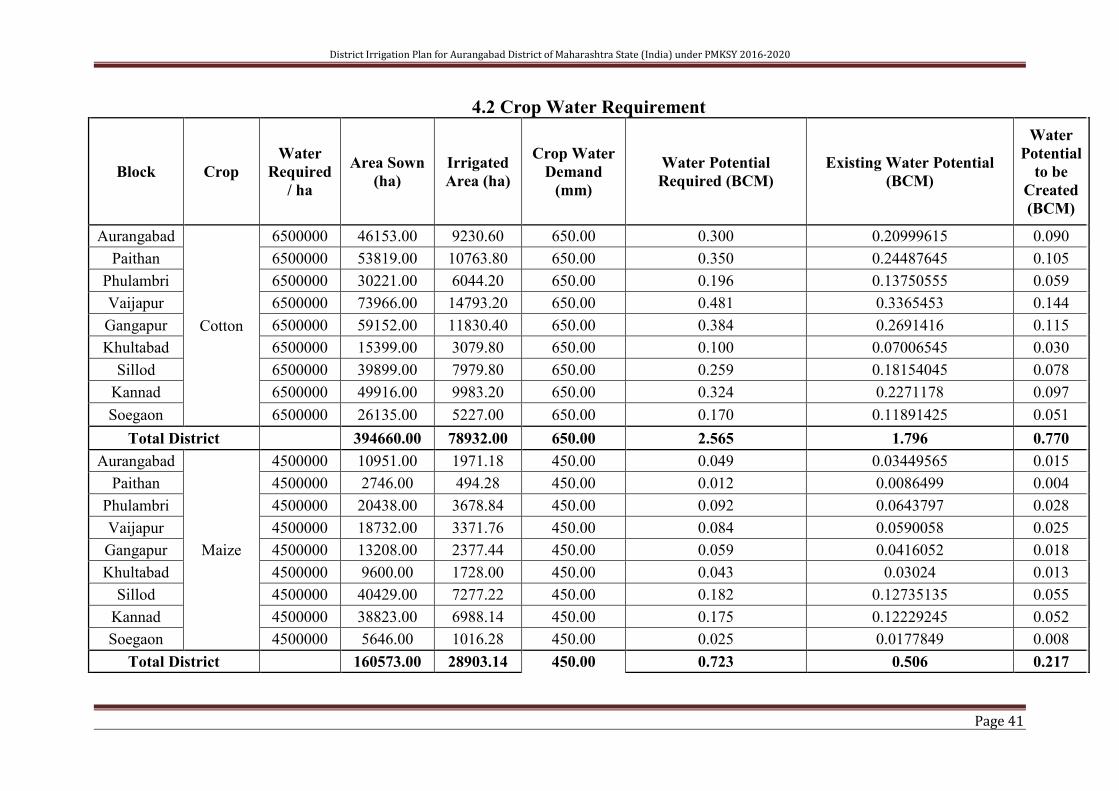
d) Agriculture Water Demand
Agricultural water demand is computed block wise by taking into
consideration the present cropping pattern. Initially water requirement for
various crops is computed as per assessment of scientists of Vasantrao Naik
Marathwada Agriculture University, Parbhani.
Cotton is grown on 3.94 lakh ha area in the district. As its water
requirement is very high Cotton crop in district needs about 2.565 BCM water
while the available water is 1.796 BCM, hence an additional 0.770 BCM water
potential needs to be created to sustain the present cotton crop area and we need
to plan for shifting cotton area in to other crops needing less water.
The other crop which consuming more water is wheat. For existing wheat
crop area of 38580 ha we need 0.193 BCM water and available water is 0.135
BCM, hence an additional 0.058 BCM potential need to be created for wheat.

District Irrigation Plan for Aurangabad District of Maharashtra State (India) under PMKSY 2016-2020
Page 40
The other crop which needs more water is sugarcane, but area under
sugarcane in district is only 15300ha and it is of no concern.
In rest of the major crops like Maize, Tur, Bajra, Soybean, Gram, Rabi
Jowar the water requirement is very well fulfilled by existing water potential.
However there is deficit in fruit crops and an additional 0.0024 BCM
water potential needs to be created. The major concern for deficit is in Sweet
Orange which alone faces 0.002 BCM deficits.
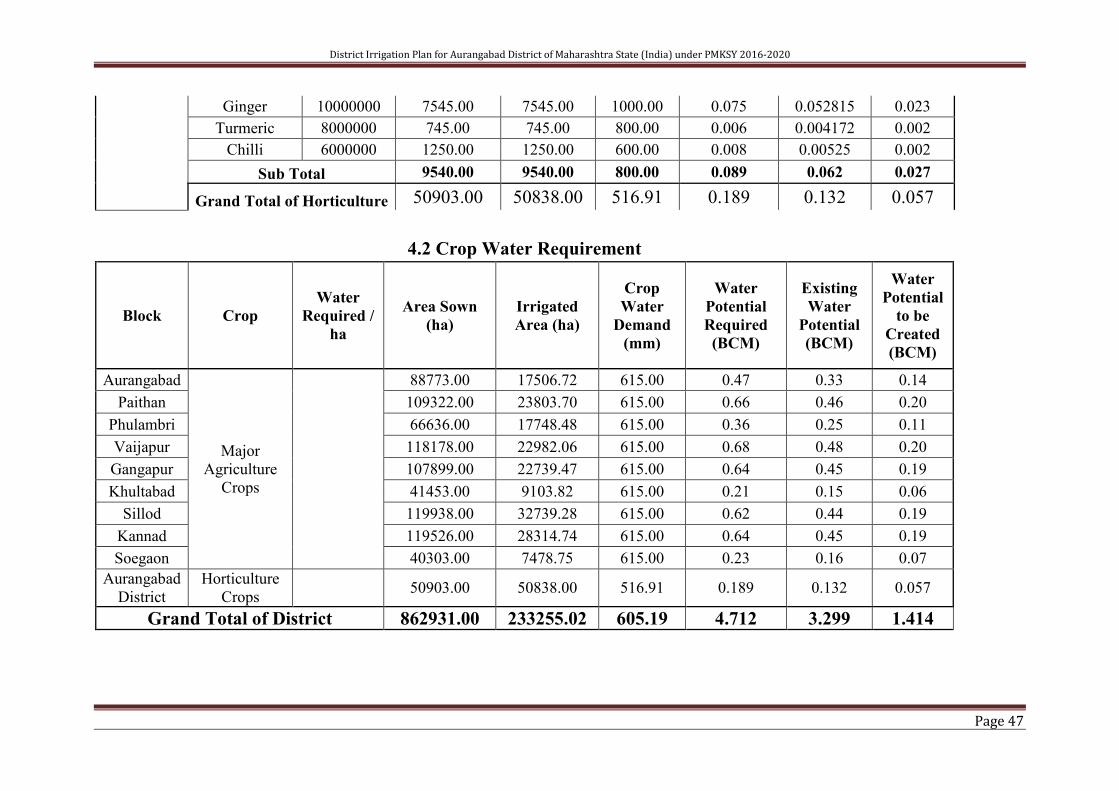
The overall water demand of agricultural sector is 4.712 BCM which
existing potential is 3.299 creating a gap of 1.414 BCM
District Irrigation Plan for Aurangabad District of Maharashtra State (India) under PMKSY 2016-2020
Page 41
4.2 Crop Water Requirement
Block Crop
Water
Required
/ ha
Area Sown
(ha)
Irrigated
Area (ha)
Crop Water
Demand
(mm)
Water Potential
Required (BCM)
Existing Water Potential
(BCM)
Water
Potential
to be
Created
(BCM)
Aurangabad
Cotton
6500000 46153.00 9230.60 650.00 0.300 0.20999615 0.090
Paithan 6500000 53819.00 10763.80 650.00 0.350 0.24487645 0.105
Phulambri 6500000 30221.00 6044.20 650.00 0.196 0.13750555 0.059
Vaijapur 6500000 73966.00 14793.20 650.00 0.481 0.3365453 0.144
Gangapur 6500000 59152.00 11830.40 650.00 0.384 0.2691416 0.115
Khultabad 6500000 15399.00 3079.80 650.00 0.100 0.07006545 0.030
Sillod 6500000 39899.00 7979.80 650.00 0.259 0.18154045 0.078
Kannad 6500000 49916.00 9983.20 650.00 0.324 0.2271178 0.097
Soegaon 6500000 26135.00 5227.00 650.00 0.170 0.11891425 0.051
Total District 394660.00 78932.00 650.00 2.565 1.796 0.770
Aurangabad
Maize
4500000 10951.00 1971.18 450.00 0.049 0.03449565 0.015
Paithan 4500000 2746.00 494.28 450.00 0.012 0.0086499 0.004
Phulambri 4500000 20438.00 3678.84 450.00 0.092 0.0643797 0.028
Vaijapur 4500000 18732.00 3371.76 450.00 0.084 0.0590058 0.025
Gangapur 4500000 13208.00 2377.44 450.00 0.059 0.0416052 0.018
Khultabad 4500000 9600.00 1728.00 450.00 0.043 0.03024 0.013
Sillod 4500000 40429.00 7277.22 450.00 0.182 0.12735135 0.055
Kannad 4500000 38823.00 6988.14 450.00 0.175 0.12229245 0.052
Soegaon 4500000 5646.00 1016.28 450.00 0.025 0.0177849 0.008
Total District 160573.00 28903.14 450.00 0.723 0.506 0.217

District Irrigation Plan for Aurangabad District of Maharashtra State (India) under PMKSY 2016-2020
Page 42
4.2 Crop Water Requirement
Block Crop
Water
Required
/ ha
Area
Sown
(ha)
Irrigated
Area
(ha)
Crop
Water
Demand
(mm)
Water Potential
Required (BCM)
Existing Water
Potential
(BCM)
Water Potential to
be Created
(BCM)
Aurangabad
Tur
4000000 3504.00 210.24 400.00 0.014 0.0098112 0.004
Paithan 4000000 7138.00 428.28 400.00 0.029 0.0199864 0.009
Phulambri 4000000 802.00 48.12 400.00 0.003 0.0022456 0.001
Vaijapur 4000000 1599.00 95.94 400.00 0.006 0.0044772 0.002
Gangapur 4000000 3031.00 181.86 400.00 0.012 0.0084868 0.004
Khultabad 4000000 902.00 54.12 400.00 0.004 0.0025256 0.001
Sillod 4000000 1771.00 106.26 400.00 0.007 0.0049588 0.002
Kannad 4000000 2368.00 142.08 400.00 0.009 0.0066304 0.003
Soegaon 4000000 1230.00 73.80 400.00 0.005 0.003444 0.001
Total District 22345.00 1340.70 400.00 0.089 0.063 0.027
Aurangabad
Bajra
3500000 7569.00 227.07 350.00 0.026 0.01854405 0.008
Paithan 3500000 8348.00 250.44 350.00 0.029 0.0204526 0.009
Phulambri 3500000 1791.00 53.73 350.00 0.006 0.00438795 0.002
Vaijapur 3500000 5848.00 175.44 350.00 0.020 0.0143276 0.006
Gangapur 3500000 3168.00 95.04 350.00 0.011 0.0077616 0.003
Khultabad 3500000 1737.00 52.11 350.00 0.006 0.00425565 0.002
Sillod 3500000 1648.00 49.44 350.00 0.006 0.0040376 0.002
Kannad 3500000 4700.00 141.00 350.00 0.016 0.011515 0.005
Soegaon 3500000 1227.00 36.81 350.00 0.004 0.00300615 0.001
Total District 36036.00 1081.08 350.00 0.126 0.088 0.038

District Irrigation Plan for Aurangabad District of Maharashtra State (India) under PMKSY 2016-2020
Page 43
4.2 Crop Water Requirement
Block Crop
Water
Required
/ ha
Area Sown (ha) Irrigated
Area (ha)
Crop
Water
Demand
(mm)
Water Potential
Required (BCM)
Existing Water
Potential
(BCM)
Water Potential to
be Created
(BCM)
Aurangabad
Soybean
4500000 1117.00 11.17 450.00 0.005 0.00351855 0.002
Paithan 4500000 926.00 9.26 450.00 0.004 0.0029169 0.001
Phulambri 4500000 283.00 2.83 450.00 0.001 0.00089145 0.000
Vaijapur 4500000 309.00 3.09 450.00 0.001 0.00097335 0.000
Gangapur 4500000 973.00 9.73 450.00 0.004 0.00306495 0.001
Khultabad 4500000 727.00 7.27 450.00 0.003 0.00229005 0.001
Sillod 4500000 6662.00 66.62 450.00 0.030 0.0209853 0.009
Kannad 4500000 1035.00 10.35 450.00 0.005 0.00326025 0.001
Soegaon 4500000 2403.00 24.03 450.00 0.011 0.00756945 0.003
Total District 14435.00 144.35 450.00 0.065 0.045 0.019
Aurangabad
S.cane
22000000 630.00 630.00 2200.00 0.014 0.009702 0.004
Paithan 22000000 6450.00 6450.00 2200.00 0.142 0.09933 0.043
Phulambri 22000000 550.00 550.00 2200.00 0.012 0.00847 0.004
Vaijapur 22000000 1626.00 1626.00 2200.00 0.036 0.0250404 0.011
Gangapur 22000000 4492.00 4492.00 2200.00 0.099 0.0691768 0.030
Khultabad 22000000 650.00 650.00 2200.00 0.014 0.01001 0.004
Sillod 22000000 258.00 258.00 2200.00 0.006 0.0039732 0.002
Kannad 22000000 650.00 650.00 2200.00 0.014 0.01001 0.004
Soegaon 22000000 0.00 0.00 2200.00 0.000 0 0.000
Total District 22000000 15306.00 15306.00 2200.00 0.337 0.236 0.101

District Irrigation Plan for Aurangabad District of Maharashtra State (India) under PMKSY 2016-2020
Page 44
4.2 Crop Water Requirement
Block Crop
Water
Required /
ha
Area Sown
(ha)
Irrigated
Area (ha)
Crop
Water
Demand
(mm)
Water
Potential
Required
(BCM)
Existing
Water
Potential
(BCM)
Water
Potential
to be
Created
(BCM)
Aurangabad
Wheat
5000000 3285.00 3285.00 500.00 0.016 0.0114975 0.005
Paithan 5000000 1984.00 1984.00 500.00 0.010 0.006944 0.003
Phulambri 5000000 6310.00 6310.00 500.00 0.032 0.022085 0.009
Vaijapur 5000000 1111.00 1111.00 500.00 0.006 0.0038885 0.002
Gangapur 5000000 880.00 880.00 500.00 0.004 0.00308 0.001
Khultabad 5000000 2113.00 2113.00 500.00 0.011 0.0073955 0.003
Sillod 5000000 14314.00 14314.00 500.00 0.072 0.050099 0.021
Kannad 5000000 8029.00 8029.00 500.00 0.040 0.0281015 0.012
Soegaon 5000000 553.00 553.00 500.00 0.003 0.0019355 0.001
Total District 38579.00 38579.00 500.00 0.193 0.135 0.058
Aurangabad
Gram
2500000 3958.00 672.86 250.00 0.010 0.0069265 0.003
Paithan 2500000 7372.00 1253.24 250.00 0.018 0.012901 0.006
Phulambri 2500000 4698.00 798.66 250.00 0.012 0.0082215 0.004
Vaijapur 2500000 3639.00 618.63 250.00 0.009 0.00636825 0.003
Gangapur 2500000 6500.00 1105.00 250.00 0.016 0.011375 0.005
Khultabad 2500000 4766.00 810.22 250.00 0.012 0.0083405 0.004
Sillod 2500000 7882.00 1339.94 250.00 0.020 0.0137935 0.006
Kannad 2500000 5861.00 996.37 250.00 0.015 0.01025675 0.004
Soegaon 2500000 879.00 149.43 250.00 0.002 0.00153825 0.001
Total District 45555.00 7744.35 250.00 0.114 0.080 0.034

District Irrigation Plan for Aurangabad District of Maharashtra State (India) under PMKSY 2016-2020
Page 45
4.2 Crop Water Requirement
Block Crop
Water
Required /
ha
Area Sown
(ha)
Irrigated
Area (ha)
Crop
Water
Demand
(mm)
Water
Potential
Required
(BCM)
Existing
Water
Potential
(BCM)
Water
Potential
to be
Created
(BCM)
Aurangabad
Rabi
Sorghum
3000000 10526.00 1052.60 300.00 0.032 0.0221046 0.009
Paithan 3000000 19374.00 1937.40 300.00 0.058 0.0406854 0.017
Phulambri 3000000 465.00 46.50 300.00 0.001 0.0009765 0.000
Vaijapur 3000000 10826.00 1082.60 300.00 0.032 0.0227346 0.010
Gangapur 3000000 15310.00 1531.00 300.00 0.046 0.032151 0.014
Khultabad 3000000 5025.00 502.50 300.00 0.015 0.0105525 0.005
Sillod 3000000 670.00 67.00 300.00 0.002 0.001407 0.001
Kannad 3000000 2542.00 254.20 300.00 0.008 0.0053382 0.002
Soegaon 3000000 476.00 47.60 300.00 0.001 0.0009996 0.000
Total District 65214.00 6521.40 300.00 0.196 0.137 0.059
Aurangabad
Rabi Maize
6000000 1080.00 216.00 600.00 0.006 0.004536 0.002
Paithan 6000000 1165.00 233.00 600.00 0.007 0.004893 0.002
Phulambri 6000000 1078.00 215.60 600.00 0.006 0.0045276 0.002
Vaijapur 6000000 522.00 104.40 600.00 0.003 0.0021924 0.001
Gangapur 6000000 1185.00 237.00 600.00 0.007 0.004977 0.002
Khultabad 6000000 534.00 106.80 600.00 0.003 0.0022428 0.001
Sillod 6000000 6405.00 1281.00 600.00 0.038 0.026901 0.012
Kannad 6000000 5602.00 1120.40 600.00 0.034 0.0235284 0.010
Soegaon 6000000 1754.00 350.80 600.00 0.011 0.0073668 0.003
Total District 19325.00 3865.00 600.00 0.116 0.081 0.035

District Irrigation Plan for Aurangabad District of Maharashtra State (India) under PMKSY 2016-2020
Page 46
4.2 Crop Water Requirement
Block Crop
Water
Required /
ha
Area Sown
(ha)
Irrigated
Area (ha)
Crop
Water
Demand
(mm)
Water
Potential
Required
(BCM)
Existing
Water
Potential
(BCM)
Water
Potential
to be
Created
(BCM)
Aurangabad
District
Fruits,
Vegetables
and Spices
Fruit Crops
Custard Apple 280000 65 28 0.000 0.00001274 0.000
Pomegranate 5300 5300 0.001 0.0010388 0.000
Sweet Orange 20810 20810 0.006 0.00407876 0.002
Mango 540 540 0.000 0.00010584 0.000
Banana 28 28 1200 0.000 0.00000549 0.000
Guava 505 505 0.000 0.00009898 0.000
K. Lime 285 285 0.000 0.00005586 0.000
Papaya 50 50 0.000 0.0000098 0.000
Sapota 1620 1620 0.000 0.00031752 0.000
Sub Total 29203 29138 136.44 0.008 0.00572379 0.0024531
Vegetable Crops
Brinjal 8500000 1480.00 1480.00 850 0.013 0.008806 0.004
Cabbage 300.00 300.00 500 0.003 0.001785 0.001
Cauliflower 315.00 315.00 500 0.003 0.00187425 0.001
Okra 550.00 550.00 500 0.005 0.0032725 0.001
Tomato 6000000 1450.00 1450.00 600 0.009 0.00609 0.003
Potato 55.00 55.00 600 0.000 0.00032725 0.000
Onion 7500000 8010.00 8010.00 750 0.060 0.0420525 0.018
Sub Total 12160.00 12160.00 614.29 0.092 0.064 0.028
Spice Crops
District Irrigation Plan for Aurangabad District of Maharashtra State (India) under PMKSY 2016-2020
Page 47
Ginger 10000000 7545.00 7545.00 1000.00 0.075 0.052815 0.023
Turmeric 8000000 745.00 745.00 800.00 0.006 0.004172 0.002
Chilli 6000000 1250.00 1250.00 600.00 0.008 0.00525 0.002
Sub Total 9540.00 9540.00 800.00 0.089 0.062 0.027
Grand Total of Horticulture 50903.00 50838.00 516.91 0.189 0.132 0.057
4.2 Crop Water Requirement
Block Crop
Water
Required /
ha
Area Sown
(ha)
Irrigated
Area (ha)
Crop
Water
Demand
(mm)
Water
Potential
Required
(BCM)
Existing
Water
Potential
(BCM)
Water
Potential
to be
Created
(BCM)
Aurangabad
Major
Agriculture
Crops
88773.00 17506.72 615.00 0.47 0.33 0.14
Paithan 109322.00 23803.70 615.00 0.66 0.46 0.20
Phulambri 66636.00 17748.48 615.00 0.36 0.25 0.11
Vaijapur 118178.00 22982.06 615.00 0.68 0.48 0.20
Gangapur 107899.00 22739.47 615.00 0.64 0.45 0.19
Khultabad 41453.00 9103.82 615.00 0.21 0.15 0.06
Sillod 119938.00 32739.28 615.00 0.62 0.44 0.19
Kannad 119526.00 28314.74 615.00 0.64 0.45 0.19
Soegaon 40303.00 7478.75 615.00 0.23 0.16 0.07
Aurangabad
District
Horticulture
Crops 50903.00 50838.00 516.91 0.189 0.132 0.057
Grand Total of District 862931.00 233255.02 605.19 4.712 3.299 1.414

District Irrigation Plan for Aurangabad District of Maharashtra State (India) under PMKSY 2016-2020
Page 48
E) Block wise Total Water Demand
Summation of non-agricultural water demand and agricultural water
demand is considered as total water demand of the district, as shown in table
below,
4.6 Total Demand of the District for Various Sectors
Sr. No. Block
Components Total
(BCM) Domestic Crop Livestock Industrial Power
Generation
1 Aurangabad 0.078 0.494 0.002 0.010 0.000 0.584
2 Paithan 0.017 0.680 0.001 0.001 0.000 0.700
3 Phulambri 0.008 0.383 0.001 0.000 0.000 0.392
4 Gangapur 0.018 0.665 0.001 0.000 0.000 0.684
5 Vaijapur 0.015 0.700 0.001 0.000 0.000 0.717
6 Khultabad 0.006 0.232 0.001 0.000 0.000 0.239
7 Sillod 0.018 0.642 0.001 0.000 0.000 0.661
8 Kannad 0.017 0.661 0.001 0.000 0.000 0.679
9 Soegaon 0.006 0.253 0.001 0.000 0.000 0.260
Total 0.182 4.712 0.010 0.011 0.000 4.916
F) Excess and Deficit of Water / Water Budget
As per water budget there is no excess of water in the district. At present
water demand is 4.916 BCM while available water is 4.815 indicating gap of
0.1 BCM. The estimated water demand of 2020 is 5.648 BCM where in the
deficit of water will rise to the extent of 0.833 BCM.
Among the blocks water deficit is higher in Vaijapur 0.173 BCM,
followed by Sillod (0.139 BCM), Gangapur (0.132 BCM) and Phulambri (0.374
BCM). There is also deficit in Paithan block but which is not seen in figures due
to major project ‘Jayakwadi’ which receives water from adjoining districts.
However in last 5 years Jayakwadi project could not provide irrigation to 10%
of its capacity.
As per projected (estimated) water demand in 2020, the water gap ranging
from 0.01 to 0.45 BCM is seen in 6 blocks, but if the present rainfall situation
contributes then there might be deficit in almost all blocks.
Out of total present water demand 4.916 BCM agricultural demand
is 4.712 BCM which is about 95%, hence we need to take up massive
programme of increasing water use efficiency. Here comes the relevance and

District Irrigation Plan for Aurangabad District of Maharashtra State (India) under PMKSY 2016-2020
Page 49
importance of this district irrigation plan to which envisages focus on improving
both on farm and off farm water use efficiency through ‘har khet ko pani’ and
‘more crop per drop of water’.
4.7 Water Budget
Name of
the Block
Existing Water
Availability
(BCM) Total
(BCM)
Water Demand (BCM ) Water Gap (BCM)
Surface
Water
Ground
Water Present
Projected
2020 Present
Projected
2020
Aurangabad 0.452 0.153 0.605 0.584 0.498 0.022 0.108
Paithan 0.815 0.196 1.011 0.700 0.839 0.312 0.172
Phulambri 0.227 0.046 0.274 0.392 0.374 -0.118 -0.100
Gangapur 0.411 0.139 0.551 0.684 0.789 -0.132 -0.238
Vaijapur 0.368 0.174 0.543 0.717 0.994 -0.173 -0.450
Khultabad 0.197 0.064 0.261 0.239 0.291 0.023 -0.029
Sillod 0.386 0.135 0.521 0.661 0.829 -0.139 -0.307
Kannad 0.568 0.168 0.737 0.679 0.769 0.058 -0.032
Soegaon 0.251 0.056 0.308 0.260 0.266 0.048 0.042
Total 3.679 1.136 4.815 4.916 5.648 -0.100 -0.833
Table 4.7 shows that net ground water available from rainfall recharge as well as recharge from water
impounding structures in Aurangabad district which is calculated by using GEC-1997 norms by
computing assessment of dynamic ground water resources of the Maharashtra 2011-12
(Ref - Ground Water Assessment Report 2011-12)
16. IRRIGATION PLAN
It is intended to formulate a holistic irrigation plan for the district with main
objective as
• To maximize crop yield in order to achieve food security and economic
returns to farmers
• To increase areas under irrigation (Hark het ko pani)
• To increase water use efficiency (more crop per drop)
This holistic irrigation plan takes care of both irrigated and unirrigated -
rainfed areas. Various activities proposed under watershed development
programme to increase recharge of ground water and also to harvest maximum
possible rainwater. A detailed plan of watershed development with activity like
compartment bunding, deep CCT, CNB, MNB, Farm ponds, well recharging,
LBS, ES/GBS are proposed.

District Irrigation Plan for Aurangabad District of Maharashtra State (India) under PMKSY 2016-2020
Page 50
A total budget of Rs.36069.80 lakhs is proposed for watershed activities.
This will increase recharge and also potential of well irrigation.
To realize the surface irrigation potential and minimize water losses in
distribution as well increase access of more area to irrigation, activation like
construction of field channel ground water development in CADA, RRR water
bodies is proposed under MOWR a budget of Rs 464.52 lakh is proposed which
will help in achieving theme of har khet ko pani
With these activities unless water use efficiency is not given right priority
the expected yield potential will not be achieved and dream of prosperity to
farmers may not be achieved. For this a detailed micro-irrigation plan is
prepared. It is prepared to increase area under drip and sprinkler irrigation. Drip
irrigation will be extended to crops like cotton, maize, tur beside all fruit crops
and major vegetable. In the district onion is grown on large scale, so more area
under onion will be brought under drip irrigation, sprinkler will be used to
almost all agronomic crops mainly, wheat and gram. This will help in achieving
more crop per drop of water and a budget of Rs 15317.17 lakhs is proposed
which will help to bring additional area of 54170.53 ha under micro irrigation.
To summarize the plan will need financial outlay as
A. Har khet ko pani
1) Watershed development - Rs- 20,288.11 lakh
2) MOWR activities (irrigation dept) - Rs- 464.52 lakh
------------------------------------------------------------------------------------
Sub Total - Rs- 20,752.63 lakh
------------------------------------------------------------------------------------
B. More crop per drop
1) Micro irrigation - Rs- 15,317.17 lakh
---------------------------------------------------------------------------
Total - Rs- 36,069.80 lakh
This plan will be implemented along with proper crop planning which
with major budgetary and an attempt will be focused to increase more area
under irrigation by way of extension and protective irrigation to Kharif and
Rabbi crops.

District Irrigation Plan for Aurangabad District of Maharashtra State (India) under PMKSY 2016-2020
Page 51
Table No. 21
Area proposed to be covered under Drip / Sprinkler Irrigation during
2015-16
Sr. No.
No. of
block
/Taluka
Crop No. of
beneficiaries
Area
(Ha.)
Total
Cost
Involved
Financial
Outlay
considering
40% subsidy
Total
A. Drip
Irrigation 9
Mango 17 16 7 2.8
Sapota 19 21 6.25 2.50
Guava 25 19 9.27 3.71
Sweet Orange 1382 1299 533.89 213.56
M. Orange 3 4 1.64 0.67
C.apple 9 8 3.27 1.31
Fig 2 1 0.51 0.21
Ber 14 8 4.38 1.75
Pomegranate 673 550.16 304.34 121.74
Papaya 8 6 3.99 1.60
Banana 33 30 25.98 10.39
Vegetables 311 274.98 314.60 125.84
Ginger 1830 1512 1717.26 686.91
Flowers 32 7 6.47 2.59
Sugarcane 943 888 1012.78 405.11
Cotton 5112 4677 4540.58 1816.23
Total Drip Irrigation 10420 9326.14 8492.21 3396.92
B.
Portable
Sprinkler
9 Hort & Non- Hort
Crops 614 468 134.55 53.82
Total Portable Sprinkler Irrigation
System 614 468 134.55 53.82
C. Admn.
Cost @ 1 %
34.51
Grand Total ( A+B+C) 11034 9794.14 8626.76 3485.25

District Irrigation Plan for Aurangabad District of Maharashtra State (India) under PMKSY 2016-2020
Page 52
Table No.22
Micro irrigation potential in the district
Sr.
No. Crop
Average
Sown area
(ha)
Existing area
under micro
irrigation
Area which can be
brought under
micro irrigation
Financial
outlay
(Lakhs)
1 Sorghum 2015 0 1500 172.50
2 Maize 154573 0 120000 13800
3 Tur 21335 0 18000 2880
4 Green Gram 8709 0 1000 115
5 Black Gram 4070 0 1000 115
6 Groundnut 6628 0 2100 241.50
7 Soybean 13934 0 7500 862.5
8 Cotton 393360 27085 140000 54366.52
9 Sugarcane 27010 5417 21593 9850.83
10 R. Sorghum 62214 0 35000 -
11 R. Maize 19283 0 19283 -
12 Wheat 55190 0 55190 5750
13 Gram 54330 0 30000 -
14 Sweet
Orange 20810 1040 19770 3250.25
15 Pomegranate 5300 2558 2742 606.75
16 Vegetable
crops 21700 7312 14300 3926
17 Other Fruit
crops 5942 5833.94 -- -
Total 876403 49245.94 488978 95936.85
In the Aurangabad district to the maximum extent 349500 ha area can be
brought under micro irrigation. And by attaining above area we will be in
position to irrigate 488978 ha crops in Kharif, Rabi and summer seasons. The
projected cost for micro irrigation will be Rs. 95936.85 Lakhs.
District Irrigation Plan for Aurangabad District of Maharashtra State (India) under PMKSY 2016-2020
Page 53
List of maps
1) Location map of a district
2) Geomorphology map of a district
3) Drainage and water body map of a district
4) River & water body map of district
5) Watershed map of a district
6) Rainfall map of a district
7) Land / Land cover map of a district
8) Basin map of a district
9) Soil map of a district
10) Cropping Pattern
11) Geological map of a district

Sr.
No.Name of the District District Code Latitude Longitude
1 Aurangabad 515 19"-20'' N 74''-76'' NE
1.1 District Profile
Source - Census Report - 2011
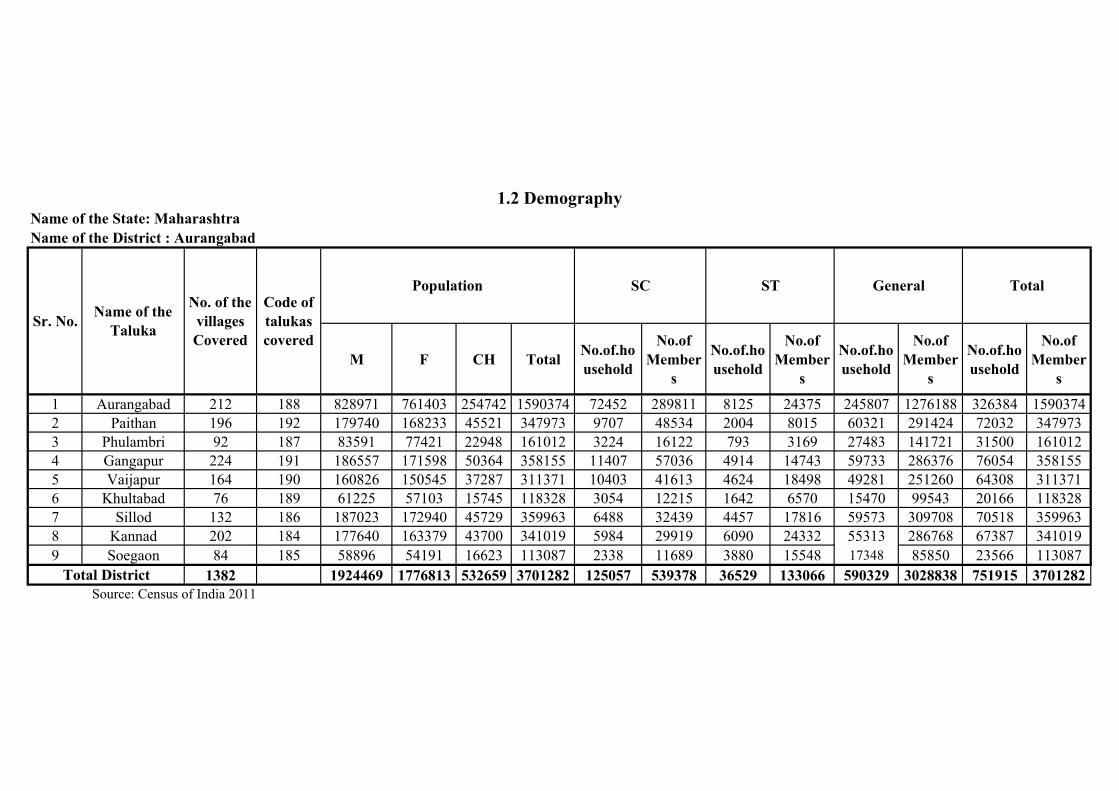
M F CH TotalNo.of.ho
usehold
No.of
Member
s
No.of.ho
usehold
No.of
Member
s
No.of.ho
usehold
No.of
Member
s
No.of.ho
usehold
No.of
Member
s
1 Aurangabad 212 188 828971 761403 254742 1590374 72452 289811 8125 24375 245807 1276188 326384 1590374
2 Paithan 196 192 179740 168233 45521 347973 9707 48534 2004 8015 60321 291424 72032 347973
3 Phulambri 92 187 83591 77421 22948 161012 3224 16122 793 3169 27483 141721 31500 161012
4 Gangapur 224 191 186557 171598 50364 358155 11407 57036 4914 14743 59733 286376 76054 358155
5 Vaijapur 164 190 160826 150545 37287 311371 10403 41613 4624 18498 49281 251260 64308 311371
6 Khultabad 76 189 61225 57103 15745 118328 3054 12215 1642 6570 15470 99543 20166 118328
7 Sillod 132 186 187023 172940 45729 359963 6488 32439 4457 17816 59573 309708 70518 359963
8 Kannad 202 184 177640 163379 43700 341019 5984 29919 6090 24332 55313 286768 67387 341019
9 Soegaon 84 185 58896 54191 16623 113087 2338 11689 3880 15548 17348 85850 23566 113087
1382 1924469 1776813 532659 3701282 125057 539378 36529 133066 590329 3028838 751915 3701282
Source: Census of India 2011
Total District
Name of the
Taluka
No. of the
villages
Covered
Code of
talukas
covered
1.2 Demography
Name of the District : Aurangabad
Sr. No.
Population SC ST General Total
Name of the State: Maharashtra

Poultry
(No.)
Ducks
(No.)
Pigs
(No.)
Goats
(No.)
Sheeps
(No.)
Indigenous
Cow (No)
Hybrid
Cow (No)
Any other
MilchBuffs Bulls
1 Aurangabad 27806 178 1531 49101 15281 17037 19098 15701 0 1443 35114
2 Paithan 29286 5 2383 42004 6937 23530 10886 11030 0 1274 42540
3 Phulambri 16824 0 403 31779 16510 8081 25869 6165 0 757 30373
4 Gangapur 9241 9 3095 21570 5445 21116 9742 5109 0 365 35665
5 Vaijapur 15824 50 1964 27612 12290 18472 15682 4782 0 467 39760
6 Khultabad 18362 1 1892 19440 6768 8632 9069 6139 0 624 14538
7 Sillod 36516 7 2948 48602 11351 12115 14634 12439 0 1681 39331
8 Kannad 31353 0 2416 45041 10888 27634 21448 17068 0 1939 51611
9 soegaon 9204 0 618 17864 2749 13317 239 6032 0 508 17124
194416 250 17250 303013 88219 149934 126667 84465 0 9058 306056
Name of the State: Maharashtra
Name of the District : Aurangabad
Draft Animal
1.3 Biomass and Livestrok
Source: 19 th Livestock Cenuse of India year 2012
Total District
In descriptive
Buffalo (No)
Large AnimalSmall Animal
Sr.
No.
Name of
Taluka

Min Max Mean Min Max Mean Min Max Mean
1 AES-1
Low
Rainfall,
Heavy Soil,
Scarcity
Zone
180691.70
2 AES-2
DPAP
Area with
Medium to
Light Soil
372748.60
3 AES-3
DPAP
Area with
Heavy Soil
189298.09
4 AES-4
Assured
Rainfall,
Medium to
Heavy Soil
84624.45
5 AES-5
Assured
Rainfall,
Light Soil
64590.85
6 AES-6
Assured
Rainfall,
Hilly
Terain,
Light to
Medium
Soil
111445.70
7 AES-7
Heavy Soil
Command
Area
4330.61
1007730.00 675.46 130 92 20 35 55 27 41 39 9 28 15 20 34 26 8.96 6.80 6.15 21.91 552 826 581
Name of the
Taluka
Area of Agro
Ecological
Zone covered
in Taluka (Ha)
Total Area of
Agro
Ecological
Zone
1.4 Agro Ecology, Climate Hydrology and Topography
Name of the state : Maharashtra
Name of the District : Aurangabad
Sr.
No.
Agro
Ecological
Zone Type
Type of
Terrain
District Area
(ha)
Normal
Annual
Rainfall
(mm)
Average
monthly
Rain fall
(mm)
No of
Rainy
Days
(No)
Maximam Rain fall Intensity
(mm)
WinterRainy
Season
Elevation
Upto 15
min
Beyond 15
But up to
30 Min
8.96 6.8 6.15
Average Weekly Temprature ( c) Potential Evapo-Transpiration(PET)
28 15 20 34 26
Beyond 30
But up to
60 Min
Period Period
Cumulative
TotalMin Max Mean
Summer (April-May) Winter (Oct-Mar) Rainy (June-Sept)
Summer
Total / Average
552 826 581
Source: WALMI Aurangabad.
55 27 41 39 9675.46 130 92 20 35 21.91
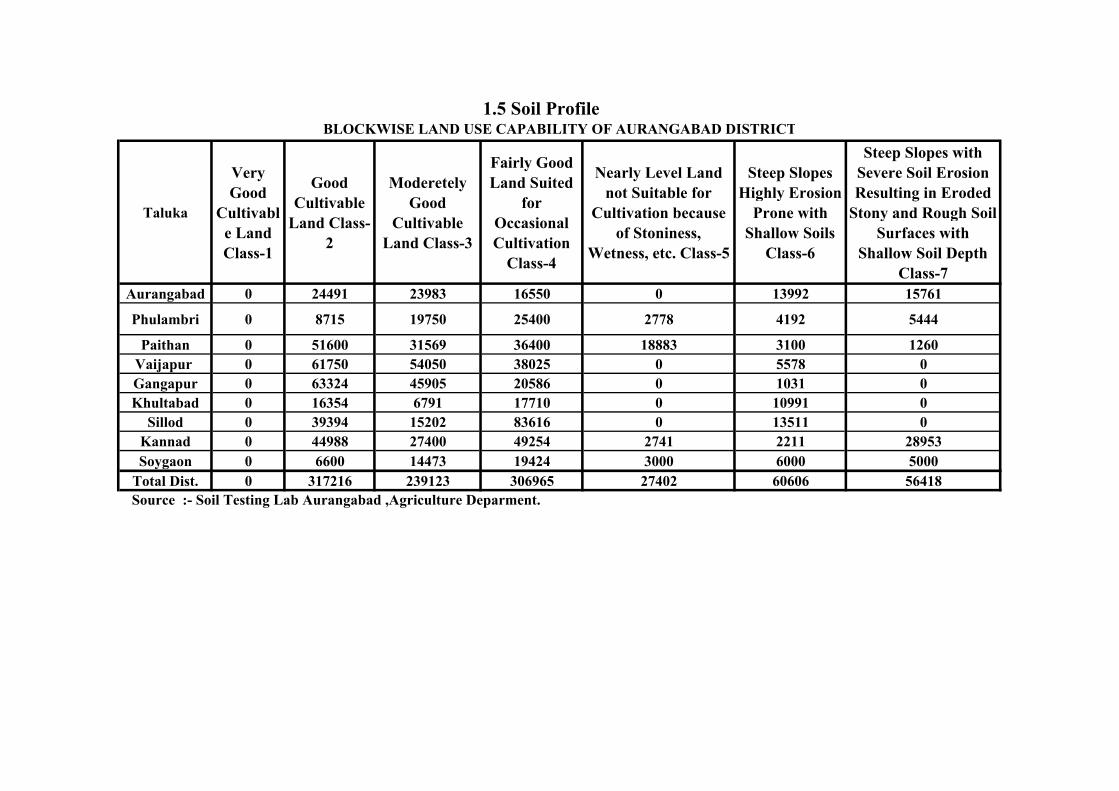
Taluka
Very
Good
Cultivabl
e Land
Class-1
Good
Cultivable
Land Class-
2
Moderetely
Good
Cultivable
Land Class-3
Fairly Good
Land Suited
for
Occasional
Cultivation
Class-4
Nearly Level Land
not Suitable for
Cultivation because
of Stoniness,
Wetness, etc. Class-5
Steep Slopes
Highly Erosion
Prone with
Shallow Soils
Class-6
Steep Slopes with
Severe Soil Erosion
Resulting in Eroded
Stony and Rough Soil
Surfaces with
Shallow Soil Depth
Class-7
Aurangabad 0 24491 23983 16550 0 13992 15761
Phulambri 0 8715 19750 25400 2778 4192 5444
Paithan 0 51600 31569 36400 18883 3100 1260
Vaijapur 0 61750 54050 38025 0 5578 0
Gangapur 0 63324 45905 20586 0 1031 0
Khultabad 0 16354 6791 17710 0 10991 0
Sillod 0 39394 15202 83616 0 13511 0
Kannad 0 44988 27400 49254 2741 2211 28953
Soygaon 0 6600 14473 19424 3000 6000 5000
Total Dist. 0 317216 239123 306965 27402 60606 56418
Source :- Soil Testing Lab Aurangabad ,Agriculture Deparment.
BLOCKWISE LAND USE CAPABILITY OF AURANGABAD DISTRICT
1.5 Soil Profile
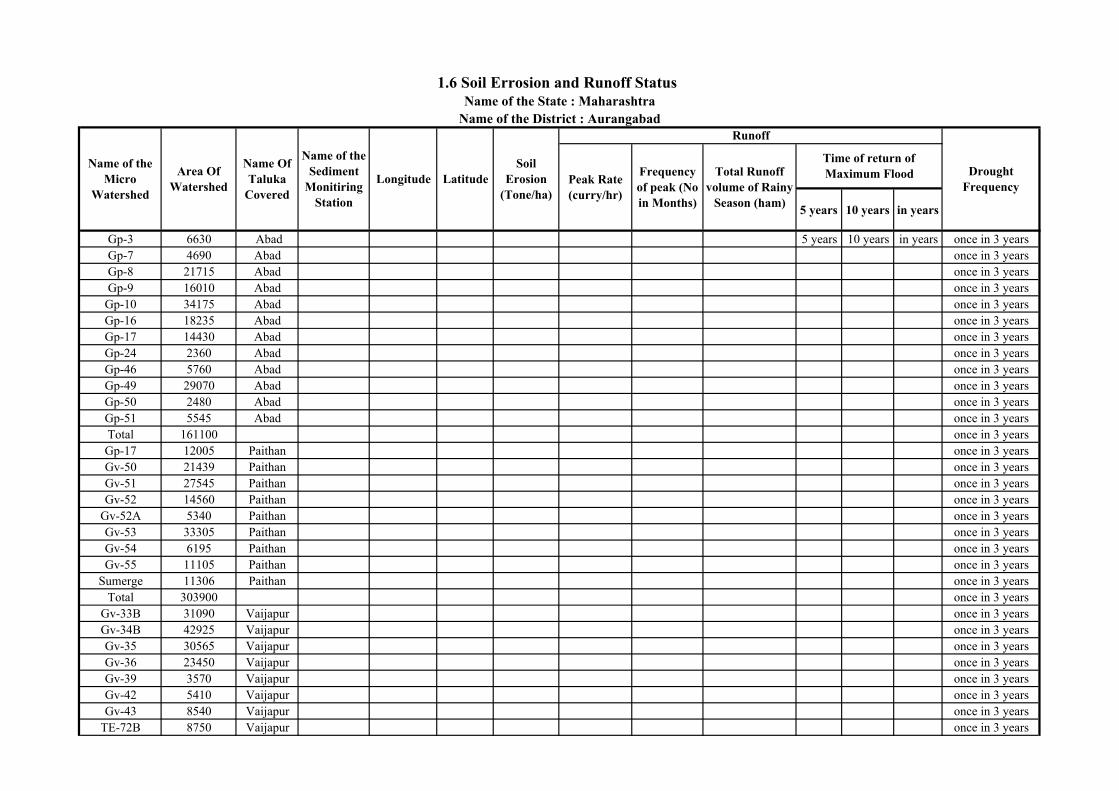
5 years 10 years in years
Gp-3 6630 Abad 5 years 10 years in years once in 3 years
Gp-7 4690 Abad once in 3 years
Gp-8 21715 Abad once in 3 years
Gp-9 16010 Abad once in 3 years
Gp-10 34175 Abad once in 3 years
Gp-16 18235 Abad once in 3 years
Gp-17 14430 Abad once in 3 years
Gp-24 2360 Abad once in 3 years
Gp-46 5760 Abad once in 3 years
Gp-49 29070 Abad once in 3 years
Gp-50 2480 Abad once in 3 years
Gp-51 5545 Abad once in 3 years
Total 161100 once in 3 years
Gp-17 12005 Paithan once in 3 years
Gv-50 21439 Paithan once in 3 years
Gv-51 27545 Paithan once in 3 years
Gv-52 14560 Paithan once in 3 years
Gv-52A 5340 Paithan once in 3 years
Gv-53 33305 Paithan once in 3 years
Gv-54 6195 Paithan once in 3 years
Gv-55 11105 Paithan once in 3 years
Sumerge 11306 Paithan once in 3 years
Total 303900 once in 3 years
Gv-33B 31090 Vaijapur once in 3 years
Gv-34B 42925 Vaijapur once in 3 years
Gv-35 30565 Vaijapur once in 3 years
Gv-36 23450 Vaijapur once in 3 years
Gv-39 3570 Vaijapur once in 3 years
Gv-42 5410 Vaijapur once in 3 years
Gv-43 8540 Vaijapur once in 3 years
TE-72B 8750 Vaijapur once in 3 years
1.6 Soil Errosion and Runoff Status
Name of the State : Maharashtra
Name of the District : Aurangabad
Name of the
Micro
Watershed
Area Of
Watershed
Name Of
Taluka
Covered
Name of the
Sediment
Monitiring
Station
Longitude Latitude
Soil
Erosion
(Tone/ha)
Runoff
Drought
FrequencyPeak Rate
(curry/hr)
Frequency
of peak (No
in Months)
Total Runoff
volume of Rainy
Season (ham)
Time of return of
Maximum Flood

5 years 10 years in years
1.6 Soil Errosion and Runoff Status
Name of the State : Maharashtra
Name of the District : Aurangabad
Name of the
Micro
Watershed
Area Of
Watershed
Name Of
Taluka
Covered
Name of the
Sediment
Monitiring
Station
Longitude Latitude
Soil
Erosion
(Tone/ha)
Runoff
Drought
FrequencyPeak Rate
(curry/hr)
Frequency
of peak (No
in Months)
Total Runoff
volume of Rainy
Season (ham)
Time of return of
Maximum Flood
Total 154300 once in 3 years
Gv-41 37130 Gangapur once in 3 years
Gv-42 14633 Gangapur once in 3 years
Gv-43 11020 Gangapur once in 3 years
Gv-46 26990 Gangapur once in 3 years
Gv-47 19270 Gangapur once in 3 years
Gv-48 12220 Gangapur once in 3 years
Gv-49 2810 Gangapur once in 3 years
submerge 6727 Gangapur once in 3 years
Total 130800 once in 3 years
Gp-3 26355 Khultabad once in 3 years
Gp-7 925 Khultabad once in 3 years
GV-40 16435 Khultabad once in 3 years
Gv-45 5655 Khultabad once in 3 years
Gv-46 2430 Khultabad once in 3 years
Total 51800 once in 3 years
Gp-1 16290 Sillod once in 3 years
Gp-2 7175 Sillod once in 3 years
Gp-4 16585 Sillod once in 3 years
Gp-5 15765 Sillod once in 3 years
Gp-6 15800 Sillod once in 3 years
Gp-7 11845 Sillod once in 3 years
Gp-8 1725 Sillod once in 3 years
Gp-11 6835 Sillod once in 3 years
Gp-12 5125 Sillod once in 3 years
Gp-13 3810 Sillod once in 3 years
Gp-14 8375 Sillod once in 3 years
Gp-15 8450 Sillod once in 3 years
Gp-18A 4015 Sillod once in 3 years
TE-10B 7155 Sillod once in 3 years
TE-13B 3475 Sillod once in 3 years

5 years 10 years in years
1.6 Soil Errosion and Runoff Status
Name of the State : Maharashtra
Name of the District : Aurangabad
Name of the
Micro
Watershed
Area Of
Watershed
Name Of
Taluka
Covered
Name of the
Sediment
Monitiring
Station
Longitude Latitude
Soil
Erosion
(Tone/ha)
Runoff
Drought
FrequencyPeak Rate
(curry/hr)
Frequency
of peak (No
in Months)
Total Runoff
volume of Rainy
Season (ham)
Time of return of
Maximum Flood
TE-15B 14275 Sillod once in 3 years
TE-22B 5000 Sillod once in 3 years
151700 once in 3 years
Gp-1 26775 Kannad once in 3 years
Gp-2 24950 Kannad once in 3 years
Gp-7 5350 Kannad once in 3 years
Gv-38A 18675 Kannad once in 3 years
Gv-39A 28325 Kannad once in 3 years
Gv-40 11600 Kannad once in 3 years
Gv-44 10775 Kannad once in 3 years
Gv-45 8975 Kannad once in 3 years
TE-28B 3600 Kannad once in 3 years
TE-37B 15000 Kannad once in 3 years
TE-52B 1475 Kannad once in 3 years
Total 155500 once in 3 years
TE-36B 2350 Soygaon once in 3 years
TE-37B 5745 Soygaon once in 3 years
TE-28B 14810 Soygaon once in 3 years
TE-13B 3750 Soygaon once in 3 years
TE-15B 10900 Soygaon once in 3 years
TE-10B 2910 Soygaon once in 3 years
TE-22B 11670 Soygaon once in 3 years
TE-6B 10760 Soygaon once in 3 years
TE-5B 1605 Soygaon once in 3 years
Total 64500 once in 3 years
Total Dist-79 1173600
Source -LAND AND WATER RESOURCE DEVELOPMENT PLAN

Area in ha
Gross
Cropped
Area (1)
Net
Sown
Area (2)
Area sown
more than
once (1-2)
Cropping
Intensity (%)
1 Aurangabad 212 94777 101563 62294 39269 163.04 22463 0 10020
2 Paithan 196 142812 126748 98006 28742 129.33 1554 9914 26213
3 Phulambri 92 66268 50721 48694 2027 104.16 4425 4780 3832
4 Gangapur 224 124292 108602 94415 14187 115.03 2219 6762 16422
5 Vaijapur 164 159403 147891 131943 15948 112.09 3057 4223 11855
6 Khultabad 76 51846 48960 37097 11863 131.98 2047 3450 3300
7 Sillod 132 151723 124850 111025 13825 112.45 2827 9223 22111
8 Kannad 202 156417 114450 101660 12790 112.58 30312 3981 12544
9 Soegaon 84 54497 50650 37290 13360 135.83 12511 0 4046
1382 1002035 874435 722424 152011 121.04 81415 42333 110343
Source :- NBSS AND Land use plan 2014
TOTAL
1.7 Land Use Pattern
Name of the State : Maharashtra
Name of the District : Aurangabad
Sr.
No.
Name of the
Taluka
No. of
Villages
Covered
Total
Geographi
cal Area
Area under Agriculture
Area
under
forest
Area under
wasteland
Area under
other uses

Irrigated Rainfed Total Irrigated Rainfed Total Irrigated Rainfed Total Irrigated Rainfed Total Irrigated Rainfed Total Irrigated Rainfed Total Irrigated Rainfed Total
Aurangabad 0 0 0 1005 17718 18723 110 5000 5110 35 1250 1285 6460 39693 46153 170 350 520 12500 63775.3 71791
Paithan 0 0 0 110 10987 11097 725 7976 8701 0 1087 1087 8100 45719 53819 120 480 600 9055 66249 75304
Phulambri 0 0 0 1400 21787 23187 90 1409 1499 35 581 616 2500 27721 30221 40 110 150 4065 51608 55673
Vaijapur 0 0 0 2200 22380 24580 150 2993 3143 300 1611 1911 13300 60666 73966 26 126 152 15976 87776 103752
Gangapur 0 0 0 1900 14476 16376 900 3353 4253 410 1564 1974 7700 51452 59152 600 108 708 11510 70953 82463
Khultabad 0 0 0 900 10880 11780 100 1304 1404 50 856 906 1600 13799 15399 30 40 70 2680 26879 29559
Sillod 0 0 0 4500 38089 42589 400 4554 4954 50 6776 6826 4000 35899 39899 20 30 50 8970 85348 94318
Kannad 0 0 0 3000 40953 43953 700 3468 4168 200 1567 1767 8900 41016 49916 30 50 80 12830 87054 99884
Soygaon 0 0 0 650 7293 7943 200 2481 2681 50 2586 2636 2200 23935 26135 700 900 1600 3800 37195 40995
Total 0 0 0 15665 184563 200228 3375 32538 35913 1130 17878 19008 54760 339900 394660 1736 2194 3930 81386 576837 653739
Irrigated Rainfed Total Irrigated Rainfed Total Irrigated Rainfed Total Irrigated Rainfed Total Irrigated Rainfed Total Irrigated Rainfed Total
Aurangabad 2167 0 2167 953 9520 10473 572 2100 2672 0 0 0 110 60 170 3802 11680 15482
Paithan 2653 0 2653 1800 14794 16594 1200 2085 3285 0 76 76 100 0 100 5753 16955 22708
Phulambri 2600 0 2600 97 1117 1214 870 2820 3690 0 0 0 20 20 40 3587 3957 7544
Vaijapur 1996 0 1996 1100 4727 5827 700 2466 3166 0 44 44 2500 100 2600 6296 7337 13633
Gangapur 2287 0 2287 600 10356 10956 900 3091 3991 0 0 0 1400 150 1550 5187 13597 18784
Khultabad 695 0 695 310 2590 2900 270 964 1234 0 61 61 120 10 130 1395 3625 5020
Sillod 14365 0 14365 300 3099 3399 1000 7332 8332 0 1208 1208 350 70 420 16015 11709 27724
Kannad 8887 0 8887 600 4590 5190 1100 3640 4740 0 0 0 80 10 90 10667 8240 18907
Soygaon 1519 0 1519 300 2377 2677 180 1362 1542 0 24 24 450 150 600 2449 3913 6362
Total 37169 0 37169 6060 53170 59230 6792 25860 32652 0 1413 1413 5130 570 5700 55151 81013 136164
Irrigated Rainfed Total Irrigated Rainfed Total Irrigated Rainfed Total Irrigated Rainfed Total Irrigated Rainfed Total Irrigated Rainfed Total Irrigated Rainfed Total Irrigated Rainfed Total
Aurangabad 0 0 0 10 0 10 0 0 0 30 0 30 930 0 930 35 0 35 4889.95 114.32 5004.27 5894.95 114.32 6009.27
Paithan 0 0 0 5 0 5 4 0 4 20 0 20 5900 0 5900 30 0 30 5346.82 60.03 5406.85 11305.8 60.03 11365.9
Phulambri 0 0 0 10 0 10 2 0 2 12 0 12 360 0 360 10 0 10 842.45 167.11 1009.56 1236.45 167.11 1403.56
Vaijapur 0 0 0 5 0 5 10 0 10 5 0 5 1700 0 1700 40 0 40 3297.19 15.65 3312.84 5057.19 15.65 5072.84
Gangapur 0 0 0 5 0 5 10 0 10 5 0 5 3892 0 3892 20 0 20 2400.61 37.61 2438.22 6332.61 37.61 6370.22
Khultabad 0 0 0 5 0 5 10 0 10 0 0 0 495 0 495 5 0 5 423.6 14.79 438.39 938.6 14.79 953.39
Sillod 0 0 0 5 0 5 2 0 2 10 0 10 310 0 310 10 0 10 406.13 36.63 442.76 743.13 36.63 779.76
Kannad 0 0 0 5 0 5 2 0 2 15 0 15 600 0 600 10 0 10 2569.86 38.27 2608.13 3201.86 38.27 3240.13
Soygaon 0 0 0 5 0 5 2 0 2 12 0 12 0 0 0 10 0 10 683.3 100.21 783.51 712.3 100.21 812.51
Total 0 0 0 55 0 55 42 0 42 109 0 109 14187 0 14187 170 0 170 20859.9 584.62 21444.5 35422.9 584.62 36007.5
Irrigated Rainfed Total Irrigated Rainfed Total Irrigated Rainfed Total Irrigated Rainfed Total Irrigated Rainfed Total Irrigated Rainfed Total Irrigated Rainfed Total Irrigated Rainfed Total Irrigated Rainfed Total
Aurangabad 2167 0 2167 1968 27238 29206 682 7100 7782 65 1250 1315 6460 39693 46153 930 0 930 315 410 725 4889.95 114.32 5004.27 17477 75805.3 93282.3
Paithan 2653 0 2653 1915 25781 27696 1929 10061 11990 20 1163 1183 8100 45719 53819 5900 0 5900 250 480 730 5346.82 60.03 5406.85 26113.8 83264 109378
Phulambri 2600 0 2600 1507 22904 24411 962 4229 5191 47 581 628 2500 27721 30221 360 0 360 70 130 200 842.45 167.11 1009.56 8888.45 55732.1 64620.6
Vaijapur 1996 0 1996 3305 27107 30412 860 5459 6319 305 1655 1960 13300 60666 73966 1700 0 1700 2566 226 2792 3297.19 15.65 3312.84 27329.2 95128.7 122458
Gangapur 2287 0 2287 2505 24832 27337 1810 6444 8254 415 1564 1979 7700 51452 59152 3892 0 3892 2020 258 2278 2400.61 37.61 2438.22 23029.6 84587.6 107617
Khultabad 695 0 695 1215 13470 14685 380 2268 2648 50 917 967 1600 13799 15399 495 0 495 155 50 205 423.6 14.79 438.39 5013.6 30518.8 35532.4
Sillod 14365 0 14365 4805 41188 45993 1402 11886 13288 60 7984 8044 4000 35899 39899 310 0 310 380 100 480 406.13 36.63 442.76 25728.1 97093.6 122822
Kannad 8887 0 8887 3605 45543 49148 1802 7108 8910 215 1567 1782 8900 41016 49916 600 0 600 120 60 180 2569.86 38.27 2608.13 26698.9 95332.3 122031
Soygaon 1519 0 1519 955 9670 10625 382 3843 4225 62 2610 2672 2200 23935 26135 0 0 0 1160 1050 2210 683.3 100.21 783.51 6961.3 41208.2 48169.5
Total 37169 0 37169 21780 237733 259513 10209 58398 68607 1239 19291 20530 54760 339900 394660 14187 0 14187 7036 2764 9800 20859.9 584.62 21444.5 167240 658671 825911
Taluka
Name
2.1 D) Total Season
Cereals Coarse Cereals Pulses Oil Seeds Cotton Sugarcane Vegetables Fruit Cop Total
TotalTaluka
Name
2.1 C ) Summer Season
Cereals Coarse Cereals Pulses Oil Seeds Sugarcane Vegetables Fruit Cop TotalTaluka
Name
Source :- Department of Agriculture, Agriculture Statistic of Aurangabad Dist.
2.1 A) KHARIF SEASON
Cereals Coarse Cereals Pulses Oil Seeds Cotton Vegetables TotalTaluka
Name
2.1 B) Rabbi SEASON
Cereals Coarse Cereals Pulses Oil Seeds Vegetables
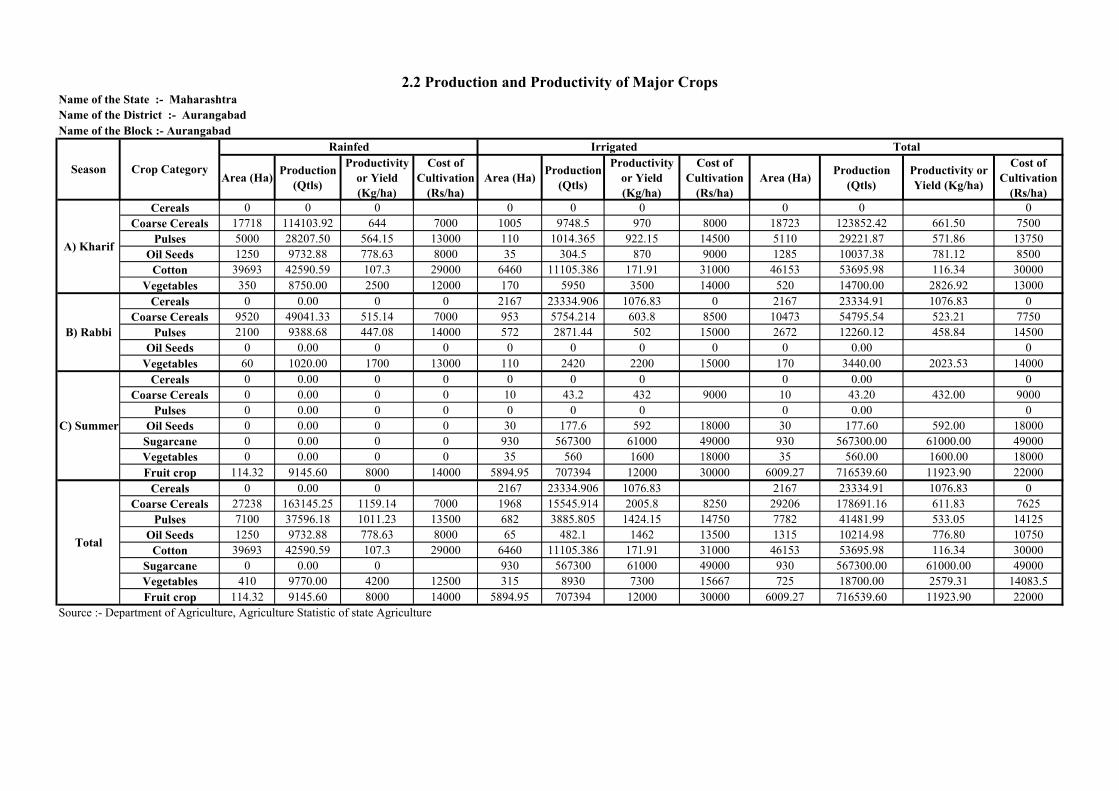
Area (Ha)Production
(Qtls)
Productivity
or Yield
(Kg/ha)
Cost of
Cultivation
(Rs/ha)
Area (Ha)Production
(Qtls)
Productivity
or Yield
(Kg/ha)
Cost of
Cultivation
(Rs/ha)
Area (Ha)Production
(Qtls)
Productivity or
Yield (Kg/ha)
Cost of
Cultivation
(Rs/ha)
Cereals 0 0 0 0 0 0 0 0 0
Coarse Cereals 17718 114103.92 644 7000 1005 9748.5 970 8000 18723 123852.42 661.50 7500
Pulses 5000 28207.50 564.15 13000 110 1014.365 922.15 14500 5110 29221.87 571.86 13750
Oil Seeds 1250 9732.88 778.63 8000 35 304.5 870 9000 1285 10037.38 781.12 8500
Cotton 39693 42590.59 107.3 29000 6460 11105.386 171.91 31000 46153 53695.98 116.34 30000
Vegetables 350 8750.00 2500 12000 170 5950 3500 14000 520 14700.00 2826.92 13000
Cereals 0 0.00 0 0 2167 23334.906 1076.83 0 2167 23334.91 1076.83 0
Coarse Cereals 9520 49041.33 515.14 7000 953 5754.214 603.8 8500 10473 54795.54 523.21 7750
Pulses 2100 9388.68 447.08 14000 572 2871.44 502 15000 2672 12260.12 458.84 14500
Oil Seeds 0 0.00 0 0 0 0 0 0 0 0.00 0
Vegetables 60 1020.00 1700 13000 110 2420 2200 15000 170 3440.00 2023.53 14000
Cereals 0 0.00 0 0 0 0 0 0 0.00 0
Coarse Cereals 0 0.00 0 0 10 43.2 432 9000 10 43.20 432.00 9000
Pulses 0 0.00 0 0 0 0 0 0 0.00 0
Oil Seeds 0 0.00 0 0 30 177.6 592 18000 30 177.60 592.00 18000
Sugarcane 0 0.00 0 0 930 567300 61000 49000 930 567300.00 61000.00 49000
Vegetables 0 0.00 0 0 35 560 1600 18000 35 560.00 1600.00 18000
Fruit crop 114.32 9145.60 8000 14000 5894.95 707394 12000 30000 6009.27 716539.60 11923.90 22000
Cereals 0 0.00 0 2167 23334.906 1076.83 2167 23334.91 1076.83 0
Coarse Cereals 27238 163145.25 1159.14 7000 1968 15545.914 2005.8 8250 29206 178691.16 611.83 7625
Pulses 7100 37596.18 1011.23 13500 682 3885.805 1424.15 14750 7782 41481.99 533.05 14125
Oil Seeds 1250 9732.88 778.63 8000 65 482.1 1462 13500 1315 10214.98 776.80 10750
Cotton 39693 42590.59 107.3 29000 6460 11105.386 171.91 31000 46153 53695.98 116.34 30000
Sugarcane 0 0.00 0 930 567300 61000 49000 930 567300.00 61000.00 49000
Vegetables 410 9770.00 4200 12500 315 8930 7300 15667 725 18700.00 2579.31 14083.5
Fruit crop 114.32 9145.60 8000 14000 5894.95 707394 12000 30000 6009.27 716539.60 11923.90 22000
Source :- Department of Agriculture, Agriculture Statistic of state Agriculture
Name of the State :- Maharashtra
Name of the District :- Aurangabad
Name of the Block :- Aurangabad
2.2 Production and Productivity of Major Crops
A) Kharif
B) Rabbi
C) Summer
Total
Season Crop Category
Rainfed Irrigated Total
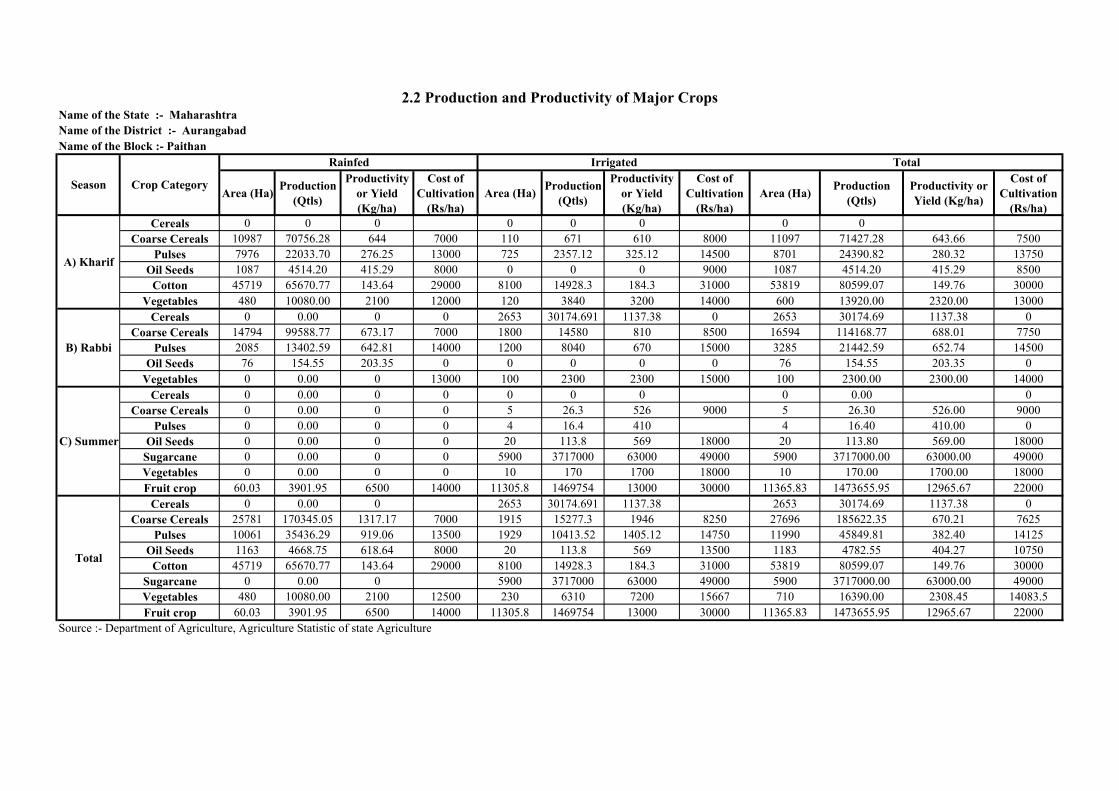
Area (Ha)Production
(Qtls)
Productivity
or Yield
(Kg/ha)
Cost of
Cultivation
(Rs/ha)
Area (Ha)Production
(Qtls)
Productivity
or Yield
(Kg/ha)
Cost of
Cultivation
(Rs/ha)
Area (Ha)Production
(Qtls)
Productivity or
Yield (Kg/ha)
Cost of
Cultivation
(Rs/ha)
Cereals 0 0 0 0 0 0 0 0
Coarse Cereals 10987 70756.28 644 7000 110 671 610 8000 11097 71427.28 643.66 7500
Pulses 7976 22033.70 276.25 13000 725 2357.12 325.12 14500 8701 24390.82 280.32 13750
Oil Seeds 1087 4514.20 415.29 8000 0 0 0 9000 1087 4514.20 415.29 8500
Cotton 45719 65670.77 143.64 29000 8100 14928.3 184.3 31000 53819 80599.07 149.76 30000
Vegetables 480 10080.00 2100 12000 120 3840 3200 14000 600 13920.00 2320.00 13000
Cereals 0 0.00 0 0 2653 30174.691 1137.38 0 2653 30174.69 1137.38 0
Coarse Cereals 14794 99588.77 673.17 7000 1800 14580 810 8500 16594 114168.77 688.01 7750
Pulses 2085 13402.59 642.81 14000 1200 8040 670 15000 3285 21442.59 652.74 14500
Oil Seeds 76 154.55 203.35 0 0 0 0 0 76 154.55 203.35 0
Vegetables 0 0.00 0 13000 100 2300 2300 15000 100 2300.00 2300.00 14000
Cereals 0 0.00 0 0 0 0 0 0 0.00 0
Coarse Cereals 0 0.00 0 0 5 26.3 526 9000 5 26.30 526.00 9000
Pulses 0 0.00 0 0 4 16.4 410 4 16.40 410.00 0
Oil Seeds 0 0.00 0 0 20 113.8 569 18000 20 113.80 569.00 18000
Sugarcane 0 0.00 0 0 5900 3717000 63000 49000 5900 3717000.00 63000.00 49000
Vegetables 0 0.00 0 0 10 170 1700 18000 10 170.00 1700.00 18000
Fruit crop 60.03 3901.95 6500 14000 11305.8 1469754 13000 30000 11365.83 1473655.95 12965.67 22000
Cereals 0 0.00 0 2653 30174.691 1137.38 2653 30174.69 1137.38 0
Coarse Cereals 25781 170345.05 1317.17 7000 1915 15277.3 1946 8250 27696 185622.35 670.21 7625
Pulses 10061 35436.29 919.06 13500 1929 10413.52 1405.12 14750 11990 45849.81 382.40 14125
Oil Seeds 1163 4668.75 618.64 8000 20 113.8 569 13500 1183 4782.55 404.27 10750
Cotton 45719 65670.77 143.64 29000 8100 14928.3 184.3 31000 53819 80599.07 149.76 30000
Sugarcane 0 0.00 0 5900 3717000 63000 49000 5900 3717000.00 63000.00 49000
Vegetables 480 10080.00 2100 12500 230 6310 7200 15667 710 16390.00 2308.45 14083.5
Fruit crop 60.03 3901.95 6500 14000 11305.8 1469754 13000 30000 11365.83 1473655.95 12965.67 22000
Source :- Department of Agriculture, Agriculture Statistic of state Agriculture
Season Crop Category
Rainfed Irrigated Total
B) Rabbi
C) Summer
Total
Name of the State :- Maharashtra
Name of the District :- Aurangabad
2.2 Production and Productivity of Major Crops
Name of the Block :- Paithan
A) Kharif

Area (Ha)Production
(Qtls)
Productivity
or Yield
(Kg/ha)
Cost of
Cultivation
(Rs/ha)
Area (Ha)Production
(Qtls)
Productivity
or Yield
(Kg/ha)
Cost of
Cultivation
(Rs/ha)
Area (Ha)Production
(Qtls)
Productivity or
Yield (Kg/ha)
Cost of
Cultivation
(Rs/ha)
Cereals 0 0 0 0 0 0 0 0
Coarse Cereals 21787 299937.27 1376.68 7000 1400 22680 1620 8000 23187 322617.27 1391.37 7500
Pulses 1409 8048.63 571.23 13000 90 571.5 635 14500 1499 8620.13 575.06 13750
Oil Seeds 581 2792.40 480.62 8000 35 184.1 526 9000 616 2976.50 483.20 8500
Cotton 27721 46005.77 165.96 29000 2500 6631.75 265.27 31000 30221 52637.52 174.18 30000
Vegetables 110 2310.00 2100 12000 40 1360 3400 14000 150 3670.00 2446.67 13000
Cereals 0 0.00 0 0 2600 36963.16 1421.66 0 2600 36963.16 1421.66 0
Coarse Cereals 1117 2758.65 246.97 7000 97 721.486 743.8 8500 1214 3480.14 286.67 7750
Pulses 2820 6850.06 242.91 14000 870 2653.5 305 15000 3690 9503.56 257.55 14500
Oil Seeds 0 0.00 0 0 0 0 0 0 0 0.00 0
Vegetables 20 300.00 1500 13000 20 420 2100 15000 40 720.00 1800.00 14000
Cereals 0 0.00 0 0 0 0 0 0 0.00 0
Coarse Cereals 0 0.00 0 0 10 43.2 432 9000 10 43.20 432.00 9000
Pulses 0 0.00 0 0 2 4.5 225 2 4.50 225.00 0
Oil Seeds 0 0.00 0 0 12 72.6 605 18000 12 72.60 605.00 18000
Sugarcane 0 0.00 0 0 360 208800 58000 49000 360 208800.00 58000.00 49000
Vegetables 0 0.00 0 0 10 170 1700 18000 10 170.00 1700.00 18000
Fruit crop 167.11 10026.60 6000 14000 1009.56 111051.6 11000 30000 1176.67 121078.20 10289.90 22000
Cereals 0 0.00 0 2600 36963.16 1421.66 2600 36963.16 1421.66 0
Coarse Cereals 22904 302695.93 1623.65 7000 1507 23444.686 2795.8 8250 24411 326140.61 1336.04 7625
Pulses 4229 14898.69 814.14 13500 962 3229.5 1165 14750 5191 18128.19 349.22 14125
Oil Seeds 581 2792.40 480.62 8000 47 256.7 1131 13500 628 3049.10 485.53 10750
Cotton 27721 46005.77 165.96 29000 2500 6631.75 265.27 31000 30221 52637.52 174.18 30000
Sugarcane 0 0.00 0 360 208800 58000 49000 360 208800.00 58000.00 49000
Vegetables 130 2610.00 3600 12500 70 1950 7200 15667 200 4560.00 2280.00 14083.5
Fruit crop 167.11 10026.60 6000 14000 1009.56 111051.6 11000 30000 1176.67 121078.20 10289.90 22000
Source :- Department of Agriculture, Agriculture Statistic of state Agriculture
C) Summer
Total
2.2 Production and Productivity of Major Crops
Season Crop Category
Rainfed Irrigated Total
Name of the State :- Maharashtra
Name of the District :- Aurangabad
Name of the Block :- Phulambri
A) Kharif
B) Rabbi

Area (Ha)Production
(Qtls)
Productivity
or Yield
(Kg/ha)
Cost of
Cultivation
(Rs/ha)
Area (Ha)Production
(Qtls)
Productivity
or Yield
(Kg/ha)
Cost of
Cultivation
(Rs/ha)
Area (Ha)Production
(Qtls)
Productivity or
Yield (Kg/ha)
Cost of
Cultivation
(Rs/ha)
Cereals 0 0 0 0 0 0 0 0
Coarse Cereals 22380 263667.73 1178.14 7000 2200 31570 1435 8000 24580 295237.732 1201.13 7500
Pulses 2993 4842.67 161.8 13000 150 352.5 235 14500 3143 5195.174 165.29 13750
Oil Seeds 1611 7248.69 449.95 8000 300 1596 532 9000 1911 8844.6945 462.83 8500
Cotton 60666 56722.71 93.5 29000 13300 21804.02 163.94 31000 73966 78526.73 106.17 30000
Vegetables 126 2835.00 2250 12000 26 845 3250 14000 152 3680 2421.05 13000
Cereals 0 0.00 0 0 1996 20354.809 1019.78 0 1996 20354.8088 1019.78 0
Coarse Cereals 4727 14631.01 309.52 7000 1100 5011.16 455.56 8500 5827 19642.1704 337.09 7750
Pulses 2466 9309.15 377.5 14000 700 2849 407 15000 3166 12158.15 384.02 14500
Oil Seeds 44 63.29 143.83 0 0 0 0 0 44 63.2852 143.83 0
Vegetables 100 1700.00 1700 13000 2500 575000 23000 15000 2600 576700 22180.77 14000
Cereals 0 0.00 0 0 0 0 0 0 0 0
Coarse Cereals 0 0.00 0 0 5 31.5 630 9000 5 31.5 630.00 9000
Pulses 0 0.00 0 0 10 31 310 10 31 310.00 0
Oil Seeds 0 0.00 0 0 5 27 540 18000 5 27 540.00 18000
Sugarcane 0 0.00 0 0 1700 1003000 59000 49000 1700 1003000 59000.00 49000
Vegetables 0 0.00 0 0 40 760 1900 18000 40 760 1900.00 18000
Fruit crop 15.65 939.00 6000 14000 3297.19 362690.9 11000 30000 3312.84 363629.9 10976.38 22000
Cereals 0 0.00 0 1996 20354.809 1019.78 1996 20354.8088 1019.78 0
Coarse Cereals 27107 278298.74 1487.66 7000 3305 36612.66 2520.56 8250 30412 314911.4024 1035.48 7625
Pulses 5459 14151.82 539.3 13500 860 3232.5 952 14750 6319 17384.324 275.11 14125
Oil Seeds 1655 7311.98 593.78 8000 305 1623 1072 13500 1960 8934.9797 455.87 10750
Cotton 60666 56722.71 93.5 29000 13300 21804.02 163.94 31000 73966 78526.73 106.17 30000
Sugarcane 0 0.00 0 1700 1003000 59000 49000 1700 1003000 59000.00 49000
Vegetables 226 4535.00 3950 12500 2566 576605 28150 15667 2792 581140 20814.47 14083.5
Fruit crop 15.65 939.00 6000 14000 3297.19 362690.9 11000 30000 3312.84 363629.9 10976.38 22000
Source :- Department of Agriculture, Agriculture Statistic of state Agriculture
2.2 Production and Productivity of Major CropsName of the State :- Maharashtra
Name of the District :- Aurangabad
Name of the Block :- Vaijapur
Season Crop Category
Rainfed Irrigated Total
A) Kharif
B) Rabbi
C) Summer
Total
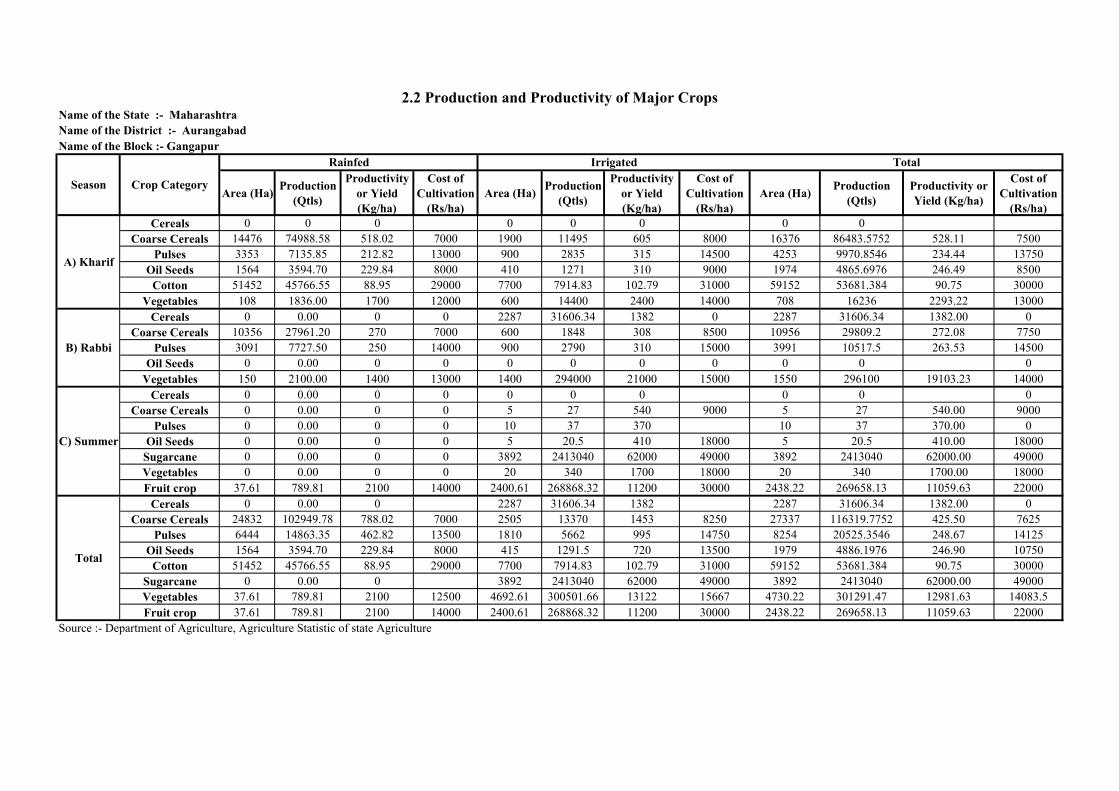
Area (Ha)Production
(Qtls)
Productivity
or Yield
(Kg/ha)
Cost of
Cultivation
(Rs/ha)
Area (Ha)Production
(Qtls)
Productivity
or Yield
(Kg/ha)
Cost of
Cultivation
(Rs/ha)
Area (Ha)Production
(Qtls)
Productivity or
Yield (Kg/ha)
Cost of
Cultivation
(Rs/ha)
Cereals 0 0 0 0 0 0 0 0
Coarse Cereals 14476 74988.58 518.02 7000 1900 11495 605 8000 16376 86483.5752 528.11 7500
Pulses 3353 7135.85 212.82 13000 900 2835 315 14500 4253 9970.8546 234.44 13750
Oil Seeds 1564 3594.70 229.84 8000 410 1271 310 9000 1974 4865.6976 246.49 8500
Cotton 51452 45766.55 88.95 29000 7700 7914.83 102.79 31000 59152 53681.384 90.75 30000
Vegetables 108 1836.00 1700 12000 600 14400 2400 14000 708 16236 2293.22 13000
Cereals 0 0.00 0 0 2287 31606.34 1382 0 2287 31606.34 1382.00 0
Coarse Cereals 10356 27961.20 270 7000 600 1848 308 8500 10956 29809.2 272.08 7750
Pulses 3091 7727.50 250 14000 900 2790 310 15000 3991 10517.5 263.53 14500
Oil Seeds 0 0.00 0 0 0 0 0 0 0 0 0
Vegetables 150 2100.00 1400 13000 1400 294000 21000 15000 1550 296100 19103.23 14000
Cereals 0 0.00 0 0 0 0 0 0 0 0
Coarse Cereals 0 0.00 0 0 5 27 540 9000 5 27 540.00 9000
Pulses 0 0.00 0 0 10 37 370 10 37 370.00 0
Oil Seeds 0 0.00 0 0 5 20.5 410 18000 5 20.5 410.00 18000
Sugarcane 0 0.00 0 0 3892 2413040 62000 49000 3892 2413040 62000.00 49000
Vegetables 0 0.00 0 0 20 340 1700 18000 20 340 1700.00 18000
Fruit crop 37.61 789.81 2100 14000 2400.61 268868.32 11200 30000 2438.22 269658.13 11059.63 22000
Cereals 0 0.00 0 2287 31606.34 1382 2287 31606.34 1382.00 0
Coarse Cereals 24832 102949.78 788.02 7000 2505 13370 1453 8250 27337 116319.7752 425.50 7625
Pulses 6444 14863.35 462.82 13500 1810 5662 995 14750 8254 20525.3546 248.67 14125
Oil Seeds 1564 3594.70 229.84 8000 415 1291.5 720 13500 1979 4886.1976 246.90 10750
Cotton 51452 45766.55 88.95 29000 7700 7914.83 102.79 31000 59152 53681.384 90.75 30000
Sugarcane 0 0.00 0 3892 2413040 62000 49000 3892 2413040 62000.00 49000
Vegetables 37.61 789.81 2100 12500 4692.61 300501.66 13122 15667 4730.22 301291.47 12981.63 14083.5
Fruit crop 37.61 789.81 2100 14000 2400.61 268868.32 11200 30000 2438.22 269658.13 11059.63 22000
Source :- Department of Agriculture, Agriculture Statistic of state Agriculture
Name of the District :- Aurangabad
Name of the Block :- Gangapur
A) Kharif
B) Rabbi
C) Summer
Total
Season Crop Category
Rainfed Irrigated Total
2.2 Production and Productivity of Major CropsName of the State :- Maharashtra
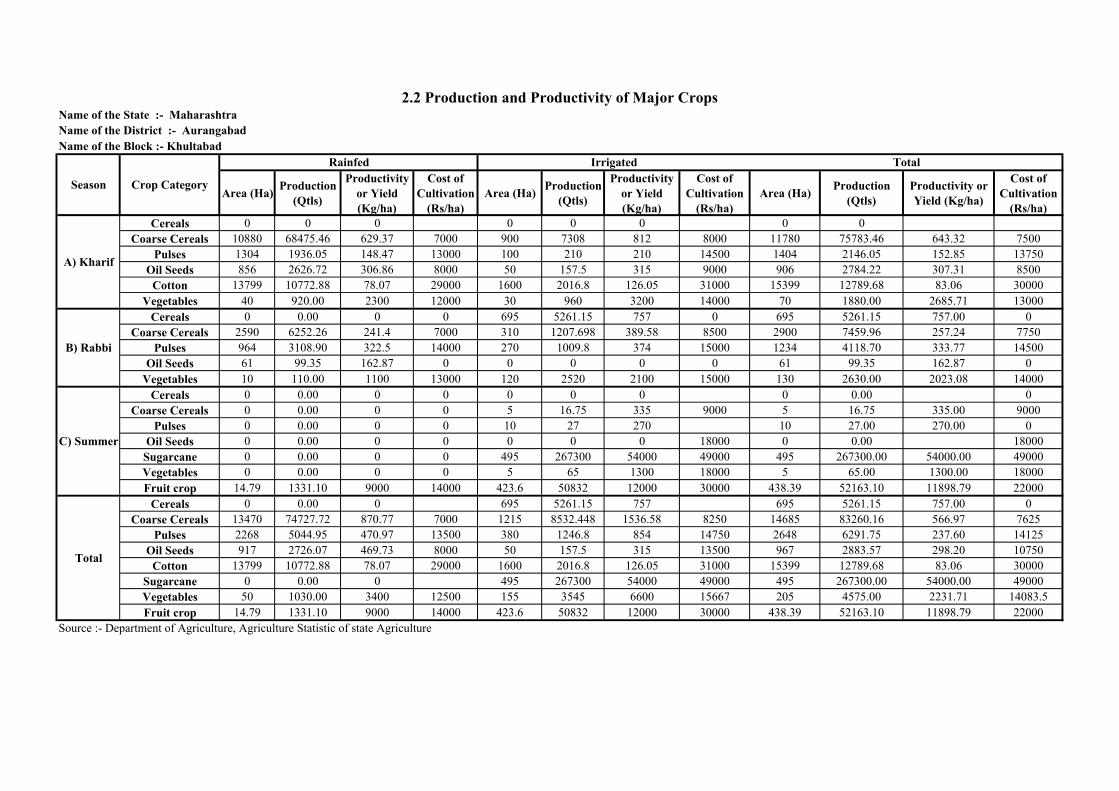
Area (Ha)Production
(Qtls)
Productivity
or Yield
(Kg/ha)
Cost of
Cultivation
(Rs/ha)
Area (Ha)Production
(Qtls)
Productivity
or Yield
(Kg/ha)
Cost of
Cultivation
(Rs/ha)
Area (Ha)Production
(Qtls)
Productivity or
Yield (Kg/ha)
Cost of
Cultivation
(Rs/ha)
Cereals 0 0 0 0 0 0 0 0
Coarse Cereals 10880 68475.46 629.37 7000 900 7308 812 8000 11780 75783.46 643.32 7500
Pulses 1304 1936.05 148.47 13000 100 210 210 14500 1404 2146.05 152.85 13750
Oil Seeds 856 2626.72 306.86 8000 50 157.5 315 9000 906 2784.22 307.31 8500
Cotton 13799 10772.88 78.07 29000 1600 2016.8 126.05 31000 15399 12789.68 83.06 30000
Vegetables 40 920.00 2300 12000 30 960 3200 14000 70 1880.00 2685.71 13000
Cereals 0 0.00 0 0 695 5261.15 757 0 695 5261.15 757.00 0
Coarse Cereals 2590 6252.26 241.4 7000 310 1207.698 389.58 8500 2900 7459.96 257.24 7750
Pulses 964 3108.90 322.5 14000 270 1009.8 374 15000 1234 4118.70 333.77 14500
Oil Seeds 61 99.35 162.87 0 0 0 0 0 61 99.35 162.87 0
Vegetables 10 110.00 1100 13000 120 2520 2100 15000 130 2630.00 2023.08 14000
Cereals 0 0.00 0 0 0 0 0 0 0.00 0
Coarse Cereals 0 0.00 0 0 5 16.75 335 9000 5 16.75 335.00 9000
Pulses 0 0.00 0 0 10 27 270 10 27.00 270.00 0
Oil Seeds 0 0.00 0 0 0 0 0 18000 0 0.00 18000
Sugarcane 0 0.00 0 0 495 267300 54000 49000 495 267300.00 54000.00 49000
Vegetables 0 0.00 0 0 5 65 1300 18000 5 65.00 1300.00 18000
Fruit crop 14.79 1331.10 9000 14000 423.6 50832 12000 30000 438.39 52163.10 11898.79 22000
Cereals 0 0.00 0 695 5261.15 757 695 5261.15 757.00 0
Coarse Cereals 13470 74727.72 870.77 7000 1215 8532.448 1536.58 8250 14685 83260.16 566.97 7625
Pulses 2268 5044.95 470.97 13500 380 1246.8 854 14750 2648 6291.75 237.60 14125
Oil Seeds 917 2726.07 469.73 8000 50 157.5 315 13500 967 2883.57 298.20 10750
Cotton 13799 10772.88 78.07 29000 1600 2016.8 126.05 31000 15399 12789.68 83.06 30000
Sugarcane 0 0.00 0 495 267300 54000 49000 495 267300.00 54000.00 49000
Vegetables 50 1030.00 3400 12500 155 3545 6600 15667 205 4575.00 2231.71 14083.5
Fruit crop 14.79 1331.10 9000 14000 423.6 50832 12000 30000 438.39 52163.10 11898.79 22000
Source :- Department of Agriculture, Agriculture Statistic of state Agriculture
C) Summer
Total
2.2 Production and Productivity of Major CropsName of the State :- Maharashtra
Name of the District :- Aurangabad
Name of the Block :- Khultabad
A) Kharif
B) Rabbi
Season Crop Category
Rainfed Irrigated Total

Area (Ha)Production
(Qtls)
Productivity
or Yield
(Kg/ha)
Cost of
Cultivation
(Rs/ha)
Area (Ha)Production
(Qtls)
Productivity
or Yield
(Kg/ha)
Cost of
Cultivation
(Rs/ha)
Area (Ha)Production
(Qtls)
Productivity or
Yield (Kg/ha)
Cost of
Cultivation
(Rs/ha)
Cereals 0 0 0 0 0 0 0 0
Coarse Cereals 38089 525171.13 1378.8 7000 4500 70650 1570 8000 42589 595821.13 1399.00 7500
Pulses 4554 9865.33 216.63 13000 400 1484 371 14500 4954 11349.33 229.09 13750
Oil Seeds 6776 26334.92 388.65 8000 50 207.5 415 9000 6826 26542.42 388.84 8500
Cotton 35899 33705.57 93.89 29000 4000 6566 164.15 31000 39899 40271.57 100.93 30000
Vegetables 30 720.00 2400 12000 20 640 3200 14000 50 1360.00 2720.00 13000
Cereals 0 0.00 0 0 14365 171108.7 1191.15 0 14365 171108.70 1191.15 0
Coarse Cereals 3099 73966.62 2386.79 7000 300 6675 2225 8500 3399 80641.62 2372.51 7750
Pulses 7332 41120.06 560.83 14000 1000 5820 582 15000 8332 46940.06 563.37 14500
Oil Seeds 1208 4004.88 331.53 0 0 0 0 0 1208 4004.88 331.53 0
Vegetables 70 910.00 1300 13000 350 6300 1800 15000 420 7210.00 1716.67 14000
Cereals 0 0.00 0 0 0 0 0 0 0.00 0
Coarse Cereals 0 0.00 0 0 5 20.5 410 9000 5 20.50 410.00 9000
Pulses 0 0.00 0 0 2 8.96 448 2 8.96 448.00 0
Oil Seeds 0 0.00 0 0 10 53.2 532 18000 10 53.20 532.00 18000
Sugarcane 0 0.00 0 0 310 145700 47000 49000 310 145700.00 47000.00 49000
Vegetables 0 0.00 0 0 10 120 1200 18000 10 120.00 1200.00 18000
Fruit crop 36.63 2380.95 6500 14000 406.13 51172.38 12600 30000 442.76 53553.33 12095.34 22000
Cereals 0 0.00 0 14365 171108.7 1191.15 14365 171108.70 1191.15 0
Coarse Cereals 41188 599137.75 3765.59 7000 4805 77345.5 4205 8250 45993 676483.25 1470.84 7625
Pulses 11886 50985.39 777.46 13500 1402 7312.96 1401 14750 13288 58298.35 438.73 14125
Oil Seeds 7984 30339.81 720.18 8000 60 260.7 947 13500 8044 30600.51 380.41 10750
Cotton 35899 33705.57 93.89 29000 4000 6566 164.15 31000 39899 40271.57 100.93 30000
Sugarcane 0 0.00 0 310 145700 47000 49000 310 145700.00 47000.00 49000
Vegetables 100 1630.00 3700 12500 380 7060 6200 15667 480 8690.00 1810.42 14083.5
Fruit crop 36.63 2380.95 6500 14000 406.13 51172.38 12600 30000 442.76 53553.33 12095.34 22000
Source :- Department of Agriculture, Agriculture Statistic of state Agriculture
A) Kharif
B) Rabbi
C) Summer
Total
2.2 Production and Productivity of Major CropsName of the State :- Maharashtra
Name of the District :- Aurangabad
Name of the Block :- Sillod
Season Crop Category
Rainfed Irrigated Total

Area (Ha)Production
(Qtls)
Productivity
or Yield
(Kg/ha)
Cost of
Cultivation
(Rs/ha)
Area (Ha)Production
(Qtls)
Productivity
or Yield
(Kg/ha)
Cost of
Cultivation
(Rs/ha)
Area (Ha)Production
(Qtls)
Productivity or
Yield (Kg/ha)
Cost of
Cultivation
(Rs/ha)
Cereals 0 0 0 0 0 0 0 0
Coarse Cereals 40953 247949.94 605.45 7000 3000 24600 820 8000 43953 272549.94 620.09 7500
Pulses 3468 4651.28 134.12 13000 700 1645 235 14500 4168 6296.28 151.06 13750
Oil Seeds 1567 5494.84 350.66 8000 200 844.4 422.2 9000 1767 6339.24 358.76 8500
Cotton 41016 21250.39 51.81 29000 8900 9837.17 110.53 31000 49916 31087.56 62.28 30000
Vegetables 50 950.00 1900 12000 30 990 3300 14000 80 1940.00 2425.00 13000
Cereals 0 0.00 0 0 8887 79190.28 891.08 0 8887 79190.28 891.08 0
Coarse Cereals 4590 48546.14 1057.65 7000 600 6696 1116 8500 5190 55242.14 1064.40 7750
Pulses 3640 16091.71 442.08 14000 1100 5249.2 477.2 15000 4740 21340.91 450.23 14500
Oil Seeds 0 0.00 0 0 0 0 0 0 0 0.00 0
Vegetables 10 120.00 1200 13000 80 1680 2100 15000 90 1800.00 2000.00 14000
Cereals 0 0.00 0 0 0 0 0 0 0.00 0
Coarse Cereals 0 0.00 0 0 5 23 460 9000 5 23.00 460.00 9000
Pulses 0 0.00 0 0 2 5.8 290 2 5.80 290.00 0
Oil Seeds 0 0.00 0 0 15 69.3 462 18000 15 69.30 462.00 18000
Sugarcane 0 0.00 0 0 600 318000 53000 49000 600 318000.00 53000.00 49000
Vegetables 0 0.00 0 0 10 140 1400 18000 10 140.00 1400.00 18000
Fruit crop 38.27 2870.25 7500 14000 2569.86 295533.9 11500 30000 2608.13 298404.15 11441.31 22000
Cereals 0 0.00 0 8887 79190.28 891.08 8887 79190.28 891.08 0
Coarse Cereals 45543 296496.07 1663.1 7000 3605 31319 2396 8250 49148 327815.07 667.00 7625
Pulses 7108 20742.99 576.2 13500 1802 6900 1002.2 14750 8910 27642.99 310.25 14125
Oil Seeds 1567 5494.84 350.66 8000 215 913.7 884.2 13500 1782 6408.54 359.63 10750
Cotton 41016 21250.39 51.81 29000 8900 9837.17 110.53 31000 49916 31087.56 62.28 30000
Sugarcane 0 0.00 0 600 318000 53000 49000 600 318000.00 53000.00 49000
Vegetables 60 1070.00 3100 12500 120 2810 6800 15667 180 3880.00 2155.56 14083.5
Fruit crop 38.27 2870.25 7500 14000 2569.86 295533.9 11500 30000 2608.13 298404.15 11441.31 22000
Source :- Department of Agriculture, Agriculture Statistic of state Agriculture
Name of the District :- Aurangabad
Name of the Block :- Kannad
A) Kharif
B) Rabbi
C) Summer
Total
Season Crop Category
Rainfed Irrigated Total
2.2 Production and Productivity of Major CropsName of the State :- Maharashtra

Area (Ha)Production
(Qtls)
Productivity
or Yield
(Kg/ha)
Cost of
Cultivation
(Rs/ha)
Area (Ha)Production
(Qtls)
Productivity
or Yield
(Kg/ha)
Cost of
Cultivation
(Rs/ha)
Area (Ha)Production
(Qtls)
Productivity or
Yield (Kg/ha)
Cost of
Cultivation
(Rs/ha)
Cereals 0 0 0 0 0 0 0 0
Coarse Cereals 7293 44436.25 609.3 7000 650 5427.5 835 8000 7943 49863.75 627.77 7500
Pulses 2481 4716.13 190.09 13000 200 420 210 14500 2681 5136.13 191.58 13750
Oil Seeds 2586 9937.74 384.29 8000 50 145 290 9000 2636 10082.74 382.50 8500
Cotton 23935 13982.83 58.42 29000 2200 1332.98 60.59 31000 26135 15315.81 58.60 30000
Vegetables 900 14400.00 1600 12000 700 22400 3200 14000 1600 36800.00 2300.00 13000
Cereals 0 0.00 0 0 1519 19743.81 1299.79 0 1519 19743.81 1299.79 0
Coarse Cereals 2377 32826.37 1381 7000 300 4554.99 1518.33 8500 2677 37381.36 1396.39 7750
Pulses 1362 9843.17 722.7 14000 180 1335.6 742 15000 1542 11178.77 724.95 14500
Oil Seeds 24 50.26 209.42 0 0 0 0 0 24 50.26 209.42 0
Vegetables 150 2400.00 1600 13000 450 40500 9000 15000 600 42900.00 7150.00 14000
Cereals 0 0.00 0 0 0 0 0 0 0.00 0
Coarse Cereals 0 0.00 0 0 5 18.75 375 9000 5 18.75 375.00 9000
Pulses 0 0.00 0 0 2 6.8 340 2 6.80 340.00 0
Oil Seeds 0 0.00 0 0 12 46.8 390 18000 12 46.80 390.00 18000
Sugarcane 0 0.00 0 0 0 0 0 49000 0 0.00 49000
Vegetables 0 0.00 0 0 10 140 1400 18000 10 140.00 1400.00 18000
Fruit crop 100.21 8517.85 8500 14000 683.3 85412.5 12500 30000 783.51 93930.35 11988.40 22000
Cereals 0 0.00 0 1519 19743.81 1299.79 1519 19743.81 1299.79 0
Coarse Cereals 9670 77262.62 1990.3 7000 955 10001.24 2728.33 8250 10625 87263.86 821.31 7625
Pulses 3843 14559.31 912.79 13500 382 1762.4 1292 14750 4225 16321.71 386.31 14125
Oil Seeds 2610 9988.00 593.71 8000 62 191.8 680 13500 2672 10179.80 380.98 10750
Cotton 23935 13982.83 58.42 29000 2200 1332.98 60.59 31000 26135 15315.81 58.60 30000
Sugarcane 0 0.00 0 0 0 0 49000 0 0.00 49000
Vegetables 1050 16800.00 3200 12500 1160 63040 13600 15667 2210 79840.00 3612.67 14083.5
Fruit crop 100.21 8517.85 8500 14000 683.3 85412.5 12500 30000 783.51 93930.35 11988.40 22000
Source :- Department of Agriculture, Agriculture Statistic of state Agriculture
C) Summer
Total
2.2 Production and Productivity of Major CropsName of the State :- Maharashtra
Name of the District :- Aurangabad
Name of the Block :- Soygaon
A) Kharif
B) Rabbi
Season Crop Category
Rainfed Irrigated Total
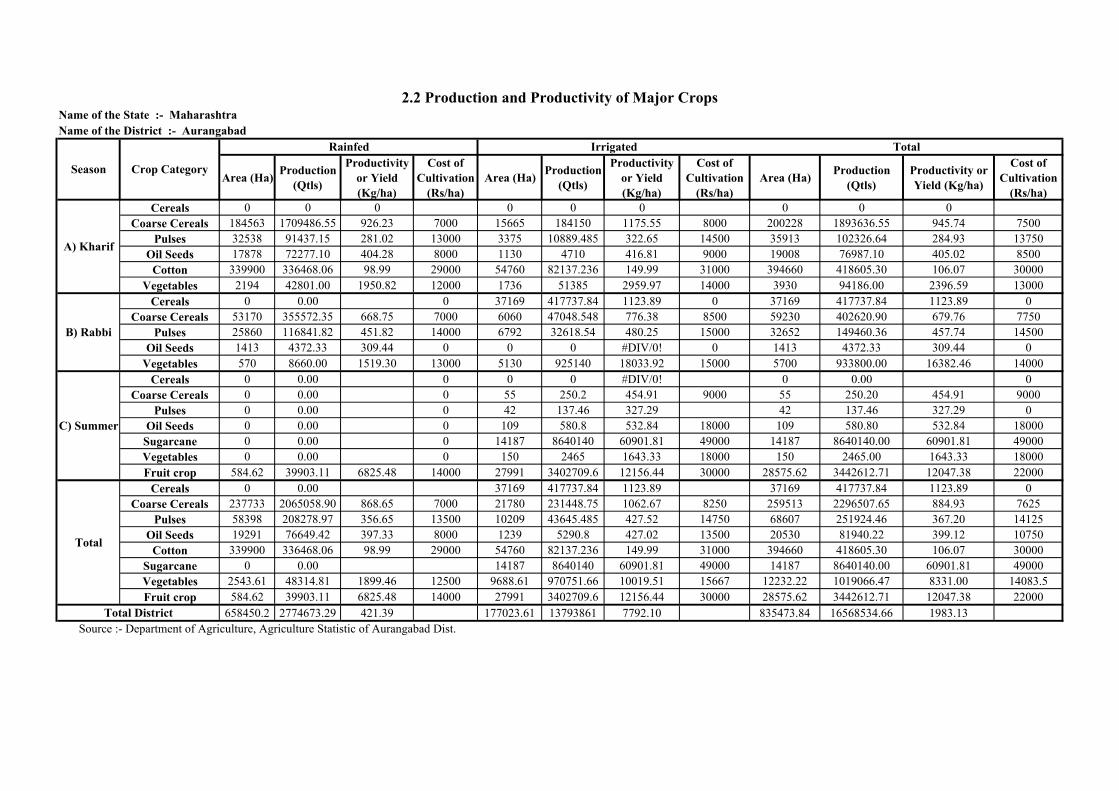
Area (Ha)Production
(Qtls)
Productivity
or Yield
(Kg/ha)
Cost of
Cultivation
(Rs/ha)
Area (Ha)Production
(Qtls)
Productivity
or Yield
(Kg/ha)
Cost of
Cultivation
(Rs/ha)
Area (Ha)Production
(Qtls)
Productivity or
Yield (Kg/ha)
Cost of
Cultivation
(Rs/ha)
Cereals 0 0 0 0 0 0 0 0 0
Coarse Cereals 184563 1709486.55 926.23 7000 15665 184150 1175.55 8000 200228 1893636.55 945.74 7500
Pulses 32538 91437.15 281.02 13000 3375 10889.485 322.65 14500 35913 102326.64 284.93 13750
Oil Seeds 17878 72277.10 404.28 8000 1130 4710 416.81 9000 19008 76987.10 405.02 8500
Cotton 339900 336468.06 98.99 29000 54760 82137.236 149.99 31000 394660 418605.30 106.07 30000
Vegetables 2194 42801.00 1950.82 12000 1736 51385 2959.97 14000 3930 94186.00 2396.59 13000
Cereals 0 0.00 0 37169 417737.84 1123.89 0 37169 417737.84 1123.89 0
Coarse Cereals 53170 355572.35 668.75 7000 6060 47048.548 776.38 8500 59230 402620.90 679.76 7750
Pulses 25860 116841.82 451.82 14000 6792 32618.54 480.25 15000 32652 149460.36 457.74 14500
Oil Seeds 1413 4372.33 309.44 0 0 0 #DIV/0! 0 1413 4372.33 309.44 0
Vegetables 570 8660.00 1519.30 13000 5130 925140 18033.92 15000 5700 933800.00 16382.46 14000
Cereals 0 0.00 0 0 0 #DIV/0! 0 0.00 0
Coarse Cereals 0 0.00 0 55 250.2 454.91 9000 55 250.20 454.91 9000
Pulses 0 0.00 0 42 137.46 327.29 42 137.46 327.29 0
Oil Seeds 0 0.00 0 109 580.8 532.84 18000 109 580.80 532.84 18000
Sugarcane 0 0.00 0 14187 8640140 60901.81 49000 14187 8640140.00 60901.81 49000
Vegetables 0 0.00 0 150 2465 1643.33 18000 150 2465.00 1643.33 18000
Fruit crop 584.62 39903.11 6825.48 14000 27991 3402709.6 12156.44 30000 28575.62 3442612.71 12047.38 22000
Cereals 0 0.00 37169 417737.84 1123.89 37169 417737.84 1123.89 0
Coarse Cereals 237733 2065058.90 868.65 7000 21780 231448.75 1062.67 8250 259513 2296507.65 884.93 7625
Pulses 58398 208278.97 356.65 13500 10209 43645.485 427.52 14750 68607 251924.46 367.20 14125
Oil Seeds 19291 76649.42 397.33 8000 1239 5290.8 427.02 13500 20530 81940.22 399.12 10750
Cotton 339900 336468.06 98.99 29000 54760 82137.236 149.99 31000 394660 418605.30 106.07 30000
Sugarcane 0 0.00 14187 8640140 60901.81 49000 14187 8640140.00 60901.81 49000
Vegetables 2543.61 48314.81 1899.46 12500 9688.61 970751.66 10019.51 15667 12232.22 1019066.47 8331.00 14083.5
Fruit crop 584.62 39903.11 6825.48 14000 27991 3402709.6 12156.44 30000 28575.62 3442612.71 12047.38 22000
658450.2 2774673.29 421.39 177023.61 13793861 7792.10 835473.84 16568534.66 1983.13
A) Kharif
B) Rabbi
C) Summer
Total
Total District
2.2 Production and Productivity of Major CropsName of the State :- Maharashtra
Name of the District :- Aurangabad
Season Crop Category
Rainfed Irrigated Total
Source :- Department of Agriculture, Agriculture Statistic of Aurangabad Dist.
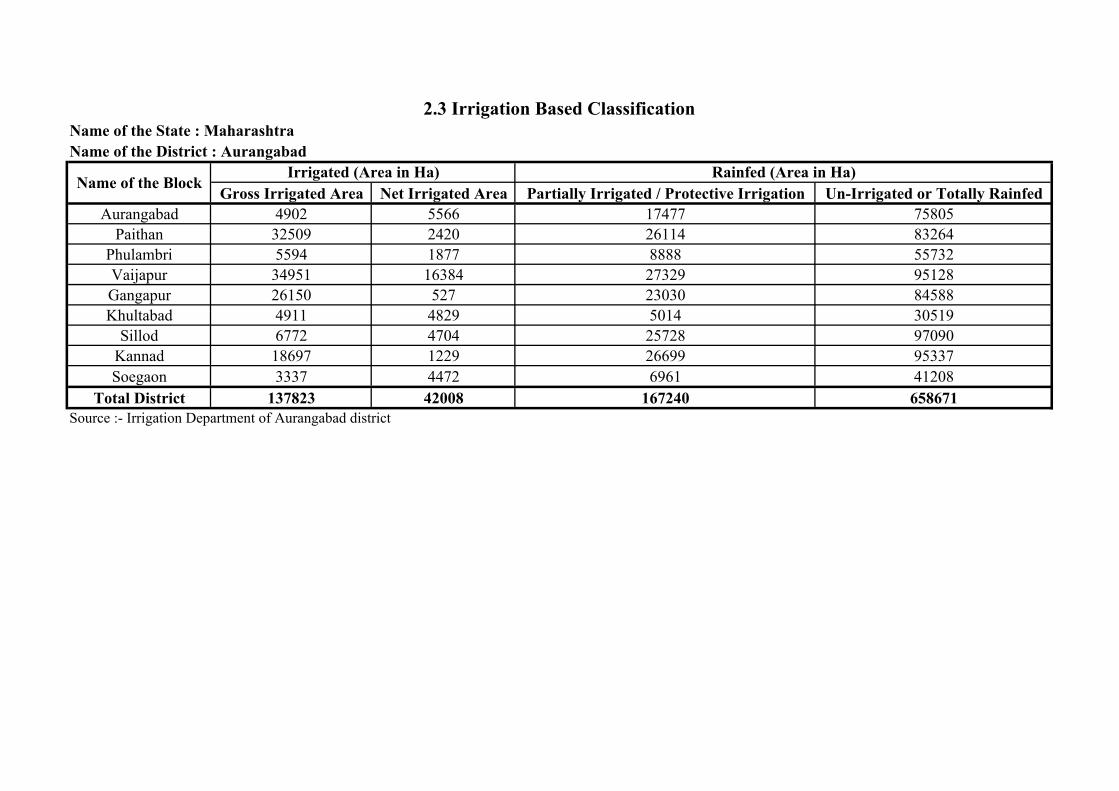
Gross Irrigated Area Net Irrigated Area Partially Irrigated / Protective Irrigation Un-Irrigated or Totally Rainfed
Aurangabad 4902 5566 17477 75805
Paithan 32509 2420 26114 83264
Phulambri 5594 1877 8888 55732
Vaijapur 34951 16384 27329 95128
Gangapur 26150 527 23030 84588
Khultabad 4911 4829 5014 30519
Sillod 6772 4704 25728 97090
Kannad 18697 1229 26699 95337
Soegaon 3337 4472 6961 41208
Total District 137823 42008 167240 658671
Source :- Irrigation Department of Aurangabad district
2.3 Irrigation Based Classification
Name of the State : Maharashtra
Name of the District : Aurangabad
Irrigated (Area in Ha) Rainfed (Area in Ha)Name of the Block

Sr. No. Sources Kharif Rabi Summer Total
1
i) Canal (Major & Medium Irrigation) 0.598 1.555 0.239 2.393
ii) Minor Irrigation tanks 0.046 0.120 0.018 0.185
iii) Lift Irrigation/Diversion 0.005 0.012 0.002 0.019
iv) Various Water Bodies Includung Rain Water Harvesting 0.271 0.703 0.108 1.082
0.920 2.391 0.368 3.679
2
i) Open Well 0.247 0.642 0.099 0.987
ii) Bore Well 0.038 0.098 0.015 0.150
0.284 0.739 0.114 1.137
1.204 3.130 0.482 4.816
3.1 Status of Water Availabilityin BCM
Source : CWC, District Irrigation and Agriculture office records year 2015
Sub Total
Sub Total
Grand Total
Surface Irrigation
Ground water

Critical Semi-Critical Safe Draft Recharge Gap
Aurangabad √ 0.1023 0.16158 0.05928
Paithan √ 0.13791 0.20636 0.06845
Phulambri √ 0.04065 0.04938 0.00873
Vaijapur √ 0.13671 0.18399 0.04728
Gangapur √ 0.11039 0.14727 0.03688
Khultabad √ 0.04216 0.06827 0.02611
Sillod √ 0.98055 0.14214 -0.83841
Kannad √ 0.11368 0.17777 0.06409
Soegaon √ 0.03567 0.05999 0.02432
Total District 1.70002 1.19675 -0.50327
Table 3.2 shows that ground water recharge from rainfall which is computed in ground water assesment carried out by
Ground Water Survey & Development Agency (GSDA). This table also shows draft means ground water withdrawal from
aquifer by water abstracting structures like well and tube well.
(Ref - Ground Water Assessment report 2011-12)
3.2 Status of Ground water Avalability
Name of the state : Maharashtra
Name of the District : Aurangabad
Name of the
Bolock
Source : CGWB
Ground water (BCM)Status of Block as per Central Ground Water
Board Notification

Total
Area
Developed
Area
Undeveloped
Area
Total
Area
Developed
Area
Undeveloped
Area
Developed
Command
Undeveloped
Command
1 2 3 4 5 6 7 8 4+7 5+8
1 Aurangabad 7509 3286 4223 0 0 0 3286 4223
2 Paithan 31763 987 30776 0 0 0 987 30776
3 Phulambri 4832 1569 3263 0 0 0 1569 3263
4 Vaijapur 29927 3428 26499 0 0 0 3428 26499
5 Gangapur 24814 7505 17309 0 0 0 7505 17309
6 Khultabad 4497 4415 82 0 0 0 4415 82
7 Sillod 4769 3058 1711 0 0 0 3058 1711
8 Kannad 17317 6827 10490 0 0 0 6827 10490
9 Soegaon 1387 1387 0 0 0 0 1387 0
126815 32462 94353 0 0 0 32462 94353
Source : Irrigation Department. of Aurangabad district
Information of Canal Command Information on the Other Services
Command
3.3 Status of Command Area Name of the state : Maharashtra
Name of the District : Aurangabad
Total AreaSr.
No.
Name of the
Block
Total District
Area in Ha.
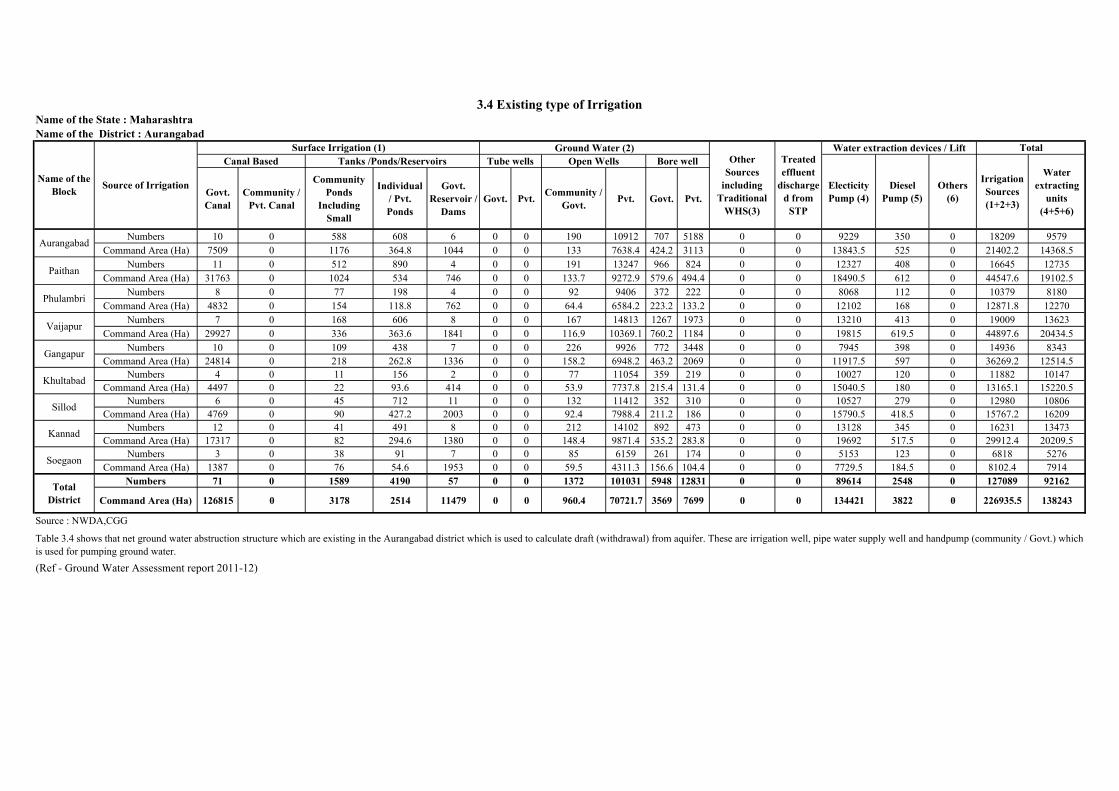
Govt.
Canal
Community /
Pvt. Canal
Community
Ponds
Including
Small
Individual
/ Pvt.
Ponds
Govt.
Reservoir /
Dams
Govt. Pvt.Community /
Govt.Pvt. Govt. Pvt.
Numbers 10 0 588 608 6 0 0 190 10912 707 5188 0 0 9229 350 0 18209 9579
Command Area (Ha) 7509 0 1176 364.8 1044 0 0 133 7638.4 424.2 3113 0 0 13843.5 525 0 21402.2 14368.5
Numbers 11 0 512 890 4 0 0 191 13247 966 824 0 0 12327 408 0 16645 12735
Command Area (Ha) 31763 0 1024 534 746 0 0 133.7 9272.9 579.6 494.4 0 0 18490.5 612 0 44547.6 19102.5
Numbers 8 0 77 198 4 0 0 92 9406 372 222 0 0 8068 112 0 10379 8180
Command Area (Ha) 4832 0 154 118.8 762 0 0 64.4 6584.2 223.2 133.2 0 0 12102 168 0 12871.8 12270
Numbers 7 0 168 606 8 0 0 167 14813 1267 1973 0 0 13210 413 0 19009 13623
Command Area (Ha) 29927 0 336 363.6 1841 0 0 116.9 10369.1 760.2 1184 0 0 19815 619.5 0 44897.6 20434.5
Numbers 10 0 109 438 7 0 0 226 9926 772 3448 0 0 7945 398 0 14936 8343
Command Area (Ha) 24814 0 218 262.8 1336 0 0 158.2 6948.2 463.2 2069 0 0 11917.5 597 0 36269.2 12514.5
Numbers 4 0 11 156 2 0 0 77 11054 359 219 0 0 10027 120 0 11882 10147
Command Area (Ha) 4497 0 22 93.6 414 0 0 53.9 7737.8 215.4 131.4 0 0 15040.5 180 0 13165.1 15220.5
Numbers 6 0 45 712 11 0 0 132 11412 352 310 0 0 10527 279 0 12980 10806
Command Area (Ha) 4769 0 90 427.2 2003 0 0 92.4 7988.4 211.2 186 0 0 15790.5 418.5 0 15767.2 16209
Numbers 12 0 41 491 8 0 0 212 14102 892 473 0 0 13128 345 0 16231 13473
Command Area (Ha) 17317 0 82 294.6 1380 0 0 148.4 9871.4 535.2 283.8 0 0 19692 517.5 0 29912.4 20209.5
Numbers 3 0 38 91 7 0 0 85 6159 261 174 0 0 5153 123 0 6818 5276
Command Area (Ha) 1387 0 76 54.6 1953 0 0 59.5 4311.3 156.6 104.4 0 0 7729.5 184.5 0 8102.4 7914
Numbers 71 0 1589 4190 57 0 0 1372 101031 5948 12831 0 0 89614 2548 0 127089 92162
Command Area (Ha) 126815 0 3178 2514 11479 0 0 960.4 70721.7 3569 7699 0 0 134421 3822 0 226935.5 138243
Source : NWDA,CGG
Sillod
Kannad
Soegaon
Total
District
Gangapur
Khultabad
Diesel
Pump (5)
Tanks /Ponds/Reservoirs Tube wells Open Wells Bore well
Source of Irrigation
Ground Water (2)Surface Irrigation (1)
Canal Based
Aurangabad
Paithan
Table 3.4 shows that net ground water abstruction structure which are existing in the Aurangabad district which is used to calculate draft (withdrawal) from aquifer. These are irrigation well, pipe water supply well and handpump (community / Govt.) which
is used for pumping ground water.
(Ref - Ground Water Assessment report 2011-12)
3.4 Existing type of IrrigationName of the State : Maharashtra
Name of the District : Aurangabad
Name of the
BlockOthers
(6)
Irrigation
Sources
(1+2+3)
Water
extracting
units
(4+5+6)
Other
Sources
including
Traditional
WHS(3)
Treated
effluent
discharge
d from
STP
Water extraction devices / Lift Total
Electicity
Pump (4)
Phulambri
Vaijapur
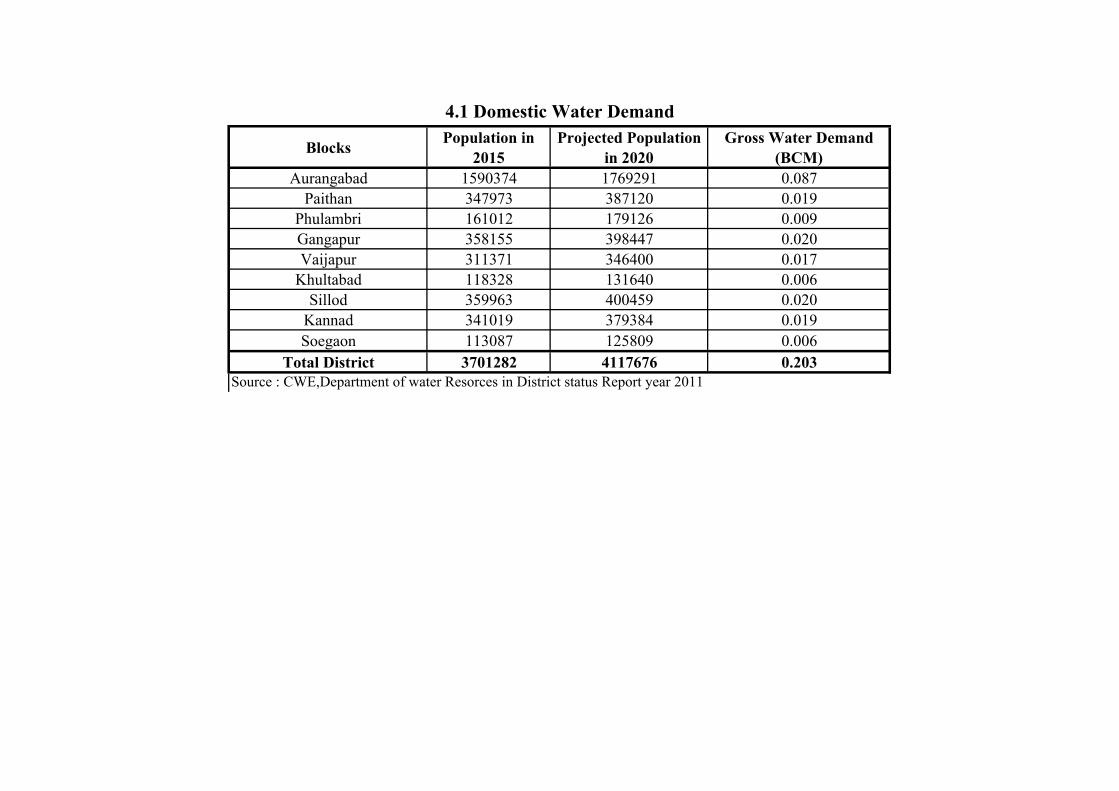
BlocksPopulation in
2015
Projected Population
in 2020
Gross Water Demand
(BCM)
Aurangabad 1590374 1769291 0.087
Paithan 347973 387120 0.019
Phulambri 161012 179126 0.009
Gangapur 358155 398447 0.020
Vaijapur 311371 346400 0.017
Khultabad 118328 131640 0.006
Sillod 359963 400459 0.020
Kannad 341019 379384 0.019
Soegaon 113087 125809 0.006
Total District 3701282 4117676 0.203
4.1 Domestic Water Demand
Source : CWE,Department of water Resorces in District status Report year 2011

Block CropWater
Required / haArea Sown (ha)
Irrigated Area
(ha)
Crop Water
Demand
(mm)
Water Potential
Required
(BCM)
Existing
Water
Potential
(BCM)
Water
Potential to
be Created
(BCM)
Aurangabad 6500000 46153.00 9230.60 650.00 0.300 0.20999615 0.090
Paithan 6500000 53819.00 10763.80 650.00 0.350 0.24487645 0.105
Phulambri 6500000 30221.00 6044.20 650.00 0.196 0.13750555 0.059
Vaijapur 6500000 73966.00 14793.20 650.00 0.481 0.3365453 0.144
Gangapur 6500000 59152.00 11830.40 650.00 0.384 0.2691416 0.115
Khultabad 6500000 15399.00 3079.80 650.00 0.100 0.07006545 0.030
Sillod 6500000 39899.00 7979.80 650.00 0.259 0.18154045 0.078
Kannad 6500000 49916.00 9983.20 650.00 0.324 0.2271178 0.097
Soegaon 6500000 26135.00 5227.00 650.00 0.170 0.11891425 0.051
394660.00 78932.00 650.00 2.565 1.796 0.770
Aurangabad 4500000 10951.00 1971.18 450.00 0.049 0.03449565 0.015
Paithan 4500000 2746.00 494.28 450.00 0.012 0.0086499 0.004
Phulambri 4500000 20438.00 3678.84 450.00 0.092 0.0643797 0.028
Vaijapur 4500000 18732.00 3371.76 450.00 0.084 0.0590058 0.025
Gangapur 4500000 13208.00 2377.44 450.00 0.059 0.0416052 0.018
Khultabad 4500000 9600.00 1728.00 450.00 0.043 0.03024 0.013
Sillod 4500000 40429.00 7277.22 450.00 0.182 0.12735135 0.055
Kannad 4500000 38823.00 6988.14 450.00 0.175 0.12229245 0.052
Soegaon 4500000 5646.00 1016.28 450.00 0.025 0.0177849 0.008
160573.00 28903.14 450.00 0.723 0.506 0.217
Aurangabad 4000000 3504.00 210.24 400.00 0.014 0.0098112 0.004
Paithan 4000000 7138.00 428.28 400.00 0.029 0.0199864 0.009
Phulambri 4000000 802.00 48.12 400.00 0.003 0.0022456 0.001
Vaijapur 4000000 1599.00 95.94 400.00 0.006 0.0044772 0.002
4.2 Crop Water Requirement
Total District
Cotton
Maize
Total District
Vaijapur 4000000 1599.00 95.94 400.00 0.006 0.0044772 0.002
Gangapur 4000000 3031.00 181.86 400.00 0.012 0.0084868 0.004
Khultabad 4000000 902.00 54.12 400.00 0.004 0.0025256 0.001
Sillod 4000000 1771.00 106.26 400.00 0.007 0.0049588 0.002
Kannad 4000000 2368.00 142.08 400.00 0.009 0.0066304 0.003
Soegaon 4000000 1230.00 73.80 400.00 0.005 0.003444 0.001
22345.00 1340.70 400.00 0.089 0.063 0.027
Aurangabad 3500000 7569.00 227.07 350.00 0.026 0.01854405 0.008
Paithan 3500000 8348.00 250.44 350.00 0.029 0.0204526 0.009
Phulambri 3500000 1791.00 53.73 350.00 0.006 0.00438795 0.002
Vaijapur 3500000 5848.00 175.44 350.00 0.020 0.0143276 0.006
Gangapur 3500000 3168.00 95.04 350.00 0.011 0.0077616 0.003
Khultabad 3500000 1737.00 52.11 350.00 0.006 0.00425565 0.002
Sillod 3500000 1648.00 49.44 350.00 0.006 0.0040376 0.002
Kannad 3500000 4700.00 141.00 350.00 0.016 0.011515 0.005
Soegaon 3500000 1227.00 36.81 350.00 0.004 0.00300615 0.001
36036.00 1081.08 350.00 0.126 0.088 0.038
Aurangabad 4500000 1117.00 11.17 450.00 0.005 0.00351855 0.002
Paithan 4500000 926.00 9.26 450.00 0.004 0.0029169 0.001
Phulambri 4500000 283.00 2.83 450.00 0.001 0.00089145 0.000
Vaijapur 4500000 309.00 3.09 450.00 0.001 0.00097335 0.000
Gangapur 4500000 973.00 9.73 450.00 0.004 0.00306495 0.001
Khultabad 4500000 727.00 7.27 450.00 0.003 0.00229005 0.001
Sillod 4500000 6662.00 66.62 450.00 0.030 0.0209853 0.009
Kannad 4500000 1035.00 10.35 450.00 0.005 0.00326025 0.001
Soegaon 4500000 2403.00 24.03 450.00 0.011 0.00756945 0.003
14435.00 144.35 450.00 0.065 0.045 0.019
Total District
Bajra
Total District
Soybean
Total District
Tur

Block CropWater
Required / haArea Sown (ha)
Irrigated Area
(ha)
Crop Water
Demand
(mm)
Water Potential
Required
(BCM)
Existing
Water
Potential
(BCM)
Water
Potential to
be Created
(BCM)
4.2 Crop Water Requirement
Aurangabad 22000000 630.00 630.00 2200.00 0.014 0.009702 0.004
Paithan 22000000 6450.00 6450.00 2200.00 0.142 0.09933 0.043
Phulambri 22000000 550.00 550.00 2200.00 0.012 0.00847 0.004
Vaijapur 22000000 1626.00 1626.00 2200.00 0.036 0.0250404 0.011
Gangapur 22000000 4492.00 4492.00 2200.00 0.099 0.0691768 0.030
Khultabad 22000000 650.00 650.00 2200.00 0.014 0.01001 0.004
Sillod 22000000 258.00 258.00 2200.00 0.006 0.0039732 0.002
Kannad 22000000 650.00 650.00 2200.00 0.014 0.01001 0.004
Soegaon 22000000 0.00 0.00 2200.00 0.000 0 0.000
22000000 15306.00 15306.00 2200.00 0.337 0.236 0.101
Aurangabad 5000000 3285.00 3285.00 500.00 0.016 0.0114975 0.005
Paithan 5000000 1984.00 1984.00 500.00 0.010 0.006944 0.003
Phulambri 5000000 6310.00 6310.00 500.00 0.032 0.022085 0.009
Vaijapur 5000000 1111.00 1111.00 500.00 0.006 0.0038885 0.002
Gangapur 5000000 880.00 880.00 500.00 0.004 0.00308 0.001
Khultabad 5000000 2113.00 2113.00 500.00 0.011 0.0073955 0.003
Sillod 5000000 14314.00 14314.00 500.00 0.072 0.050099 0.021
Kannad 5000000 8029.00 8029.00 500.00 0.040 0.0281015 0.012
Soegaon 5000000 553.00 553.00 500.00 0.003 0.0019355 0.001
38579.00 38579.00 500.00 0.193 0.135 0.058
Aurangabad 2500000 3958.00 672.86 250.00 0.010 0.0069265 0.003
Paithan 2500000 7372.00 1253.24 250.00 0.018 0.012901 0.006
Phulambri 2500000 4698.00 798.66 250.00 0.012 0.0082215 0.004
Vaijapur 2500000 3639.00 618.63 250.00 0.009 0.00636825 0.003
Total District
Wheat
Total District
S.cane
Vaijapur 2500000 3639.00 618.63 250.00 0.009 0.00636825 0.003
Gangapur 2500000 6500.00 1105.00 250.00 0.016 0.011375 0.005
Khultabad 2500000 4766.00 810.22 250.00 0.012 0.0083405 0.004
Sillod 2500000 7882.00 1339.94 250.00 0.020 0.0137935 0.006
Kannad 2500000 5861.00 996.37 250.00 0.015 0.01025675 0.004
Soegaon 2500000 879.00 149.43 250.00 0.002 0.00153825 0.001
45555.00 7744.35 250.00 0.114 0.080 0.034
Aurangabad 3000000 10526.00 1052.60 300.00 0.032 0.0221046 0.009
Paithan 3000000 19374.00 1937.40 300.00 0.058 0.0406854 0.017
Phulambri 3000000 465.00 46.50 300.00 0.001 0.0009765 0.000
Vaijapur 3000000 10826.00 1082.60 300.00 0.032 0.0227346 0.010
Gangapur 3000000 15310.00 1531.00 300.00 0.046 0.032151 0.014
Khultabad 3000000 5025.00 502.50 300.00 0.015 0.0105525 0.005
Sillod 3000000 670.00 67.00 300.00 0.002 0.001407 0.001
Kannad 3000000 2542.00 254.20 300.00 0.008 0.0053382 0.002
Soegaon 3000000 476.00 47.60 300.00 0.001 0.0009996 0.000
65214.00 6521.40 300.00 0.196 0.137 0.059
Aurangabad 6000000 1080.00 216.00 600.00 0.006 0.004536 0.002
Paithan 6000000 1165.00 233.00 600.00 0.007 0.004893 0.002
Phulambri 6000000 1078.00 215.60 600.00 0.006 0.0045276 0.002
Vaijapur 6000000 522.00 104.40 600.00 0.003 0.0021924 0.001
Gangapur 6000000 1185.00 237.00 600.00 0.007 0.004977 0.002
Khultabad 6000000 534.00 106.80 600.00 0.003 0.0022428 0.001
Sillod 6000000 6405.00 1281.00 600.00 0.038 0.026901 0.012
Kannad 6000000 5602.00 1120.40 600.00 0.034 0.0235284 0.010
Soegaon 6000000 1754.00 350.80 600.00 0.011 0.0073668 0.003
19325.00 3865.00 600.00 0.116 0.081 0.035Total District
Rabi Maize
Total District
Gram
Total District
Rabi Sorghum
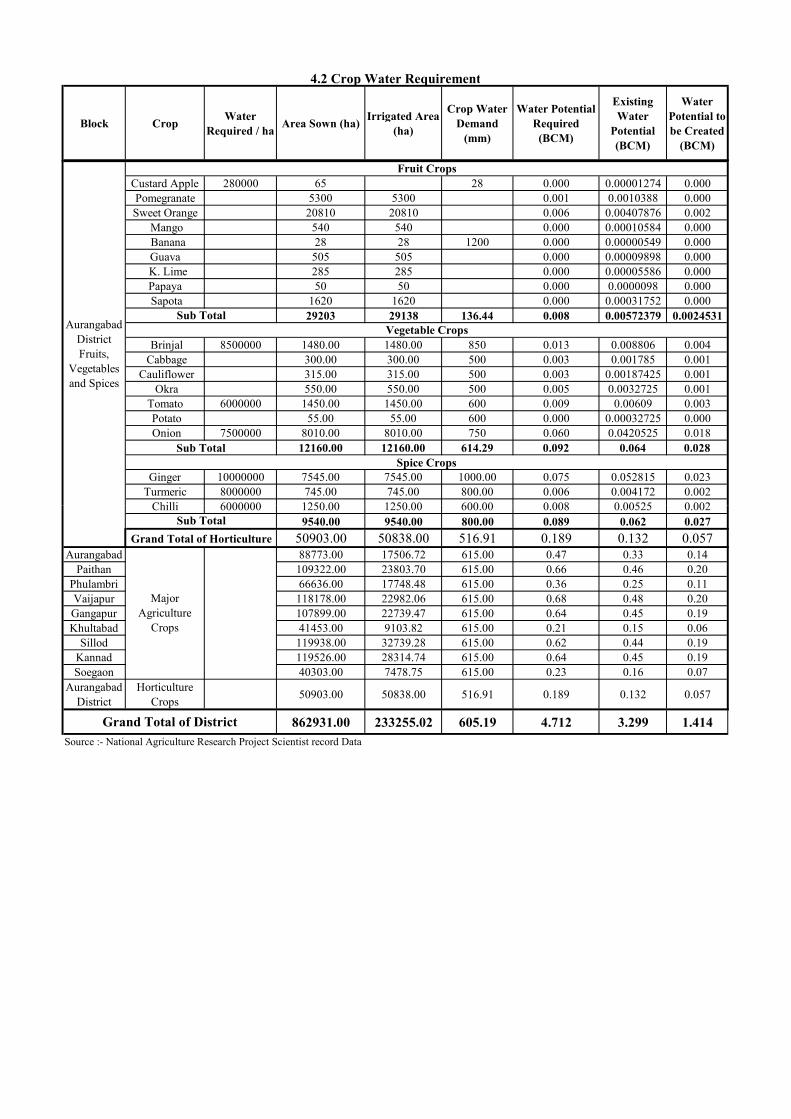
Block CropWater
Required / haArea Sown (ha)
Irrigated Area
(ha)
Crop Water
Demand
(mm)
Water Potential
Required
(BCM)
Existing
Water
Potential
(BCM)
Water
Potential to
be Created
(BCM)
4.2 Crop Water Requirement
Custard Apple 280000 65 28 0.000 0.00001274 0.000
Pomegranate 5300 5300 0.001 0.0010388 0.000
Sweet Orange 20810 20810 0.006 0.00407876 0.002
Mango 540 540 0.000 0.00010584 0.000
Banana 28 28 1200 0.000 0.00000549 0.000
Guava 505 505 0.000 0.00009898 0.000
K. Lime 285 285 0.000 0.00005586 0.000
Papaya 50 50 0.000 0.0000098 0.000
Sapota 1620 1620 0.000 0.00031752 0.000
29203 29138 136.44 0.008 0.00572379 0.0024531
Brinjal 8500000 1480.00 1480.00 850 0.013 0.008806 0.004
Cabbage 300.00 300.00 500 0.003 0.001785 0.001
Cauliflower 315.00 315.00 500 0.003 0.00187425 0.001
Okra 550.00 550.00 500 0.005 0.0032725 0.001
Tomato 6000000 1450.00 1450.00 600 0.009 0.00609 0.003
Potato 55.00 55.00 600 0.000 0.00032725 0.000
Onion 7500000 8010.00 8010.00 750 0.060 0.0420525 0.018
12160.00 12160.00 614.29 0.092 0.064 0.028
Ginger 10000000 7545.00 7545.00 1000.00 0.075 0.052815 0.023
Turmeric 8000000 745.00 745.00 800.00 0.006 0.004172 0.002
Chilli 6000000 1250.00 1250.00 600.00 0.008 0.00525 0.002
Aurangabad
District
Fruits,
Vegetables
and Spices
Fruit Crops
Vegetable Crops
Sub Total
Sub Total
Spice Crops
Chilli 6000000 1250.00 1250.00 600.00 0.008 0.00525 0.002
9540.00 9540.00 800.00 0.089 0.062 0.027
50903.00 50838.00 516.91 0.189 0.132 0.057
Aurangabad 88773.00 17506.72 615.00 0.47 0.33 0.14
Paithan 109322.00 23803.70 615.00 0.66 0.46 0.20
Phulambri 66636.00 17748.48 615.00 0.36 0.25 0.11
Vaijapur 118178.00 22982.06 615.00 0.68 0.48 0.20
Gangapur 107899.00 22739.47 615.00 0.64 0.45 0.19
Khultabad 41453.00 9103.82 615.00 0.21 0.15 0.06
Sillod 119938.00 32739.28 615.00 0.62 0.44 0.19
Kannad 119526.00 28314.74 615.00 0.64 0.45 0.19
Soegaon 40303.00 7478.75 615.00 0.23 0.16 0.07
Aurangabad
District
Horticulture
Crops50903.00 50838.00 516.91 0.189 0.132 0.057
862931.00 233255.02 605.19 4.712 3.299 1.414
Source :- National Agriculture Research Project Scientist record Data
Major
Agriculture
Crops
Grand Total of District
Sub Total
Grand Total of Horticulture

BlockTotal No. of
live Stock
Present
Water
Demand
(BCM)
Water
Demand in
2020 (BCM)
Existing
Water
Potential
(BCM)
Water
Potential to be
Created
(BCM)
Aurangabad 164511 0.002 0.002 0.002 0.000
Paithan 135978 0.001 0.001 0.001 0.000
Phulambri 118748 0.001 0.001 0.001 0.000
Gangapur 119724 0.001 0.001 0.001 0.000
Vaijapur 135640 0.001 0.001 0.001 0.000
Khultabad 107531 0.001 0.001 0.001 0.000
Sillod 112570 0.001 0.001 0.001 0.000
Kannad 140150 0.001 0.002 0.001 0.000
Soegaon 92481 0.001 0.001 0.001 0.000
Total 1127333 0.010 0.012 0.010 0.002
Source :- Animal Husbandary Department of Aurangabad Dist Year 2015.
4.3 Livestock Water Demand

BlockName of the
Industry
Water Demand
(BCM)
Water Demand 2020
(BCM)
Existing Water
Potential (BCM)
Water Potential to be
Created (BCM)
Aurangabad MIDC 0.01013 0.01441 0.01013 0.00428
Paithan MIDC 0.00066 0.00079 0.00066 0.00013
Phulambri 0 0 0 0
Gangapur 0 0 0 0
Vaijapur 0 0 0 0
Khultabad 0 0 0 0
Sillod 0 0 0 0
Kannad 0 0 0 0
Soegaon 0 0 0 0
0.01079 0.0152 0.01079 0.00441
Source :- MIDC Aurangabad
4.4 Industrial Water Demand
TOTAL

Block
Power
Requirment
MW
Water Demand
(BCM)
Water Demand in
2020 (BCM)
Existing Water
Potential (BCM)
Water Potential to be
created (BCM)
Aurangabad 0 0 0 0 0
Paithan 0 0 0 0 0
Phulambri 0 0 0 0 0
Gangapur 0 0 0 0 0
Vaijapur 0 0 0 0 0
Khultabad 0 0 0 0 0
Sillod 0 0 0 0 0
Kannad 0 0 0 0 0
Soegaon 0 0 0 0 0
Total 0 0 0 0 0
4.5 Water Demand for Power Generation

Domestic Crop Livestock IndustrialPower
Generation
1 Aurangabad 0.078 0.494 0.002 0.010 0.000 0.584
2 Paithan 0.017 0.680 0.001 0.001 0.000 0.700
3 Phulambri 0.008 0.383 0.001 0.000 0.000 0.392
4 Gangapur 0.018 0.665 0.001 0.000 0.000 0.684
5 Vaijapur 0.015 0.700 0.001 0.000 0.000 0.717
6 Khultabad 0.006 0.232 0.001 0.000 0.000 0.239
7 Sillod 0.018 0.642 0.001 0.000 0.000 0.661
8 Kannad 0.017 0.661 0.001 0.000 0.000 0.679
9 soagaon 0.006 0.253 0.001 0.000 0.000 0.260
0.182 4.712 0.010 0.011 0.000 4.916Total
Components
4.6 Total Demand of the District for Various Sectors
Sr. No. BlockTotal
(BCM)

Surface Water Ground Water Present Projected 2020 Present Projected 2020
Aurangabad 0.45227 0.1535 0.60577 0.584 0.498 0.022 0.108
Paithan 0.81538 0.19605 1.01143 0.700 0.839 0.312 0.172
Phulambri 0.22737 0.04691 0.27428 0.392 0.374 -0.118 -0.100
Gangapur 0.41176 0.13991 0.55167 0.684 0.789 -0.132 -0.238
Vaijapur 0.36871 0.17479 0.5435 0.717 0.994 -0.173 -0.450
Khultabad 0.19703 0.06486 0.26189 0.239 0.291 0.023 -0.029
Sillod 0.38683 0.13503 0.52186 0.661 0.829 -0.139 -0.307
Kannad 0.56878 0.16839 0.73717 0.679 0.769 0.058 -0.032
Soegaon 0.25115 0.05699 0.30814 0.260 0.266 0.048 0.042
Total 3.67928 1.13643 4.81571 4.916 5.648 -0.100 -0.833
Table 4.7 shows that net ground water available from rainfall recharge as well as recharge from water impounding structures in Aurangabad
district which is calculated by using GEC-1997 norms by computing assessment of dynamic ground water resources of the Maharashtra
2011-12
(Ref - Ground Water Assessment Report 2011-12)
Existing Water Availability
(BCM)
4.7 Water Budget
Name of the
Block
Total
(BCM)
Water Gap (BCM)Water Demand (BCM )
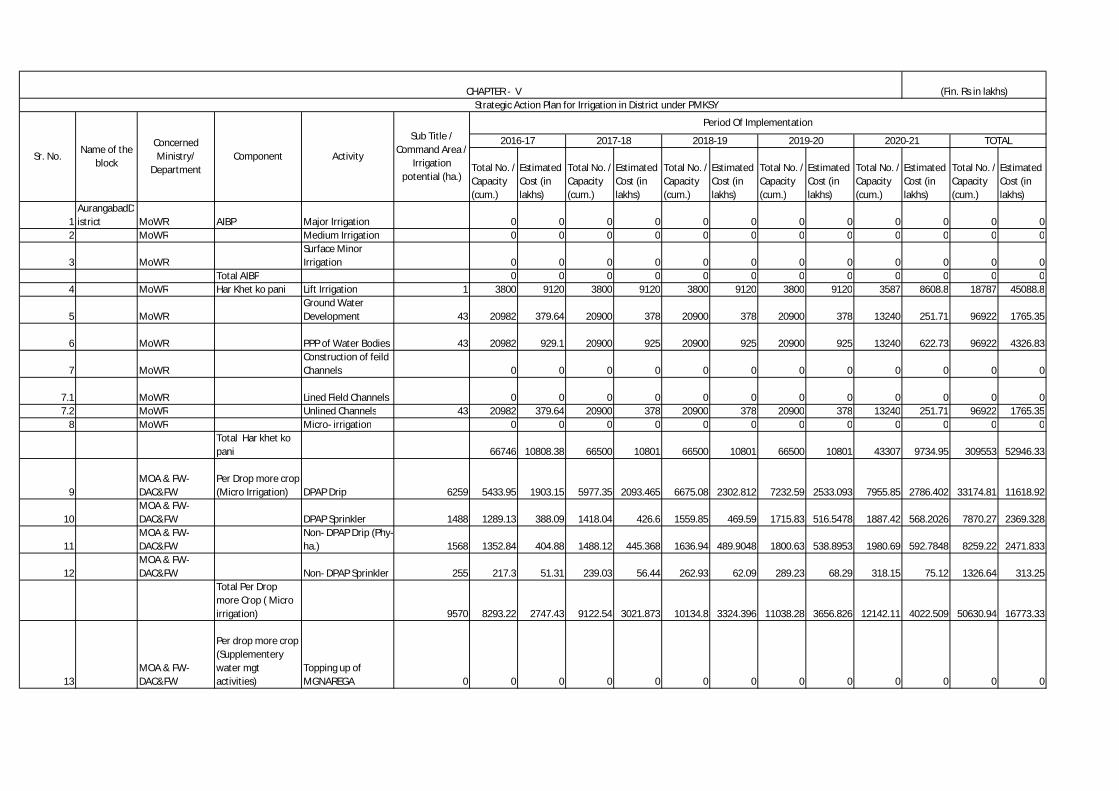
Total No. / Capacity (cum.)
Estimated Cost (in lakhs)
Total No. / Capacity (cum.)
Estimated Cost (in lakhs)
Total No. / Capacity (cum.)
Estimated Cost (in lakhs)
Total No. / Capacity (cum.)
Estimated Cost (in lakhs)
Total No. / Capacity (cum.)
Estimated Cost (in lakhs)
Total No. / Capacity (cum.)
Estimated Cost (in lakhs)
1AurangabadDistrict MoWR AIBP Major Irrigation 0 0 0 0 0 0 0 0 0 0 0 0
2 MoWR Medium Irrigation 0 0 0 0 0 0 0 0 0 0 0 0
3 MoWRSurface Minor Irrigation 0 0 0 0 0 0 0 0 0 0 0 0
Total AIBP 0 0 0 0 0 0 0 0 0 0 0 04 MoWR Har Khet ko pani Lift Irrigation 1 3800 9120 3800 9120 3800 9120 3800 9120 3587 8608.8 18787 45088.8
5 MoWRGround Water Development 43 20982 379.64 20900 378 20900 378 20900 378 13240 251.71 96922 1765.35
6 MoWR PPP of Water Bodies 43 20982 929.1 20900 925 20900 925 20900 925 13240 622.73 96922 4326.83
7 MoWRConstruction of feild Channels 0 0 0 0 0 0 0 0 0 0 0 0
7.1 MoWR Lined Field Channels 0 0 0 0 0 0 0 0 0 0 0 07.2 MoWR Unlined Channels 43 20982 379.64 20900 378 20900 378 20900 378 13240 251.71 96922 1765.35
8 MoWR Micro- irrigation 0 0 0 0 0 0 0 0 0 0 0 0Total Har khet ko pani 66746 10808.38 66500 10801 66500 10801 66500 10801 43307 9734.95 309553 52946.33
9MOA & FW-DAC&FW
Per Drop more crop (Micro Irrigation) DPAP Drip 6259 5433.95 1903.15 5977.35 2093.465 6675.08 2302.812 7232.59 2533.093 7955.85 2786.402 33174.81 11618.92
10MOA & FW-DAC&FW DPAP Sprinkler 1488 1289.13 388.09 1418.04 426.6 1559.85 469.59 1715.83 516.5478 1887.42 568.2026 7870.27 2369.328
11MOA & FW-DAC&FW
Non- DPAP Drip (Phy- ha.) 1568 1352.84 404.88 1488.12 445.368 1636.94 489.9048 1800.63 538.8953 1980.69 592.7848 8259.22 2471.833
12MOA & FW-DAC&FW Non- DPAP Sprinkler 255 217.3 51.31 239.03 56.44 262.93 62.09 289.23 68.29 318.15 75.12 1326.64 313.25
Total Per Drop more Crop ( Micro irrigation) 9570 8293.22 2747.43 9122.54 3021.873 10134.8 3324.396 11038.28 3656.826 12142.11 4022.509 50630.94 16773.33
13MOA & FW-DAC&FW
Per drop more crop (Supplementery water mgt activities)
Topping up of MGNAREGA 0 0 0 0 0 0 0 0 0 0 0 0 0
2016-17
CHAPTER - V Strategic Action Plan for Irrigation in District under PMKSY
Period Of Implementation
(Fin. Rs in lakhs)
Sub Title / Command Area /
Irrigation potential (ha.)
ActivityComponentConcerned Ministry/
Department
Name of the block
Sr. No.TOTAL2020-212019-202018-192017-18

14MOA & FW-DAC&FW
Drought proofing through check dams/Water harvesting structures 0 0 0 0 0 0 0 0 0 0 0 0 0
15MOA & FW-DAC&FW
Secondary storage structures (Phy - ha.) 0 0 0 0 0 0 0 0 0 0 0 0 0
0 0 0 0 0 0 0 0 0 0 0 0 00 0 0 0 0 0 0 0 0 0 0 0 0
16MOA & FW-DAC&FW
On farm Development (distribution pipe/raised-bed and furrow system etc) 1800 450 67.5 495 74.25 544.5 81.68 598.95 89.84 688.85 98.83 2747.3 412.09
Total per drop more crop (supplementay water act.) 1800 450 67.5 495 74.25 544.5 81.68 598.95 89.84 688.85 98.83 2747.3 412.09
17AurangabadDistrict DoLR-MoRD PMKSY Watershed Newely created WHS
17.1 DoLR-MoRD Farm Ponds (No.) 126 76.44 94.93 76.44 94.93 76.44 94.93 76.44 94.93 76.44 94.93 382.2 474.65
17.2 DoLR-MoRDCheck Dams/ Diversion Bund (No.) 0 0 0 0 0 0 0 0 0 0 0 0 0
17.3 DoLR-MoRD Nallah Bunds (No.) 217 174.4 978.05 174.4 978.05 174.4 978.05 174.4 978.05 174.4 978.05 872 4890.25
17.4 DoLR-MoRDPercolation Tanks (No.) 1627 1476.72 99.07 1476.72 99.07 1476.72 99.07 1476.72 99.07 1476.72 99.07 7383.6 495.35
17.5 DoLR-MoRDOther ground water recharge structure 166 203.04 1923.19 203.04 1923.19 203.04 1923.19 203.04 1923.19 203.04 1923.19 10.15.20 9615.95DCCT,LBS,GS/ES 689 3444.52 407.88 3444.52 407.88 3444.52 407.88 3444.52 407.88 3444.52 407.88 17222.63 2039.4CB 380 11161.26 681.13 11161.26 681.13 11161.26 681.13 11161.26 681.13 11161.26 681.13 55806.3 3405.65
0 0 0 0 0 0 0 0 0 0 0 0 00 0 0 0 0 0 0 0 0 0 0 0 00 0 0 0 0 0 0 0 0 0 0 0 00 0 0 0 0 0 0 0 0 0 0 0 00 0 0 0 0 0 0 0 0 0 0 0 00 0 0 0 0 0 0 0 0 0 0 0 0
17.6 DoLR-MoRDFishery Ponds/Cattle Pond 0 0 0 0 0 0 0 0 0 0 0 0 0
Total Newly created 16536.38 4184.25 16536.38 4184.25 16536.38 4184.25 16536.38 4184.25 16536.38 4184.25 81666.73 20921.2518 DoLR-MoRD Renovated WHS

18.1 DoLR-MoRD Farm Ponds (No.) 0 0 0 40 91.59 0 0 0 0 0 0 40 91.5918.2 DoLR-MoRD Check Dams (No.) 0 0 0 15 42 0 0 0 0 0 0 15 42
18.3 DoLR-MoRD Nallah Bunds (No.) 0 0 0 0 0 0 0 0 0 0 0 0 0
18.4 DoLR-MoRDPercolation Tanks (No.) 0 0 0 0 0 0 0 0 0 0 0 0 0
18.5 DoLR-MoRD
Other ground water recharge structure (No.) 0 0 0 0 0 0 0 0 0 0 0 0 0
18.6 DoLR-MoRDFishery Ponds/Cattle Pond (No.) 0 0 0 0 0 0 0 0 0 0 0 0 0Total Renovated WHS 0 0 55 133.59 0 0 0 0 0 0 55 133.59
Agri. Dept. IWMP-4,12,13,14,15,17,18,19,20,21,22,23 Batch I, III, V, VI&VII Capacity Building 0 424 83.77 594 115.38 371 62.84 0 0 0 0 1389 261.99
Livlihood Activites 0 0 0 0 0 0 0 0 0 0 0 0 0Landless 0 1622 247.52 2271 609.54 1603 375.79 0 0 0 0 5496 1232.85Land Holder 0 2126 407.02 3182 633.76 1807 417.28 0 0 0 0 7115 1458.06Total Livlihood 0 3742 654.54 5453 1243.3 3410 793.07 0 0 0 0 12605 2690.91Admin 0 0 0 0 0 0 0 0 0 0 0 0 0Monitoring, Evalution & Consolidation 0 0 0 0 0 0 0 0 0 0 0 0 0
Detail Project Report 0 0 0 0 0 0 0 0 0 0 0 0 0
Entry Point Acitivity 0 0 0 0 0 0 0 0 0 0 0 0 0Total PMKSY Watershed 7914 1392.85 11500 2601.98 7191 1648.98 0 0 0 0 26605 5643.81
19 DoLR-MoRDConvergence with MGNREGA Newely created
Water Conservation 0 0 0 0 0 0 0 0 0 0 0 0 019.1 DoLR-MoRD 0 0 0 0 0 0 0 0 0 0 0 0 0
0 0 0 0 0 0 0 0 0 0 0 0 00 0 0 0 0 0 0 0 0 0 0 0 00 0 0 0 0 0 0 0 0 0 0 0 0
19.2AurangabadDistrict DoLR-MoRD
Convergence with MGNREGA Water Harvesting 36 0 13.5 0 13.5 0 13.5 0 13.5 0 13.5 0 67.5
900 9000 27 9000 27 9000 27 9000 27 9000 27 45000 13518 0 18 0 18 0 18 0 18 0 18 0 90
0 0 0 0 0 0 0 0 0 0 0 0 0
18.5A

0 0 0 0 0 0 0 0 0 0 0 0 0
19.3 DoLR-MoRDCreation of irrigation canals and drains 0 0 0 0 0 0 0 0 0 0 0 0 0
19.4 DoLR-MoRD
Providing Infrastructure for irrigation 0 0 0 0 0 0 0 0 0 0 0 0 0
19.5 DoLR-MoRD Land Development 0 0 0 0 0 0 0 0 0 0 0 0 00 0 0 0 0 0 0 0 0 0 0 0 00 0 0 0 0 0 0 0 0 0 0 0 00 0 0 0 0 0 0 0 0 0 0 0 00 0 0 0 0 0 0 0 0 0 0 0 0
Total Newly created 9000 58.5 9000 58.5 9000 58.5 9000 58.5 9000 58.5 45000 292.520 DoLR-MoRD Renovation
20.1 DoLR-MoRD
Renovation of water bodies including desilting 0 0 0 0 0 0 0 0 0 0 0 0 0
20.2 DoLR-MoRD
Renovation & maintance of irrigation canals & drains 0 0 0 0 0 0 0 0 0 0 0 0 0Total Renovation 0 0 0 0 0 0 0 0 0 0 0 0
Total Convergence with MGNREGA
21State Plan Schemes 0 0 0 0 0 0 0 0 0 0 0 0 0
21.1State Irrigation Department
Name of the scheme Major Irrigation 0 0 0 0 0 0 0 0 0 0 0 0 0
21.2State Irrigation Department
Name of the scheme Medium Irrigation 0 0 0 0 0 0 0 0 0 0 0 0 0
21.3State Irrigation Department
Name of the scheme
Surface Minor Irrigation 0 0 0 0 0 0 0 0 0 0 0 0 0
22
Irrigation scheme of state Agriculture Department
Name of the scheme Micro- irrigation 6259 3317 1098.97 3649 1208.87 4014 1329.75 4415 1462.73 4857 1609 20252 6709.32
23
Irrigation scheme of line Department of state Govt.
Name of the scheme 0 0 0 0 0 0 0 0 0 0 0 0 0
24Externally aided Projects
Name of the scheme 0 0 0 0 0 0 0 0 0 0 0 0 0
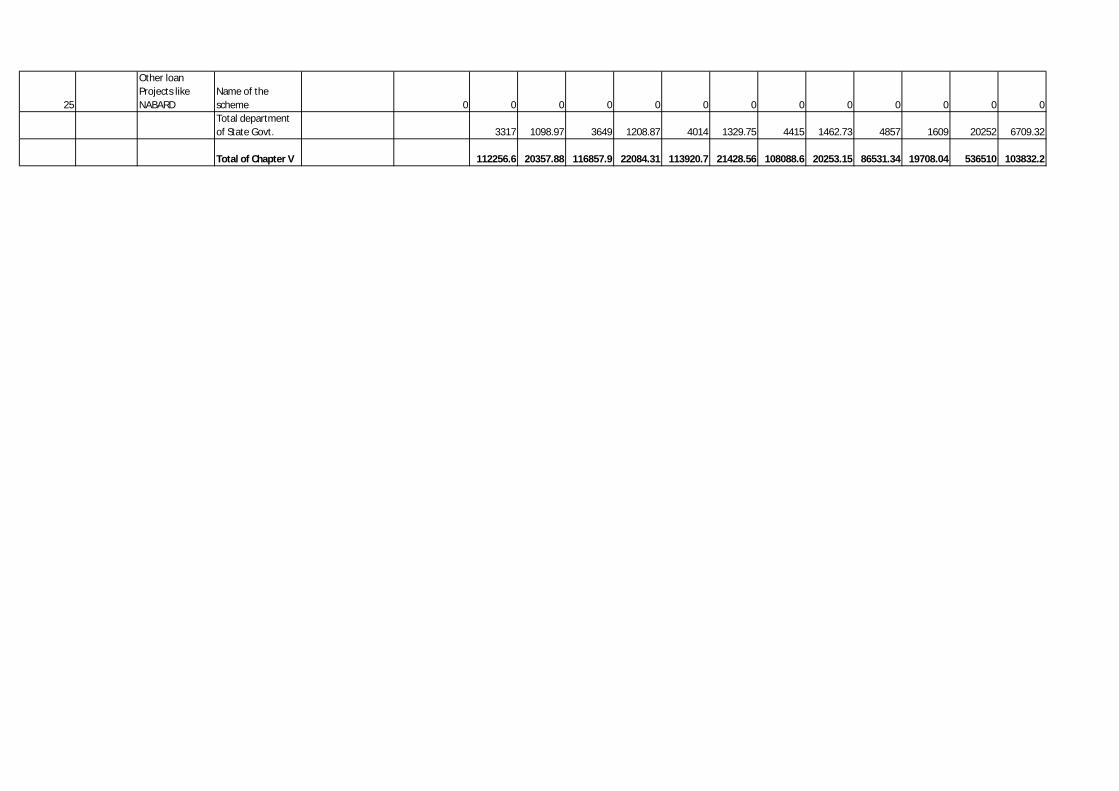
25
Other loan Projects like NABARD
Name of the scheme 0 0 0 0 0 0 0 0 0 0 0 0 0Total department of State Govt. 3317 1098.97 3649 1208.87 4014 1329.75 4415 1462.73 4857 1609 20252 6709.32
Total of Chapter V 112256.6 20357.88 116857.9 22084.31 113920.7 21428.56 108088.6 20253.15 86531.34 19708.04 536510 103832.2