disturbance legacies have a stronger effect on future
TRANSCRIPT
1
Disturbance legacies have a stronger effect on future carbon exchange than 1
climate in a temperate forest landscape 2
3
Running head: “Disturbance legacies determine C exchange” 4
5
Dominik Thom* 1,2, Werner Rammer1, Rita Garstenauer3, Rupert Seidl1 6
1 Institute of Silviculture, Department of Forest- and Soil Sciences, University of Natural 7
Resources and Life Sciences (BOKU) Vienna, Peter-Jordan-Straße 82, 1190 Vienna, Austria 8
2 Rubenstein School of Environment and Natural Resources, University of Vermont, 308i Aiken 9
Center, Burlington, VT 05405, USA. Tel: +1 802 557 8221. Fax: +1 802 656 2623. Email: 10
3 Institute of Social Ecology, Alpen-Adria Universität, 1070 Vienna, Austria 12
* Corresponding author 13
Biogeosciences Discuss., https://doi.org/10.5194/bg-2018-145Manuscript under review for journal BiogeosciencesDiscussion started: 3 April 2018c© Author(s) 2018. CC BY 4.0 License.
2
Abstract 14
Forest ecosystems play an important role in the global climate system, and are thus intensively 15
discussed in the context of climate change mitigation. Over the past decades temperate forests 16
were a carbon (C) sink to the atmosphere. However, it remains unclear to which degree this C 17
uptake is driven by a recovery from past disturbances vs. ongoing climate warming, inducing 18
high uncertainty regarding the future temperate forest C sink. Here our objectives were (i) to 19
investigate legacies within the natural disturbance regime by empirically analyzing two 20
disturbance episodes affecting the same landscape 90 years apart, and (ii) to unravel the effects 21
of past disturbances and future climate on 21st century forest C uptake by means of simulation 22
modelling. We collected historical data from archives to reconstruct vegetation and disturbance 23
history of a forest landscape in the Austrian Alps from 1905 to 2013. The effect of past legacies 24
and future climate was determined by simulating 32 different combinations of past disturbances 25
(including natural disturbances and management) and future climate scenarios. We found only 26
moderate spatial overlap between two episodes of wind and bark beetle disturbance affecting 27
the landscape in the early 20th and 21st century, respectively. The future forest C sink was driven 28
by past disturbances, while climate change reduced forest C uptake. Historic management (and 29
its cessation) had a considerably stronger influence on the future C balance than the natural 30
disturbance episodes of the past. We conclude that neglecting disturbance legacies can 31
substantially bias assessments of future forest dynamics. 32
33
Key words: bark beetles, climate change, forest history, forest management, Kalkalpen 34
National Park, legacy effects, net ecosystem exchange, wind 35
36
37
Biogeosciences Discuss., https://doi.org/10.5194/bg-2018-145Manuscript under review for journal BiogeosciencesDiscussion started: 3 April 2018c© Author(s) 2018. CC BY 4.0 License.
3
Copyright statement 38
The authors agree to the copyright statement as described at 39
https://www.biogeosciences.net/about/licence_and_copyright.html. 40
41
1. Introduction 42
Carbon dioxide (CO2) is responsible for 76% of the global greenhouse gas emissions, and is 43
thus the single most important driver of anthropogenic climate change (IPCC 2014). Forest 44
ecosystems take up large quantities of CO2 from the atmosphere, and play a key role in 45
mitigating climate change (IPCC 2007). During the period 1990 – 2007, established and 46
regrowing forests were estimated to have taken up 60% of the cumulative fossil carbon 47
emissions (Pan et al., 2011). This carbon (C) sink strength of forests has further increased in 48
recent years (Keenan and others 2016). Yet, it is likely that a combination of factors play a role 49
in the increasing carbon sequestration of forest ecosystems. On the one hand, possible factors 50
contributing to an increasing sink strength of the biosphere are CO2 (Drake et al., 2011) and 51
nitrogen (Perring et al., 2008) fertilization, in combination with extended vegetation periods 52
resulting from climate warming (Keenan et al., 2014). On the other hand, the accelerated carbon 53
uptake by forests might be a transient recovery effect of past carbon losses from land-use and 54
disturbances (Erb, 2004; Loudermilk et al., 2013). 55
For the future, dynamic Global Vegetation Models (DGVMs) frequently suggest a persistent 56
forest carbon sink (Keenan et al., 2016; Sitch et al., 2008). However, while DGVMs are suitable 57
for tracking the direct effects of global change, they frequently neglect the effects of 58
disturbances and their long-term legacy. Both natural and anthropogenic disturbances have 59
decreased the amount of carbon currently stored in forest ecosystems (Erb et al., 2018; Goetz 60
Biogeosciences Discuss., https://doi.org/10.5194/bg-2018-145Manuscript under review for journal BiogeosciencesDiscussion started: 3 April 2018c© Author(s) 2018. CC BY 4.0 License.
4
et al., 2012; Harmon et al., 1990; Seidl et al., 2014a). The legacy effects of past disturbances 61
have the potential to significantly influence forest dynamics and alter the trajectories of carbon 62
uptake in forest ecosystems over time frames of decades and centuries (Gough et al., 2007; 63
Landry et al., 2016; Seidl et al., 2014b). This is of particular importance for the forests of 64
Central Europe, which have been markedly affected by anthropogenic (i.e., forest management) 65
and natural (e.g., wind storms and bark beetles) disturbances over the past centuries (Naudts et 66
al., 2016; Svoboda et al., 2012). The importance of an improved understanding of past 67
disturbance dynamics and its impacts on the future carbon cycle is further underlined by the 68
expectation that climate change will amplify natural disturbance regimes in the future (Seidl et 69
al., 2017). In this context the role of temporal autocorrelation within disturbance regimes is of 70
particular relevance, i.e., the influence that past disturbances have on future disturbances at a 71
given site. Are past disturbances increasing or decreasing the propensity and severity for future 72
disturbances? And are such temporal autocorrelations influencing the future potential of forests 73
to take up carbon? The propensity and effect of disturbance interactions across decades remain 74
understudied to date, largely because of a lack of long-term data on past natural and human 75
disturbances. 76
Here we investigate the effect of long-term disturbance legacies on forest ecosystem dynamics, 77
in order to better understand the drivers of future forest carbon uptake, and thus aid the 78
development of effective climate change mitigation strategies. In particular, our first objective 79
was to empirically investigate the temporal interaction of two major episodes of natural 80
disturbance affecting the same Central European forest landscape 90 years apart (i.e., 1917 – 81
1923 and 2007 – 2013). We hypothesized a temporal autocorrelation of the two major 82
disturbance episodes, and specifically an amplifying effect from the earlier disturbance episode 83
on the later disturbance episode, based on recent observations of centennial disturbance waves 84
in Europe’s forests (Schurman et al., 2018). Our second goal was to quantify the contribution 85
Biogeosciences Discuss., https://doi.org/10.5194/bg-2018-145Manuscript under review for journal BiogeosciencesDiscussion started: 3 April 2018c© Author(s) 2018. CC BY 4.0 License.
5
of past disturbances (both natural and anthropogenic) on the future C uptake of the landscape 86
under a number of climate change scenarios using simulation modelling. We were particularly 87
interested in the relative effects of past disturbances and future climate scenarios on the future 88
forest C sink strength. To that end we reconstructed the vegetation and disturbance history of 89
the landscape from 1905 to 2013 using historical sources and remote sensing. We subsequently 90
determined the effect of past disturbances on 21st century C dynamics by simulating forests 91
from the early 20th century to the end of the 21st century, experimentally altering past 92
disturbance regimes in a factorial simulation experiment. These analyses were run under 93
multiple climate scenarios for the 21st century, and focused on Net Ecosystem Exchange (NEE) 94
(i.e., the net C exchange of the ecosystem with the atmosphere) as the response variable. We 95
hypothesized that the legacy of past disturbances (management + natural causes) is of 96
paramount importance for the future carbon sink (Thom et al., 2017a), expecting a saturation 97
of carbon uptake as the landscape recovers from past disturbances (i.e., a negative but 98
decreasing NEE through the 21st century). Moreover, we hypothesized a negative impact of 99
future climate change on carbon uptake as a result of less favorable conditions for carbon-rich 100
spruce dominated forests (Thom et al., 2017a). 101
102
2. Materials and Methods 103
2.1 Study area 104
We selected a 7,609 ha forest landscape located in the northern front range of the Alps as our 105
study area (Fig. 1). Focusing on the landscape scale allowed us to mechanistically capture 106
changes in forest structure and C stocks by jointly considering processes at the large scale such 107
as disturbances as well as fine scale processes such as competition between individual trees. 108
The focal landscape is particularly suited to address our research questions as it (i) was affected 109
Biogeosciences Discuss., https://doi.org/10.5194/bg-2018-145Manuscript under review for journal BiogeosciencesDiscussion started: 3 April 2018c© Author(s) 2018. CC BY 4.0 License.
6
by two major episodes of natural disturbance (driven by wind and bark beetles) in the past 110
century, and (ii) has a varied management history, with intensive management up until 1997, 111
and then becoming a part of Kalkalpen National Park (KANP), the largest contiguous protected 112
forest area in Austria. The steep elevational gradient of the study landscape, ranging from 414 113
m to 1637 m a.s.l., results in large variation in environmental conditions. For instance, 114
temperatures range from 4.3 – 9.0°C and mean annual precipitation sums vary between 1179 – 115
1648 mm on the landscape. Shallow Lithic and Renzic Leptosols as well as Chromic Cambisols 116
over calcareous bedrock are the prevailing soil types (Kobler 2004). The most prominent natural 117
forest types on the landscape are European beech (Fagus sylvatica [L.]) dominated forests at 118
low elevations, mixtures of Norway spruce (Picea abies [K.]), silver fir (Abies alba [Mill.]) and 119
European beech at mid-elevations, and Norway spruce dominated forests at high elevations. 120
These forest types are among the most common ones in Europe, and are highly valuable to 121
society also from a socio-economic perspective (Hanewinkel et al., 2012). 122
123
2.2 Simulation model 124
We employed the individual-based forest landscape and disturbance model (iLand) to simulate 125
past and future forest dynamics at our study landscape. iLand is a high-resolution process-based 126
forest model, designed to simulate the dynamic feedbacks between vegetation, climate and 127
disturbance regimes (Seidl et al., 2012a, 2012b). It simulates processes in a hierarchical multi-128
scale framework, i.e., considering processes at the individual tree (e.g., growth, mortality as 129
well as competition for light, water, and nutrients), stand (e.g., water and nutrient availability), 130
and landscape (e.g., seed dispersal, disturbances) scale as well as their cross-scale interactions. 131
Competition for resources among individual trees is based on ecological field theory (Wu et al., 132
1985). Resource utilization is modelled employing a light use efficiency approach (Landsberg 133
Biogeosciences Discuss., https://doi.org/10.5194/bg-2018-145Manuscript under review for journal BiogeosciencesDiscussion started: 3 April 2018c© Author(s) 2018. CC BY 4.0 License.
7
and Waring, 1997), incorporating the effects of temperature, solar radiation, vapor pressure 134
deficit, soil water and nutrient availability on a daily basis. Resource use efficiency is further 135
modified by variation in the atmospheric CO2 concentration. Seeds are dispersed via species-136
specific dispersal kernels (20 × 20 m horizontal resolution) around individual mature trees. The 137
establishment success of the regeneration is constrained by environmental filters (e.g., 138
temperature and light availability). 139
Mortality of trees is driven by stress-induced carbon starvation and also considers a stochastic 140
probability of tree death depending on life-history traits. Additionally, iLand includes three 141
submodules to simulate natural disturbances, including wind (Seidl et al., 2014c), bark beetles 142
(Seidl and Rammer 2017), and wildfire (Seidl et al., 2014b). As wind and bark beetles are of 143
paramount importance for the past and future disturbance regimes of Central Europe’s forests 144
(Seidl et al., 2014a; Thom et al., 2013), we employed only these two process-based disturbance 145
submodules in our simulations. The impact of wind disturbance in iLand depends on species- 146
and size-specific susceptibility (e.g., critical wind speeds of uprooting and stem breakage), 147
vertical forest structure (e.g., gaps), and storm characteristics (e.g., maximum wind speeds). 148
The bark beetle module simulates the impact of Ips typographus (L.) on Norway spruce, and 149
thus addresses the effects of the most important bark beetle species in Europe with respect to 150
area affected and timber volume disturbed (Kautz et al., 2017; Seidl et al., 2009). The model 151
inter alia accounts for insect abundance, phenology and development, as well as emergence 152
and dispersal. It computes the number of beetle generations and sister broods developed per 153
year based on the prevailing climate, and considers individual tree defense capacity and 154
susceptibility. Interactions between wind and bark beetles arise from a high infestation 155
probability and low defense capacity of freshly downed trees after wind disturbance, while 156
newly formed gaps (e.g., by bark beetles) increase the exposure of surrounding forests to storm 157
events. 158
Biogeosciences Discuss., https://doi.org/10.5194/bg-2018-145Manuscript under review for journal BiogeosciencesDiscussion started: 3 April 2018c© Author(s) 2018. CC BY 4.0 License.
8
In addition to the submodules of natural disturbance we used the agent-based forest 159
management module (ABE) in iLand (Rammer and Seidl, 2015) to simulate past forest 160
disturbances by management. ABE enables the dynamic application of generalized stand 161
treatment programs, including planting, tending, thinning, and harvesting activities. The 162
dynamically simulated management agent observes constraints at the stand and landscape 163
scales, such as maximum clearing sizes and sustainable harvest levels. Besides silvicultural 164
treatments, we used ABE to emulate the past management practice of salvage logging after bark 165
beetle outbreaks. A detailed description of the implementation of historic management 166
activities in the simulations can be found in the Supplementary Material (S4). 167
iLand simulates a closed carbon cycle, tracking C in both aboveground (stem, branch, foliage, 168
tree regeneration) and belowground live tree compartments (coarse and fine roots). 169
Decomposition rates of detrital pools are modified by temperature and humidity to allow for 170
the simulation of C dynamics under changing climatic conditions. Detrital pools include litter 171
(i.e., dead material from both leaf and fine root turnover) and soil organic matter (Kätterer and 172
Andrén, 2001) as well as snags and downed coarse woody debris. 173
iLand has been extensively evaluated against independent data from forest ecosystems of the 174
northern front range of the Alps using a pattern-oriented modeling approach (Grimm, 2005). 175
The patterns for which simulations were compared against independent observations include 176
tree productivity gradients and natural vegetation dynamics (Thom et al., 2017b), wind and bark 177
beetle disturbance levels and distributions (Seidl and Rammer 2017), as well as management 178
trajectories (Albrich et al., 2018). A comprehensive documentation of iLand can be found 179
online at http://iLand.boku.ac.at, where also the model executable and source code are freely 180
available under a GNU GPL open source license. 181
182
Biogeosciences Discuss., https://doi.org/10.5194/bg-2018-145Manuscript under review for journal BiogeosciencesDiscussion started: 3 April 2018c© Author(s) 2018. CC BY 4.0 License.
9
2.3 Reconstructing forest management and disturbance history 183
The study area has a long history of intensive timber harvesting for charcoal production, mainly 184
driven by a local pre-industrial iron-producing syndicate. This syndicate was active until 1889, 185
when the land was purchased by the k.k. (“kaiserlich und königlich”) Ministry for Agriculture. 186
During the 20th century, the majority of the landscape was managed by the Austrian Federal 187
Forests, and only limited areas within the landscape were still under the ownership of industrial 188
private companies (Weichenberger, 1994, 1995; Weinfurter, 2005). Forest management in the 189
late 19th and early 20th century was strongly influenced by the emerging industrialization. The 190
substitution of wood by mineral coal for heating, but especially for industrial energy supply, 191
changed the focus of forest management from fuel wood to timber production. At the same 192
time, an increase in agricultural productivity (also triggered by input of fossil resources as well 193
as artificial fertilizer) allowed for the abandonment of less productive agricultural plots, often 194
followed by afforestation or natural regrowth of forest vegetation. Consequently, growing 195
stocks increased in many parts of Europe throughout the 20th century as the result of increases 196
in both forest extent and density (Bebi et al., 2017). In our study system, the shifting focus from 197
fuel wood to timber production around 1900 was accompanied by the introduction of systematic 198
stand delineation for spatial management planning (Fig. S2) and decadal inventories and forest 199
plan revisions. These documents are preserved in the archives of the Austrian Federal Forests, 200
and were used here to reconstruct past forest vegetation as well as management and disturbance 201
history (see S1, Fig. S2 and S3 in the Supplementary Material for details). 202
The oldest historic vegetation data available for the landscape were from an inventory 203
conducted between the years 1898 and 1911 and comprised growing stock and age classes for 204
11 tree species at the level of stand compartments for the entire landscape; we subsequently 205
used the year 1905 (representing the area-weighted mean year of this initial inventory) as the 206
temporal starting point for our analyses (Fig. 2). A major challenge for managers was to extract 207
Biogeosciences Discuss., https://doi.org/10.5194/bg-2018-145Manuscript under review for journal BiogeosciencesDiscussion started: 3 April 2018c© Author(s) 2018. CC BY 4.0 License.
10
resources from remote and inaccessible parts of the topographically highly complex landscape. 208
The most important means of timber transportation was drifting (i.e., flushing logs down creeks 209
and streams after artificially damming them). However, this transportation technique was not 210
feasible for heavy hardwood timber such as beech (Grabner et al., 2004). Consequently, 211
managers harvested trees selectively, and mainly focused on accessible areas (i.e., stands close 212
to streams), leading to a bimodal age distribution on the landscape in 1905 with many young 213
and several old stands (Fig. S8). 214
In addition to deriving the state of the forest in 1905, we reconstructed management activities 215
(thinnings, final harvests, artificial regeneration) and natural disturbances (wind and bark 216
beetles) until 2013. From 1905 to 1917 timber extraction was fairly low. Between 1917 and 217
1923, however, a major disturbance episode by wind and bark beetles hit the region. Resulting 218
from a lack of labor force (military draft, malnutrition) in the last year of World War I a major 219
windthrow in 1917 could not be cleared, and the resulting bark beetle outbreak affected large 220
parts of the landscape. Overall, wind and bark beetles disturbed approximately one million 221
cubic meters of timber in our study area between 1917 and 1923 (calculation from archival 222
sources; Soyka, 1936; Weichenberger, 1994). Consequently, a railroad was installed to access 223
and salvage the disturbed timber. After the containment of the disturbance in 1923 forest 224
management resumed at low intensity and no major natural disturbances were recorded. 225
Following World War II, a network of forest roads was built in order to gradually replace 226
transportation by railroads. The introduction of motorized chain saws (Fig. 2) further 227
contributed to an intensification of harvests. By 1971, forest railroads were completely replaced 228
by motorized transportation on forest roads, resulting in a further increase in the timber 229
extracted from the landscape (Fig. S9). Timber removals from management as well as natural 230
disturbances from wind and bark beetles between 1905 and 1997 were reconstructed from 231
yearly management reviews available from archival sources. With the landscape becoming part 232
Biogeosciences Discuss., https://doi.org/10.5194/bg-2018-145Manuscript under review for journal BiogeosciencesDiscussion started: 3 April 2018c© Author(s) 2018. CC BY 4.0 License.
11
of KANP forest management ceased in 1997. A second major episode of natural disturbances 233
affected the landscape from 2007-2013, when a large bark beetle outbreak followed three storm 234
events in 2007 and 2008. This second disturbance episode was reconstructed from disturbance 235
records of KANP in combination with remote sensing data (Seidl and Rammer, 2016; Thom et 236
al., 2017b). 237
238
2.4 Landscape initialization and drivers 239
The vegetation data for the year 1905 were derived from historical records for 2079 stands with 240
a median stand area of 1.7 ha. On average over the landscape, the growing stock was 212.3 m³ 241
ha-1 in 1905. The most common species were Norway spruce (with a growing stock of on 242
average 116.3 m³ ha-1), European beech (68.0 m³ ha-1), and European larch (Larix decidua 243
[Mill.], 21.5 m³ ha-1). With an average growing stock of 4.2 m³ ha-1 silver fir was considerably 244
underrepresented on the landscape relative to the potential natural vegetation composition, 245
resulting from historic clear-cut management and high browsing pressure from deer (see also 246
Kučeravá and others 2012). Despite these detailed data on past vegetation not all information 247
for initializing iLand were available from archival sources, e.g., diameters at breast height (dbh) 248
and height of individual trees, as well as tree positions, regeneration and belowground carbon-249
pools had to be reconstructed by other means. To that end we developed a new method for 250
initializing vegetation in iLand, combining spin-up simulations with empirical reference data 251
on vegetation state, henceforth referred to as legacy spin-up. 252
Commonly, spin-ups run models for a certain amount of time or until specified stopping criteria 253
are reached (e.g., steady-state conditions). The actual model-based analysis is then started from 254
the thus spun-up vegetation condition (Thornton and Rosenbloom, 2005). This has the 255
advantage that the model-internal dynamics (e.g., the relationships between the different C and 256
Biogeosciences Discuss., https://doi.org/10.5194/bg-2018-145Manuscript under review for journal BiogeosciencesDiscussion started: 3 April 2018c© Author(s) 2018. CC BY 4.0 License.
12
N pools in an ecosystem) are consistent when the focal analysis starts. However, the thus 257
derived initial vegetation condition does frequently not correspond well with the vegetation 258
state observed at a given point in time, and does not account for the legacies of past management 259
and disturbance. The legacy spin-up approach developed here aims to reconstruct a (partially) 260
known reference state of the vegetation (e.g., the species composition, age, and growing stock 261
reconstructed from archival sources for the current analysis) from simulations (Fig. S5). To this 262
end iLand simulates long-term forest development for each stand, employing an approximation 263
of the past management and disturbance regime. During the simulations, the emerging forest 264
trajectory is periodically compared to the respective reference values, and the assumed past 265
management is adapted iteratively in order to decrease the difference between simulated 266
vegetation states and reference values. This procedure is executed in parallel for all stands on 267
the landscape over a long period of time (here: 1000 years), and the simulated vegetation states 268
best corresponding to the reference values are stored (including individual tree properties, 269
regeneration, and carbon pools), and later used as initial values for model-based scenario 270
analyses. A detailed description of the legacy spin-up approach is given in the Supplementary 271
Material S4. 272
In simulating 20th century forest dynamics we accounted for the abandonment of cattle grazing 273
and litter raking in forests (Glatzel, 1991) as well as an increasing deposition of nitrogen from 274
the atmosphere (Dirnböck et al., 2014; Roth et al., 2015). Specifically, we dynamically 275
modified the annual plant available nitrogen in our simulations based on data of nitrogen 276
deposition in Austria between 1880 and 2010, with nitrogen input culminating in the mid 1980s, 277
followed by a decrease and a stabilization after 2000 (Dirnböck et al., 2017). Besides edaphic 278
factors also an increase in temperature has led to more favorable conditions of tree growth 279
(Pretzsch et al., 2014). Detailed observations of climate for our study region reach back to 1950 280
(Thom et al., 2017b), requiring an extension of the climate time series to 1905. We extracted 281
Biogeosciences Discuss., https://doi.org/10.5194/bg-2018-145Manuscript under review for journal BiogeosciencesDiscussion started: 3 April 2018c© Author(s) 2018. CC BY 4.0 License.
13
data from the nearest weather station covering the period from 1905 to present (i.e., Admont, 282
located approximately 20 km south of our study area), and used its temperature and 283
precipitation record to sample years with corresponding conditions from the observational 284
record for our study landscape. 285
Simulations were run from 1905 until 2099, considering four different climate scenarios for the 286
period 2013 – 2099. Climate change was represented by three combinations of global 287
circulation models (GCM) and regional climate models (RCM) under A1B forcing, including 288
CNRM-RM4.5 (Radu et al., 2008) driven by the GCM ARPEGE, and MPI-REMO (Jacob, 289
2001), as well as ICTP-RegCM3 (Pal et al., 2007), both driven by the GCM ECHAM5. The 290
A1B scenario family assumes rapid economic growth with a global population peaking in mid-291
century and declining thereafter, and a balanced mix of energy sources being used (IPCC 2000). 292
With average temperature increases of between +3.1°C and +3.3°C and changing annual 293
precipitation sums of -87.0 mm to +135.6 mm by the end of the 21st century, the scenarios 294
studied here are comparable to the changes expected under the representative concentration 295
pathways RCP4.5 and RCP6.0 for our study region (Thom et al., 2017c). In addition to the three 296
scenarios of climate change a historic climate scenario was simulated. The years 1950 – 2010 297
were used to represent this climatic baseline, and were randomly resampled to derive a 298
stationary climate time series until 2099. 299
300
2.5 Analyses 301
To address our first objective and investigate the spatio-temporal interactions of natural 302
disturbances we used the stand-level records of the two historic disturbance episodes (1917 – 303
1923 and 2007 – 2013). First, we discretized the information (disturbed/ undisturbed) and 304
rasterized the stand polygon data to a grid of 10 × 10 m. Subsequently, we used this grid to 305
Biogeosciences Discuss., https://doi.org/10.5194/bg-2018-145Manuscript under review for journal BiogeosciencesDiscussion started: 3 April 2018c© Author(s) 2018. CC BY 4.0 License.
14
calculate an odds ratio for the probability that the two disturbance events affected the same 306
locations on the landscape (i.e., the odds that areas disturbed in the first episode were disturbed 307
again in the second episode). We calculated the 95% confidence interval of the odds ratio using 308
the vcd package in R (Meyer et al., 2016). 309
To address our second objective and evaluate the impact of past disturbances and future climate 310
on the 21st century carbon sink strength, we ran simulations under a combination of different 311
disturbance histories and climate futures. Specifically, we experimentally permutated 312
disturbances between 1905 and 2013, and analyzed the effect of these permutations by 313
continuing the simulations until the end of the 21st century. At three points in time a bifurcation 314
of the disturbance history was considered in the simulation, resulting in eight different pathways 315
of past landscape dynamics. The three bifurcations were (i) the inclusion or omission of the first 316
episode of natural disturbance (1917-1923), (ii) a continuation of management until the 317
founding of the national park 1997 or a cessation of forest management after 1923, and (iii) the 318
inclusion or omission of the second natural disturbance episode (2007-2013) (Fig. 3). This 319
factorial permutation of elements of the actual disturbance history of the landscape was chosen 320
to assess the effects of both past and recent episodes of natural disturbance on future C uptake, 321
as well as to quantify the role of past management, while accounting for the dynamic 322
interactions between these factors in the simulation (e.g., between first and second episode of 323
natural disturbance). After 2013 four different climate scenarios were simulated for all 324
alternative disturbance histories, to assess the impacts of climate change on the future NEE of 325
the landscape. 326
All simulations were started from the landscape conditions in 1905, determined by means of 327
the legacy spin-up procedure described above. From 1905 to 1923 management and natural 328
disturbances were implemented in the simulation as recorded in the stand-level archival 329
sources. After 1923, natural disturbances were simulated dynamically using the respective 330
Biogeosciences Discuss., https://doi.org/10.5194/bg-2018-145Manuscript under review for journal BiogeosciencesDiscussion started: 3 April 2018c© Author(s) 2018. CC BY 4.0 License.
15
iLand disturbance modules. For the second disturbance episode (2007 – 2013) the observed 331
peak wind speeds for the storms Kyrill (2007), Emma (2008) and Paula (2008) were used in the 332
simulation (see Seidl and Rammer 2017 for details). Beyond 2013, natural disturbances were 333
dynamically simulated with iLand. We randomly sampled annual peak wind speeds from the 334
distribution of years 1924 – 2006 and simulated the wind and bark beetle dynamics emerging 335
on the landscape (see also Thom et al., 2017a). 336
Management interventions from 1923 to 1997 were simulated using ABE. The individual 337
silvicultural decisions where thus implemented dynamically by the management agent in the 338
model, based on generic stand treatment programs of past management in Austria’s federal 339
forests and the emerging state of the forest. The advantage of this approach was that 340
management was realistically adapted to different forest states in the simulations, e.g., with 341
harvesting patterns differing in the runs in which the disturbance episode 1917 – 1923 was 342
omitted. Moreover, in line with the technical revolutions of the 20th century (Fig. 2) the 343
simulated management agent was set to account for an intensification of forest management 344
over time (e.g., a higher number of thinnings and shorter rotation periods). In summary, our 345
simulation design consisted of 32 combinations of different disturbance histories and climate 346
futures, which were replicated 20 times (i.e., in total 640 simulation runs) for the years 1905 – 347
2099 (195 years). 348
We evaluated the ability of iLand to reproduce past human and natural disturbances as well as 349
the resultant forest vegetation dynamics on the landscape by comparing simulations of the 350
baseline scenario (i.e., including historic climate, as well as reconstructed natural disturbances 351
and forest management) with independent empirical data for different time periods: The 352
simulated amount of timber extracted was compared to historical records for three time periods 353
divided by major technical revolutions during the 20th century (Fig. 2). Simulated impacts of 354
the second disturbance episode (2007 – 2013) on growing stock were compared against 355
Biogeosciences Discuss., https://doi.org/10.5194/bg-2018-145Manuscript under review for journal BiogeosciencesDiscussion started: 3 April 2018c© Author(s) 2018. CC BY 4.0 License.
16
empirical records from KANP. Simulated species shares and total growing stock were 356
compared against independent data for the year 1905, testing the ability of the legacy spin-up 357
to recreate the initial vegetation state. Furthermore, simulated species shares and growing stocks 358
were also related to observations for 1999, i.e., testing the capacity of iLand to faithfully 359
reproduce forest conditions after 95 years of vegetation dynamics. The results of all these tests 360
can be found in the Supplement of this study. 361
We used simulation outputs to investigate the changes in NEE over time and to compare the 362
different scenarios. NEE denotes the net C flux from the ecosystem to the atmosphere, with 363
negative values indicating ecosystem C gain (Chapin et al., 2006). To determine the impact of 364
past disturbances and future climate on the 21st century carbon balance of the landscape, we 365
first computed the cumulative NEE over the period 2014 – 2099 for each simulation. Next, the 366
effects of past disturbances and future climate were calculated from mean differences between 367
the different factor combinations of the simulation experiment with regard to their cumulative 368
NEE in 2099. P-values were computed by means of permutation-based independence tests 369
using the coin package (Hothorn and others 2017), and subsequently transformed into 370
confidence intervals for visualization (Altman 2011). All analyses were performed using the R 371
language and environment for statistical computing (R Development Core Team 2017). 372
373
3. Results 374
3.1 Reconstructing historic landscape dynamics 375
Using iLand, we were able to successfully reproduce historic vegetation and disturbance 376
dynamics on the landscape. The results from the legacy spin-up revealed a good match with the 377
species composition and growing stock expected from the historic records for the year 1905 378
Biogeosciences Discuss., https://doi.org/10.5194/bg-2018-145Manuscript under review for journal BiogeosciencesDiscussion started: 3 April 2018c© Author(s) 2018. CC BY 4.0 License.
17
(see S4, Fig. S6, Fig. S7). Furthermore, the iLand management module ABE was well able to 379
reproduce the intensification of forest management over the 20th century (Fig. S9). Only the 380
first evaluation period (1924 – 1952) resulted in a small overestimation of simulated harvests. 381
Further, the simulated wind and bark beetle disturbances between 2007 and 2013 corresponded 382
well to the expected values derived from KANP inventories (Fig. S10). Our dynamic simulation 383
approach adequately reproduced the tree species composition and growing stock at the 384
landscape scale after 95 years of simulation (Fig. S11). Despite an intensification of harvests 385
until 1997 and the occurrence of a major disturbance event in 1917 – 1923, the average growing 386
stock on the landscape doubled between 1905 and 2013 (Fig. S12). At the same time total 387
ecosystem carbon increased by 40.9% (Fig. S13). European beech dominance increased over 388
the 20th century, in particular at lower elevations (Fig. S12, Fig. 1e and 1f). Further details on 389
historic landscape development can be found in the Supplement S4 and Fig. S5-S13. 390
391
3.2 Long-term temporal interactions of natural disturbances 392
We used the empirically derived spatial footprint of two episodes of natural disturbance 90 393
years apart to investigate the long-term temporal interactions between disturbances. Both 394
disturbance episodes were found to have a similar impact on growing stock (117,441 m³ and 395
93,084 m³ of growing stock disturbed at the landscape, respectively), whereas the first episode 396
affected more than twice the area of the second episode (2334 ha and 1116 ha, respectively). 397
Only 9.2% of the area disturbed during the first episode was also affected by the second episode 398
(Fig. 4). Whereas the first disturbance episode mainly affected the central and southern reaches 399
of the study area, the effects of the second disturbance episode were most pronounced in the 400
northern parts of the landscape. The odds ratio of 0.49 (p<0.001) revealed a lower probability 401
that the same location of the first disturbance episode is affected by the second disturbance 402
Biogeosciences Discuss., https://doi.org/10.5194/bg-2018-145Manuscript under review for journal BiogeosciencesDiscussion started: 3 April 2018c© Author(s) 2018. CC BY 4.0 License.
18
episode on the landscape compared to the odds that a previously undisturbed area is disturbed 403
by the second disturbance episode. 404
405
3.3 The effect of past disturbance and future climate on 21st century carbon 406
sequestration 407
Our simulations reveal a considerable impact of past disturbances on the current state of total 408
ecosystem carbon (Table 1). Simulations without disturbances resulted in an increase in carbon 409
storage of 43.9 tC ha-1 (+11.0%) in 2013 compared to the baseline scenario (i.e., including 410
natural and human disturbance). The effect of disturbances was strongly dominated by forest 411
management (97.7%), with only a small influence of the two episodes of natural disturbance. 412
Past disturbances also resulted in a considerable carbon uptake beyond 2013 (Table 1, Fig. 5, 413
Fig. 6), inter alia, as a result of a persistent recovery of growing stock (Table 2). Past forest 414
management had a strong and continuous positive legacy effect on the future cumulative carbon 415
uptake of the landscape (cumulative decrease in NEE until 2099 of -40.6 tC ha-1, p<0.001). The 416
second disturbance episode caused a release of carbon (positive NEE) over the first years of 417
future simulations, followed by a reversal of the trend towards a negative NEE effect (Fig. S14). 418
Its overall impact on cumulative NEE at the end of the simulation period was -3.5 tC ha-1 419
(p=0.191), i.e. over the 21st century the recent disturbance period had an overall positive effect 420
on forest C sequestration. The first disturbance episode had almost no effect on the future 421
carbon dynamics (NEE effect of -0.2 tC ha-1, p=0.792). Simulations of the total legacy effect 422
of past disturbances (both natural and human) resulted in a cumulative NEE of on average -43.8 423
tC ha-1 (p<0.001) until 2099, indicating that a substantial future C uptake results from the 424
recovery of forest ecosystems from past disturbance (Fig. 6). 425
Biogeosciences Discuss., https://doi.org/10.5194/bg-2018-145Manuscript under review for journal BiogeosciencesDiscussion started: 3 April 2018c© Author(s) 2018. CC BY 4.0 License.
19
Climate change weakened the carbon sink strength on the landscape, mainly as a result of 426
climate-mediated differences in successional trajectories of forest ecosystems (Table 2). 427
However, climate change effects on NEE were more variable compared to disturbance legacy 428
effects, with increasing uncertainty over time as a result of differences in climate scenarios (Fig. 429
5). On average, climate change increased the cumulative NEE until 2099 by +24.0 tC ha-1 430
(p<0.001), and thus reduced the carbon uptake of the landscape relative to a continuation of 431
historic climate (Fig. 6). 432
433
4. Discussion 434
4.1 Disturbance interactions in time 435
Consistent with previous studies assessing the spatial and temporal autocorrelation of 436
disturbances in Europe (Marini et al., 2012; Schurman et al., 2018; Stadelmann et al., 2013; 437
Thom et al., 2013), we hypothesized that the disturbance episode in the early 20th century 438
influenced disturbances in the early 21st century. Our hypothesis was based on the importance 439
of landscape topography for wind and bark beetle disturbances (Senf and Seidl, 2018; Thom et 440
al., 2013), and the fact that susceptibility to these agents generally increases with stand age, and 441
is usually high after 90 years of stand development (Overbeck and Schmidt, 2012; Valinger and 442
Fridman, 2011). However, our analysis revealed a low probability for the same area to be 443
affected by the two consecutive disturbance episodes (Fig. 4). This finding is in contrast to 444
previous studies, which, however, investigated interactions between disturbance events in the 445
mountain forests of the Alps over only a few years (e.g., Pasztor and others 2014), while we 446
here analyzed temporal autocorrelation across multiple decades. Furthermore, also our focus on 447
an entire landscape (and its large heterogeneity in topographic settings and stand conditions) is 448
different from previous assessments of long-term disturbance feedbacks (but see Hanewinkel 449
Biogeosciences Discuss., https://doi.org/10.5194/bg-2018-145Manuscript under review for journal BiogeosciencesDiscussion started: 3 April 2018c© Author(s) 2018. CC BY 4.0 License.
20
et al., 2008), which have largely focused on plot to stand-level analyses using dendroecology 450
(e.g., Schurman et al., 2018). 451
We here tested for an amplifying feedback of natural disturbances in time, expecting high 452
susceptibility for large parts of the landscape recovering uniformly after the first disturbance 453
episode, and reaching high susceptibility to wind and bark beetles simultaneously. However, 454
disturbances can also have negative, dampening effects on future disturbance occurrence, e.g., 455
when they lead to increased heterogeneity (Seidl et al., 2016) and trigger autonomous 456
adaptation of forests to new environmental conditions (Thom et al., 2017c). The low overlap 457
between the two disturbance episodes reported here could thus be an indication for such a 458
dampening feedback between disturbances, yet further tests are needed to substantiate this 459
hypothesis for Central European forest ecosystems. An alternative explanation for the diverging 460
spatial patterns of the two disturbance episodes might be a different wind direction in the storm 461
events initiating the two respective episodes, affecting different parts of the highly complex 462
mountain forest landscapes. Also the legacy effects from past forest management were different 463
for each episode. The more open structure within stands resulting from heavy exploitation 464
before 1900 may have increased wind susceptibility in the central and southern reaches of the 465
landscape regions. 466
467
4.2 The role of disturbance legacies on future C uptake 468
Past studies investigating drivers of the forest carbon balance have largely focused either on 469
historic factors (Keenan et al., 2014; Naudts et al., 2016) or future changes in the environment 470
(Manusch et al., 2014; Reichstein et al., 2013). Only few studies to date have explicitly 471
considered disturbance legacies when assessing climate change impacts on the future carbon 472
uptake of forest ecosystems. However, disregarding legacy effects could lead to a misattribution 473
Biogeosciences Discuss., https://doi.org/10.5194/bg-2018-145Manuscript under review for journal BiogeosciencesDiscussion started: 3 April 2018c© Author(s) 2018. CC BY 4.0 License.
21
of future forest C changes. Here we harnessed an extensive long-term documentation of 474
disturbance history to study impacts of past disturbance and future climate on the future NEE 475
of a forest landscape. We found long-lasting legacy effects of past disturbances on the forest 476
carbon cycle (see also Kashian et al., 2013; Landry et al., 2016; Nunery and Keeton, 2010), 477
supporting our hypothesis regarding the paramount importance of disturbance legacies for 478
future C dynamics. In line with a dynamic landscape simulation study for western North 479
America (Loudermilk et al., 2013) our results revealed that disturbance legacies have a stronger 480
effect on NEE than changes in climatic conditions (on average 1.7 times higher cumulative 481
effect over the 21st century – see Fig. 6). Disregarding legacy effects may thus cause a 482
substantial bias when studying the future carbon dynamics of forest ecosystems. It has to be 483
noted, however, that over longer future time frames as the one studied here the effects of climate 484
change will become more important relative to past legacy effects. While we here focused on 485
the strength of the disturbance legacy effect, future efforts could aim at determining its duration. 486
Moreover, while our analyses addressed the effects of wind and bark beetles – currently the two 487
most important natural disturbance agents in Central Europe (Thom et al., 2013) – as well as 488
their interactions, future climate change may increase the importance of other disturbance 489
agents not investigated here (see e.g., Wingfield et al., 2017). 490
The specific disturbance history of our study area, characterized by intensive natural and human 491
disturbances in the past and major socio-ecological transitions throughout the 20th century, is 492
key for interpreting our findings. In particular, the cessation of forest management in 1997 had 493
a very strong impact on the future carbon balance of the landscape (an on average 166.8 times 494
and 11.5 times higher effect than the first and second episodes of natural disturbances, 495
respectively – see Fig. 6). In addition to disturbance legacy effects, also climate change 496
significantly affected the future NEE. In contrast to the general notion that temperate forests 497
will serve as a strong carbon sink under climate change (Bonan, 2008), our dynamic simulations 498
Biogeosciences Discuss., https://doi.org/10.5194/bg-2018-145Manuscript under review for journal BiogeosciencesDiscussion started: 3 April 2018c© Author(s) 2018. CC BY 4.0 License.
22
suggest that climate change will decrease the ability of the landscape to sequester carbon in the 499
future, mainly by forcing a transition to forest types with a lower carbon storage potential. 500
However, considerable uncertainties of climate change impacts on the carbon balance of forest 501
ecosystems remain (e.g., Manusch et al., 2014). These uncertainties may arise from a wide 502
range of potential future climate trajectories, but also from a limited understanding of processes 503
such as the CO2 fertilization effect on forest C uptake (Kroner and Way, 2016; Reyer et al., 504
2014). In addition to the direct impacts of climate change (e.g., via temperature and 505
precipitation changes) on forest ecosystems, climate change will also alter future natural 506
disturbance regimes (Seidl et al., 2017). The potential for such large pulses of C release from 507
forests is making the role of forests in climate mitigation strategies highly uncertain (Kurz et 508
al., 2008; Seidl et al., 2014a). 509
510
5. Conclusions 511
Past disturbance (both human and natural) have a long-lasting influence on forest dynamics. In 512
order to project the future of forest ecosystems we thus need to better understand their past. We 513
here showed how a combination of historical sources and simulation modeling – applied by an 514
interdisciplinary team of scientists – can be used to improve our understanding of the long-term 515
trajectories of forest ecosystems (Bürgi et al., 2017; Collins et al., 2017; Deng and Li, 2016). 516
Two conclusions can be drawn from the strong historical determination of future forest 517
dynamics: First, as temperate forests have been managed intensively in many parts of the world 518
(Deng and Li, 2016; Foster et al., 1998; Naudts et al., 2016), their contribution to climate change 519
mitigation over the coming decades is likely determined already to a large degree by their past 520
(see also Schwaab et al., 2015). This means that for the time frame within which a 521
transformation of human society needs to be achieved in order to retain the earth system within 522
Biogeosciences Discuss., https://doi.org/10.5194/bg-2018-145Manuscript under review for journal BiogeosciencesDiscussion started: 3 April 2018c© Author(s) 2018. CC BY 4.0 License.
23
its planetary boundaries (Steffen et al., 2011), the potential for influencing the role of forests 523
might be lower than frequently assumed. Efforts to change forest management now to mitigate 524
climate change through in situ C storage, have high potential (Canadell and Raupach, 2008), 525
but will likely unfold their effects too late to make a major contribution to the transition of the 526
coming decades. Second, any changes in the disturbance regime of forests – whether intentional 527
(when altering management) or unintentional in the case of changing natural disturbances – 528
have profound consequences for the future development of forest ecosystems. This underlines 529
that a long-term perspective integrating past and future ecosystem dynamics is important when 530
studying forests, and that decadal to centennial foresight is needed in ecosystem management. 531
532
Author contribution 533
RS, DT and WR designed the study, RG collected historical data from archives, DT and WR 534
performed simulations, DT analyzed the outputs, all authors contributed to writing the 535
manuscript. 536
537
Competing interests 538
The authors declare that they have no conflict of interest. 539
540
Acknowledgements 541
This study was supported by the Austrian Climate and Energy Fund ACRP (grant 542
KR14AC7K11960). W. Rammer and R. Seidl acknowledge further support from the Austrian 543
Science Fund FWF through START grant Y895-B25. We thank the Austrian Federal Forests 544
Biogeosciences Discuss., https://doi.org/10.5194/bg-2018-145Manuscript under review for journal BiogeosciencesDiscussion started: 3 April 2018c© Author(s) 2018. CC BY 4.0 License.
24
for the permission to access their archives for the collection of the historic data used in this 545
study. The simulations performed in this study were conducted at the Vienna Scientific Cluster. 546
547
References 548
Albrich, K., Rammer, W., Thom, D., Seidl, R.: Trade-offs between temporal stability and long-549
term provisioning of forest ecosystem services under changing climate and disturbance 550
regimes, in review, 2018. 551
Altman, D. G.: How to obtain the confidence interval from a P value. BMJ. 343:d2090, doi: 552
10.1136/bmj.d2090, 2011. 553
Bebi, P., Seidl, R., Motta, R., Fuhr, M., Firm, D., Krumm, F., Conedera, M., Ginzler, C., 554
Wohlgemuth, T. and Kulakowski, D.: Changes of forest cover and disturbance regimes in 555
the mountain forests of the Alps, For. Ecol. Manage., 388, 43–56, 556
doi:10.1016/j.foreco.2016.10.028, 2017. 557
Bonan, G. B.: Forests and climate change: forcings, feedbacks, and the climate benefits of 558
forests., Science, 320(5882), 1444–1449, doi:10.1126/science.1155121, 2008. 559
Bürgi, M., Östlund, L. and Mladenoff, D. J.: Legacy effects of human land use: Ecosystems as 560
time-lagged systems, Ecosystems, 20(1), 94–103, doi:10.1007/s10021-016-0051-6, 2017. 561
Canadell, J. G. and Raupach, M. R.: Managing forests for climate change mitigation, Science, 562
320(5882), 1456–1457, doi:DOI 10.1126/science.1155458, 2008. 563
Chapin, F. S., Woodwell, G. M., Randerson, J. T., Rastetter, E. B., Lovett, G. M., Baldocchi, 564
D. D., Clark, D. A., Harmon, M. E., Schimel, D. S., Valentini, R., Wirth, C., Aber, J. D., 565
Cole, J. J., Goulden, M. L., Harden, J. W., Heimann, M., Howarth, R. W., Matson, P. A., 566
Biogeosciences Discuss., https://doi.org/10.5194/bg-2018-145Manuscript under review for journal BiogeosciencesDiscussion started: 3 April 2018c© Author(s) 2018. CC BY 4.0 License.
25
McGuire, A. D., Melillo, J. M., Mooney, H. A., Neff, J. C., Houghton, R. A., Pace, M. 567
L., Ryan, M. G., Running, S. W., Sala, O. E., Schlesinger, W. H. and Schulze, E. D.: 568
Reconciling carbon-cycle concepts, terminology, and methods, Ecosystems, 9(7), 1041–569
1050, doi:10.1007/s10021-005-0105-7, 2006. 570
Collins, B. M., Fry, D. L., Lydersen, J. M., Everett, R. and Stephens, S. L.: Impacts of 571
different land management histories on forest change, Ecol. Appl., 0(0), 1–12, 572
doi:10.1002/eap.1622, 2017. 573
Deng, X. and Li, Z.: A review on historical trajectories and spatially explicit scenarios of 574
land-use and land-cover changes in China, J. Land Use Sci., 11(6), 709–724, 575
doi:10.1080/1747423X.2016.1241312, 2016. 576
Dirnböck, T., Grandin, U., Bernhardt-Römermann, M., Beudert, B., Canullo, R., Forsius, M., 577
Grabner, M.-T., Holmberg, M., Kleemola, S., Lundin, L., Mirtl, M., Neumann, M., 578
Pompei, E., Salemaa, M., Starlinger, F., Staszewski, T. and Uziębło, A. K.: Forest floor 579
vegetation response to nitrogen deposition in Europe, Glob. Chang. Biol., 20(2), 429–580
440, doi:10.1111/gcb.12440, 2014. 581
Dirnböck, T., Djukic, I., Kitzler, B., Kobler, J., Mol-Dijkstra, J. P., Posch, M., Reinds, G. J., 582
Schlutow, A., Starlinger, F. and Wamelink, W. G. W.: Climate and air pollution impacts 583
on habitat suitability of Austrian forest ecosystems, edited by R. Zang, PLoS One, 12(9), 584
e0184194, doi:10.1371/journal.pone.0184194, 2017. 585
Drake, J. E., Gallet-Budynek, A., Hofmockel, K. S., Bernhardt, E. S., Billings, S. A., Jackson, 586
R. B., Johnsen, K. S., Lichter, J., Mccarthy, H. R., Mccormack, M. L., Moore, D. J. P., 587
Oren, R., Palmroth, S., Phillips, R. P., Pippen, J. S., Pritchard, S. G., Treseder, K. K., 588
Schlesinger, W. H., Delucia, E. H. and Finzi, A. C.: Increases in the flux of carbon 589
belowground stimulate nitrogen uptake and sustain the long-term enhancement of forest 590
Biogeosciences Discuss., https://doi.org/10.5194/bg-2018-145Manuscript under review for journal BiogeosciencesDiscussion started: 3 April 2018c© Author(s) 2018. CC BY 4.0 License.
26
productivity under elevated CO2, Ecol. Lett., 14(4), 349–357, doi:10.1111/j.1461-591
0248.2011.01593.x, 2011. 592
Erb, K.-H.: Land use related changes in aboveground carbon stocks of Austria’s terrestrial 593
ecosystems, Ecosystems, 7(5), 563–572, doi:10.1007/s10021-004-0234-4, 2004. 594
Erb, K. H., Kastner, T., Plutzar, C., Bais, A. L. S., Carvalhais, N., Fetzel, T., Gingrich, S., 595
Haberl, H., Lauk, C., Niedertscheider, M., Pongratz, J., Thurner, M. and Luyssaert, S.: 596
Unexpectedly large impact of forest management and grazing on global vegetation 597
biomass, Nature, 553(7686), 73–76, doi:10.1038/nature25138, 2018. 598
Foster, D. R., Motzkin, G. and Slater, B.: Land-Use History as Long-Term Broad-Scale 599
Disturbance: Regional Forest Dynamics in Central New England, Ecosystems, 1(1), 96–600
119, doi:10.1007/s100219900008, 1998. 601
Glatzel, G.: the Impact of Historic Land-Use and Modern Forestry on Nutrient Relations of 602
Central-European Forest Ecosystems, Fertil. Res., 27(1), 1–8, doi:10.1007/BF01048603, 603
1991. 604
Goetz, S. J., Bond-Lamberty, B., Law, B. E., Hicke, J. A., Huang, C., Houghton, R. A., 605
McNulty, S., O’Halloran, T., Harmon, M., Meddens, A. J. H., Pfeifer, E. M., Mildrexler, 606
D. and Kasischke, E. S.: Observations and assessment of forest carbon dynamics 607
following disturbance in North America, J. Geophys. Res. Biogeosciences, 117(2), 1–17, 608
doi:10.1029/2011JG001733, 2012. 609
Gough, C. M., Vogel, C. S., Harrold, K. H., George, K. and Curtis, P. S.: The legacy of 610
harvest and fire on ecosystem carbon storage in a north temperate forest, Glob. Chang. 611
Biol., 13(9), 1935–1949, doi:10.1111/j.1365-2486.2007.01406.x, 2007. 612
Grabner, M., Wimmer, R. and Weichenberger, J.: Reconstructing the History of Log-Drifting 613
Biogeosciences Discuss., https://doi.org/10.5194/bg-2018-145Manuscript under review for journal BiogeosciencesDiscussion started: 3 April 2018c© Author(s) 2018. CC BY 4.0 License.
27
in the Reichraminger Hintergebirge, Austria. 21, no. 3: 131-137., Dendrochronologia, 614
21(3), 131–137, 2004. 615
Grimm, V.E., Revilla E., Berger U., Jeltsch F., Mooij W.M., Railsback S.F., Thulke H.-H., 616
Weiner J., Wiegand T., DeAngelis D.L..: Pattern-Oriented Modeling of Agent-Based 617
Complex Systems: Lessons from Ecology, Science., 310(5750), 987–991, 618
doi:10.1126/science.1116681, 2005. 619
Hanewinkel, M., Breidenbach, J., Neeff, T. and Kublin, E.: Seventy-seven years of natural 620
disturbances in a mountain forest area — the influence of storm, snow, and insect damage 621
analysed with a long-term time series, Can. J. For. Res., 38(8), 2249–2261, 622
doi:10.1139/X08-070, 2008. 623
Hanewinkel, M., Cullmann, D. A., Schelhaas, M.-J., Nabuurs, G.-J. and Zimmermann, N. E.: 624
Climate change may cause severe loss in the economic value of European forest land, 625
Nat. Clim. Chang., 3(3), 203–207, doi:10.1038/nclimate1687, 2012. 626
Harmon, M. E., Ferrel, W. K. and Franklin, J. F.: Effects on carbon storage of conversion of 627
old-growth forests to young forests, Science, 247, 699–702, 1990. 628
Hothorn, T., Hornik, K., van de Wiel, M. A., Winell, H., Zeileis, A.: Package 'coin'. 629
https://cran.r-project.org/web/packages/coin/coin.pdf, 2017. 630
IPCC: Special report on emission scenarios. Contribution of Working Group III of the 631
Intergovernmental Panel on Climate Change. In N. Nakicenovic, R. Swart (Eds.). 632
Emissions scenarios (pp. 1–570). Cambridge, UK: Cambridge University Press, 2000. 633
IPCC: Climate Change 2007: The Physical Science Basis. Contribution of Working Group I 634
to the Fourth Assessment Report of the Intergovernmental Panel on Climate Change. In 635
S. Solomon, D. Qin, M. Manning, Z. Chen, M. Marquis, K. B. Averyt, M. Tignor, H. 636
Biogeosciences Discuss., https://doi.org/10.5194/bg-2018-145Manuscript under review for journal BiogeosciencesDiscussion started: 3 April 2018c© Author(s) 2018. CC BY 4.0 License.
28
Miller (Eds.). Climate Change 2007: The Physical Science Basis (pp. 1–996). 637
Cambridge, UK: Cambridge University Press, 2007. 638
IPCC: Climate Change 2014: Mitigation of Climate Change. Contribution of Working Group 639
III to the Fifth Assessment Report of the Intergovernmental Panel on Climate Change. In 640
O. R. Edenhofer, R. Pichs-Madruga, Y. Sokona, E. Farahani, S. Kadner, K. Seyboth, A. 641
Adler, I. Baum, S. Brunner, P. Eickemeier, B. Kriemann, J. Savolainen, S. Schlömer, C. 642
von Stechow, T. Zwickel, J. C. Minx (Eds.). Climate Change 2014: Mitigation of 643
Climate Change (pp. 1–1435). Cambridge, UK and New York, NY, USA: Cambridge 644
University Press, 2014. 645
Jacob, D.: A note to the simulation of the annual and inter-annual variability of the water 646
budget over the Baltic Sea drainage basin, Meteorol. Atmos. Phys., 77(1–4), 61–73, 647
doi:10.1007/s007030170017, 2001. 648
Kashian, D. M., Romme, W. H., Tinker, D. B., Turner, M. G. and Ryan, M. G.: Postfire 649
changes in forest carbon storage over a 300-year chronosequence of Pinus contorta -650
dominated forests, Ecol. Monogr., 83(1), 49–66, doi:10.1890/11-1454.1, 2013. 651
Kätterer, T. and Andrén, O.: The ICBM family of analytically solved models of soil carbon, 652
nitrogen and microbial biomass dynamics - Descriptions and application examples, Ecol. 653
Modell., 136(2–3), 191–207, doi:10.1016/S0304-3800(00)00420-8, 2001. 654
Kautz, M., Meddens, A. J. H., Hall, R. J. and Arneth, A.: Biotic disturbances in Northern 655
Hemisphere forests - a synthesis of recent data, uncertainties and implications for forest 656
monitoring and modelling, Glob. Ecol. Biogeogr., 26(5), 533–552, 657
doi:10.1111/geb.12558, 2017. 658
Keenan, T. F., Gray, J., Friedl, M. A., Toomey, M., Bohrer, G., Hollinger, D. Y., Munger, J. 659
Biogeosciences Discuss., https://doi.org/10.5194/bg-2018-145Manuscript under review for journal BiogeosciencesDiscussion started: 3 April 2018c© Author(s) 2018. CC BY 4.0 License.
29
W., O’Keefe, J., Schmid, H. P., Wing, I. S., Yang, B. and Richardson, A. D.: Net carbon 660
uptake has increased through warming-induced changes in temperate forest phenology, 661
Nat. Clim. Chang., 4(7), 598–604, doi:10.1038/nclimate2253, 2014. 662
Keenan, T. F., Prentice, I. C., Canadell, J. G., Williams, C. A., Wang, H., Raupach, M. and 663
Collatz, G. J.: Recent pause in the growth rate of atmospheric CO2 due to enhanced 664
terrestrial carbon uptake, Nat. Commun., 7, 13428, doi:10.1038/ncomms13428, 2016. 665
Kobler, J.: Risikokarten als Planungsgrundlage für Flächenbewirtschaftung und 666
Tourismuslenkung im Nationalpark Kalkalpen Oberösterreich. Vienna, Austria: Faculty 667
of Earth Sciences, Geography and Astronomy, University of Vienna, 2004. 668
Kroner, Y. and Way, D. A.: Carbon fluxes acclimate more strongly to elevated growth 669
temperatures than to elevated CO2 concentrations in a northern conifer, Glob. Chang. 670
Biol., 22(8), 2913–2928, doi:10.1111/gcb.13215, 2016. 671
Kučeravá, B., Dobrovolný, L. and Remeš, J.: Responses of Abies alba seedlings to different 672
site conditions in Picea abies plantations, Dendrobiology, 69, 49–58, 673
doi:10.12657/denbio.069.006, 2012. 674
Kurz, W. A., Stinson, G., Rampley, G. J., Dymond, C. C. and Neilson, E. T.: Risk of natural 675
disturbances makes future contribution of Canada ’ s forests to the global carbon cycle 676
highly uncertain, PNAS, 105(5), 1551–1555, 2008. 677
Landry, J.-S., Parrott, L., Price, D. T., Ramankutty, N. and Matthews, H. D.: Modelling long-678
term impacts of mountain pine beetle outbreaks on merchantable biomass, ecosystem 679
carbon, albedo, and radiative forcing, Biogeosciences, 13(18), 5277–5295, 680
doi:10.5194/bg-13-5277-2016, 2016. 681
Landsberg, J. J. and Waring, R. H.: A generalised model of forest productivity using 682
Biogeosciences Discuss., https://doi.org/10.5194/bg-2018-145Manuscript under review for journal BiogeosciencesDiscussion started: 3 April 2018c© Author(s) 2018. CC BY 4.0 License.
30
simplified concepts of radiation-use efficiency, carbon balance and partitioning, For. 683
Ecol. Manage., 95(3), 209–228, doi:10.1016/S0378-1127(97)00026-1, 1997. 684
Loudermilk, E. L., Scheller, R. M., Weisberg, P. J., Yang, J., Dilts, T. E., Karam, S. L. and 685
Skinner, C.: Carbon dynamics in the future forest: The importance of long-term 686
successional legacy and climate-fire interactions, Glob. Chang. Biol., 19(11), 3502–3515, 687
doi:10.1111/gcb.12310, 2013. 688
Manusch, C., Bugmann, H. and Wolf, A.: The impact of climate change and its uncertainty on 689
carbon storage in Switzerland, Reg. Environ. Chang., 14(4), 1437–1450, 690
doi:10.1007/s10113-014-0586-z, 2014. 691
Marini, L., Ayres, M. P., Battisti, A. and Faccoli, M.: Climate affects severity and altitudinal 692
distribution of outbreaks in an eruptive bark beetle, Clim. Change, 115(2), 327–341, 693
doi:10.1007/s10584-012-0463-z, 2012. 694
Meyer, D., Zeileis, A., Hornik, K., Gerber, F., Friendly, M.: Package 'vcd'. https://cran.r-695
project.org/web/packages/vcd/vcd.pdf, 2016. 696
Naudts, K., Chen, Y., McGrath, M. J., Ryder, J., Valade, A., Otto, J. and Luyssaert, S.: 697
Europes forest management did not mitigate climate warming, Science, 351(6273), 597–698
600, doi:10.1126/science.aad7270, 2016. 699
Nunery, J. S. and Keeton, W. S.: Forest carbon storage in the northeastern United States: Net 700
effects of harvesting frequency, post-harvest retention, and wood products, For. Ecol. 701
Manage., 259(8), 1363–1375, doi:10.1016/j.foreco.2009.12.029, 2010. 702
Overbeck, M. and Schmidt, M.: Modelling infestation risk of Norway spruce by Ips 703
typographus (L.) in the Lower Saxon Harz Mountains (Germany), For. Ecol. Manage., 704
266, 115–125, doi:10.1016/j.foreco.2011.11.011, 2012. 705
Biogeosciences Discuss., https://doi.org/10.5194/bg-2018-145Manuscript under review for journal BiogeosciencesDiscussion started: 3 April 2018c© Author(s) 2018. CC BY 4.0 License.
31
Pal, J. S., Giorgi, F., Bi, X., Elguindi, N., Solmon, F., Rauscher, S. A., Gao, X., Francisco, R., 706
Zakey, A., Winter, J., Ashfaq, M., Syed, F. S., Sloan, L. C., Bell, J. L., Diffenbaugh, N. 707
S., Karmacharya, J., Konaré, A., Martinez, D., da Rocha, R. P. and Steiner, A. L.: 708
Regional climate modeling for the developing world: The ICTP RegCM3 and RegCNET, 709
Bull. Am. Meteorol. Soc., 88(9), 1395–1409, doi:10.1175/BAMS-88-9-1395, 2007. 710
Pan, Y., Birdsey, R. A., Fang, J., Houghton, R., Kauppi, P. E., Kurz, W. A., Phillips, O. L., 711
Shvidenko, A., Lewis, S. L., Canadell, J. G., Ciais, P., Jackson, R. B., Pacala, S. W., 712
McGuire, A. D., Piao, S., Rautiainen, A., Sitch, S. and Hayes, D.: A Large and Persistent 713
Carbon Sink in the World’s Forests, Science, 333(6045), 988–993, 714
doi:10.1126/science.1201609, 2011. 715
Pasztor, F., Matulla, C., Rammer, W. and Lexer, M. J.: Drivers of the bark beetle disturbance 716
regime in Alpine forests in Austria, For. Ecol. Manage., 318, 349–358, 717
doi:10.1016/j.foreco.2014.01.044, 2014. 718
Perring, M. P., Hedin, L. O., Levin, S. A., McGroddy, M. and de Mazancourt, C.: Increased 719
plant growth from nitrogen addition should conserve phosphorus in terrestrial 720
ecosystems., Proc. Natl. Acad. Sci. U. S. A., 105(6), 1971–6, 721
doi:10.1073/pnas.0711618105, 2008. 722
Pretzsch, H., Biber, P., Schütze, G., Uhl, E. and Rötzer, T.: Forest stand growth dynamics in 723
Central Europe have accelerated since 1870, Nat. Commun., 5(4967), 724
doi:10.1038/ncomms5967, 2014. 725
Radu, R., Déqué, M. and Somot, S.: Spectral nudging in a spectral regional climate model, 726
Tellus A, 60(5), 898–910, doi:10.1111/j.1600-0870.2008.00341.x, 2008. 727
Rammer, W. and Seidl, R.: Coupling human and natural systems: Simulating adaptive 728
Biogeosciences Discuss., https://doi.org/10.5194/bg-2018-145Manuscript under review for journal BiogeosciencesDiscussion started: 3 April 2018c© Author(s) 2018. CC BY 4.0 License.
32
management agents in dynamically changing forest landscapes, Glob. Environ. Chang., 729
35, 475–485, doi:10.1016/j.gloenvcha.2015.10.003, 2015. 730
R Development Core Team: R: A language and environment for statistical computing. R 731
Foundation for Statistical Computing, Vienna, Austria. http://R-project.org, 2017. 732
Reichstein, M., Bahn, M., Ciais, P., Frank, D., Mahecha, M. D., Seneviratne, S. I., 733
Zscheischler, J., Beer, C., Buchmann, N., Frank, D. C., Papale, D., Rammig, A., Smith, 734
P., Thonicke, K., van der Velde, M., Vicca, S., Walz, A. and Wattenbach, M.: Climate 735
extremes and the carbon cycle, Nature, 500(7462), 287–295, doi:10.1038/nature12350, 736
2013. 737
Reyer, C., Lasch-Born, P., Suckow, F., Gutsch, M., Murawski, A. and Pilz, T.: Projections of 738
regional changes in forest net primary productivity for different tree species in Europe 739
driven by climate change and carbon dioxide, Ann. For. Sci., 71(2), 211–225, 740
doi:10.1007/s13595-013-0306-8, 2014. 741
Roth, T., Kohli, L., Rihm, B. and Achermann, B.: Nitrogen deposition and diversity at the 742
landscape scale Subje, R. Soc. open Sci., 2(150017), 1–8, 2015. 743
Schurman, J. S., Trotsiuk, V., Bače, R., Čada, V., Fraver, S., Janda, P., Kulakowski, D., 744
Labusova, J., Mikoláš, M., Nagel, T. A., Seidl, R., Synek, M., Svobodová, K., 745
Chaskovskyy, O., Teodosiu, M. and Svoboda, M.: Large-scale disturbance legacies and 746
the climate sensitivity of primary Picea abies forests, Glob. Chang. Biol., 38(1), 42–49, 747
doi:10.1111/gcb.14041, 2018. 748
Schwaab, J., Bavay, M., Davin, E., Hagedorn, F., Hüsler, F., Lehning, M., Schneebeli, M., 749
Thürig, E. and Bebi, P.: Carbon storage versus albedo change: Radiative forcing of forest 750
expansion in temperate mountainous regions of Switzerland, Biogeosciences, 12(2), 467–751
Biogeosciences Discuss., https://doi.org/10.5194/bg-2018-145Manuscript under review for journal BiogeosciencesDiscussion started: 3 April 2018c© Author(s) 2018. CC BY 4.0 License.
33
487, doi:10.5194/bg-12-467-2015, 2015. 752
Seidl, R. and Rammer, W.: Climate change amplifies the interactions between wind and bark 753
beetle disturbances in forest landscapes, Landsc. Ecol., 32(7) , doi:10.1007/s10980-016-754
0396-4, doi:10.1007/s10980-016-0396-4, 2017. 755
Seidl, R., Schelhaas, M.-J., Lindner, M. and Lexer, M. J.: Modelling bark beetle disturbances 756
in a large scale forest scenario model to assess climate change impacts and evaluate 757
adaptive management strategies, Reg. Environ. Chang., 9(2), 101–119, 758
doi:10.1007/s10113-008-0068-2, 2009. 759
Seidl, R., Rammer, W., Scheller, R. M. and Spies, T. A.: An individual-based process model 760
to simulate landscape-scale forest ecosystem dynamics, Ecol. Modell., 231, 87–100, 761
doi:10.1016/j.ecolmodel.2012.02.015, 2012a. 762
Seidl, R., Spies, T. A., Rammer, W., Steel, E. A., Pabst, R. J. and Olsen, K.: Multi-scale 763
drivers of spatial variation in old-growth forest carbon density disentangled with Lidar 764
and an individual-based landscape model, Ecosystems, 15(8), 1321–1335, 765
doi:10.1007/s10021-012-9587-2, 2012b. 766
Seidl, R., Rammer, W. and Spies, T. A.: Disturbance legacies increase the resilience of forest 767
ecosystem structure, composition, and functioning, Ecol. Appl., 24(8), 2063–2077, 768
doi:10.1890/14-0255.1, 2014a. 769
Seidl, R., Schelhaas, M.-J., Rammer, W. and Verkerk, P. J.: Increasing forest disturbances in 770
Europe and their impact on carbon storage, Nat. Clim. Chang., 4(9), 806–810, 771
doi:10.1038/nclimate2318, 2014b. 772
Seidl, R., Rammer, W. and Blennow, K.: Simulating wind disturbance impacts on forest 773
landscapes: Tree-level heterogeneity matters, Environ. Model. Softw., 51, 1–11, 774
Biogeosciences Discuss., https://doi.org/10.5194/bg-2018-145Manuscript under review for journal BiogeosciencesDiscussion started: 3 April 2018c© Author(s) 2018. CC BY 4.0 License.
34
doi:10.1016/j.envsoft.2013.09.018, 2014c. 775
Seidl, R., Donato, D. C., Raffa, K. F. and Turner, M. G.: Spatial variability in tree 776
regeneration after wildfire delays and dampens future bark beetle outbreaks, Proc. Natl. 777
Acad. Sci., 113(46), 13075–13080, doi:10.1073/pnas.1615263113, 2016. 778
Seidl, R., Thom, D., Kautz, M., Martin-Benito, D., Peltoniemi, M., Vacchiano, G., Wild, J., 779
Ascoli, D., Petr, M., Honkaniemi, J., Lexer, M. J., Trotsiuk, V., Mairota, P., Svoboda, 780
M., Fabrika, M., Nagel, T. A. and Reyer, C. P. O.: Forest disturbances under climate 781
change, Nat. Clim. Chang., 7(6), 395–402, doi:10.1038/nclimate3303, 2017. 782
Senf, C. and Seidl, R.: Natural disturbances are spatially diverse but temporally synchronized 783
across temperate forest landscapes in Europe, Glob. Chang. Biol., 24(3), 1201–1211, 784
doi:10.1111/gcb.13897, 2018. 785
Sitch, S., Huntingford, C., Gedney, N., Levy, P. E., Lomas, M., Piao, S. L., Betts, R., Ciais, 786
P., Cox, P., Friedlingstein, P., Jones, C. D., Prentice, I. C. and Woodward, F. I.: 787
Evaluation of the terrestrial carbon cycle, future plant geography and climate-carbon 788
cycle feedbacks using five Dynamic Global Vegetation Models (DGVMs), Glob. Chang. 789
Biol., 14(9), 2015–2039, doi:10.1111/j.1365-2486.2008.01626.x, 2008. 790
Soyka, W.: Die Borkenkäferverheerungen in Reichraming und ihre Bekämpfung, Allg. 791
Forst- und Jagdzeitung, 54, 155–156, 1936. 792
Stadelmann, G., Bugmann, H., Wermelinger, B., Meier, F. and Bigler, C.: A predictive 793
framework to assess spatio-temporal variability of infestations by the european spruce 794
bark beetle, Ecography, 36(11), 1208–1217, doi:10.1111/j.1600-0587.2013.00177.x, 795
2013. 796
Steffen, W., Persson, Å., Deutsch, L., Zalasiewicz, J., Williams, M., Richardson, K., Crumley, 797
Biogeosciences Discuss., https://doi.org/10.5194/bg-2018-145Manuscript under review for journal BiogeosciencesDiscussion started: 3 April 2018c© Author(s) 2018. CC BY 4.0 License.
35
C., Crutzen, P., Folke, C., Gordon, L., Molina, M., Ramanathan, V., Rockström, J., 798
Scheffer, M., Schellnhuber, H. J. and Svedin, U.: The anthropocene: From global change 799
to planetary stewardship, Ambio, 40(7), 739–761, doi:10.1007/s13280-011-0185-x, 800
2011. 801
Svoboda, M., Janda, P., Nagel, T. a., Fraver, S., Rejzek, J. and Bače, R.: Disturbance history 802
of an old-growth sub-alpine Picea abies stand in the Bohemian Forest, Czech Republic, J. 803
Veg. Sci., 23(1), 86–97, doi:10.1111/j.1654-1103.2011.01329.x, 2012. 804
Thom, D., Seidl, R., Steyrer, G., Krehan, H. and Formayer, H.: Slow and fast drivers of the 805
natural disturbance regime in Central European forest ecosystems, For. Ecol. Manage., 806
307, 293–302, doi:10.1016/j.foreco.2013.07.017, 2013. 807
Thom, D., Rammer, W. and Seidl, R.: Disturbances catalyze the adaptation of forest 808
ecosystems to changing climate conditions, Glob. Chang. Biol., 23(1), 269–282, 809
doi:10.1111/gcb.13506, 2017c. 810
Thom, D., Rammer, W. and Seidl, R.: The impact of future forest dynamics on climate: 811
interactive effects of changing vegetation and disturbance regimes, Ecol. Monogr., 87(4), 812
665–684, doi:10.1002/ecm.1272, 2017a. 813
Thom, D., Rammer, W., Dirnböck, T., Müller, J., Kobler, J., Katzensteiner, K., Helm, N. and 814
Seidl, R.: The impacts of climate change and disturbance on spatio-temporal trajectories 815
of biodiversity in a temperate forest landscape, J. Appl. Ecol., 54(1), 28–38, 816
doi:10.1111/1365-2664.12644, 2017b. 817
Thornton, P. E. and Rosenbloom, N. A.: Ecosystem model spin-up: Estimating steady state 818
conditions in a coupled terrestrial carbon and nitrogen cycle model, Ecol. Modell., 819
189(1–2), 25–48, doi:10.1016/j.ecolmodel.2005.04.008, 2005. 820
Biogeosciences Discuss., https://doi.org/10.5194/bg-2018-145Manuscript under review for journal BiogeosciencesDiscussion started: 3 April 2018c© Author(s) 2018. CC BY 4.0 License.
36
Valinger, E. and Fridman, J.: Factors affecting the probability of windthrow at stand level as a 821
result of Gudrun winter storm in southern Sweden, For. Ecol. Manage., 262(3), 398–403, 822
doi:10.1016/j.foreco.2011.04.004, 2011. 823
Weichenberger, J.: Die Holztrift im Nationalpark Kalkalpen Teil 1: Bestandsaufnahme, 824
Leonstein., 1994. 825
Weichenberger, J.: Die Holztrift im Nationalpark Kalkalpen Teil 2: Geschichtliche 826
Aufarbeitung, Leonstein., 1995. 827
Weinfurter, P.: 80 Jahre Bundesforste. Geschichte der Österreichischen Bundesforste, 828
Purkersdorf., 2005. 829
Wingfield, M. J., Barnes, I., de Beer, Z. W., Roux, J., Wingfield, B. D. and Taerum, S. J.: 830
Novel associations between ophiostomatoid fungi, insects and tree hosts: current status—831
future prospects, Biol. Invasions, 19(11), 3215–3228, doi:10.1007/s10530-017-1468-3, 832
2017. 833
Wu, H.-I., Sharpe, P. J. H., Walker, J. and Penridge, L. K.: Ecological field theory: A spatial 834
analysis of resource interference among plants, Ecol. Modell., 29, 215–243, 1985. 835
836
Biogeosciences Discuss., https://doi.org/10.5194/bg-2018-145Manuscript under review for journal BiogeosciencesDiscussion started: 3 April 2018c© Author(s) 2018. CC BY 4.0 License.
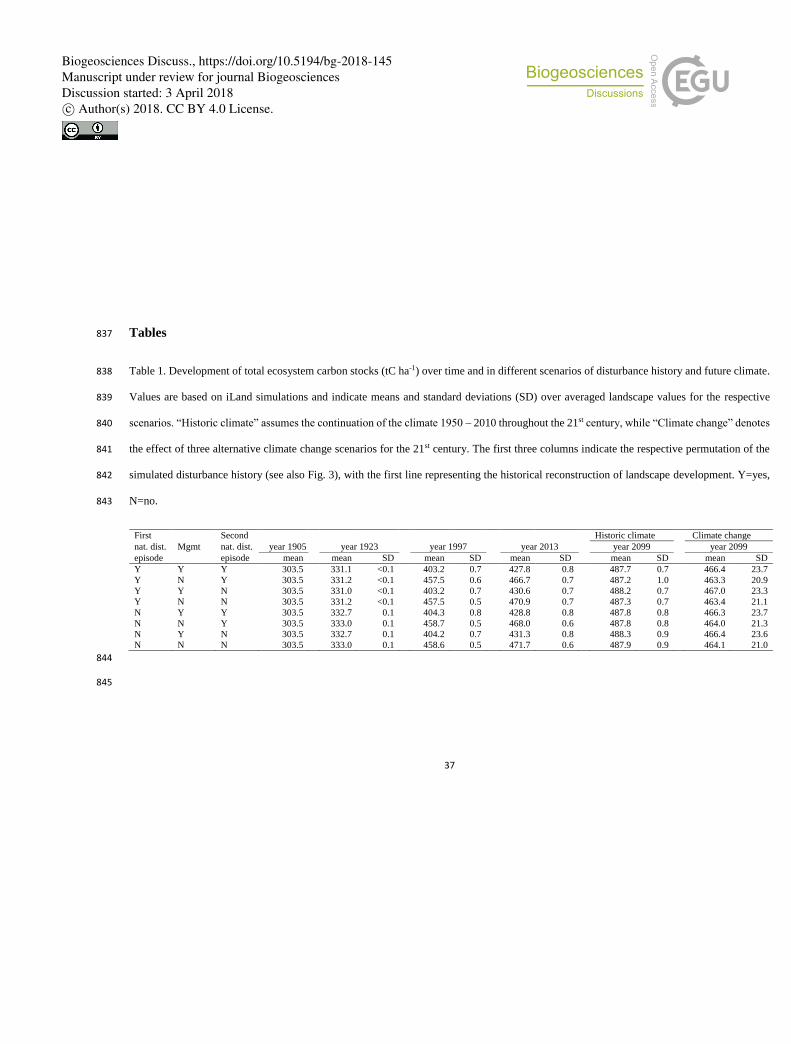
37
Tables 837
Table 1. Development of total ecosystem carbon stocks (tC ha-1) over time and in different scenarios of disturbance history and future climate. 838
Values are based on iLand simulations and indicate means and standard deviations (SD) over averaged landscape values for the respective 839
scenarios. “Historic climate” assumes the continuation of the climate 1950 – 2010 throughout the 21st century, while “Climate change” denotes 840
the effect of three alternative climate change scenarios for the 21st century. The first three columns indicate the respective permutation of the 841
simulated disturbance history (see also Fig. 3), with the first line representing the historical reconstruction of landscape development. Y=yes, 842
N=no. 843
First Second Historic climate Climate change
nat. dist. Mgmt nat. dist. year 1905 year 1923 year 1997 year 2013 year 2099 year 2099
episode episode mean mean SD mean SD mean SD mean SD mean SD
Y Y Y 303.5 331.1 <0.1 403.2 0.7 427.8 0.8 487.7 0.7 466.4 23.7
Y N Y 303.5 331.2 <0.1 457.5 0.6 466.7 0.7 487.2 1.0 463.3 20.9
Y Y N 303.5 331.0 <0.1 403.2 0.7 430.6 0.7 488.2 0.7 467.0 23.3
Y N N 303.5 331.2 <0.1 457.5 0.5 470.9 0.7 487.3 0.7 463.4 21.1
N Y Y 303.5 332.7 0.1 404.3 0.8 428.8 0.8 487.8 0.8 466.3 23.7
N N Y 303.5 333.0 0.1 458.7 0.5 468.0 0.6 487.8 0.8 464.0 21.3
N Y N 303.5 332.7 0.1 404.2 0.7 431.3 0.8 488.3 0.9 466.4 23.6
N N N 303.5 333.0 0.1 458.6 0.5 471.7 0.6 487.9 0.9 464.1 21.0
844
845
Biogeosciences Discuss., https://doi.org/10.5194/bg-2018-145Manuscript under review for journal BiogeosciencesDiscussion started: 3 April 2018c© Author(s) 2018. CC BY 4.0 License.
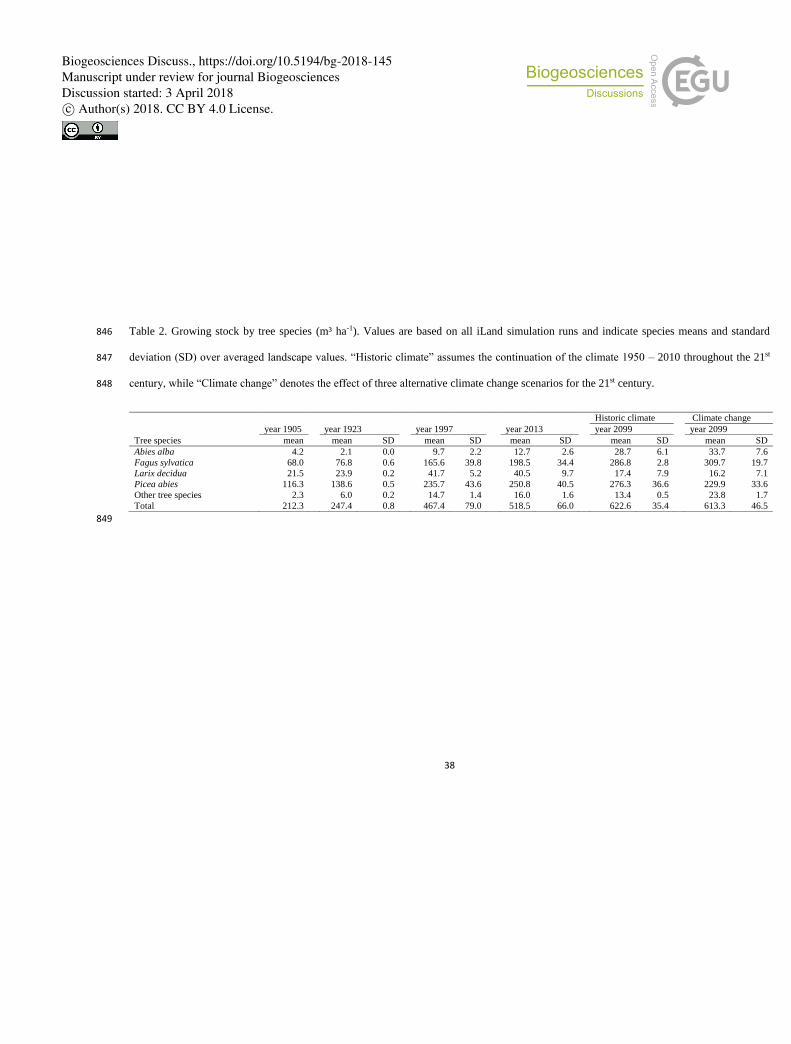
38
Table 2. Growing stock by tree species (m³ ha-1). Values are based on all iLand simulation runs and indicate species means and standard 846
deviation (SD) over averaged landscape values. “Historic climate” assumes the continuation of the climate 1950 – 2010 throughout the 21st 847
century, while “Climate change” denotes the effect of three alternative climate change scenarios for the 21st century. 848
Historic climate Climate change
year 1905 year 1923 year 1997 year 2013 year 2099 year 2099
Tree species mean mean SD mean SD mean SD mean SD mean SD
Abies alba 4.2 2.1 0.0 9.7 2.2 12.7 2.6 28.7 6.1 33.7 7.6
Fagus sylvatica 68.0 76.8 0.6 165.6 39.8 198.5 34.4 286.8 2.8 309.7 19.7
Larix decidua 21.5 23.9 0.2 41.7 5.2 40.5 9.7 17.4 7.9 16.2 7.1
Picea abies 116.3 138.6 0.5 235.7 43.6 250.8 40.5 276.3 36.6 229.9 33.6
Other tree species 2.3 6.0 0.2 14.7 1.4 16.0 1.6 13.4 0.5 23.8 1.7
Total 212.3 247.4 0.8 467.4 79.0 518.5 66.0 622.6 35.4 613.3 46.5
849
Biogeosciences Discuss., https://doi.org/10.5194/bg-2018-145Manuscript under review for journal BiogeosciencesDiscussion started: 3 April 2018c© Author(s) 2018. CC BY 4.0 License.
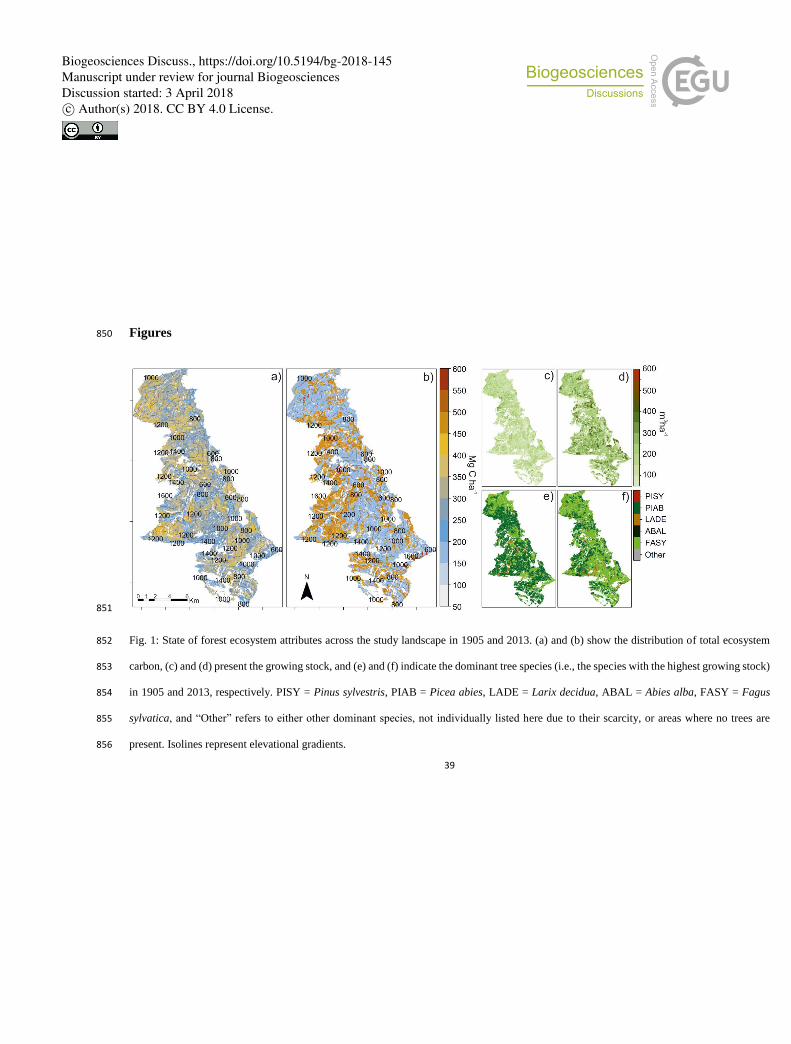
39
Figures 850
851
Fig. 1: State of forest ecosystem attributes across the study landscape in 1905 and 2013. (a) and (b) show the distribution of total ecosystem 852
carbon, (c) and (d) present the growing stock, and (e) and (f) indicate the dominant tree species (i.e., the species with the highest growing stock) 853
in 1905 and 2013, respectively. PISY = Pinus sylvestris, PIAB = Picea abies, LADE = Larix decidua, ABAL = Abies alba, FASY = Fagus 854
sylvatica, and “Other” refers to either other dominant species, not individually listed here due to their scarcity, or areas where no trees are 855
present. Isolines represent elevational gradients. 856
Biogeosciences Discuss., https://doi.org/10.5194/bg-2018-145Manuscript under review for journal BiogeosciencesDiscussion started: 3 April 2018c© Author(s) 2018. CC BY 4.0 License.
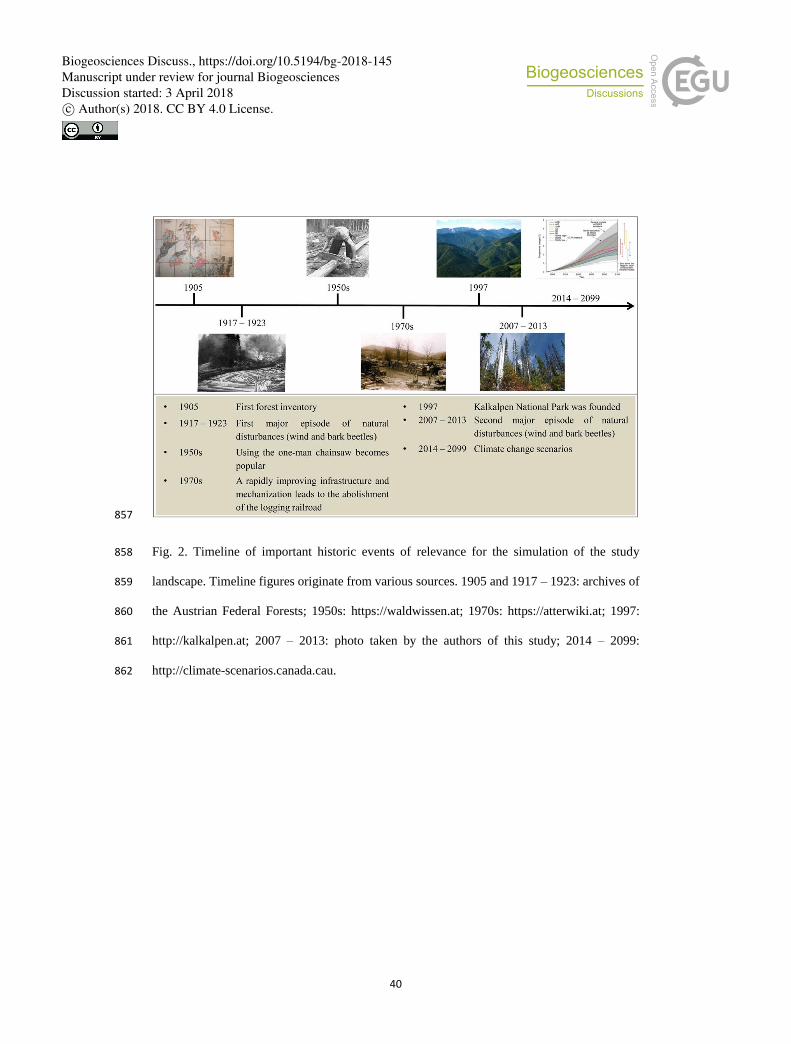
40
857
Fig. 2. Timeline of important historic events of relevance for the simulation of the study 858
landscape. Timeline figures originate from various sources. 1905 and 1917 – 1923: archives of 859
the Austrian Federal Forests; 1950s: https://waldwissen.at; 1970s: https://atterwiki.at; 1997: 860
http://kalkalpen.at; 2007 – 2013: photo taken by the authors of this study; 2014 – 2099: 861
http://climate-scenarios.canada.cau. 862
Biogeosciences Discuss., https://doi.org/10.5194/bg-2018-145Manuscript under review for journal BiogeosciencesDiscussion started: 3 April 2018c© Author(s) 2018. CC BY 4.0 License.
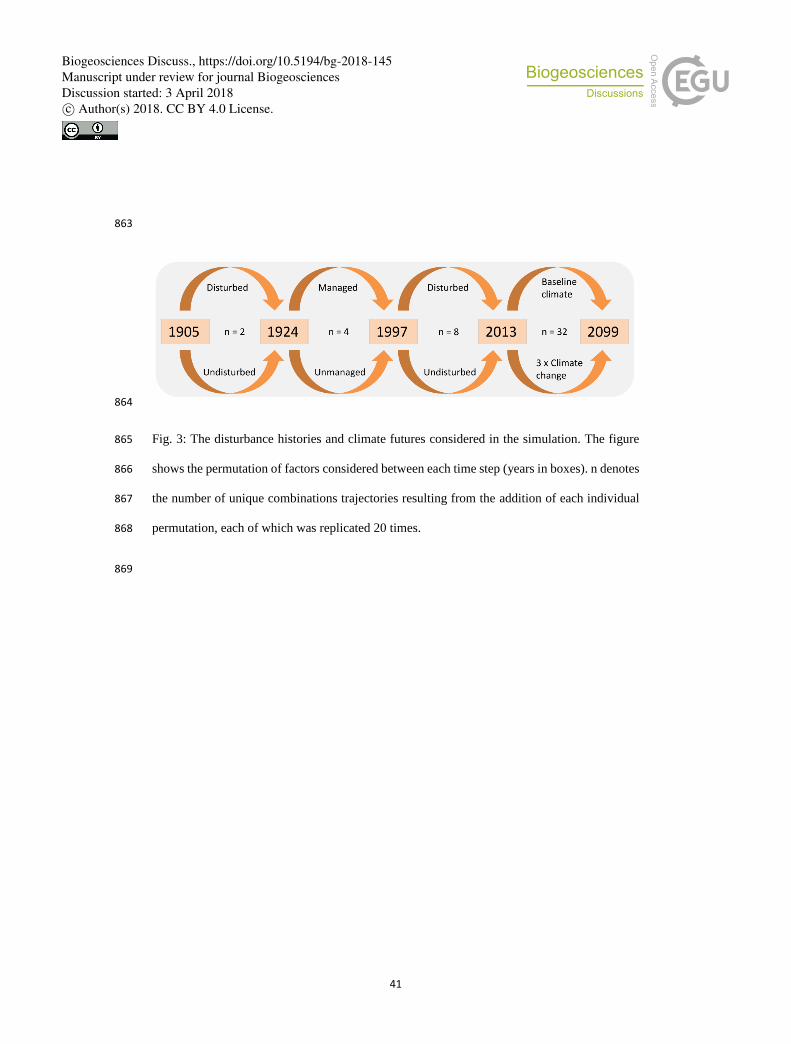
41
863
864
Fig. 3: The disturbance histories and climate futures considered in the simulation. The figure 865
shows the permutation of factors considered between each time step (years in boxes). n denotes 866
the number of unique combinations trajectories resulting from the addition of each individual 867
permutation, each of which was replicated 20 times. 868
869
Biogeosciences Discuss., https://doi.org/10.5194/bg-2018-145Manuscript under review for journal BiogeosciencesDiscussion started: 3 April 2018c© Author(s) 2018. CC BY 4.0 License.
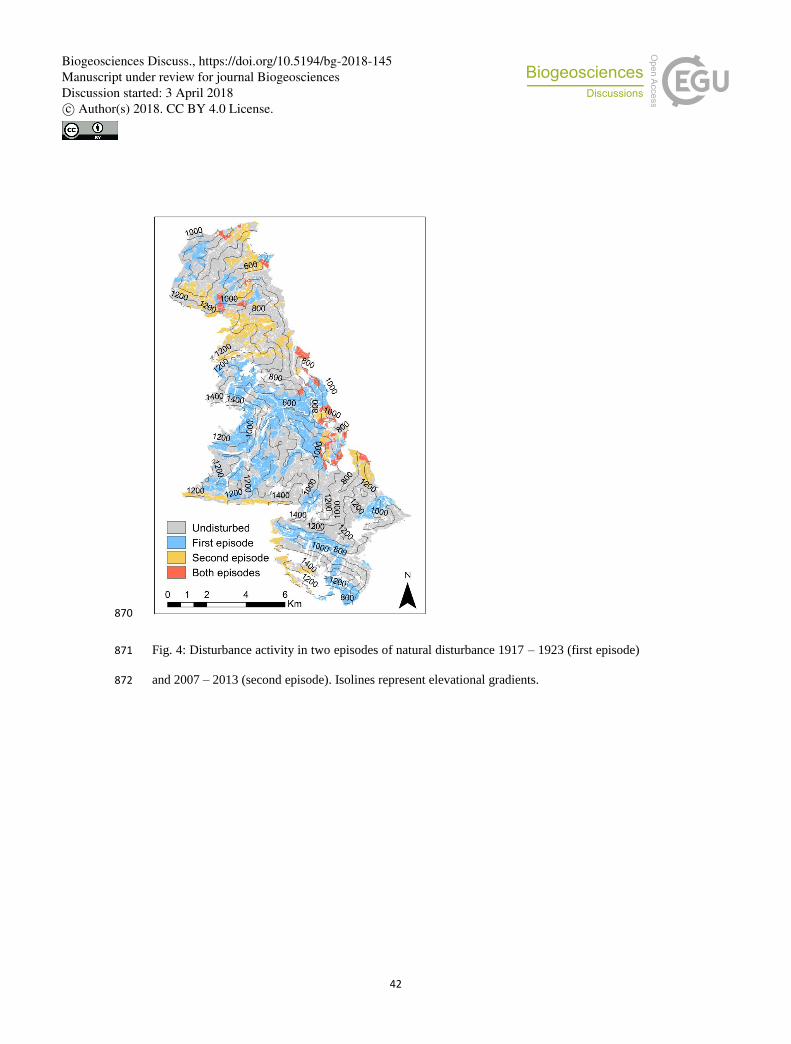
42
870
Fig. 4: Disturbance activity in two episodes of natural disturbance 1917 – 1923 (first episode) 871
and 2007 – 2013 (second episode). Isolines represent elevational gradients. 872
Biogeosciences Discuss., https://doi.org/10.5194/bg-2018-145Manuscript under review for journal BiogeosciencesDiscussion started: 3 April 2018c© Author(s) 2018. CC BY 4.0 License.
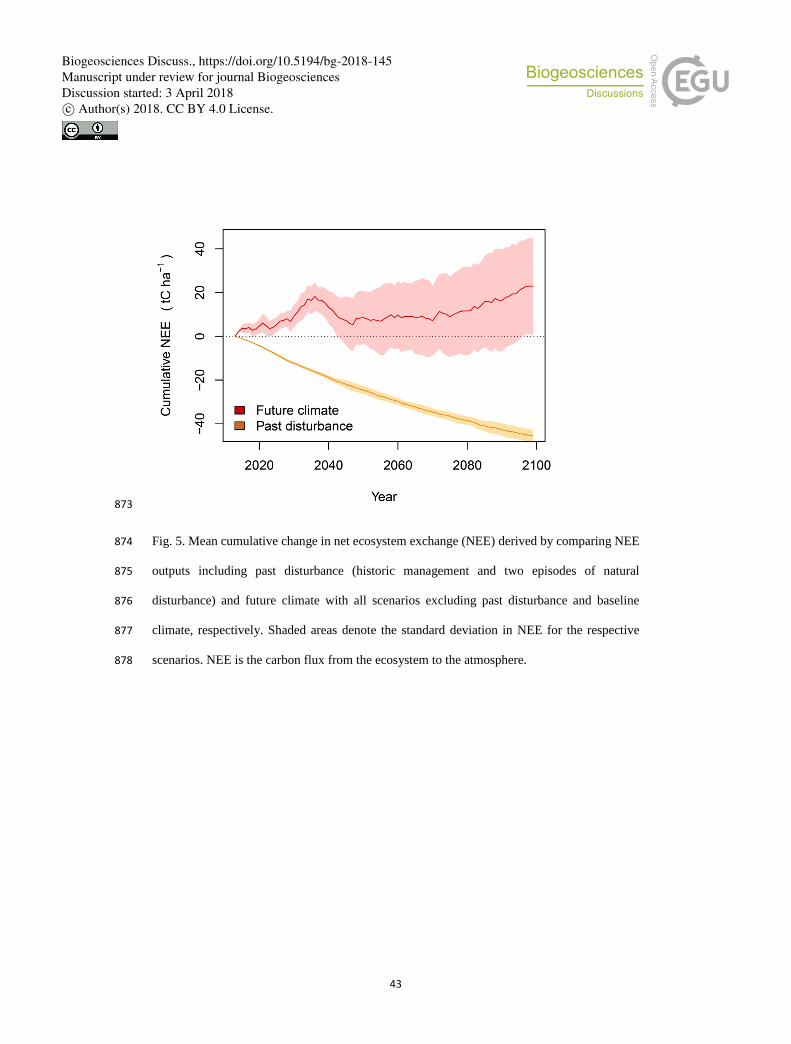
43
873
Fig. 5. Mean cumulative change in net ecosystem exchange (NEE) derived by comparing NEE 874
outputs including past disturbance (historic management and two episodes of natural 875
disturbance) and future climate with all scenarios excluding past disturbance and baseline 876
climate, respectively. Shaded areas denote the standard deviation in NEE for the respective 877
scenarios. NEE is the carbon flux from the ecosystem to the atmosphere. 878
Biogeosciences Discuss., https://doi.org/10.5194/bg-2018-145Manuscript under review for journal BiogeosciencesDiscussion started: 3 April 2018c© Author(s) 2018. CC BY 4.0 License.
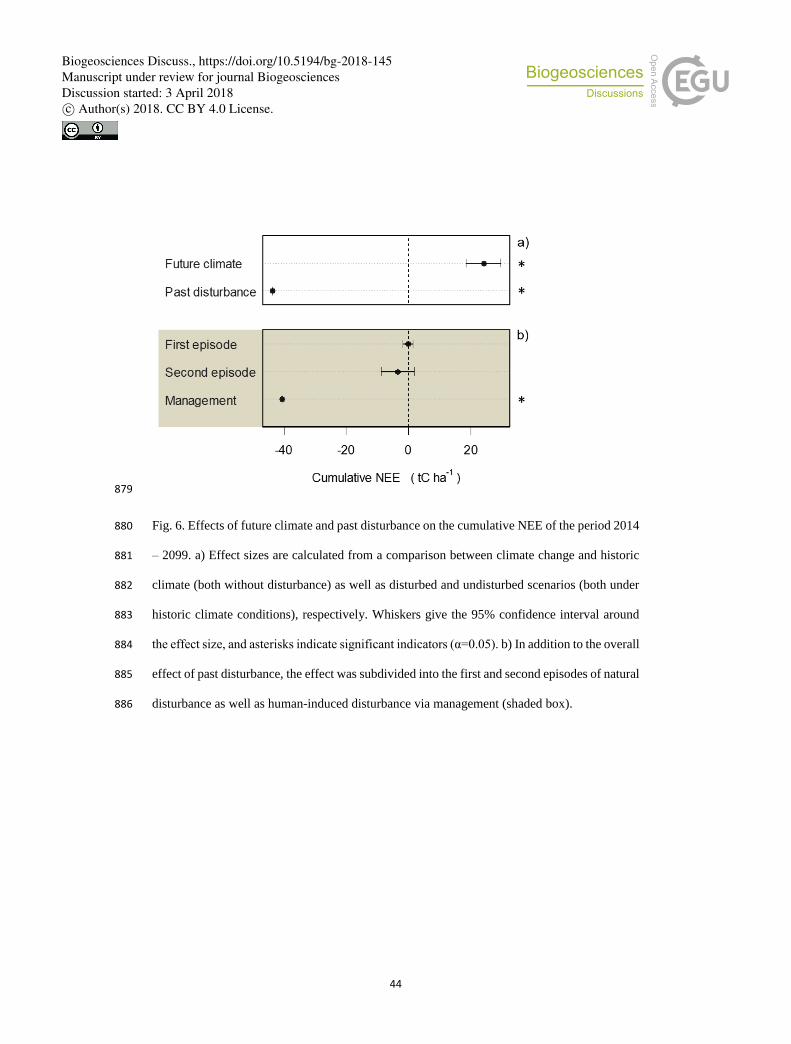
44
879
Fig. 6. Effects of future climate and past disturbance on the cumulative NEE of the period 2014 880
– 2099. a) Effect sizes are calculated from a comparison between climate change and historic 881
climate (both without disturbance) as well as disturbed and undisturbed scenarios (both under 882
historic climate conditions), respectively. Whiskers give the 95% confidence interval around 883
the effect size, and asterisks indicate significant indicators (α=0.05). b) In addition to the overall 884
effect of past disturbance, the effect was subdivided into the first and second episodes of natural 885
disturbance as well as human-induced disturbance via management (shaded box). 886
Biogeosciences Discuss., https://doi.org/10.5194/bg-2018-145Manuscript under review for journal BiogeosciencesDiscussion started: 3 April 2018c© Author(s) 2018. CC BY 4.0 License.