diuin paper serie - iza institute of labor economicsftp.iza.org/dp10554.pdf · diuin paper serie...
TRANSCRIPT

Discussion PaPer series
IZA DP No. 10554
Lyubov TsoyAlmas Heshmati
Impact of Financial Crises on Dynamics of Capital Structure: Evidence fromKorean Listed Companies
februAry 2017

Any opinions expressed in this paper are those of the author(s) and not those of IZA. Research published in this series may include views on policy, but IZA takes no institutional policy positions. The IZA research network is committed to the IZA Guiding Principles of Research Integrity.The IZA Institute of Labor Economics is an independent economic research institute that conducts research in labor economics and offers evidence-based policy advice on labor market issues. Supported by the Deutsche Post Foundation, IZA runs the world’s largest network of economists, whose research aims to provide answers to the global labor market challenges of our time. Our key objective is to build bridges between academic research, policymakers and society.IZA Discussion Papers often represent preliminary work and are circulated to encourage discussion. Citation of such a paper should account for its provisional character. A revised version may be available directly from the author.
Schaumburg-Lippe-Straße 5–953113 Bonn, Germany
Phone: +49-228-3894-0Email: [email protected] www.iza.org
IZA – Institute of Labor Economics
Discussion PaPer series
IZA DP No. 10554
Impact of Financial Crises on Dynamics of Capital Structure: Evidence fromKorean Listed Companies
februAry 2017
Lyubov TsoySogang University
Almas HeshmatiSogang University and IZA
AbstrAct
IZA DP No. 10554 februAry 2017
Impact of Financial Crises on Dynamics of Capital Structure: Evidence fromKorean Listed Companies*
This study examines the impact of 1997 Asian and 2008 Global financial crises on the
capital structure of Korean listed companies. Using a data set covering 1,159 Korean listed
non-financial firms from 10 industrial sectors over period 1985-2015, the pattern of firms’
capital structure before and after the crises is investigated and the speed of adjustment
toward the optimal leverage identified. Different effects of the two crises on both capital
structure and its adjustment speed is found. The average debt ratio fell significantly, the
distance between optimal and observed debt ratios shrank, while the speed of adjustment
increased twofold after the Asian crisis. Unlike the Asian crisis, the Global crisis of 2008
had a positive effect on companies’ debt ratio and the speed of their adjustment toward
optimal leverage. The empirical analysis revealed that Korean non-financial listed companies
on average decreased their debt ratios over the entire study period, with leverage being
highest before the Asian crisis and lowest after the Global financial crisis. The results also
show that the debt ratio of Korean chaebols is higher than that of non-chaebols. Moreover,
the high level of leverage is associated with tangible assets, income variability, size and age
of the firm, non-debt tax shield, and uniqueness.
JEL Classification: C33, D21, C51, E22, G32
Keywords: capital structure, optimal leverage, speed of adjustment, Korean listed companies, financial crises, chaebols
Corresponding author:Almas HeshmatiDepartment of EconomicsSogang UniversityBaekbeom-ro (Sinsu-dong #1), Mapo-guSeoul 121-742Korea
Email: [email protected]
* Comments and suggestions from Doyoung Kim and Jungsoo Park on an earlier version of this manuscript are gratefully acknowledged.

5
1. INTRODUCTION
South Korea has recently suffered from two financial crises: one from the Asian crisis of
1997, which originated in Thailand with the financial collapse of the Thai baht, and the
other from the 2008 global financial crisis, which started as US housing market crisis and
spread across both advanced and developing countries.
Structural weaknesses of the economy, such as the attempt to sustain Korea Inc. model1
by a single ruling political party, credit-based financial system, government’s failure to
manage foreign exchange market, depreciation of the Korean won, liquidity crisis in
banking sector, excessive leverage and bankruptcies of large conglomerates, starting
from Hanbo Group in 1997, and their adverse effect on financial institutions are some of
the causes of the financial crisis and the collapse of the Korean economy in 1997 (Hunter
et al., 1999; Kim, 2003; Park, 2004; Kim, 2014). The period of 1997-1998 was by far the
most traumatic event to affect Korean economy since its rapid economic growth and
development from the early 1960s. In November 1997, Korea had to ask for assistance
from the IMF. With the help of IMF and other multilateral institutions, Korea was able
to avoid sovereign default. In the aftermath of the crisis, Korea implemented many
institutional and policy reforms2. Chaebols, who always had a history of carrying heavy
debt burdens, had to reduce debt ratio and implement some corporate restructures and
improve corporate governance (Lee, 2000).
The global financial crisis of 2008 once again brought Korea to economic devastation.
Export-led economy was collapsing in 2008 with 3.7 billion dollars deficit of current
account and 2.5 billion dollars trade deficit in August 2008 (Kim, 2014). However, the
situation with excessive leverage of chaebols was better during the global financial crisis
than it was during the Asian crisis of 1997; many of the chaebols had even reduced their
debt-to-equity ratio much further than they were supposed to (Chekan, 2011).
Capital structure is an important issue not only to companies that try to maximize their
market value, but it is also significant during economic downturns; a wave of
bankruptcies of companies with excessive leverage as it was during the financial crisis
can lead a country to financial distress and sovereign default. Most of the previous
literature is about the theory of capital structure, namely trade-off theory and the pecking
order theory, which were tested in normal economic conditions. Only little empirical
research was done on the capital structure during financial crises.
What distinguishes this study from other literature is that the current study finds the
different behavior’s effects of the two financial crises. It shows the dynamics of the
capital structure choices of 1,159 Korean listed non-financial companies over a long
period of observation, between years of 1985 and 2015.
The above events gave a motivation to study the nexus between financial instability and
capital structure of Korean listed firms. How do Korean firms finance their business
operations? What does the pattern of capital structure of Korean listed companies’ look
like over a 31 year period? How do macroeconomic instabilities, like the financial crises
of 1997 and 2008, affect the decisions of companies to use debt? How does the debt ratio
vary across different industry sectors in Korea? What is the optimal debt ratio the firms
1 Economic development path which Korea had followed from the early 1960s up until the crisis in 1997. 2 See also Kim (2014).

6
should choose in order to increase their market value? What is the gap between the
observed and optimal debt ratio? What is the speed of adjustment process toward an
optimal capital structure? What are some time and firm-specific factors that influence
optimal capital structure and speed of adjustment, and what is their effect? The answers
to these questions are the main objectives of this study.
Similar empirical studies have tried to explain and analyze corporate capital structure
worldwide including effects of either Asian or Global financial crises. Kim et al. (2005)
using a model of dynamic capital structure, estimated optimal leverage and speed of
adjustment toward the optimal capital structure of Korean listed manufacturing
companies over the period of 1985-2002, that captured a negative effect of the Asian
crisis of 1997 on the debt ratio of Korean firms. However, the current study differs from
previous published empirical studies and from Kim et al. (2005) study insofar as it is the
first study that deals with a much bigger data set, covering 1,159 Korean listed non-
financial companies over a thirty one year period. In particular, this study covers the
period of 1985-2015, including and quantifying the effects two crises, both the Asian and
the Global crises, on Korean corporate capital structure with implications and policies.
The study is organized as follows. Section 2 presents a brief review of theories of capital
structure. Section 3 discusses empirical studies of capital structure. Section 4 presents
model and data used in the estimation, and explains the variables used for the
determinants of capital structure and speed of adjustment. Section 5 provides and
summarizes the results of the empirical study and, Section 6 concludes the study.
2. THEORIES OF CAPITAL STRUCTURE
Every company needs capital to operate its business. To expand its business not only in
the national market, but also globally, companies need large amounts of capital to pursue
raw materials, and advanced technologies to create more competitive products and
services that will be supplied in new markets realized by large investment projects.
Implementing such investment projects would then demand high capital that company
would need to raise either internally by issuing equities, or externally by borrowing debt
from financial institutions, or by a combination of both equities and debt.
Capital structure, defined as a mixture of debt and equity that company needs to operate,
is one of the most crucial problems of any firm, because its market value depends on the
capital structure of the firm. Before managers and stakeholders of the company make
decisions over what proportion of debt and equity to choose, they have to think about
different factors: What proportion of debt and equity is better to use in order to increase
firm’s value? Should the proportion of equity be more than debt in order to avoid risk of
debt and bankruptcy? How much debt do firms have now and how easy will it be to
acquire debt? How costly will the funding be during macroeconomic downturns?
The central topic of the capital structure is whether the optimal capital structure exists.
Optimal capital structure is defined as a ratio of debt and equity that maximizes the
market value of the firm by minimizing the cost of the capital. The modern theory of
capital structure begins with the Modigliani and Miller (hereafter MM) proposition of
1958. Under assumptions that there are no taxes, as well as no bankruptcy and transaction
costs, the Modigliani and Miller theorem states that capital structure is independent from
the market value of the firm. The proposed paper was criticized and failed under a capital
7
market with imperfections and taxes. A growing published capital structure literature
with empirical studies was proposed to explain the variation in debt ratios across firms
and countries. Financial economists tried to explain the irrelevance of the MM theorem,
but there is still no comprehensive theory of capital structure that would incorporate all
empirical studies.
This section will briefly review three main theories of capital structure, namely the
Modigliani and Miller, the trade-off, and the pecking order theories.
2.1 The Modigliani and Miller Theory
The starting point of the modern theory of capital structure begins in 1958 with the
irrelevance proposition of MM. MM model states that in a perfect capital market, the
market value of the firm is uncorrelated with its capital structure, meaning that the
optimal leverage doesn’t exist. However, developed in a tax-free world, MM model was
criticized and failed under variety of circumstances. In the real world taxes, bankruptcy
and transaction costs, agency conflicts, as well as adverse selection should be considered
as major explanations for the corporate choice to use debt financing.
The second corrected and proposed paper by Modigliani and Miller (1963) included
corporate taxes as a factor affecting capital structure choice. According to a new MM
model, capital structure with 100 percent of debt is considered to be optimal for a
company, meaning that the value of the firm increases with debt financing. They explain
this as, when the firm uses debt financing, the market value of the firm increases due to
the advantage that the debt serves to shield earnings from taxes which decreases the
average cost of capital. Therefore, it does not make any sense for the company to use
internal sources of financing. Although the revised MM model was criticized on the
grounds that it cannot be used in practice, because it does not take into account other
important factors affecting the capital structure, namely the cost of financial difficulties,
this model formed a basis for other developed theories of capital structure.
2.2 The Trade-off Theory
The trade-off theory is one of the most important theories of capital structure. Unlike the
revised MM model (1963), the trade-off theory considers various costs and benefits of
debt financing. According to trade-off theory, an optimal capital structure is a balance
between the benefit and cost of the debt (Kraus and Litzenberger, 1973). The benefit of
debt can include tax benefits that decrease cost of capital, while the cost of debt includes
bankruptcy cost from excessive use of debt, as well as agency costs resulting from
differences in the interests of principals and agents. Therefore the advantage of using
debt decreases with growing cost of expected bankruptcy and agency costs.
Bankruptcy costs of debt are the costs that occur with firm’s failure to pay back its debt
to creditors. The higher cost of debt can be associated with a company’s high level of
debt, which affects the probability and level of bankruptcy risk. Thus, the bankruptcy
costs negatively affect the total value of the firm and its performance.
The probability of risk can also be explained by firm specific determinants, such as size,
tangibility, and opportunity for growth. Large firms might have higher level of debt when
compared to small ones, because they are more diversified and usually have a lower risk

8
of bankruptcy. Companies with more tangible assets have smaller loss of value when
firms face financial distress. Firms may use tangible assets as collateral, which increases
access to credit, since the assets can be used as a guarantee in case of bankruptcy. Firms
with bigger growth opportunities tend to lose more of their value than non-growth firms
when they come into financial distress. Thus, according to trade-off theory a negative
relationship between leverage and growth is predicted.
Agency costs can arise when managers do not act in the best interests of shareholders
who also may not act in the best interests of creditors. The existence of such conflicts of
interest between shareholders and debtors can interrupt further investment, and thus, add
more costs in managing those difficulties. The cost of debtors can particularly occur in
vulnerable situations, e.g. bankruptcy, when shareholders tempt to maximize their own
interests rather than maximize the total value of the firm.
2.3 The Pecking Order Theory
The second important theory of capital structure is the pecking order theory that was
developed by Myers and Majluf (1984). This theory originated from the problem of
uncertainty about the quality of investment and products. The pecking order theory states
that a company prefers internal financing over external funding.
While the trade-off theory is concentrated on the optimal leverage by balancing the
benefits and cost of debt, the pecking order theory suggests that firm has no optimal
leverage ratio that maximizes its entire value. The pecking order theory argues that the
choice of the capital structure depends on the information asymmetry between firm’s
managers and investors. Asymmetric information can vary among companies and can
occur when different parties have different information.
According to the pecking order theory, firms with tangible assets have less debt ratio
because such firms have less information asymmetry, which reduces the cost of equity.
The theory assumes a positive relationship between growth opportunity and leverage
(Myers and Majluf, 1984), and positive relationship between income variability and debt
ratio of the firm due to the adverse selection (Frank and Goyal, 2009). The pecking order
theory also assumes that companies with more profits have more internal resources to
finance projects, and thus would less use debt financing compared to firms with fewer
profits.
Two main competing influential theories of capital structure, namely the trade-off theory
and the pecking order theory were reviewed in this section. Baker and Martin (2011)
provide detailed description of theories of capital structure. The next section will provide
review of empirical findings and examine the support they offer for the two theories.
3. REVIEW OF EMPIRICAL STUDIES OF CAPITAL STRUCTURE
3.1 Determinants of capital structure
Many published empirical studies tried to determine whether companies across the world
follow the trade-off theory or the pecking order theory. Their analysis was done by
determining the factors that affect the firms’ capital structure, and interpreting the
relationship between these factors with the debt financing in favor of the existing theories

9
of capital structure (Fischer et al., 1989; Rajan and Zingales, 1995; Shyam-Sunder and
Myers, 1999; Fama and French, 2002; Barclay, Morellec, and Smith, 2006; de Haas and
Peeters, 2006; Lemmon, Roberts and Zender, 2007; Frank and Goyal, 2009). The main
implication of these studies was to explain debt ratios in companies using firm specific
characteristics, such as bankruptcy cost, agency costs, size of the company, growth
opportunity, asset structure, tax benefit, etc.
Most of the empirical literature found a negative relationship between income variability
and leverage (Harris and Raviv, 1991; Kim et al., 2005; Frank and Goyal, 2009), a
negative correlation between company’s growth opportunity and leverage (Titman and
Wessels, 1988; Rajan and Zingales, 1995; Heshmati, 2002), a positive relationship
between leverage and tangibility (Myers and Majluf, 1984; Titman and Wessels, 1988;
Heshmati, 2002; Frank and Goyal, 2009), a positive impact of size of the firm on its
leverage (Jensen and Meckling,1976; Titman and Wessels, 1988; Rajan and Zingales,
1995), a negative relation between profitability and leverage (Myers and Majluf, 1984;
Rajan and Zingales, 1995; Banerjee et al., 2004), a negative effect of non-debt tax shield
on leverage (Heshmati, 2002), a negative correlation of a firm’s uniqueness and debt
financing (Titman and Wessels, 1988). Kim et al. (2005) found a positive relationship
between chaebol affiliation and firms’ debt ratio.
Some recent empirical research focuses on explaining the variation of leverage ratios
across firms and countries. Kim et al. (2005) based on a sample of Korean listed
companies, developed a model of dynamic capital structure choice, and estimated the
unobservable optimal capital structure using observable determinants of leverage. Kim
et al. (2005) assumes that factors such as uniqueness, industrial sector, and trend may
cause companies to deviate from their optimal leverage. Intangible assets, current
liabilities, crises, and investments may affect the speed at which the companies adjust
toward the optimal capital structure, which maximizes its market value.
3.2 Financial Crises and Capital Structure
Financial distress and bankruptcies of firms during financial crises formed a basis for
existing empirical studies in investigating the effect of financial crisis on capital structure
of companies worldwide (e.g., Demirguc‐Kunt et al., 2015).
In this section some empirical studies that try to explain the effects of financial crisis on
the capital structure of firms in different geographical regions is reviewed. Although in
most of the empirical studies, the effect of either the Asian crisis of 1997 or the Global
financial crisis of 2008 on leverage of firms is negative, there were only few studies that
did not find the effect significant.
Kim et al. (2005) estimated the effect of the Asian crisis of 1997 on the capital structure
and speed of adjustment of Korean listed companies. Using the dynamic model of capital
structure, they found that optimal capital structure was negatively affected by the crisis.
They also show that the mean adjustment speed significantly decreased after the 1997
crisis, indicating that firms had financial difficulties after the crisis.
Zeitun et al. (2016) showed the negative and significant impact of the 2008 global
financial crisis on the capital structure of 270 listed firms in Gulf Cooperation Council
countries over the period 2003-2013. The results of their study show that the adjustment

10
speed toward optimal leverage is on average slower after the crisis, and assumed that it
was due to the lack of debt financing supply.
Trinh and Phuong (2015) investigated the effects of the financial crisis on the capital
structure of listed firms in Vietnam over the period of 2006-2013. They found no
evidence to claim that the debt ratio of Vietnamese firms significantly changed during
the crisis period. They explained this result by stating that the financial market in
Vietnam has not integrated much into the global market, and that the financial system is
well controlled by the government.
Akbar et al. (2013) examine the effect of shock to the supply on the financing and
investment policies of private firms in the UK during period of 2007-2009. Using a fixed
effects model, they found empirical evidence that the crisis adversely affected the
leverage ratio of private companies. The crisis was significant and had negative effect on
the short term financing channels, specifically short term debt and trade credit, which
makes private firms hold cash and issued equity for hedging the negative effect of
contradiction.
Deesomsak et al. (2004) investigated the determinants of the capital structure of firms
operating in the Asia Pacific region, in four countries with different financial
environments, namely Thailand, Malaysia, Singapore, and Australia. The results showed
that the capital structure was influenced by the environment the firms operate in, and
some firm-specific factors. They also found that the financial crisis of 1997 had a
significant but diverse effect on firms’ capital structure decisions across four countries.
The debt ratio of Thailand, Singapore, and Malaysia significantly increased after the
crisis of 1997. The average debt ratio of Singapore firms declined in 2000, whereas the
debt ratio of firms in Thailand and Malaysia was still around the level of 1998. The
average debt ratio of firms in Australia was found to be constant during the entire period
of observation. The authors suggest that the Australian stock market was not as directly
affected by the crisis as it was in the other three countries, and the constant rate of debt
ratio can be due to a high legal protection of shareholders.
4. DATA, MODEL AND ESTIMATION
4.1 Data
The data used in the empirical analysis is based on the financial statements of Korean
listed companies, collected from Data Guide database. Financial institutions, namely
banks, diversified financials, insurance companies and real estates were excluded
because their capital structure is different from, and not comparable with, non-financial
ones. This study initially started out with 1,241 companies, but after excluding financial
institutions the sample was totaled 1,159 firms. The data set is unbalanced and contains
21,714 observations. The estimated period is from 1985 to 2015, a thirty one year period,
which captures both the Asian 1997 and the Global 2008 financial crises.
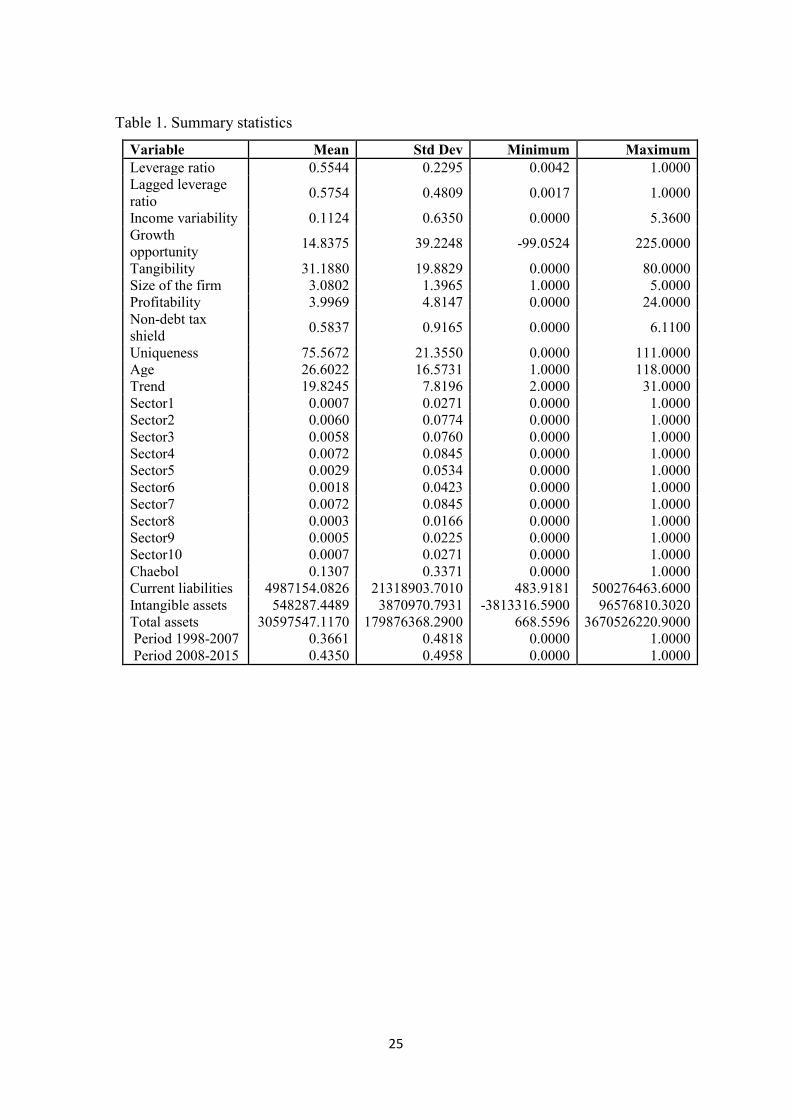
The data covers firms of different sizes and ages; the mean total assets of the firm is 30.6
trillion won, the average age of sample firms is 27 years (Table 1). All non-financial
listed companies were categorized into 10 industrial sectors shown in Table 2. Firms
were then classified into chaebol and non-chaebol, based on the information provided by

11
reports of Korea’s Fair Trade Commission (KFTC)3 on the thirteen largest business
groups from 1985 to 2000. The affiliation of these conglomerates varies every year, and
the definition of chaebol has also changed since 2001. Specifically, from year 2001, when
companies with total assets of more than 2 trillion won are considered to be chaebols.
[Insert Table 1 about here]
In order to estimate the effects of both the Asian and the Global financial crises, as well
as pattern of firms’ capital structure before and after the crises, and to identify the speed
of adjustment toward the optimal leverage, the whole period of observation was divided
into three periods: 1985-1997 is the period before the Asian crisis of 1997, 1998-2007 is
the period after the Asian crisis and the before global crisis, and 2008-2015 is the period
after the global financial crisis.
[Insert Table 2 about here]
4.2 Measurements of variables
4.2.1 Measurements of determinants of capital structure.
This study uses book value of leverage as a dependent variable, measured as the ratio of
total liability to total assets. Ten firm-time-specific and three time-specific explanatory
or control variables are used to examine whether the association between these
explanatory variables and the leverage were impacted by financial crises.
The firm-time-specific independent variables are income variability, growth opportunity,
tangibility, size, profitability, non-debt tax shield, uniqueness, chaebol affiliation,
industrial sector, and age of firm. The time-specific variables are the Asian crisis of 1997
and the global financial crisis of 2008, and time trend.
In this section measurements of independent variables as determinants of companies’
capital structures as reviewed in previous sections used in this study is provided.
Expected signs of each variable based on trade-off and pecking order theories on leverage
are presented in parenthesis.
1. Income variability (-,-)
Variance of operating income is used as a measure of income variability. The effect of
income variability on the leverage is expected to be negative because a higher volatility
of income is associated with higher probability of default on interest payment.
2. Growth opportunity (+,-)
The annual percentage change in total assets is used as a measure of growth opportunity.
According to trade-off theory, the correlation between growth opportunity and leverage
is expected to be positive, and negative according to the pecking order theory.
3. Tangibility (+,-)
The ratio of tangible assets to total assets is used as a measure of tangibility. Tangibility
is expected to be positively related to the leverage according to the trade-off theory, and
negatively according to the pecking order theory.
3 Each year, KFTC reports the 30th largest groups and firms that are affiliated with such groups.

12
4. Size (+,+)
In order to divide firms into five groups by size, total assets was used as a measure of the
size of the firm. The firms are grouped into: very small, small, medium, large and very
large. Each group consist of about 20% of the sample. The size classification is time-
variant. Leverage is positively related to size of firms.
5. Profitability (+,-)
The ratio of net income to total assets is used as a measure of profitability. A positive
correlation between profitability and leverage is expected according to the trade-off
theory, and negative according the pecking order theory.
6. Non-debt tax shield (-,-)
The ratio of depreciation to total assets is used as a measure of non-debt tax shield. A
negative effect of non-debt tax shield on leverage is expected. Kim et al. (2005) found a
negative impact of non-debt tax shield on the debt ratios of Korean listed companies.
However, Titman and Wessels (1988) did not have a significant impact of non-debt tax
shield on the leverage.
7. Uniqueness (-,-)
For uniqueness of a company’s assets, the ratio of cost of sales to net sales is used in
determining the correlation between uniqueness and leverage ratio. Firms with unique
products are expected to have a low debt ratio according to some existing empirical
literature, i.e. Kim et al. (2005) and Heshmati (2002).
8. Chaebol affiliation (+,+)
Originating in South Korea in the 1960s, chaebol refers to business conglomerates,
owned and controlled by the same family dynasty, and characterized by strong ties with
government agencies. From 1985 to 2000, following the definition of chaebol by Korea’s
Fair Trade Commission, value 1 is given to companies, belonging to the top thirteen
largest business companies, and 0 otherwise. From 2001 to 2015, value 1 is given to
companies whose total assets exceed two trillion won, and 0 to those whose total assets
do not. Correlation between chaebol affiliation with better access to external sources of
finance and leverage is expected to be positive as in Kim et al. (2005).
9. Industrial sector (-/+,-/+)
Industrials dummies are included in order to capture an industry heterogeneity effect that
might have been overlooked in the variables listed above. The sample companies,
according to industry classification, were grouped into the following ten sectors:
(1) Energy sector includes companies, engaged in exploration and development of oil
and gas reserves, storage and transportation of oil and gas, coal and consumable fuels, as
well as companies providing oil and gas equipment and services.
(2) Materials sector, which includes companies, engaged in manufacture of chemicals,
supply materials for construction, basic materials, forestry products, paper, and producers
of steel as well as metal and mining companies.
(3) Industrials sector, which includes companies engaged in manufacture and
distribution of capital goods such as building products, electrical equipment, machinery,
aircraft, and tools that organizations need to produce goods and services.
13
(4) Consumer Discretionary sector, which includes companies that provide products and
services that are not necessities. For example, manufacturing automobiles, production of
consumer durables and apparel; media and retailing, hotels, restaurants, and etc.
(5) Consumer Staples sector includes companies providing essential products such as
food, beverages and tobacco, household and personal products, and companies engaged
in food and staples retailing.
(6) Health Care sector includes companies offering health care equipment and services,
pharmaceuticals, biotechnology, and life sciences.
(7) Information Technology sector comprises companies providing software and
information technology services, as well as companies engaged in manufacture of
technology hardware and equipment and semiconductors.
(8) Telecommunication Services sector includes companies that provide wireless
communications, telecom services, and other diversified communication services.
(9) Utility sector includes companies engaged in delivering gas, water, and electricity
and other related services.
(10) Other sectors, includes companies providing other products and services that are not
described in above industry sectors.
10. Age (+/-,+/-)
Age of firm is measured in years from establishment year. A company can increase
leverage more over time in order to continue and increase the capacity of the business.
On the other hand, the longer the firm operates its business in the market, the more
internally it can accumulate profits and use them to replace debt financing. Thus, there
can be both positive and negative effects of age on a firms’ debt ratio.
11. Financial crises (-,-)
In order to capture financial crises, period dummies (1985-1997), 1998-2007, 2008-2015)
was given for years before and after Asian financial crisis and after Global financial crisis.
According to Kim et al. (2005), the Asian crisis of 1997 had a negative impact on the
leverage of Korean listed, and suggest that it was due to a tighter credit policy that made
difficult and costly for companies to use debt financing.
12. Time trend (-,-)
Time trend is used to capture variation in firms’ leverage over time. Leverage can either
increase or decrease over time. However, because the observed period includes two crises,
namely the Asian financial crisis of 1997, as well as the global financial crisis of 2008,
the expected effect is found to have a negative sign; that is, leverage is expected to
decrease especially after the crisis.
4.2.2 Measurement of Determinants of Speed of Adjustment
The debt ratio is associated with both time and firm specific factors discussed in the
previous section. In this section some of the few factors that affect companies’
adjustment speed toward an optimal leverage ratio are presented.

14
1. Distance (-)
As in Kim et al (2005), the absolute value of the difference between optimal leverage
and observed leverage, │Lit* - Lit│ is used as a measure of distance. A positive
relationship between distance and speed of adjustment is expected, because firms with
debt ratio lower than optimal would change their capital structure only if they are
sufficiently far away from the optimal capital structure.
2. Current liabilities (+)
The ratio of current liabilities to total liabilities is used to measure current liabilities.
Following Kim et al. (2005), firms with a high level of short-term debt have the ability
to adjust to a new level of leverage easier and faster than firms with a lower level of
short-term liabilities, because short-term liabilities, relative to the long term, can be easily
raised or paid-off.
3. Intangible assets (-)
In the model, a log of intangible assets is used as a measure of intangible assets. A firm
with more intangible assets is expected to adjust to an optimal level slower than a firm
with more tangible assets.
4. Growth opportunity (+)
Annual percentage change in total assets is used as a measure of growth opportunity. A
positive relation is expected to be between a firm’s growth opportunity and the
adjustment process, because growing firms may find it easier to change their capital
structure by choosing the source and composition of financing.
5. Profitability (+/-)
The ratio of net income to total assets is used as a measure of profitability. Profitability
is expected to have both negative and positive effects on the adjustment process, as it has
had on the debt ratio.
6. Financial crisis (-)
The crisis variable is included because a direct and clear effect on both optimal leverage
and speed of adjustment is expected. After the crisis, the speed of adjustment is expected
to slow down somewhat, because raising debt is expected to become more difficult.
7. Time trend (-)
It is possible that speed of adjustment firms’ leverage can vary over time when taking
into consideration two crises. Time trend is used to examine variation in the speed of
adjustment of sampled firms over time. Negative correlation between trend and speed of
adjustment is expected according to Kim et al. (2005).
4.3 Model and estimation
Empirical analysis in this study is made using a dynamic panel data model. In order to
formulate this model, using firm-specific and time-specific variables, we will distinguish
functions of optimal leverage and speed of adjustment as in Kim et al. (2005). The
optimal leverage denoted by Lit* for firm i at time t, can be written as a function of

15
explanatory variables of optimal leverage, as well as firm-specific and time-specific
variables:
(1)
where Xit represents determinants of optimal leverage that vary across firms and time, Xi
is a vector of firm-specific variables that are constant over time, and Xt is a vector of
time-specific variables that are constant across firms. Dummy variables are included in
the model to capture unobservable firm-specific and time-specific heterogeneity effects.
Under ideal conditions, the observed leverage should be equal to optimal leverage that
can be written as:
(2)
Subtracting the observed leverage from a previous period can be written as follows:
(3)
Because the process of adjustment from one state to another can be costly for a company,
there can be cases when firms might find it easier and less expensive to adjust gradually.
By introducing δit, adjustment factor, specifically a speed of changing from observed
leverage Lit to its optimal value Lit*, a partial adjustment model developed by Kim et al.
(2005) is used:
(4)
On the other side, economic conditions can change and make companies lessen the
demand for debt. Also developed by Kim et al. (2005) let the function of the speed of
adjustment process, , be a function of some variables affecting the adjustment cost:
(5)
where Zit is a vector of the determinants of speed of adjustment, that are changing both
over time and across firms, Zi and Zt, are vectors of observable variables, that are firm-
specific and time-specific, respectively. Dummy variables are included to capture the
unobservable firm-specific, time specific and other adjustment heterogeneity effects.
By rearranging Equation (4) and adding error term εit, it can be written as the following
equation:
(6)
where the optimal leverage Lit* is estimated by using observables as
(7)
and the speed of adjustment is specified in terms of observables as
(8)
In the purpose of comparison, the standard static model will be used in the analysis of
capital structure:
(9)
After estimation of optimal leverage and observed leverage, the degree of optimality of
leverage can be found as:
mtmm
ss
jitjj
it XXXL α+α+α+α= ∑∑∑ si0*
mtm
m
s
s
jitj
j
it si0
*
itit LL
1
*
1 itititit LLLL
),,(=*tiitit XXXFL
)( 1
*
1 ititititit LLLL
itit LL /*
itititititit LLL
*
1)1(
),,(Ρ=δ tiitit ZZZ
itmtm
m
s
s
jitj
j
it XXXL si0

16
(10)
The optimality ratio is equal to1 if the firm is at its optimal leverage at time t, thus Lit=Lit*.
Optimality ratio is restricted to being non-negative.
The dynamics model in equation (6) is jointly estimated with equations (7) and (8). The
static model is used for comparison with the dynamic model, expressed as equation (9),
and is linear in its parameters; least squares is used for its estimation. On the other hand,
the dynamic model is nonlinear in its parameters. The system estimation is iterative and
at convergence it is equivalent to the maximum likelihood estimation method.
5. EMPIRICAL RESULTS
This section will present and discuss the empirical results on 1,159 Korean listed
companies obtained from estimating the static and dynamic models described in Section
4. The results for each of the model will be compared in order to choose the one that
provides a better explanation.
First, the values of coefficient of determination (R2) and the root mean squares error
(RMSE) were examined in order to compare the static model, the restricted dynamic, and
the unrestricted or flexible dynamic models. The value of RMSE for the dynamic
unrestricted model, with flexible adjustment speed parameters, was 0.1088 and the value
for R2 was 0.7751. The values for RMSE and R2 for the restricted dynamic model with a
constant speed of adjustment were 0.1696 and 0.4535 respectively, while for static model
the value of RMSE was 0.1870 and R2 was 0.3357 (see Table 4). Without considering
some coefficients with statistically insignificant signs, the dynamic unrestricted model
with the lowest value of RMSE and highest R2 offers a better fit for analyzing capital
structure and provides a better explanation in the variation of debt ratios of Korean non-
financial listed companies. Table 1 presents a summary statistics of dependent and all
independent variables for the entire sample period. The sample mean value of debt ratio
was 55.4 percent and had a standard deviation of 23 percent.
[Insert Table 3 about here]
5.1 Summary of financial crises effects on capital structure of firms
Table 4 shows that the effects of the 1997 Asian and the 2008 global financial crises on
both the debt ratio of sampled Korean companies and their speed of adjustment toward
optimal leverage over the observation period are both significant at 1-percent level of
significance and they have different signs. The Asian financial crisis negatively impacted
the debt ratio of Korean non-financial companies, whereas the global financial crisis
impacted it positively. The effect of the two financial crises on the adjustment speed is
consistent with the effect on the debt ratio: the 1997 financial crisis negatively impacted
the speed of adjustment whereas the global financial crisis of 2008 had a positive effect
on the speed.
[Insert Table 4 about here]
The speed of adjustment was low during the Asian financial crisis and high during the
global financial crisis. This can be explained as a tighter financial environment during
the Asian crisis. Panel 1 of Table 5.1 shows that Korean companies were overleveraged

17
from the beginning of the period: the observed debt ratio was much higher than the
optimal one from 1986 to 1996, and it was even almost 40 percent higher than the optimal
leverage. The observed debt ratio reached an optimal ratio after 2000, and since then, the
mean distance between the optimal and the observed debt ratios was less than it was from
that in 1986-1996. This can be due to many corporate restructuring policies implemented
right after Asian financial crisis. The speed of adjustment in 1997 was the slowest during
the whole period of observation. The mean speed of adjustment fell from 0.078 in 1996
to 0.027 in 1997. On the other hand, the speed of adjustment increased during the global
financial crisis; it rose from 0.102 in 2007 to 0.193 in 2008.
Panel 2 of Table 5.1 shows that the mean of the observed debt ratio fell significantly from
70 percent to 52.2 percent after the Asian financial crisis, and decreased slightly from
52.2 percent to 50.3 percent after the global financial crisis. The mean optimal leverage
before 1997 was 60.7 percent. After 1997’s Asian financial crisis and before the global
financial crisis, it dropped to 51.9 percent; the mean optimal leverage slightly decreased
after 2008 to 50.3 percent. However, the mean optimality ratio increased from 86.8 to
99.5 percent after the Asian financial crisis, and dropped from 99.5 to 98.9 after the
global financial crisis. This can be explained with the mean delta or adjustment parameter,
which increased almost twice after the Asian financial crisis and decreased slightly from
10.7 to 10.5 percent after the global financial crisis (Figure 1).
[Insert Figure 1 about here]
5.1.1 Determinants of optimal leverage
Income variability was expected to be negative according to trade-off theory. Companies
with higher income volatility have a higher probability of default, and therefore a higher
cost of financial distress (Frank and Goyal, 2009; Kim et al., 2005). However the results
show that income variability was statistically insignificant when correlated with debt
ratio by static and restricted dynamic models; but it was found to have a positive effect
on debt ratio for unrestricted dynamic model. The value of the coefficient was
statistically significant at a 1 percent level. The positive relationship of income variability
with leverage supports the pecking order theory which suggests that firms with volatile
earnings suffer more from adverse selection (Frank and Goyal, 2009).
According to the trade-off theory of capital structure, a company’s growth opportunity is
negatively correlated with a firm’s leverage ratio. The empirical results show a
statistically negative relationship between growth and debt ratio for both the static and
the restricted dynamic model, and had the same parameter value of (-0.0001), but it had
an insignificantly positive correlation in the unrestricted dynamic model.
Tangibility had positive and statistically significant sign in flexible the dynamic model,
with a value of 0.0009. In the static and unrestricted dynamic models the parameter of
tangibility was also statistically significant, but it had a negative effect on the debt ratio
of sampled Korean companies.
In the estimation result, the effect of the size of the firm, measured as logarithm of total
assets, had a positive and statistically significant effect on the leverage over all three
models. This supports trade-off theory, and can be explained as bigger companies have
lower probability of default and thus, lower financial distress, which makes them easier
18
to raise debt compared to small firms. The same positive effect of size on the leverage
was found in study by Psilakki and Daskalakis (2009).
Profitability showed a negative relationship with debt ratio over all three models. A
negative relationship between profitability and leverage is one of the most consistent
findings in capital structure research (Myers and Majluf, 1984; Rajan and Zingales, 1995).
The empirical results show that the coefficients were negative and statistically significant
at 1 percent level of significance with values -0.01370, -0.01520, and -0.0181 for the
static, restricted, and unrestricted dynamic models respectively. Such negative effects of
profitability on debt ratio can be explained by pecking order theory, assuming that firms
with large profits have more internal resources to finance company’s projects.
The effect of a non-debt tax shield on leverage was found to be positive and highly
statistically significant for all three models, with coefficient values of 0.0127, 0.0080 and
0.0399 for the static, restricted, and flexible dynamic models, respectively. The positive
relationship is consistent with the predictions of the pecking order theory and explained
as a tax shield benefit, generated from the deduction of interest expense.
The empirical results show a positive relationship between uniqueness and debt ratio for
all three models. The coefficients at a 1 percent level of significance were 0.0011 for
both the static and the restricted dynamic model, and 0.0014 for the unrestricted dynamic
model. This result is inconsistent with Titman (1984), arguing that since the firm with
unique characteristics cannot be easily replaced in the market, a firm bankruptcy will be
highly avoided by suppliers, customers and workers, thus making the firms lower the
debt ratio.
The age of the firm was found to be significantly negatively correlated with debt ratio
for the static and the restricted dynamic models with values -0.0004 and -0.0006,
respectively. For the unrestricted dynamic model, the age had a positive and statistically
significant effect on the leverage ratio of the firm. A positive sign of age is consistent
with Heshmati (2002). Chaebol affiliation had a positive impact on the debt ratio of
sampled Korean firms over all three models. The coefficient was significant at a 1 percent
level of significance with the values 0.0363, 0.0215, and 0.1208 for the static, restricted
and flexible models, respectively. This can be explained by chaebols historically being
supported by the government since they had better access to borrowing money at a lower
rate than non-chaebols.
The time trend variable, as it was expected to be negatively correlated with the debt ratio,
had a negatively statistically significant effect on the leverage for the three models. The
negative effect can be explained by both 1997’s Asian crisis and the global financial
crisis of 2008 causing adverse effects on the Korean credit market. Half of the industrial
sector effects were statistically significant in all three models and had a negative effect
on debt ratio.
5.1.2 Determinants of speed of adjustment
As variation in the debt ratio across firms can depend both on firm- and time-specific
factors, the optimal leverage ratio can also vary among firms. As described previously,
the speed of adjustment was estimated by firm-specific and time-specific factors. Below
we will describe the factors which affect a company’s speed of adjustment toward an
optimal debt ratio. Table 4 represents the determinants of speed of adjustment. All the

19
variables were statistically significant at a 1 percent level of significance but had a
different effect on companies’ speed of adjustment toward an optimal ratio.
The distance, measured as the absolute difference between optimal leverage and
observed leverage, was expected and found to have a positive effect on speed of
adjustment. This can be interpreted as the firms which are far from the optimal leverage
find it costly to adjust over a long period of time, so they try to adjust faster than those
who are already close to the optimal leverage.
Current liabilities were expected to be positively related with speed of adjustment.
However, the empirical results show that current liabilities had a negative effect on the
speed of adjustment. The correlation matrix shows that current liabilities are positively
correlated with debt ratio. So, the firms with short term liabilities possess a higher debt
ratio, and thus find it easier to adjust toward optimal leverage in a short period.
Intangible assets had a negative sign, with a coefficient value -0.0018. Because the speed
of adjustment is positively related to tangible assets, intangible assets are expected to
have a negative effect on adjustment speed toward optimal leverage. Therefore, the more
the firm has intangible assets, the slower it will adjust its capital structure to an optimal
level.
Although the growth opportunities had a statistically insignificant positive effect on the
company’s debt ratio, the empirical results show that firms with more growth opportunity
adjust faster towards an optimal ratio than those with low growth.
A negative effect of profitability on debt ratio was explained by the pecking order theory
that firms with large profits have more internal resources to finance companies’ projects.
The effect of profitability on the speed of adjustment was also negative with a coefficient
value of -0.0081.
Time trend showed a positive effect on the speed of adjustment with a coefficient value
of 0.0967. This result is inconsistent with Kim et al. (2005). This can be due to a larger
period of observation and a consideration of two crises, each of which had different
effects on both leverage ratios and the speed of adjustment toward optimal debt ratio.
Table 5.2 contains mean values of observed and optimal leverages, as well as the distance
between them, the speed of adjustment toward an optimal leverage ratio, and an
optimality debt ratio by ten industrial sectors, by size of the firm, measured as logarithm
of total assets, and by chaebol affiliation, as well as sample mean and standard deviation.
Panel 3 shows that the mean of optimal and observed ratios as well as the speed of
adjustment varies across companies in different industrial sectors. It is noticeable that the
observed leverage was higher than optimal for companies in Energy, Materials,
Consumer discretionary, Utility, and other sectors. Companies belonging to Consumer
discretionary industrial sector adjust debt ratio toward optimal debt ratio four times faster
than companies in the Technology Information sector. The speed of adjustment for
companies providing utility services is the slowest among other sectors.
The size of the firm was positively correlated with the debt ratio. As panel 4 shows, the
bigger the company the bigger are observed and optimal leverages. However, the speed
of adjustment of small companies is higher than it is for bigger companies. This can be
explained as small companies find it costly to adjust in the long period, that’s why they
prefer to do it in the short period.

20
The mean observed and optimal leverage ratios of chaebol firms are higher than of non-
chaebols (panel 5). The mean speed of adjustment for chaebol over the sample period
was 0.044 which is more than twice as slow when compared with non-chaebols, which
recorded 0.102.
[Insert Table 5.1 about here]
[Insert Table 5.2 about here]
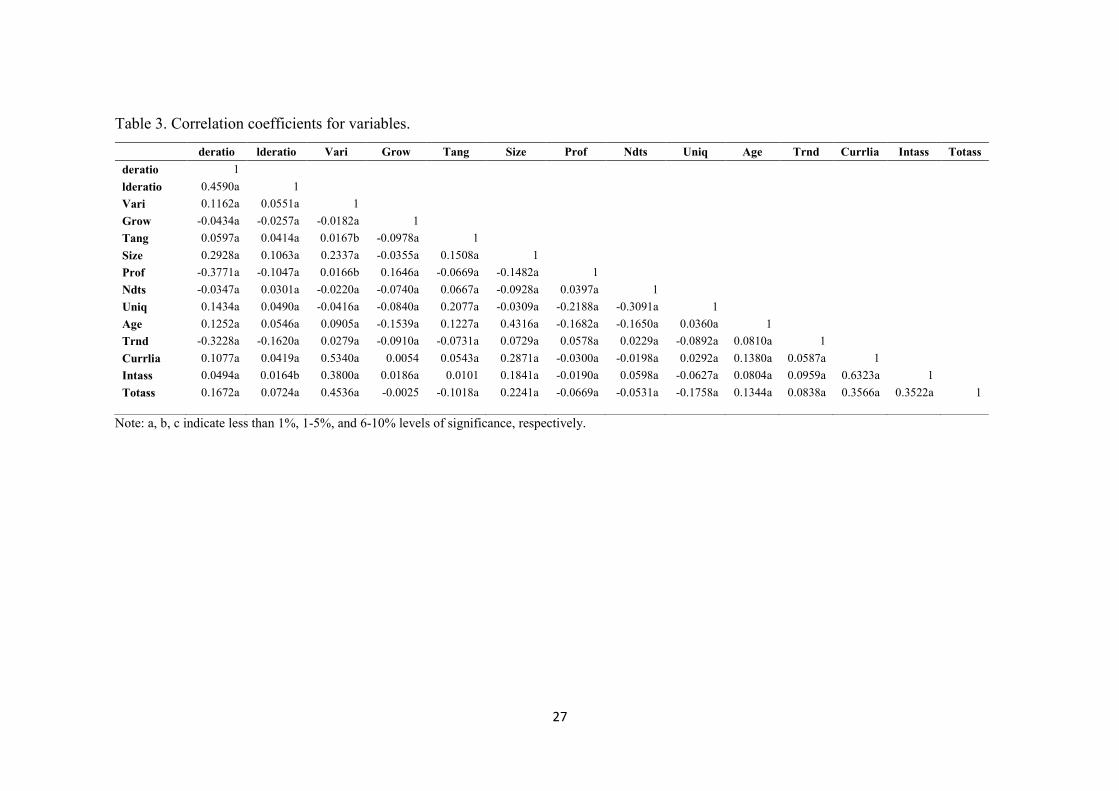
Table 6 shows the correlation coefficients between year, size of the firm, chaebol
affiliation, optimal debt ratio, observed leverage, optimality ratio of leverage, distance
between optimal and observed debt ratios, and speed of adjustment. The optimal,
observed, and chaebol affiliation are negatively correlated with time, whereas size,
optimality ratio, distance, and speed of adjustment are positively correlated with time.
The correlation coefficient between optimal and observed leverages is 0.51. The distance
from optimality was negatively related to size, chaebol affiliation and optimal debt ratio.
The speed of adjustment was negatively related to size, chaebol, optimal and observed
ratios, and optimality ratio of leverage. The distance from optimal debt ratio is smaller
for chaebols and speed of adjustment toward optimal leverage is slower compare to non-
chaebols. This is consistent with positive relation of distance and adjustment speed.
[Insert Table 6 about here]
5.2 Policy implications of the results
The results of this study have some policy implications. First, Korean companies over
the period of observation showed a declining pattern of leverage. We assume it can be
due to a tighter credit policy during the financial crises, numerous corporate restructuring,
and macro prudential policies4 that promoted financial stability in Korea since the Asian
crisis of 1997. Many lessons were learned from the financial crises. However the
empirical results show a firms’ low speed of adjustment toward the optimal leverage.
Therefore, Korea needs to keep implementing policies toward improvement and better
corporate governance.
5.3 Suggestions for improvements in the data and future research
This study has some limitations and in this section we would provide further suggestions
for future research. Although this study covered a long period of observation, we would
suggest that it would be better to study the capital structure including more
macroeconomic factors such as inflation, monetary policies, and etc. The analysis part
could be improved by differentiating types of the debt. It is desirable to divide the total
debt into short-term and long-term debts, and look at the effect of the crises on each type
of debt. We couldn’t do it in this study due to unavailability of such separate data. For
the dependent variable, we used a book value of leverage, whereas some empirical
studies use a market value of leverage.
4 See also Lee et al. (2015). Effectiveness of macroprudential policies in developing Asia: an empirical
analysis.
21
Finally, the analysis could be improved by introducing and investigating the effect of
more firm characteristics, such as type of ownership, etc. on the dynamics of capital
structure.
6. CONCLUSION
In this study we have examined the determinants of capital structure and adjustment
speed for 1,159 Korean non-financial listed companies during 1985-2015 periods. The
results for the effect of common determinants of capital structure were found to be
consistent with theories, as well as empirical studies on determinants of capital structure.
Tangibility and size were positively related to leverage, whereas profitability and time
trend were negatively related to leverage. The adjustment speed toward optimal leverage
was also estimated using a flexible dynamic adjustment model. As it was predicted,
companies with intangible assets and high profitability had a lower speed of adjustment
than companies with tangible assets and low profitability. Distance, measured as an
absolute difference between optimal and observed leverages, had a positive effect on the
speed of adjustment. Thus, Korean companies finding it costly to adjust in the long term,
adjust faster in the short term if their observed debt ratio is far from the target debt ratio.
A major objective of this study was to examine the effect of the 1997 Asian crisis, and
the global financial crisis of 2008 on companies’ leverage. The dynamic restricted, the
dynamic unrestricted, and the static models were used for empirical analysis, but
preference was given to the dynamic unrestricted model. The Asian financial crisis had
effects on Asian financial markets in general, and the Korean market in particular, which
was confirmed in the empirical result. The mean debt ratio fell significantly after 1997’s
Asian crisis. The distance between optimal and observed debt ratios shrank after the
Asian crisis, while the speed of adjustment increased twofold. Unlike the Asian crisis,
the global crisis of 2008 was found to have a positive effect on company’s debt ratio and
speed of adjustment toward optimal leverage.
The empirical analysis revealed that Korean non-financial listed companies on average
decreased their debt ratios over the entire period of observation, with leverage being
highest before the Asian Crisis and lowest after the global financial crisis. The regression
analysis shows that Korean listed companies on average adjust 9.4 percent toward their
optimal debt ratio. This result is relatively lower than in other overseas studies.
Acknowledgements
Comments and suggestions from Doyoung Kim and Jungsoo Park on an earlier version
of this manuscript are gratefully acknowledged.

22
REFERENCES
Akbar, S., S.U. Rehman, and P. Ormrod (2013). The impact of recent financial shocks
on the financing and investment policies of UK private firms. International Review
of Financial Analysis, 26, 59-70.
Baker, H.K. and G.S. Martin (2011). Capital Structure and Corporate Finance Decisions.
Theory, Evidence, and Practice. The Robert W. Kolb series in finance.
Banerjee, S., A. Heshmati and C. Wihlborg (2004). The dynamics of capital structure.
Research in Banking and Finance, 4, 275-297.
Barclay, M.J, C.W. Smith, Jr. and E. Morellec (2006). On the Debt Capacity of Growth
Options. Journal of Business, 79(1), 37-60
Chekan, K. (2011). Korea and the Great Recession: The Effects of Chaebol Reform on
South Korea’s Recovery from the 2008 Financial Crisis. US-Korea 2010
Yearbook, 97-109
de Haas, R. and M. Peeters (2006). The dynamic adjustment towards target capital
structures of firms in transition economies. Economics of Transition, 14(1), 133-
169.
Deesomsak, R. and Paudyal, K. and Pescetto, G. (2004). The determinants of capital
structure: evidence from the Asia Pacific region. Journal of Multinational
Financial Management, 14(4-5), 387-405.
Demirguc‐Kunt, A., M. Martinez‐Peria and T. Tressel (2015). The Impact of the Global
Financial Crisis on Firms’ Capital Structure. Policy Research Working Paper 7522.
Fama, E.F., and K.R. French (2002). Testing trade-off and pecking order predictions
about dividends and debt. Review of Financial Studies, 15, 1-33.
Fischer, E.O., R. Heinkel and J. Zechner (1989). Dynamic capital structure choice:
Theory and tests. Journal of Finance, 44, 19-40.
Frank, M.Z and V. Goyal (2009). Capital Structure Decisions: Which Factors Are
Reliably Important? Financial Management, 38(1), 1-37.
Harris, M. and A. Raviv (1991). The theory of capital structure. Journal of Finance, 46,
297-355.
Heshmati, A. (2002). The dynamics of capital structure: Evidence from Swedish micro
and small firms. Research in Banking and Finance, 2, 199-241.
Hunter, W.C., G.G. Kaufman, and H. Krueger (1999). The Asian Financial Crisis:
Origins, implications, and solutions. Boston: Kluwer Academic Publishers, 1999.
Jensen, M.C and W.H. Meckling (1976). Theory of the Firm: Managerial Behavior,
Agency Costs and Ownership Structure. Journal of Financial Economics, 3(4),
305-360.
Kim, H., A. Heshmati and D. Aoun (2005). Dynamics of Capital Structure: The Case of
Korean Listed Manufacturing Companies. Asian Economics Journal, 275-302.
Kim, J-K. (2003). Assessment of Progress in Corporate Restructuring in Korea since the
1997-98 Crisis. Presented paper at KDI conference on “Empirical Evaluation of
Corporate Restructuring in North East Asia,” Seoul, Korea.
23
Kim, S-Y. (2014). South Korea’s policy responses to global economic crisis. Proceedings
of the First Middle East Conference on Global Business, Economics, Finance and
Banking, ISBN: 978-1-941505-16-8 Paper ID_D426.
Kraus, A. and R.H. Litzenberger (1973). A State-Preference Model of Optimal Financial
Leverage. Journal of Finance, 28(4), 911-922.
Lee, M., R.C. Asuncion, and J. Kim (2015). Effectiveness of Macroprudential Policies
in Developing Asia: An Empirical Analysis. ADB Economics Working Paper
Series, 439.
Lee, P-S. (2000). Economic Crisis and Chaebol Reform in Korea. Discussion Paper No.
14, APEC Study Center Columbia Business School.
Lemmon, M.L., M.R. Roberts and J.F. Zender (2007). Back to the Beginning: Persistence
and the Cross-Section of Corporate Capital Structure. Journal of Finance, 63(4),
1575-1608.
Modigliani, F. and M.H. Miller (1958). The cost of capital, corporation finance and the
theory of investment. American Economic Review, 48, 261-297.
Modigliani, F. and M.H. Miller (1963). Corporate Income Taxes and the Cost of Capital:
A Correction. American Economic Review, 53(3), 433-443.
Myers, S.C and N.S Majluf (1984). Corporate financing and investment decisions when
firms have information that investors do not have. Journal of Financial Economics,
13, 187-221.
Park, S.Y. (2004). Asian Financial Crisis: the South Korean Experience, 25-58.
Psillaki, M. and N. Daskalakis (2009). Are the determinants of capital structure country
or firm specific? Small Business Economics, 33(3), 319-333.
Rajan, R. and L. Zingales (1995). What do we know about capital structure? Some
evidence from international data. Journal of Finance, 50, 1421-1460.
Shyam-Sunder, L. and S.C Myers (1999). Testing static trade-off against pecking order
models of capital structure. Journal of Financial Economics, 51, 219-244.
Titman, S. (1984). The effect of capital structure on a firm's liquidation decision. Journal
of Financial Economics, 13(1), 137-151
Titman, S. and R. Wessels (1988). The determinants of capital structure choice. Journal
of Finance, 43(1), 1-19.
Trinh, T. and N.T. Phuong (2015). Effects of Financial Crisis on Capital Structure of
Listed Firms in Vietnam. International Journal of Financial Research, 7(1), 66-
74.
Zeitun, R., A. Temimi and K. Mimouni (2016). Do financial crises alter the dynamics of
corporate capital structure? Evidence from GCC countries. Quarterly Reviews of
Economics and Finance. Article in Press.

24
Figure 1. Mean observed and optimal debt ratios and mean adjustment speed, 1985-
2015.
Note: Own contribution
0,00
10,00
20,00
30,00
40,00
50,00
60,00
70,00
80,00
observed
optimal
adjustment
speed
25
Table 1. Summary statistics
Variable Mean Std Dev Minimum Maximum
Leverage ratio 0.5544 0.2295 0.0042 1.0000
Lagged leverage
ratio 0.5754 0.4809 0.0017 1.0000
Income variability 0.1124 0.6350 0.0000 5.3600
Growth
opportunity 14.8375 39.2248 -99.0524 225.0000
Tangibility 31.1880 19.8829 0.0000 80.0000
Size of the firm 3.0802 1.3965 1.0000 5.0000
Profitability 3.9969 4.8147 0.0000 24.0000
Non-debt tax
shield 0.5837 0.9165 0.0000 6.1100
Uniqueness 75.5672 21.3550 0.0000 111.0000
Age 26.6022 16.5731 1.0000 118.0000
Trend 19.8245 7.8196 2.0000 31.0000
Sector1 0.0007 0.0271 0.0000 1.0000
Sector2 0.0060 0.0774 0.0000 1.0000
Sector3 0.0058 0.0760 0.0000 1.0000
Sector4 0.0072 0.0845 0.0000 1.0000
Sector5 0.0029 0.0534 0.0000 1.0000
Sector6 0.0018 0.0423 0.0000 1.0000
Sector7 0.0072 0.0845 0.0000 1.0000
Sector8 0.0003 0.0166 0.0000 1.0000
Sector9 0.0005 0.0225 0.0000 1.0000
Sector10 0.0007 0.0271 0.0000 1.0000
Chaebol 0.1307 0.3371 0.0000 1.0000
Current liabilities 4987154.0826 21318903.7010 483.9181 500276463.6000
Intangible assets 548287.4489 3870970.7931 -3813316.5900 96576810.3020
Total assets 30597547.1170 179876368.2900 668.5596 3670526220.9000
Period 1998-2007 0.3661 0.4818 0.0000 1.0000
Period 2008-2015 0.4350 0.4958 0.0000 1.0000

26
Table 2. List of industries
N Industry Classification N of firms % of sample
1 Energy 31 2.7
2 Materials 177 15.2
3 Industrials 194 16.7
4 Consumer Discretionary 266 23.0
5 Consumer Staples 81 7.0
6 Health Care 67 5.8
7 Information Technology 297 25.6
8 Telecommunication Services 10 0.9
9 Utility 16 1.4
10 Others 20 1.7
All industry sectors 1,159 100.0
27
Table 3. Correlation coefficients for variables.
Note: a, b, c indicate less than 1%, 1-5%, and 6-10% levels of significance, respectively.
deratio lderatio Vari Grow Tang Size Prof Ndts Uniq Age Trnd Currlia Intass Totass
deratio 1
lderatio 0.4590a 1
Vari 0.1162a 0.0551a 1
Grow -0.0434a -0.0257a -0.0182a 1
Tang 0.0597a 0.0414a 0.0167b -0.0978a 1
Size 0.2928a 0.1063a 0.2337a -0.0355a 0.1508a 1
Prof -0.3771a -0.1047a 0.0166b 0.1646a -0.0669a -0.1482a 1
Ndts -0.0347a 0.0301a -0.0220a -0.0740a 0.0667a -0.0928a 0.0397a 1
Uniq 0.1434a 0.0490a -0.0416a -0.0840a 0.2077a -0.0309a -0.2188a -0.3091a 1
Age 0.1252a 0.0546a 0.0905a -0.1539a 0.1227a 0.4316a -0.1682a -0.1650a 0.0360a 1
Trnd -0.3228a -0.1620a 0.0279a -0.0910a -0.0731a 0.0729a 0.0578a 0.0229a -0.0892a 0.0810a 1
Currlia 0.1077a 0.0419a 0.5340a 0.0054 0.0543a 0.2871a -0.0300a -0.0198a 0.0292a 0.1380a 0.0587a 1
Intass 0.0494a 0.0164b 0.3800a 0.0186a 0.0101 0.1841a -0.0190a 0.0598a -0.0627a 0.0804a 0.0959a 0.6323a 1
Totass 0.1672a 0.0724a 0.4536a -0.0025 -0.1018a 0.2241a -0.0669a -0.0531a -0.1758a 0.1344a 0.0838a 0.3566a 0.3522a 1

28
Table 4. Estimation results, 21,714 observations
Note: Dependent variable is debt ratio, calculated as: Total Liability/Total assets, where ***, **, * indicate
1%, 1-5%, and 5-10% levels of significance respectively.
Model Static Restricted Dynamic Unrestricted Dynamic
Variable Definition Estimate Std.
Error Estimate
Std.
Error Estimate
Std.
Error
Determinants of capital
structure:
α0 Intercept 0.1904*** 0.0178 0.1334*** 0.0176 0.2264*** 0.0248
α1 Income
variability -0.0003 0.0022 -0.0020 0.0025 0.0142*** 0.0043
α2 Growth -0.0001** 0.0000 -0.0001** 0.0000 0.0001 0.0000
α3 Tangibility -0.0003*** 0.0001 -0.0004*** 0.0001 0.0009*** 0.0001
α4 Size 0.0360*** 0.0012 0.0408*** 0.0012 0.0210*** 0.0017
α5 Profitability -0.0137*** 0.0004 -0.0152*** 0.0003 -0.0181*** 0.0004
α6 Non-debt tax
shield 0.0127*** 0.0018 0.0080*** 0.0017 0.0399*** 0.0021
α7 Uniqueness 0.0011*** 0.0001 0.0011*** 0.0001 0.0014*** 0.0001
α8 Age -0.0004*** 0.0001 -0.0006*** 0.0001 0.0005*** 0.0002
α9 Asian Crisis 0.0731*** 0.0066 0.0769*** 0.0088 -0.1782*** 0.0225
α10 Global Crisis 0.0177 0.0065 0.0295*** 0.0064 0.0606*** 0.0075
α11 Chaebol 0.0363*** 0.0051 0.0215*** 0.0059 0.1208*** 0.0109
α12 Trend -0.0094*** 0.0002 -0.0094*** 0.0002 -0.0060*** 0.0004
α13 Industry
dummies Included Included Included
Determinants of speed of adjustment:
β0 Intercept - - 0.8315*** 0.0025 0.2330*** 0.0252
β1 Distance - - 1.0091*** 0.0074
β2 Current liabilities - - -0.0259*** 0.0018
β3 Intangible assets - - -0.0018*** 0.0006
β4 Growth - - 0.0004*** 0.0000
β5 Profitability - - -0.0081*** 0.0003
β6 Asian Crisis - - -0.2781*** 0.0229
β7 Global Crisis - - 0.0967*** 0.0098
β8 Trend 0.0025*** 0.0004
Adj. R2 Adjusted R2 0.3357 0.4535 0.7751
RMSE Root Mean
Square Error 0.1870 0.1696 0.1088

29
Table 5.1 Mean values by year and period
Definition Delta Optimal Observed Distance Optimality
ratio
Panel 1. Mean by year of observation:
1986
0.057 0.635 0.735 -0.100 0.864
1987
0.062 0.629 0.739 -0.110 0.851
1988
0.066 0.624 0.694 -0.070 0.899
1989
0.054 0.639 0.662 -0.023 0.966
1990
0.049 0.639 0.672 -0.033 0.951
1991
0.046 0.634 0.685 -0.051 0.926
1992
0.046 0.634 0.688 -0.053 0.922
1993
0.046 0.639 0.695 -0.057 0.918
1994
0.053 0.624 0.695 -0.071 0.898
1995
0.055 0.625 0.704 -0.079 0.887
1996
0.078 0.614 0.705 -0.092 0.870
1997
0.027 0.435 0.722 -0.287 0.602
1998
0.098 0.584 0.665 -0.082 0.877
1999
0.119 0.554 0.585 -0.031 0.948
2000
0.112 0.545 0.550 -0.006 0.990
2001
0.110 0.540 0.525 0.015 1.028
2002
0.107 0.544 0.522 0.022 1.042
2003
0.103 0.484 0.498 -0.013 0.974
2004
0.109 0.499 0.500 -0.001 0.998
2005
0.111 0.496 0.489 0.007 1.014
2006
0.107 0.500 0.489 0.011 1.023
2007
0.102 0.497 0.484 0.013 1.026
2008
0.193 0.568 0.532 0.036 1.069
2009
0.101 0.490 0.502 -0.012 0.975
2010
0.088 0.476 0.498 -0.022 0.956
2011
0.085 0.486 0.508 -0.022 0.957
2012
0.085 0.491 0.507 -0.016 0.969
2013
0.091 0.492 0.501 -0.009 0.982
2014
0.094 0.487 0.490 -0.002 0.995
2015
0.098 0.484 0.482 0.001 1.003
Panel 2. Mean by crisis period:
1985-1997 Before Asian Crisis 0.053 0.607 0.700 -0.092 0.868
1998-2007 After Asian and Before
Global Crisis
0.107 0.519 0.522 -0.003 0.995
2008-2015 After Global Crisis 0.105 0.497 0.503 -0.005 0.989

30
Table 5.2 Mean values by industry, size, and chaebol
Definition Delta Optimal Observed Distance Optimality
ratio
Panel 3. Sample mean by industrial sector
Sector 1 Energy 0.080 0.517 0.558 -0.040 0.928
Sector 2 Materials 0.092 0.383 0.465 -0.082 0.824
Sector 3 Industry 0.071 0.564 0.543 0.021 1.039
Sector 4 Consumer Discretionary 0.124 0.467 0.496 -0.029 0.942
Sector 5 Consumer Staples 0.116 0.582 0.509 0.073 1.143
Sector 6 Health Care 0.093 0.426 0.424 0.001 1.003
Sector 7 Information Technology 0.128 0.486 0.477 0.009 1.019
Sector 8 Telecommunication Services 0.031 0.764 0.692 0.072 1.105
Sector 9 Utility 0.019 0.504 0.520 -0.016 0.969
Sector 10 Others 0.074 0.460 0.609 -0.149 0.755
Panel 4. Sample mean by size of the firm:
1 Very small (total assets<0.49
billion won)
0.173 0.451 0.487 -0.036 0.927
2 Small (0.49-1.1 billion won) 0.109 0.476 0.492 -0.016 0.967
3 Medium (1.1-2.7 billion won) 0.082 0.505 0.518 -0.013 0.975
4 Large (2.7-9.3 billion won) 0.068 0.544 0.579 -0.035 0.940
5 Very large (total assets >9.3
billion won)
0.052 0.660 0.680 -0.021 0.970
Panel 5. Sample mean by chaebol
affiliation:
0 Non-chaebol 0.102 0.500 0.529 -0.029 0.945
1 Chaebol 0.044 0.733 0.722 0.011 1.015
Panel 6. Sample mean and standard
deviation:
Mean Mean 0.094 0.531 0.554 0.175 0.869
Std. dev Standard deviation 0.140 0.146 0.229 0.149 0.170

31
Table 6. Correlation matrix for results, 21714 observations
year size chaebol optimal observed optimality
ratio
distance delta
year 1
size 0.0729 1
0.0001
chaebol -0.0521 0.5096 1
0.0001 0.0001
optimal -0.3209 0.4710 0.5379 1
0.0001 0.0001 0.0001
observed -0.3228 0.2928 0.2827 0.5126 1
0.0001 0.0001 0.0001 0.0001
ratio 0.0466 0.1187 0.1242 0.3585 -0.5012 1
0.0001 0.0001 0.0001 0.0001 0.0001
distance 0.0138 -0.1131 -0.0543 -0.1553 0.0843 -0.4670 1
0.0414 0.0001 0.0001 0.0001 0.0001 0.0001
delta 0.1060 -0.2798 -0.1413 -0.1287 -0.0310 -0.2851 0.8930 1
0.0001 0.0001 0.0001 0.0001 0.0001 0.0001 0.0001
Note: p-values are shown below the coefficients