diurnal variations of titan’s ionosphere
TRANSCRIPT

Diurnal variations of Titan’s ionosphere
J. Cui,1 M. Galand,1 R. V. Yelle,2 V. Vuitton,3 J.-E. Wahlund,4 P. P. Lavvas,2
I. C. F. Muller-Wodarg,1 T. E. Cravens,5 W. T. Kasprzak,6 and J. H. Waite Jr.7
Received 12 March 2009; revised 24 April 2009; accepted 29 April 2009; published 18 June 2009.
[1] We present our analysis of the diurnal variations of Titan’s ionosphere (between 1000and 1300 km) based on a sample of Ion Neutral Mass Spectrometer (INMS) measurementsin the Open Source Ion (OSI) mode obtained from eight close encounters of the Cassinispacecraft with Titan. Although there is an overall ion depletion well beyond theterminator, the ion content on Titan’s nightside is still appreciable, with a density plateauof �700 cm�3 below �1300 km. Such a plateau is a combined result of significantdepletion of light ions and modest depletion of heavy ones on Titan’s nightside. Wepropose that the distinctions between the diurnal variations of light and heavy ions areassociated with their different chemical loss pathways, with the former primarily through‘‘fast’’ ion-neutral chemistry and the latter through ‘‘slow’’ electron dissociativerecombination. The strong correlation between the observed night-to-day ion densityratios and the associated ion lifetimes suggests a scenario in which the ions created onTitan’s dayside may survive well to the nightside. The observed asymmetry between thedawn and dusk ion density profiles also supports such an interpretation. We construct atime-dependent ion chemistry model to investigate the effect of ion survival associatedwith solid body rotation alone as well as superrotating horizontal winds. For long-livedions, the predicted diurnal variations have similar general characteristics to thoseobserved. However, for short-lived ions, the model densities on the nightside aresignificantly lower than the observed values. This implies that electron precipitation fromSaturn’s magnetosphere may be an additional and important contributor to the densities ofthe short-lived ions observed on Titan’s nightside.
Citation: Cui, J., M. Galand, R. V. Yelle, V. Vuitton, J.-E. Wahlund, P. P. Lavvas, I. C. F. Muller-Wodarg, T. E. Cravens,
W. T. Kasprzak, and J. H. Waite Jr. (2009), Diurnal variations of Titan’s ionosphere, J. Geophys. Res., 114, A06310,
doi:10.1029/2009JA014228.
1. Introduction
[2] Titan, the largest moon of Saturn, has a substantialionosphere that was first detected on the basis of the dual-frequency Doppler data obtained with the Voyager 1 radiooccultation experiment [Bird et al., 1997]. The discoverywas later confirmed by in-situ measurements of the electrondistribution made by the Cassini Radio and Plasma WaveScience (RPWS) instrument [Wahlund et al., 2005] as well
as the radio occultation results from the Cassini RadioScience (RSS) instrument [Kliore et al., 2008].[3] Complementary to the RPWS and RSS investigations
of Titan’s ionospheric electrons, in-situ measurements of theabundances of various ion species have been made by theCassini Ion Neutral Mass Spectrometer (INMS) in the OpenSource Ion (OSI) mode [Cravens et al., 2005]. Previousstudies based on the INMS ion data revealed that thecomposition of Titan’s ionosphere is very complex, with�50 ion species above the detection threshold [Cravens etal., 2005, 2006; Vuitton et al., 2006, 2007; Waite et al.,2007]. A typical ion mass spectrum obtained with the INMSshows distinct ion groups that are separated in mass-to-charge ratio (hereafter M/Z) by �12 Da [Cravens et al.,2006; Vuitton et al., 2007]. In addition, analyses of the dataobtained with the Ion Beam Spectrometer (IBS) and theElectron Spectrometer (ELS) of the Cassini Plasma Spec-trometer (CAPS) also revealed the presence of heavierpositive ions with M/Z � 130, 170 and 335 [Waite et al.,2007], as well as negative ions in M/Z groups of 10–30,30–50, 50–80, 80–110, 110–200 and 200+ Da in Titan’sionosphere [Coates et al., 2007].[4] The two main ionization sources of Titan’s ionosphere
are solar radiation in the EUV (and soft X-rays) and
JOURNAL OF GEOPHYSICAL RESEARCH, VOL. 114, A06310, doi:10.1029/2009JA014228, 2009ClickHere
for
FullArticle
1Space and Atmospheric Physics Group, Department of Physics,Imperial College, London, UK.
2Lunar and Planetary Laboratory, University of Arizona, Tucson,Arizona, USA.
3Laboratoire de Planetologie de Grenoble, Universite Joseph Fourier/CNRS, Grenoble, France.
4Uppsala Division, Swedish Institute of Space Physics, Uppsala,Sweden.
5Department of Physics and Astronomy, University of Kansas,Lawrence, Kansas, USA.
6Solar System Exploration Division, NASA Goddard Space FlightCenter, Greenbelt, Maryland, USA.
7Space Science and Engineering Division, Southwest ResearchInstitute, San Antonio, Texas, USA.
Copyright 2009 by the American Geophysical Union.0148-0227/09/2009JA014228$09.00
A06310 1 of 20

energetic particles from Saturn’s magnetosphere, with theirrelative importances varying with local solar time on Titanas well as the location of the satellite with respect toSaturn’s magnetosphere [e.g., Gan et al., 1992; Keller etal., 1992, 1994; Keller and Cravens, 1994; Roboz andNagy, 1994; Fox and Yelle, 1997; Nagy and Cravens,1998; Galand et al., 1999, 2006; Cravens et al., 2004,2005, 2006, 2008a, 2008b; Agren et al., 2007, 2009; De LaHaye et al., 2008]. Meteoritic ablation may also have somecontributions to the ion production near �700 km [e.g., Ip,1990; English et al., 1996; Molina-Cuberos et al., 2001],and cosmic ray ionization could be effective down to�65 km[e.g., Lopez-Moreno et al., 2008]. Comparison of modelingoutput with a multi-instrumental data set (including theINMS ion and RPWS and CAPS electron data acquiredduring the first Titan flyby of Cassini, known in projectparlance as TA) demonstrates that the solar EUV radiation isthe dominant ion source on Titan’s dayside [Galand et al.,2006]. This is further supported by the recent analysis of alarge sample of the RPWS data, investigating the depen-dence of peak altitude and density of the observed electrondistribution with solar illumination angle [Agren et al.,2009]. Photoionization by solar EUV radiation may alsobe important well beyond the terminator, as a result of theextended nature of Titan’s atmosphere [Muller-Wodarg etal., 2000; Cravens et al., 2004; Agren et al., 2009].However, deep in Titan’s nightside (as sampled by theCassini T5 and T21 flybys), the primary ion source hasbeen proposed to be precipitating electrons from Saturn’smagnetosphere [Cravens et al., 2008b; Agren et al., 2007,2009]. Cravens et al. [2008a] also suggested that precipi-tation of energetic protons and oxygen ions from Saturn’smagnetosphere may be important between 500 and 1000 km,contributing to the ionospheric layer in the region of 500–600 km observed by the RSS experiment [Kliore et al.,2008].[5] In this paper, we investigate further the source for
Titan’s nightside ionosphere, focusing on the observeddiurnal variations of different ion species based on a largesample of INMS measurements in the OSI mode coveringboth the dayside and nightside of Titan. We show that theobserved ion densities vary in a regular way that is tightlycorrelated with chemical lifetime. Electron precipitation andchemical survival of dayside ions, coupled with stronghorizontal winds, are both investigated through comparisonof models for these sources with the observations. Thesecomparisons show that characteristics of both sources areseen in the data. Details of the INMS observations and dataanalysis are summarized in section 2. We present our mainresults in section 3, and discuss possible interpretations ofthe data in section 4. In section 5, we compare the observeddiurnal variations of Titan’s ionosphere with results from atime-dependent ion chemistry model which also takes intoaccount the effects of superrotating horizontal neutralwinds. Finally, we summarize and conclude in section 6.
2. Observations and Data Analysis
[6] Within the four years’ length of the prime Cassinimission, there have been over 40 encounters with Titan.This work is based on the INMS data acquired during 8 ofthem, for which the measurements in the OSI mode are
available (see section 2.2 for details). A complete descrip-tion of the INMS instrument is given by Waite et al. [2004].
2.1. Determination of Ion Densities
[7] Random and systematic uncertainties in the INMS iondata are well understood. Measurement precision is limitedby counting statistics and, in a typical scan, densities greaterthan 1 cm�3 are determined with a signal-to-noise ratio(SNR) of better than 5. In general, the dominant ions aremeasured with extremely good SNR throughout the altituderange of interest here. Densities are determined from mea-sured count rates using prelaunch sensitivities measured inthe laboratory [Waite et al., 2004; Cui et al., 2009]. Theseare estimated to be accurate to better than 25%. Howeverthere are two potential complications, as addressed below.[8] First, the angular acceptance of the INMS in the OSI
mode is quite narrow with a half width at half maximum(HWHM) of 3� for M/Z = 28, when transmission isoptimized at zero angle of attack [Waite et al., 2004]. Thuslarge tangential ion flows can shift the ambient ions awayfrom optimal sensitivity. For a typical spacecraft velocity of6 km s�1, a tangential flow speed of 0.5 km s�1 causes adecrease in sensitivity by 50% [Waite et al., 2004; Cravenset al., 2006]. Because the direction and magnitude of the ionflow are unknown, we do not attempt to derive the iondensities more accurately by correcting for possible ion driftmotion. However, it should be born in mind that the iondensities given in this paper may not be reliable above�1450 km, where transport starts to become significant andlarge ion flow velocities may occur [e.g., Ma et al., 2006;Cravens et al., 2008b].[9] Second, the INMS transmission is also affected by
spacecraft potential. We assume in our analysis a constantspacecraft potential of �0.5 V. An alternative scheme is toadopt the spacecraft potentials derived from other instru-ments (e.g., RPWS LP or CAPS IBS). Here we compare theion densities obtained with the default value of �0.5 V andthose obtained with the RPWS spacecraft potential, to seehow the derived densities could be affected by the choice ofthe spacecraft potential. A typical example is illustrated inFigure 1, for the outbound T26 flyby. In the left, we showthe density profiles of three example ion species as afunction of altitude, with the solid circles representing thedensities calculated with the default spacecraft potential of�0.5 V and the open circles representing the densitiescalculated with the RPWS spacecraft potential. These twochoices of the spacecraft potential are also indicated in theright of Figure 1. The identification of the ion speciesshown in Figure 1 follows the scheme of Vuitton et al.[2007], with the numbers in parenthesis giving their M/Zvalues. Figure 1 shows that typically, the uncertainties in iondensities associated with spacecraft potential are small,except at high altitudes where the spacecraft potentialmeasured by RPWS deviates significantly from our defaultvalue of �0.5 V. It should be born in mind that adopting theRPWS spacecraft potential does not necessarily give morerealistic results of the ambient ion densities compared withthe default choice of �0.5 V, since the spacecraft potentialsat different positions of the Cassini spacecraft may also bedifferent. The above comparison is nevertheless instructiveand suggests that the ion densities obtained at relatively lowaltitudes, typically below �1300 km, are less dependent on
A06310 CUI ET AL.: DIURNAL VARIATIONS OF TITAN’S IONOSPHERE
2 of 20
A06310

spacecraft potential compared with those above. As themain results on the observed diurnal variations of Titan’sionosphere presented in this paper primarily rely on themeasured ion densities below �1300 km, both the adoptedspacecraft potential and possible ion drift are not very likelyto influence the main conclusions of this paper in anyappreciable way.[10] Similar to the INMS neutral data [Cui et al., 2009],
in a typical ion spectrum there appears to be a broadlydistributed background spectrum between M/Z = 10 and 35,especially at low altitudes. We subtract these backgroundsignals with an empirical model to improve the densitydetermination of the ambient ions. The adopted empiricalbackground model is analogous to the one used for ourprevious analysis of the INMS neutral data [Cui et al.,2009]. For a given M/Z, the magnitude of backgroundsignals is found to depend exponentially on altitude, butshow little variation between Titan’s dayside and nightside.There also appears to be a minor bump at M/Z < 10 for atypical ion spectrum, which cannot be accommodated withthe empirical background model proposed above. Since theamplitude and shape of this minor bump of backgroundcounts are hard to constrain from the ion data, we excludemeasurements in channels 1–10 in our analysis, and as aconsequence, we will not present in this study the ionabundances of species lighter than C+ (M/Z = 12).
2.2. Sample Selection
[11] For the INMS ion data, different channels are notequally sampled, in the sense that signals in channels 16–17and 28–29 are typically sampled with a frequency of 2 Hz,whereas for the other channels, the frequency can be as low
as �0.1 Hz. Channels 16–17 and 28–29 are mainlyassociated with CH4
+, CH5+, HCNH+ and C2H5
+, with a smallcontribution from NH2
+, NH3+, C2H4
+ and N2H+ [Vuitton et
al., 2007]. The uneven sampling of different channelsindicates that interpolation is required in order to extractan individual ion spectrum at a given altitude from the rawdata. Here a common grid of time from closest approach(C/A) defined by channel 40 (mainly associated withHC2NH
+) is chosen as the standard for interpolation. Withthis treatment, the sampling rates for channels 16–17 and28–29 are degraded.[12] We include in this work the INMS ion data from
8 flybys, known in project parlance as T5, T17, T26, T32,T36, T37, T39 and T40. The T21 flyby occurred on Titan’snightside, and has been included in the recent work ofCravens et al. [2008b]. However, we exclude the T21 datafrom our sample since the corresponding ion density pro-files show an abrupt transition near 1120 km by more thanan order of magnitude, whereas the same feature is notobserved in the associated RPWS electron density profile,known within 10% [Agren et al., 2009]. The RPWSspacecraft potential also presents a sharp transition at thesame altitude. Considering these, we expect that the iondensity profiles obtained from the T21 flyby are not reliable,and the sharp transition near 1120 km is more likely to beassociated with instrumental effects rather than realisticfeatures. The INMS ion data from the inbound T32 flybyare also excluded for the same reason. Ion densities onTitan’s dayside could also be derived from the T18 data.However, during this flyby, the RPWS spacecraft potentialsare significantly different from our default choice of �0.5 V,
Figure 1. Comparison between the ion densities derived from different choices of the spacecraftpotential for the outbound T26 flyby. The left gives the density profiles of three example ion species as afunction of altitude. The identification of these ion species follows the scheme of Vuitton et al. [2007],with the numbers in parenthesis giving their M/Z values. The solid circles represent the densitiescalculated with a constant spacecraft potential of �0.5 V (the default INMS value), and the open circlesrepresent those calculated with the RPWS spacecraft potential. The right indicates the two cases of thespacecraft potential used for calculating the ion densities.
A06310 CUI ET AL.: DIURNAL VARIATIONS OF TITAN’S IONOSPHERE
3 of 20
A06310
by roughly a factor of 3–4. Therefore to be conservative,the INMS ion data from T18 are also excluded.[13] The main characteristics of all flybys in our sample at
C/A are detailed in Table 1, including the date of observa-tion, altitude, local solar time, solar zenith angle, latitude,longitude and F10.7 solar flux at 1 AU (i.e., the 10.7 cmsolar radio flux at 1 AU in W Hz�1 m�2 multiplied by1022). Latitude is defined as northward positive. The longi-tude definition follows the scheme in which 0� points toSaturn, 270� points to the ideal magnetospheric ram direc-tion, and 90� points to the ideal magnetospheric wakedirection. The data sampling covers more than two and ahalf years, between 16 April 2005 for T5 and 5 January2008 for T40. Table 1 shows that altitudes at C/A rangefrom 965 km for T32 to 1027 km for T5. The sample coversboth Titan’s northern and southern hemispheres, both equa-torial and polar regions, as well as both the ideal magneto-spheric ramside and wakeside. The F10.7 solar fluxes (at theEarth) are adopted from the daily values reported by theDominion Radio Astrophysical Observatory at Penticton,B.C., Canada. The F10.7 value remains fairly constant fromflyby to flyby, with a mean value of 75 and a standarddeviation of less than 10%. Thus we do not consider thevariations of solar ionizing flux in our analysis. A moredetailed description of the trajectory information for someof the flybys adopted in this work (including T5, T26, T32,T36 and T37) has been presented by Muller-Wodarg et al.[2008] and Cui et al. [2009]. However, the longitudedefinition used for this study is different from that byMuller-Wodarg et al. [2008].[14] In the following sections, we will investigate the ion
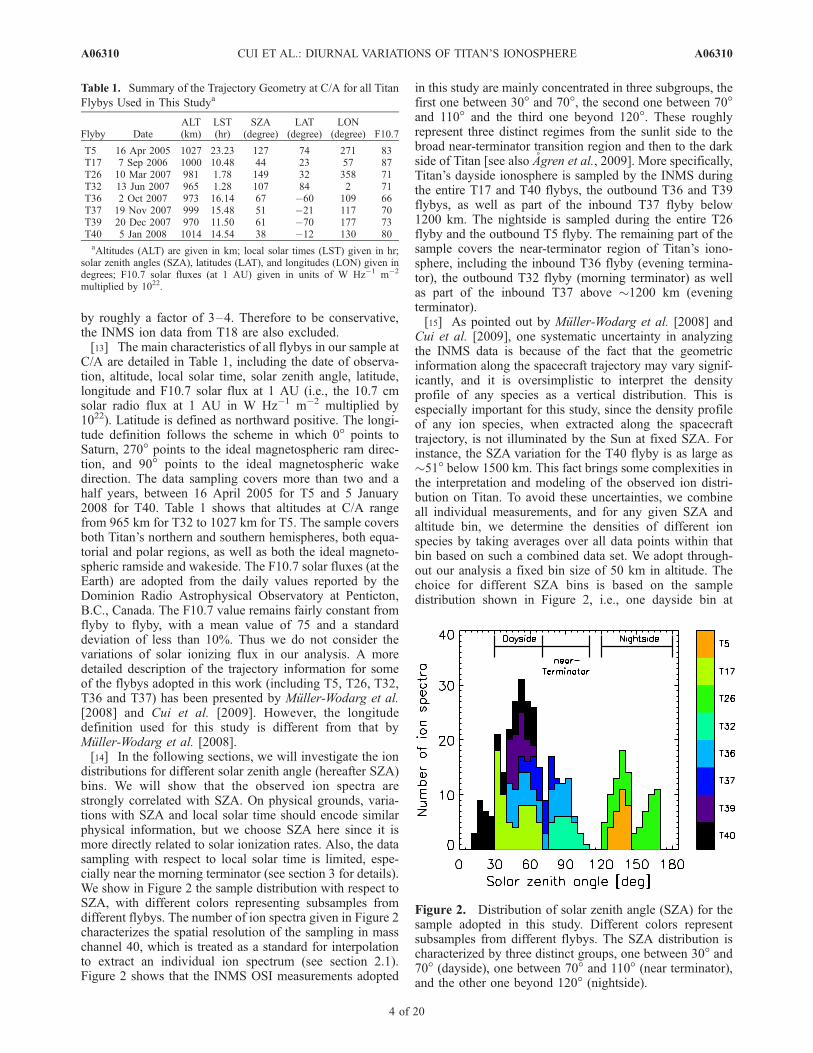
distributions for different solar zenith angle (hereafter SZA)bins. We will show that the observed ion spectra arestrongly correlated with SZA. On physical grounds, varia-tions with SZA and local solar time should encode similarphysical information, but we choose SZA here since it ismore directly related to solar ionization rates. Also, the datasampling with respect to local solar time is limited, espe-cially near the morning terminator (see section 3 for details).We show in Figure 2 the sample distribution with respect toSZA, with different colors representing subsamples fromdifferent flybys. The number of ion spectra given in Figure 2characterizes the spatial resolution of the sampling in masschannel 40, which is treated as a standard for interpolationto extract an individual ion spectrum (see section 2.1).Figure 2 shows that the INMS OSI measurements adopted
in this study are mainly concentrated in three subgroups, thefirst one between 30� and 70�, the second one between 70�and 110� and the third one beyond 120�. These roughlyrepresent three distinct regimes from the sunlit side to thebroad near-terminator transition region and then to the darkside of Titan [see also Agren et al., 2009]. More specifically,Titan’s dayside ionosphere is sampled by the INMS duringthe entire T17 and T40 flybys, the outbound T36 and T39flybys, as well as part of the inbound T37 flyby below1200 km. The nightside is sampled during the entire T26flyby and the outbound T5 flyby. The remaining part of thesample covers the near-terminator region of Titan’s iono-sphere, including the inbound T36 flyby (evening termina-tor), the outbound T32 flyby (morning terminator) as wellas part of the inbound T37 above �1200 km (eveningterminator).[15] As pointed out by Muller-Wodarg et al. [2008] and
Cui et al. [2009], one systematic uncertainty in analyzingthe INMS data is because of the fact that the geometricinformation along the spacecraft trajectory may vary signif-icantly, and it is oversimplistic to interpret the densityprofile of any species as a vertical distribution. This isespecially important for this study, since the density profileof any ion species, when extracted along the spacecrafttrajectory, is not illuminated by the Sun at fixed SZA. Forinstance, the SZA variation for the T40 flyby is as large as�51� below 1500 km. This fact brings some complexities inthe interpretation and modeling of the observed ion distri-bution on Titan. To avoid these uncertainties, we combineall individual measurements, and for any given SZA andaltitude bin, we determine the densities of different ionspecies by taking averages over all data points within thatbin based on such a combined data set. We adopt through-out our analysis a fixed bin size of 50 km in altitude. Thechoice for different SZA bins is based on the sampledistribution shown in Figure 2, i.e., one dayside bin at
Table 1. Summary of the Trajectory Geometry at C/A for all Titan
Flybys Used in This Studya
Flyby DateALT(km)
LST(hr)
SZA(degree)
LAT(degree)
LON(degree) F10.7
T5 16 Apr 2005 1027 23.23 127 74 271 83T17 7 Sep 2006 1000 10.48 44 23 57 87T26 10 Mar 2007 981 1.78 149 32 358 71T32 13 Jun 2007 965 1.28 107 84 2 71T36 2 Oct 2007 973 16.14 67 �60 109 66T37 19 Nov 2007 999 15.48 51 �21 117 70T39 20 Dec 2007 970 11.50 61 �70 177 73T40 5 Jan 2008 1014 14.54 38 �12 130 80aAltitudes (ALT) are given in km; local solar times (LST) given in hr;
solar zenith angles (SZA), latitudes (LAT), and longitudes (LON) given indegrees; F10.7 solar fluxes (at 1 AU) given in units of W Hz�1 m�2
multiplied by 1022.
Figure 2. Distribution of solar zenith angle (SZA) for thesample adopted in this study. Different colors representsubsamples from different flybys. The SZA distribution ischaracterized by three distinct groups, one between 30� and70� (dayside), one between 70� and 110� (near terminator),and the other one beyond 120� (nightside).
A06310 CUI ET AL.: DIURNAL VARIATIONS OF TITAN’S IONOSPHERE
4 of 20
A06310

30�–70�, one near-terminator bin at 70�–110�, and onenightside bin beyond 120�. However, in some cases we willdistinguish between the morning and evening terminators.We will show that the difference between the dawn anddusk ion density profiles has some interesting implications(see section 4 for details).
3. Results
[16] An example of the ion mass spectrum extracted fromthe combined INMS data is given in Figure 3, for an altitudeof �1050 km with a bin size of 50 km. The backgroundspectrum has been subtracted, and all measurementsobtained on Titan’s dayside (with SZA smaller than 90�)are included and averaged. Some obvious features areimmediately seen. First, there is no unique ion species thatdominates Titan’s ionosphere, in contrast to the neutral gasdistribution for which N2 has a mixing ratio of over 95%[Waite et al., 2005; Yelle et al., 2006, 2008; Cui et al., 2008,2009]. The most abundant ion species are HCNH+ (7.4 �102 cm�3), followed by C2H5
+ (1.7 � 102 cm�3), c-C3H3+
(1.5 � 102 cm�3), HC3NH+ (1.7 � 102 cm�3) and C3H5
+
(1.2 � 102 cm�3), where all density values refer to analtitude of 1050 km averaged over Titan’s dayside. This isin general agreement with early chemical model predictions[e.g., Keller et al., 1992, 1998; Fox and Yelle, 1997]. Theion spectrum is characterized by seven distinct groups withmass ranges of 10–25, 25–35, 35–45, 45–60, 60–70, 70–85, and beyond 85, respectively. The mean mass spacing
between these groups is �12 Da, based on a linear fitting ofthe mean ion mass of each group [see also Cravens et al.,2006; Vuitton et al., 2007]. In most cases, the signals in agiven channel are primarily contributed by a single ionspecies, with only a small fraction (typically less than 10%)from other contaminating minor ions as inferred fromphotochemical model calculations [e.g., Vuitton et al.,2007]. The primary ion species that account for the bulksignals in channels with significant count rates, or withnumber densities greater than 1 cm�3 at �1050 km, arelabeled in Figure 3 for reference. The solid line in Figure 3gives the dayside ion spectrum at 9.5 hr local solar time,calculated with the time-dependent ion chemistry modeldescribed in section 5.[17] We show in Figure 4 a direct comparison between
the ion mass spectra on Titan’s dayside (open circles) andnightside (solid circles), respectively. These spectra areobtained by averaging over the combined INMS data setwith SZA in the range of 30�–70� (dayside) or 120�–180�(nightside), both centered at an altitude of 1050 km with abin size of 50 km. The background signals have beensubtracted from the raw spectra (see section 2.1). Figure 4shows that the densities of most ion species vary signifi-cantly with SZA, with the nightside presenting an overallion depletion. This is consistent with the diurnal variationsof electron distribution revealed by the RPWS LP data[Agren et al., 2009], and confirms the importance of solarradiation as the main ion source for Titan’s dayside iono-sphere, though the satellite is subject to a solar radiation flux
Figure 3. Observed ion mass spectrum averaged between 1025 and 1075 km and averaged over Titan’sdayside (with SZA smaller 90�). The spectrum is characterized by seven distinct groups, with a meanmass spacing of �12 Da. The solid line shows the dayside ion spectrum, calculated with the time-dependent ion chemistry model described in section 5. The model spectrum is shown for a local solartime of 9.5 hr, roughly consistent with the mean SZA value on Titan’s dayside for our sample. The ionspecies that account for the bulk signals in those mass channels with densities greater than 1 cm�3 arelabeled. The identification of these ion species follows the scheme of Vuitton et al. [2007].
A06310 CUI ET AL.: DIURNAL VARIATIONS OF TITAN’S IONOSPHERE
5 of 20
A06310

�100 times weaker than that at Earth and is, for most ofthe time, subject to precipitating particles from Saturn’smagnetosphere.[18] We show in Figure 5 the total ion density profiles for
different conditions of solar illumination. The INMS iondistributions near the morning and evening terminators arepresented separately. However, the profile for the morningterminator (the dashed line in Figure 5) cannot be regardedas vertical since it comes from a single flyby (outboundT32) and the associated variation in SZA is quite largealong the spacecraft trajectory. The total ion densities shownin Figure 5 are obtained by summing all ion species over theINMS mass range up to M/Z = 99. We ignore throughoutthis paper the heavy positive ions with M/Z > 100 since theycannot be detected by the INMS [e.g., Waite et al., 2007;F. Crary et al., Heavy and negative ions at Titan measuredby Cassini CAPS, paper presented at 37th COSPAR Scien-tific Assembly, Montreal, Canada, 13–20 Jul., 2008; J.-E.Wahlund et al., On the amount of heavy molecular ions inTitan’s ionosphere, submitted to Planetary and SpaceScience, 2009, hereinafter referred to as Wahlund et al.,submitted manuscript, 2009]. Though these ions may con-tribute to a nonnegligible fraction of the total ion content(e.g., Wahlund et al., submitted manuscript, 2009), the mainconclusions in this paper, which are based on the observa-tions of individual ion species, are not affected by such abiased sampling.[19] The INMS ion distribution on Titan’s dayside shows
a well-defined ionization peak at �1120 km, with a peakdensity of �2.4 � 103 cm�3 (averaged over the SZA rangeof 30�–70�). A similar structure is observed near both the
morning and evening terminators, as a result of the largeextension of Titan’s atmosphere [Muller-Wodarg et al.,2000; Cravens et al., 2004; Agren et al., 2009]. The INMS
Figure 4. Observed ion mass spectra averaged between 1025 and 1075 km, with the dayside spectrum(SZA between 30� and 70�) and nightside spectrum (SZA beyond 120�) displayed with open and solidcircles, respectively. Figure 4 shows clear diurnal variation of Titan’s ionosphere, with a general trend ofion depletion on the nightside. However, such a diurnal variation is more prominent for light ions than forheavy ones.
Figure 5. Observed total ion density profiles in Titan’sionosphere for different conditions of solar illumination.The dayside ion distribution shows a well-defined ioniza-tion peak. A similar feature is observed near both themorning and evening terminators. There is also clearasymmetry between the ion density profiles observed nearthe morning and evening terminators, with the ion densitiesat dawn significantly lower than at dusk. The nightsidedistribution becomes quite flat below �1300 km.
A06310 CUI ET AL.: DIURNAL VARIATIONS OF TITAN’S IONOSPHERE
6 of 20
A06310
ion distribution near the evening terminator peaks at roughlythe same altitude as on the dayside, but with a reduced peakion density of �1.7 � 103 cm�3 (from the inbound T36 andpart of the inbound T37 data). The ionization peak at themorning terminator shifts upward to �1170 km, with a peakion density of �1.4 � 103 cm�3 (from the outbound T32data). There is a clear asymmetry between the ion densityprofiles observed near the morning and evening terminators,in that the ion densities at the morning terminator aresignificantly lower than those at the evening terminator.Finally, the INMS ion distribution observed far beyondthe terminator (with SZA > 120�) becomes quite flatbelow �1300 km, characterized by a density plateau of�700 cm�3. There is no clear evidence for any existingionization peak on the nightside. Similar plateaus are alsoobserved in the nightside electron density profiles measuredby RPWS [Agren et al., 2009].[20] On the basis of the ion spectra shown in Figure 4, it
appears that the diurnal variation is most prominent for lightions, and becomes less pronounced for heavy ones. Specif-ically, the ion content on Titan’s nightside compared withthe dayside is on average depleted by a factor of �5 for themass group of M/Z = 15–25, and depleted by a factor of �4for the mass group of M/Z = 25–35. For all heavier groups,the ion densities are depleted on the nightside comparedwith the dayside by roughly a factor of �2.[21] The ionospheric composition can be characterized by
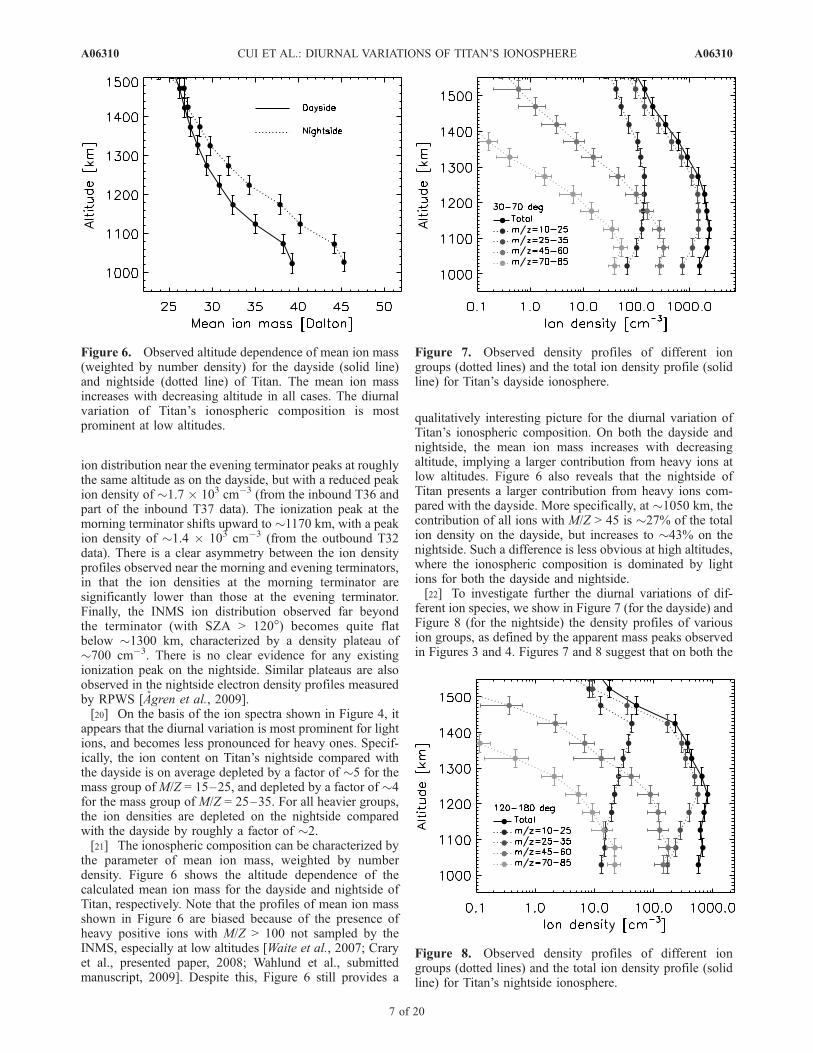
the parameter of mean ion mass, weighted by numberdensity. Figure 6 shows the altitude dependence of thecalculated mean ion mass for the dayside and nightside ofTitan, respectively. Note that the profiles of mean ion massshown in Figure 6 are biased because of the presence ofheavy positive ions with M/Z > 100 not sampled by theINMS, especially at low altitudes [Waite et al., 2007; Craryet al., presented paper, 2008; Wahlund et al., submittedmanuscript, 2009]. Despite this, Figure 6 still provides a
qualitatively interesting picture for the diurnal variation ofTitan’s ionospheric composition. On both the dayside andnightside, the mean ion mass increases with decreasingaltitude, implying a larger contribution from heavy ions atlow altitudes. Figure 6 also reveals that the nightside ofTitan presents a larger contribution from heavy ions com-pared with the dayside. More specifically, at �1050 km, thecontribution of all ions with M/Z > 45 is �27% of the totalion density on the dayside, but increases to �43% on thenightside. Such a difference is less obvious at high altitudes,where the ionospheric composition is dominated by lightions for both the dayside and nightside.[22] To investigate further the diurnal variations of dif-
ferent ion species, we show in Figure 7 (for the dayside) andFigure 8 (for the nightside) the density profiles of variousion groups, as defined by the apparent mass peaks observedin Figures 3 and 4. Figures 7 and 8 suggest that on both the
Figure 6. Observed altitude dependence of mean ion mass(weighted by number density) for the dayside (solid line)and nightside (dotted line) of Titan. The mean ion massincreases with decreasing altitude in all cases. The diurnalvariation of Titan’s ionospheric composition is mostprominent at low altitudes.
Figure 7. Observed density profiles of different iongroups (dotted lines) and the total ion density profile (solidline) for Titan’s dayside ionosphere.
Figure 8. Observed density profiles of different iongroups (dotted lines) and the total ion density profile (solidline) for Titan’s nightside ionosphere.
A06310 CUI ET AL.: DIURNAL VARIATIONS OF TITAN’S IONOSPHERE
7 of 20
A06310

dayside and nightside of Titan, the density profiles of lightspecies show well-defined ionization peaks. In contrast, theobserved heavy ion profiles do not show clear signatures ofionization peak between 1000 and 1300 km, especially onthe nightside. Titan’s dayside ionosphere is dominated byrelatively light ions, especially the mass group of M/Z =25–35. As a consequence, the dayside total ion densityprofile is also characterized by a well-defined ionizationpeak, as shown by the solid line in Figure 5. At lowaltitudes, the densities of the light ion species decreasesignificantly from the dayside to the nightside, shifting thedensity peak toward higher altitudes. In contrast, the heavyions show modest diurnal variations and make a significantcontribution to the total ion density on the nightside. Thecombined result is the nightside plateau below �1300 kmobserved in the total ion density profile (and RPWS electrondistribution [Agren et al., 2009]), as revealed by the dash-dotted line in Figure 5.[23] The extent of ion depletion on Titan’s nightside is
more clearly seen in Figure 9, where we present the densityprofiles of several representative ion species, includingCH5
+, HCNH+, C2H5+, NH4
+, C6H7+ and C2H3CNH
+. Theblack and gray circles represent the profiles averaged onTitan’s dayside and nightside, respectively. On one hand,the nightside profiles of the three species in the top showclear density decrement at low altitudes. On the other hand,such a feature is not observed for the three species shown inthe bottom of Figure 9, which only present modest depletionat all altitudes. It is also interesting to note that except forNH4
+, all species in the top are lighter than those in thebottom. Therefore although there is a general trend that lightions typically show clear density decrement on the nightside(thus more prominent diurnal variations), whereas thenightside depletion of heavy ions is less pronounced, there
are indeed exceptions, such as NH4+, which belong to light
species but present day-to-night differences characteristic oftypical heavy ions.[24] We summarize in Table 2 the observed ion densities
averaged on Titan’s dayside (with SZA between 30� and70�) and nightside (with SZA beyond 120�) at �1050 km,as well as the corresponding night-to-day density ratios.Only species with dayside densities greater than 1 cm�3 arelisted. The lifetimes (or loss time constants) of these ionsaveraged over a Titan day and at an altitude of 1050 km arealso given in Table 2. The ionosphere model used tocalculate these ion lifetimes is described in section 5. InFigure 10, we present the relation between the observednight-to-day density ratio and the calculated ion lifetime, forall species identified in the INMS ion spectra with daysidedensity at 1050 km greater than 0.1 cm�3. Figure 10 showsa clear correlation between the ion lifetime and the observednight-to-day ratio, demonstrating that the loss time constantis an important factor in interpreting the diurnal variations inionospheric densities.[25] The scattering of the data points in Figure 10 is
nevertheless relatively large, especially for long-livedions with lifetimes greater than 100 sec. There are at leasttwo possible interpretations for this. First, the derivedlifetimes for some ions may not be accurate, since thereaction rates, especially for the heavy ions, are poorlyconstrained [Carrasco et al., 2008]. For ions with noexisting lab measurement of their reaction rates, weassume their recombination coefficients to be a(T) = 7 �10�7(T/300)�0.7 cm�3 s�1. However, recent flowing after-glow studies of the dissociative recombination of severalhydrocarbon ions suggest instead a switch in power indexfrom ��0.7 to ��1.4 for electron temperatures higherthan 300 K [McLain et al., 2004]. This implies that the
Figure 9. Observed diurnal variations of several representative ion species. Black and gray circlesrepresent the ion density profiles on Titan’s dayside and nightside, respectively. All species in the topshow clear nightside depletion at low altitudes, whereas those in the bottom present modest nightsidedepletion at all altitudes.
A06310 CUI ET AL.: DIURNAL VARIATIONS OF TITAN’S IONOSPHERE
8 of 20
A06310
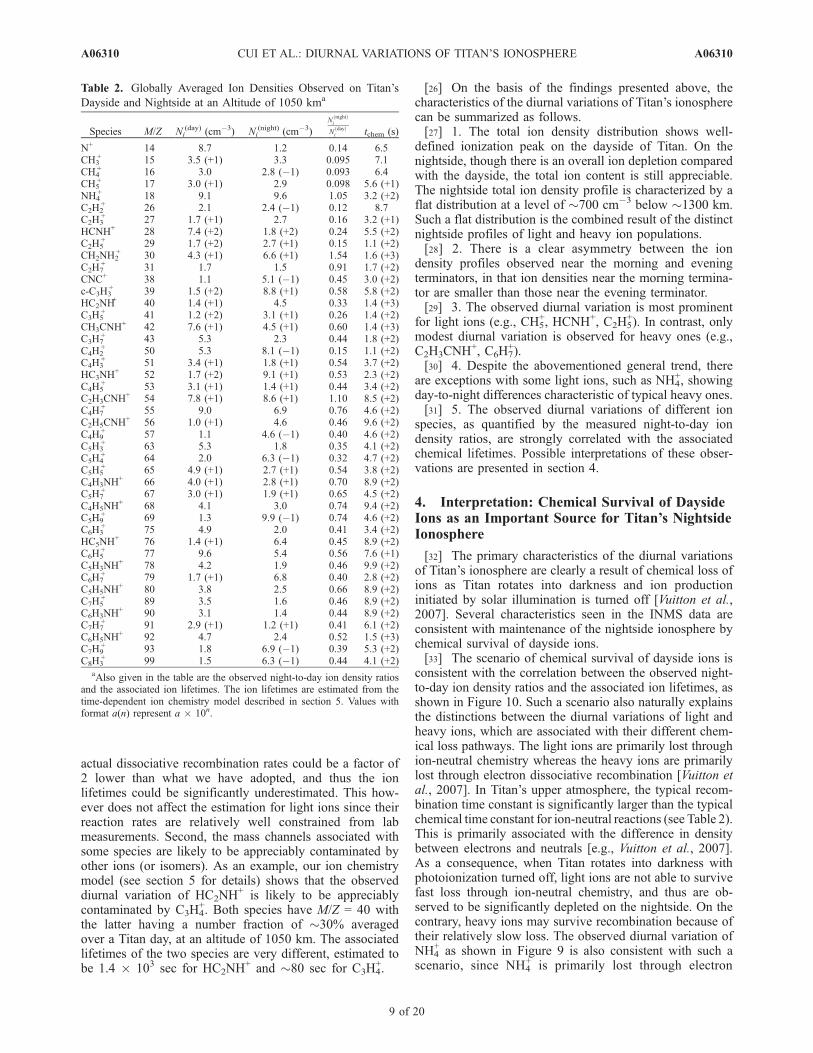
actual dissociative recombination rates could be a factor of2 lower than what we have adopted, and thus the ionlifetimes could be significantly underestimated. This how-ever does not affect the estimation for light ions since theirreaction rates are relatively well constrained from labmeasurements. Second, the mass channels associated withsome species are likely to be appreciably contaminated byother ions (or isomers). As an example, our ion chemistrymodel (see section 5 for details) shows that the observeddiurnal variation of HC2NH
+ is likely to be appreciablycontaminated by C3H4
+. Both species have M/Z = 40 withthe latter having a number fraction of �30% averagedover a Titan day, at an altitude of 1050 km. The associatedlifetimes of the two species are very different, estimated tobe 1.4 � 103 sec for HC2NH
+ and �80 sec for C3H4+.
[26] On the basis of the findings presented above, thecharacteristics of the diurnal variations of Titan’s ionospherecan be summarized as follows.[27] 1. The total ion density distribution shows well-
defined ionization peak on the dayside of Titan. On thenightside, though there is an overall ion depletion comparedwith the dayside, the total ion content is still appreciable.The nightside total ion density profile is characterized by aflat distribution at a level of �700 cm�3 below �1300 km.Such a flat distribution is the combined result of the distinctnightside profiles of light and heavy ion populations.[28] 2. There is a clear asymmetry between the ion
density profiles observed near the morning and eveningterminators, in that ion densities near the morning termina-tor are smaller than those near the evening terminator.[29] 3. The observed diurnal variation is most prominent
for light ions (e.g., CH5+, HCNH+, C2H5
+). In contrast, onlymodest diurnal variation is observed for heavy ones (e.g.,C2H3CNH
+, C6H7+).
[30] 4. Despite the abovementioned general trend, thereare exceptions with some light ions, such as NH4
+, showingday-to-night differences characteristic of typical heavy ones.[31] 5. The observed diurnal variations of different ion
species, as quantified by the measured night-to-day iondensity ratios, are strongly correlated with the associatedchemical lifetimes. Possible interpretations of these obser-vations are presented in section 4.
4. Interpretation: Chemical Survival of DaysideIons as an Important Source for Titan’s NightsideIonosphere
[32] The primary characteristics of the diurnal variationsof Titan’s ionosphere are clearly a result of chemical loss ofions as Titan rotates into darkness and ion productioninitiated by solar illumination is turned off [Vuitton et al.,2007]. Several characteristics seen in the INMS data areconsistent with maintenance of the nightside ionosphere bychemical survival of dayside ions.[33] The scenario of chemical survival of dayside ions is
consistent with the correlation between the observed night-to-day ion density ratios and the associated ion lifetimes, asshown in Figure 10. Such a scenario also naturally explainsthe distinctions between the diurnal variations of light andheavy ions, which are associated with their different chem-ical loss pathways. The light ions are primarily lost throughion-neutral chemistry whereas the heavy ions are primarilylost through electron dissociative recombination [Vuitton etal., 2007]. In Titan’s upper atmosphere, the typical recom-bination time constant is significantly larger than the typicalchemical time constant for ion-neutral reactions (see Table 2).This is primarily associated with the difference in densitybetween electrons and neutrals [e.g., Vuitton et al., 2007].As a consequence, when Titan rotates into darkness withphotoionization turned off, light ions are not able to survivefast loss through ion-neutral chemistry, and thus are ob-served to be significantly depleted on the nightside. On thecontrary, heavy ions may survive recombination because oftheir relatively slow loss. The observed diurnal variation ofNH4
+ as shown in Figure 9 is also consistent with such ascenario, since NH4
+ is primarily lost through electron
Table 2. Globally Averaged Ion Densities Observed on Titan’s
Dayside and Nightside at an Altitude of 1050 kma
Species M/Z Ni(day) (cm�3) Ni
(night) (cm�3)
NðnightÞi
NðdayÞi tchem (s)
N+ 14 8.7 1.2 0.14 6.5CH3
+ 15 3.5 (+1) 3.3 0.095 7.1CH4
+ 16 3.0 2.8 (�1) 0.093 6.4CH5
+ 17 3.0 (+1) 2.9 0.098 5.6 (+1)NH4
+ 18 9.1 9.6 1.05 3.2 (+2)C2H2
+ 26 2.1 2.4 (�1) 0.12 8.7C2H3
+ 27 1.7 (+1) 2.7 0.16 3.2 (+1)HCNH+ 28 7.4 (+2) 1.8 (+2) 0.24 5.5 (+2)C2H5
+ 29 1.7 (+2) 2.7 (+1) 0.15 1.1 (+2)CH2NH2
+ 30 4.3 (+1) 6.6 (+1) 1.54 1.6 (+3)C2H7
+ 31 1.7 1.5 0.91 1.7 (+2)CNC+ 38 1.1 5.1 (�1) 0.45 3.0 (+2)c-C3H3
+ 39 1.5 (+2) 8.8 (+1) 0.58 5.8 (+2)HC2NH
+ 40 1.4 (+1) 4.5 0.33 1.4 (+3)C3H5
+ 41 1.2 (+2) 3.1 (+1) 0.26 1.4 (+2)CH3CNH
+ 42 7.6 (+1) 4.5 (+1) 0.60 1.4 (+3)C3H7
+ 43 5.3 2.3 0.44 1.8 (+2)C4H2
+ 50 5.3 8.1 (�1) 0.15 1.1 (+2)C4H3
+ 51 3.4 (+1) 1.8 (+1) 0.54 3.7 (+2)HC3NH
+ 52 1.7 (+2) 9.1 (+1) 0.53 2.3 (+2)C4H5
+ 53 3.1 (+1) 1.4 (+1) 0.44 3.4 (+2)C2H3CNH
+ 54 7.8 (+1) 8.6 (+1) 1.10 8.5 (+2)C4H7
+ 55 9.0 6.9 0.76 4.6 (+2)C2H5CNH
+ 56 1.0 (+1) 4.6 0.46 9.6 (+2)C4H9
+ 57 1.1 4.6 (�1) 0.40 4.6 (+2)C5H3
+ 63 5.3 1.8 0.35 4.1 (+2)C5H4
+ 64 2.0 6.3 (�1) 0.32 4.7 (+2)C5H5
+ 65 4.9 (+1) 2.7 (+1) 0.54 3.8 (+2)C4H3NH
+ 66 4.0 (+1) 2.8 (+1) 0.70 8.9 (+2)C5H7
+ 67 3.0 (+1) 1.9 (+1) 0.65 4.5 (+2)C4H5NH
+ 68 4.1 3.0 0.74 9.4 (+2)C5H9
+ 69 1.3 9.9 (�1) 0.74 4.6 (+2)C6H3
+ 75 4.9 2.0 0.41 3.4 (+2)HC5NH
+ 76 1.4 (+1) 6.4 0.45 8.9 (+2)C6H5
+ 77 9.6 5.4 0.56 7.6 (+1)C5H3NH
+ 78 4.2 1.9 0.46 9.9 (+2)C6H7
+ 79 1.7 (+1) 6.8 0.40 2.8 (+2)C5H5NH
+ 80 3.8 2.5 0.66 8.9 (+2)C7H5
+ 89 3.5 1.6 0.46 8.9 (+2)C6H3NH
+ 90 3.1 1.4 0.44 8.9 (+2)C7H7
+ 91 2.9 (+1) 1.2 (+1) 0.41 6.1 (+2)C6H5NH
+ 92 4.7 2.4 0.52 1.5 (+3)C7H9
+ 93 1.8 6.9 (�1) 0.39 5.3 (+2)C8H3
+ 99 1.5 6.3 (�1) 0.44 4.1 (+2)aAlso given in the table are the observed night-to-day ion density ratios
and the associated ion lifetimes. The ion lifetimes are estimated from thetime-dependent ion chemistry model described in section 5. Values withformat a(n) represent a � 10n.
A06310 CUI ET AL.: DIURNAL VARIATIONS OF TITAN’S IONOSPHERE
9 of 20
A06310

dissociative recombination though it is a relatively lightspecies [Vuitton et al., 2007].[34] The fact that the observed ion densities are smaller
near the morning terminator than near the evening termina-tor, as shown in Figure 5, supports the hypothesis that thenightside ionosphere is maintained by chemical survival ofdayside ions. Ions observed near the evening terminatorspend less time in darkness as compared with those near themorning terminator. Therefore the ion content at the eveningterminator is expected to be less depleted than that at themorning terminator. However, it should be born in mind thatsuch an observed feature needs to be verified with a largerINMS ion data set, especially because the ion distributionnear the morning terminator relies exclusively on theoutbound T32 data (see section 3). Above �1100 km, thetotal ion densities near the morning terminator becomehigher than those on the nightside. This indicates that atrelatively high altitudes, solar illumination starts to be animportant ion source even near the terminator, as a result ofthe extended nature of Titan’s atmosphere [Muller-Wodarget al., 2000; Cravens et al., 2004; Agren et al., 2009].[35] The importance of chemical survival of dayside ions
in maintaining the nightside ionosphere depends on therelative time constants for chemistry and transport. A lowerlimit on the horizontal transport rate comes from Titan’ssolid body rotation period of �16 days. This is significantlylonger than the ion lifetimes given in Table 2, predictedfrom our time-dependent ion chemistry model (see section 5).Thus assuming solid body rotation and the lack of anynonsolar ionization sources on the nightside implies that thenet ion density on the nightside should be much smaller
than the measured value of �700 cm�3. To address this, wediscuss below several mechanisms that may affect the iondistribution on the nightside of Titan.[36] First, the significant ion/electron densities observed
on Titan’s nightside have been recognized by previousinvestigators who assumed that precipitation of energeticelectrons from Saturn’s magnetosphere were responsible forthe phenomenon [Cravens et al., 2008b; Agren et al., 2009].Electron precipitation can induce nightside ion spectra withsimilar characteristics to those observed. As an example, weshow with the solid line in Figure 11 an ion spectrum onTitan’s nightside calculated assuming ionization by 100 eVelectrons. The calculations are carried out for conditionsappropriate to 1050 km in Titan’s atmosphere and densitiesare calculated assuming steady state conditions. A netionization rate of 0.03 ions cm�3 s�1 is used in the calcu-lations, roughly 6% of the solar ionization rate at the samealtitude for small SZAs. The ion spectrum calculated with asolar ionization rate of 5 ions cm�3 s�1 is given by thedotted line in Figure 11 for comparison. The total iondensity implied by the electron precipitation model is�500 cm�3, roughly consistent with the INMS observationson Titan’s nightside. The general shape of the spectrumassociated with electron precipitation is also in agreementwith that observed in that the density of short-lived ions isgreatly reduced by more than an order of magnitude but thelong-lived ions only by a factor of 2–3. As with the time-dependent situation, this is a consequence of the differentloss mechanisms, i.e., ‘‘fast’’ loss through ion-neutralchemistry for short-lived ions and ‘‘slow’’ loss throughelectron dissociative recombination for long-lived ones.
Figure 10. Observed night-to-day density ratio of all species identified in the INMS ion spectra as afunction of their chemical lifetimes (or loss time constants). All ion species with observed daysidedensities greater than 0.1 cm�3 are included. Figure 10 shows a clear correlation between the twoquantities, demonstrating that the loss time constant is the key factor determining the diurnal variations inionospheric densities.
A06310 CUI ET AL.: DIURNAL VARIATIONS OF TITAN’S IONOSPHERE
10 of 20
A06310

For this model, the lower electron density implies that theloss rates for the long-lived ions are reduced but the lossrates for the short-lived ions, primarily lost through ion-neutral reactions, is unchanged. It should be noted that theshort-lived ions in this electron precipitation model stillhave significant densities, though greatly reduced from thedayside values. As we show in the next section, time-dependent models for the chemical survival of dayside ionspredict far less density for short-lived ions at large solarillumination angles than that observed. The INMS observa-tions of short-lived ions then imply the existence of somelevel of electron precipitation from Saturn’s magnetosphere.[37] Second, the actual day-to-night transport timescale
depends on the dynamics of Titan’s upper atmosphere, andas mentioned above, Titan’s solid body rotation acts as anupper limit on the transport timescale. The dynamics ofTitan’s upper atmosphere are not well constrained, leadingto uncertain transport rates. Despite this, it is clear thatstrong horizontal neutral winds could increase the transportrate and shorten the associated time constant considerably.Such horizontal neutral winds could be driven either byday-to-night temperature difference on Titan or by dynamicalcoupling with Titan’s superrotating stratosphere [Muller-Wodarg et al., 2000]. Existing Thermospheric Global Circu-lation Model (TGCM) calculations show that for solarminimum conditions (as suitable for the time when theINMS data were taken), the day-to-night temperature dif-ference in Titan’s upper atmosphere may drive horizontalneutral winds with speed up to 30 m s�1, in a pattern thatblows from subsolar to antisolar and gives opposite windspeeds at the morning and evening terminators [Muller-
Wodarg et al., 2000]. However, the associated temperaturedifference of �10 K between Titan’s dayside and nightsidehas not been confirmed by the present INMS neutral data[e.g., Muller-Wodarg et al., 2008; Cui et al., 2009] possiblybecause the limited sampling of the existing INMS data set.On the other hand, the actual wind speed might be signif-icantly larger than that predicted from solar driven models ifthe dynamics in Titan’s upper atmosphere is coupled withsuperrotation in the stratosphere [e.g., Flasar et al., 1981;Hubbard et al., 1993; Hourdin et al., 1995; Tokano et al.,1999]. In such cases, the thermospheric wind speed couldreach several hundred m s�1 in a circulating progradepattern [Muller-Wodarg et al., 2000]. The notion of super-rotating thermosphere is also supported by the observedlatitudinal density variations on Titan [Muller-Wodarg et al.,2008]. In section 5, we show in some more detail how thediurnal variations of different ion species could be affectedby the presence of a superrotating thermosphere on Titan.Such an effect is simulated by imposing enhanced solidbody rotation rate in our time-dependent ion chemistrymodel.[38] In this section, we present the interpretation for
Titan’s nightside ionosphere as a remnant of dayside ions.We also discuss the possibility that such an effect could beenhanced significantly by rapid horizontal neutral winds.While we understand that the chemical survival of daysideions is always at work, at least because of the solid bodyrotation of Titan, it does not necessarily mean that theconventional scenario of electron precipitation from Sat-urn’s magnetosphere is no longer valid. In this paper, weconsider electron precipitation as well, and we show that the
Figure 11. Ion mass spectra calculated with the solar model (dotted line) and the electron precipitationmodel (solid line) for an altitude of 1050 km in Titan’s upper atmosphere. The electron precipitationmodel assumes a net ionization rate of 0.03 ions cm�3 s�1, about 6% of the adopted solar ionization rate.The total ion density of �500 cm�3 inferred from the electron precipitation model is roughly consistentwith the observed value. The general shape of the observed nightside ion spectrum, as shown in Figure 4,is also reasonably reproduced by the electron precipitation model.
A06310 CUI ET AL.: DIURNAL VARIATIONS OF TITAN’S IONOSPHERE
11 of 20
A06310

electron precipitation model can explain some features ofthe observed diurnal variations of Titan’s ionosphere. Sincethe scenario of chemical survival of dayside ions has neverbeen explored for Titan in previous works, we extend ourinvestigation here with some numerical experiments basedon a time-dependent ion chemistry model.
5. Time-Dependent Ion Chemistry Model
[39] We show in section 4 that several characteristics ofthe INMS ion data could be interpreted by the scenario ofchemical survival of dayside ions to the nightside. Thisnaturally explains the correlation between the observednight-to-day ion density ratios and the associated chemicaltime constants (as shown in Figure 10), as well as theobserved asymmetry in the ion density profiles near themorning and evening terminators (as shown in Figure 5). Inorder to investigate this possible explanation, we need tomake realistic estimates on chemical lifetimes and transportrates. We therefore constructed a time-dependent ion chem-istry model for Titan’s ionosphere to investigate the role ofchemistry and transport in maintaining the nightside iono-sphere. The results presented in this section cannot beregarded as a rigorous comparison between the model anddata. On one hand, this is because the model and data arenot identically sampled, and on the other hand, this is alsobecause we do not have sufficient knowledge of the globalcirculation pattern in Titan’s upper atmosphere, and thusday-to-night transport is only treated in an idealistic way(see below for details). Nevertheless, we show below thatthe general characteristics of the model results are similar tothose seen in the INMS ion data, at least for long-lived ionspecies.[40] Our time-dependent ion chemistry model includes a
large network of 1641 chemical reactions [Vuitton et al.,2006, 2007, 2009], ionization by solar photons and supra-thermal electrons (photoelectrons and their secondaries),and assumes no contribution from magnetospheric elec-trons. We include the effect of Titan’s rotation to modelthe diurnal variations of the ionosphere. Such a rotationtechnique has been implemented recently by De La Haye etal. [2008]. The effect of horizontal winds is modeled in thiswork with enhanced rotation rate (see below for details). Wealso take into explicit account vertical transport throughambipolar diffusion, therefore local photochemical equilib-rium (PCE) is not a priori assumed in the model. Suchvertical diffusion could be important at relatively highaltitudes, where the chemical time constants become com-parable to or greater than the diffusion timescales [e.g., Maet al., 2006; Cravens et al., 2008b].[41] The absorption rate of solar photons is calculated
using the EUVAC solar spectrum (scaled to the location ofTitan [Richards et al., 1994a, 1994b]) and the photoioniza-tion cross sections of N2 and CH4 from Samson et al. [1987,1989] and Stolte et al. [1998]. Optical depth at any altitudeis calculated by numerical integration along the line of sightto the Sun taking full account of the curved nature of theatmosphere, but assuming that the atmosphere can betreated locally as spherically symmetric. Energy degradationby suprathermal electrons is calculated with an energy gridof 200 bins from 0.1 to 104 eV with exponentially increas-
ing bin width. We include all relevant energy loss processesin an N2-CH4 atmosphere (vibrational/rotational excitation,ionization and elastic collision [see Galand et al., 2006, andreferences therein]). The cross sections for electron impactionization of N2 and CH4 are taken from Lummerzheim andLilensten [1994],Davies et al. [1989] and Liu and Shemansky[2006]. In the calculations, we ignore the transport ofsuprathermal electrons and assume that the energy fromelectron impact of N2 and CH4 is deposited locally. Com-parison with suprathermal electron transport calculationsshows that this is an accurate assumption below �1300 kmin terms of secondary electron production rate (M. Galandet al., Energy deposition in Titan’s deep ionosphere, man-uscript in preparation). At higher altitudes, direct photoion-ization dominates and the approximation is still accurate forthe purpose of chemical calculations throughout the altituderange considered here (between 1000 and 1500 km).[42] The model for the neutral atmosphere used in the
calculations is based on the work of Muller-Wodarg et al.[2008], Vuitton et al. [2006, 2007] and Cui et al. [2008,2009]. The temperature profile and N2 and CH4 densitiesare taken directly from the empirical model of Muller-Wodarg et al. [2008] for a latitude of 56�N. This is alsovery nearly equal to the average of all INMS measurementsin the northern hemisphere and thus represents averageconditions for the observations considered here. The minorneutral species are based on the results of Vuitton et al.[2006, 2007] and Cui et al. [2009]. The Vuitton et al. [2006,2007] analysis was based on a nightside ion spectrum (T5)assuming electron impact ionization, but we find that theneutral densities so derived also provide a good fit to thedayside ion spectrum, as shown by the solid line in Figure 3.We extend these results to full altitude profiles assumingthat the species are distributed in diffusive equilibrium usingthe eddy diffusion profile of Yelle et al. [2008]. The onlyexception is H2, which is adopted directly from Cui et al.[2008].[43] We use the same neutral model atmosphere for all
local times in the models presented below. It is likely thatthere are some variations in atmospheric structure anddensities with local time, though we do not yet have solidconstraints on this [Cui et al., 2009]. In particular, theneutral densities derived by Vuitton et al. [2007] are basedon T5 observations which occurred on the nightside ofTitan, where conditions may be different from those on thedayside. Though many of the neutral species are character-ized by long chemical time constants and may not exhibitstrong day-to-night differences, some variations are stillpossible. The rationale for not including these variationsis that the model results shown here are used in a strictlyqualitative way. Given the lack of strong constraints onlocal time variations in neutral densities [Cui et al., 2009]and the qualitative nature of our goals for the model-datacomparison, the complications and uncertainties introducedby an attempt to include diurnal variations in the neutralatmosphere are not warranted at this time.[44] The model solves the time-dependent, coupled con-
tinuity equations of all ions
@Ni
@tþ 1
r2@
@rðr2FiÞ ¼ Pi � LiNi; ð1Þ
A06310 CUI ET AL.: DIURNAL VARIATIONS OF TITAN’S IONOSPHERE
12 of 20
A06310

where Ni is the ion density, r is the radius from the center ofTitan, Pi is the chemical production rate, Li is the chemicalloss rate and the second term on the LHS represents thedivergence of the flux, Fi, given by
Fi ¼ �Di
@Ni
@rþ Ni
1
Ti
@Te@r
þ 1
Hi
þ Te
Ti
1
Ne
@Ne
@r
� �� �ð2Þ
where Hi =kBTimig
is the ion scale height (kB is the Boltzmannconstant, g the local gravity, mi the ion mass), Ti and Te arethe ion and electron temperatures, Ne = SiNi is the electron(or total ion) density and Di is the ion-neutral ambipolardiffusion coefficient. The term for electron density gradiententers equation (2) to remove the polarization electrostaticfield that appears in both the electron and ion momentumequations [Schunk and Nagy, 2000]. We also assume equalion and neutral temperatures throughout the model calcula-tions. The chemical reactions in the model are based on thereaction list described by Vuitton et al. [2007] and Vuittonet al. [2009]. In equation (2), we have ignored the magneticfield term since for the typical magnetic field strength of�5 nT in the vicinity of Titan [e.g., Backes et al., 2005],gyrofrequencies of ions in the mass range of 10–99 Da onlybecome comparable with or greater than the ion-neutralcollision frequencies above �1350 km, while we areprimarily interested in regions below (see section 2.1).Especially below the dayside ionization peak at �1120 km,the ion-neutral collision frequencies, of order 1–10 s�1
depending on ion mass and altitude, are about two to threeorders of magnitude greater than the gyrofrequencies,ensuring that the magnetic field has a minor effect on theion distribution there. Ion densities are calculated by
simultaneous solution of the coupled continuity equationsincluding diurnally varying ionization rates, with a modelresolution of 5 km in altitude and 600 sec in local time. Thecalculations are run until the density variations at aparticular local time vary from day to day by a negligibleamount, usually 10�3 cm�3.[45] Figure 12 shows the local time variations for several
representative ion species at an altitude of 1050 km,calculated from the time-dependent model described above.Only Titan’s solid body rotation is included (i.e., assumingno horizontal neutral wind), and calculations are carried outat a latitude of 60�. The dotted and dashed lines in Figure 12represent the diurnal variations of typical short-lived andlong-lived species, respectively. The thick solid line givesthe total ion density or electron density calculated from themodel. Some interesting trends are immediately seen. Thetotal ion densities (or electron densities) show asymmetricdistribution about the local noon, with the densities at theevening terminator higher than the values at the morningterminator. This is consistent with that observed from thedata (see Figure 5). The densities of short-lived ions,especially CH4
+, tend to follow the solar ionization rate,which is symmetric about local noon. The long-lived ions(e.g., NH4
+ and C2H3CNH+) clearly show the effects of the
chemical time constants with significant extension into theshadowed regions of the atmosphere. This is further illus-trated in Figure 13 showing additional examples of long-lived and heavy ions. Some of them display minimumdensities near the local noon because of enhanced electronrecombination rates on the dayside (e.g., C8H5
+, C8H7+,
C7H3NH+). The model calculations show that primarily in
response to the time behavior of long-lived ions, thechemical survival of ions created on the dayside of Titan
Figure 12. Modeled diurnal variations of electrons and several representative ion species at an altitudeof 1050 km. The electron densities are calculated as the total ion densities assuming quasi-neutrality. Thevariations of long-lived species (NH4
+ and C2H3CNH+) show clear effects of the chemical time constants
with significant extension into the shadowed regions of the atmosphere.
A06310 CUI ET AL.: DIURNAL VARIATIONS OF TITAN’S IONOSPHERE
13 of 20
A06310

is able to maintain an appreciable ionosphere on thenightside, without taking into account impact ionizationby precipitating electrons from Saturn’s magnetosphere.[46] The rapid disappearance of short-lived ions and
persistence of long-lived ions, as revealed in Figures 12and 13, reflect different time behaviors of these species. Wecan see this with a simple analytical approach. The timedependence of short-lived ions, which are lost primarilythrough ion-neutral chemistry, can be described by
dNi
dt¼ �kinNnNi; ð3Þ
where Ni and Nn are the ion and neutral densities, and kin isthe corresponding reaction rate. Nn is assumed to beconstant over time (see above). This gives the solution toNi(t) as
NiðtÞ ¼ Niðt0Þ exp � t � t0
tL
� �; ð4Þ
where t0 is the initial time and tL = 1/(kinNn) is the loss timeconstant (through ion-neutral chemistry). This implies thatshort-lived ions decay exponentially with time. On the otherhand, the continuity equation for long-lived ions that arelost through recombination can be written as
dNi
dt¼ �aiN
2i ; ð5Þ
where ai is the recombination coefficient and for illustrativepurpose, we assume that the atmosphere is composed of a
single ion species with Ni equal to the electron density. Thesolution to equation (5) is
NiðtÞ ¼ Niðt0Þ= 1þ t � t0
tL
� �; ð6Þ
where tL = 1/[aiNi(t0)] is the loss time constant (throughrecombination). The different time dependencies shown byequations (4) and (6) imply very different behaviors for lossthrough ion-neutral chemistry and loss through recombina-tion. The density of ions that recombine with electronsdecreases with time far more slowly than for ions that reactwith neutrals. After several chemical time constants intonight, the former population is depleted by a factor ofseveral while the latter disappear exponentially. It followsthat the nightside ionosphere is composed primarily of ionsthat are lost through recombination.[47] An additional and important effect that contributes to
the diurnal variations in Titan’s ionosphere is the productionof heavy and long-lived ions well into darkness. As anexample, Vuitton et al. [2007] showed that two importantion-neutral chemical pathways that lead to the loss ofHCNH+ are HCNH+ + HC3N ! HC3NH
+ + HCN andHCNH+ + C2H3CN ! C2H3CNH
+ + HCN. This impliesthat as Titan rotates into darkness, HC3NH
+ and C2H3CNH+
ions are produced at the expense of HCNH+ loss. The ionlifetimes listed in Table 2 are estimated from tL Ni/Liwhere Ni is the ion density and Li is the total loss rate (inunits of cm�3 s�1). As pointed out by Cravens et al.[2008b], for the so-called ‘‘terminal ions’’, the effectivelifetimes, which depend on how far down the chemicalchain these ions reside, could be significantly longer than
Figure 13. Modeled diurnal variations of several heavy ion species at an altitude of 1050 km. Somespecies (e.g., C8H5
+, C8H7+ and C7H3NH
+) display minimum densities near the local noon because ofenhanced dissociative recombination rates on the dayside.
A06310 CUI ET AL.: DIURNAL VARIATIONS OF TITAN’S IONOSPHERE
14 of 20
A06310

the values inferred from Ni/Li. The effect of nightsideproduction of heavy ions is illustrated in Figure 14, whichshows the normalized production rates (at 1050 km) forseveral representative ion species as a function of local solartime, based on our time-dependent ion chemistry model.The normalized production rate is defined as the ratio of theactual production rate to the production rate at local noon.Figure 14 shows that for typical short-lived ions (e.g., CH4
+
and HCNH+), the production rates, which are roughlysymmetric about the local noon, decrease sharply as Titanrotates into darkness. On the contrary, the production ratesof long-lived ions (e.g., HC3NH
+, C2H3NH+ and C6H7
+)show a pattern that extends well into the nightside. Thesefeatures are important for maintaining an appreciable night-side ionosphere on Titan, though they cannot be directlyverified with the INMS ion data.[48] In Figure 15, we show the altitude profiles of some
representative ion species at local noon, midnight, dawn anddusk. These profiles are calculated from the time-dependentmodel for a latitude of 60� and assuming solid body rotationonly. Also shown in Figure 15 are the INMS ion densitiesaveraged over the dayside (with SZA between 30� and 70�)and nightside (with SZA beyond 120�) of Titan. The modelprofiles cannot be compared directly to observations be-cause the observations do not sample the same constantlocal time and latitude. The comparison is neverthelessinstructive. For long-lived ion species shown in Figure 15,the model profiles are in general agreement with the data, onboth the dayside and nightside. However, for short-livedions, the model predicts systematically lower densities than
Figure 14. Normalized production rates of several repre-sentative ion species as a function of local solar time,calculated from the time-dependent ion chemistry modeldescribed in the text. The normalized production rate isdefined as the ratio of the actual production rate to theproduction rate at local noon. The production rates of short-lived species such as CH4
+ and HCNH+ decrease sharply asTitan rotates into darkness. However, for long-lived speciessuch as HC3NH
+, C2H3NH+, and C6H7
+, there aresignificant production rates on the nightside.
Figure 15. Ion density profiles at different local solar times between 1000 and 1500 km, calculatedfrom the time-dependent ion chemistry model assuming solid body rotation only. Also shown are INMSion densities averaged over Titan’s dayside (black dots) and nightside (gray dots), respectively. Thedayside densities correspond to average values in the SZA range of 30�–70�, and the nightside densitiescorrespond to average values in the SZA range of 120�–180�. For the three short-lived species in the top,the model profiles at midnight are well below the selected density range and are thus not shown.
A06310 CUI ET AL.: DIURNAL VARIATIONS OF TITAN’S IONOSPHERE
15 of 20
A06310
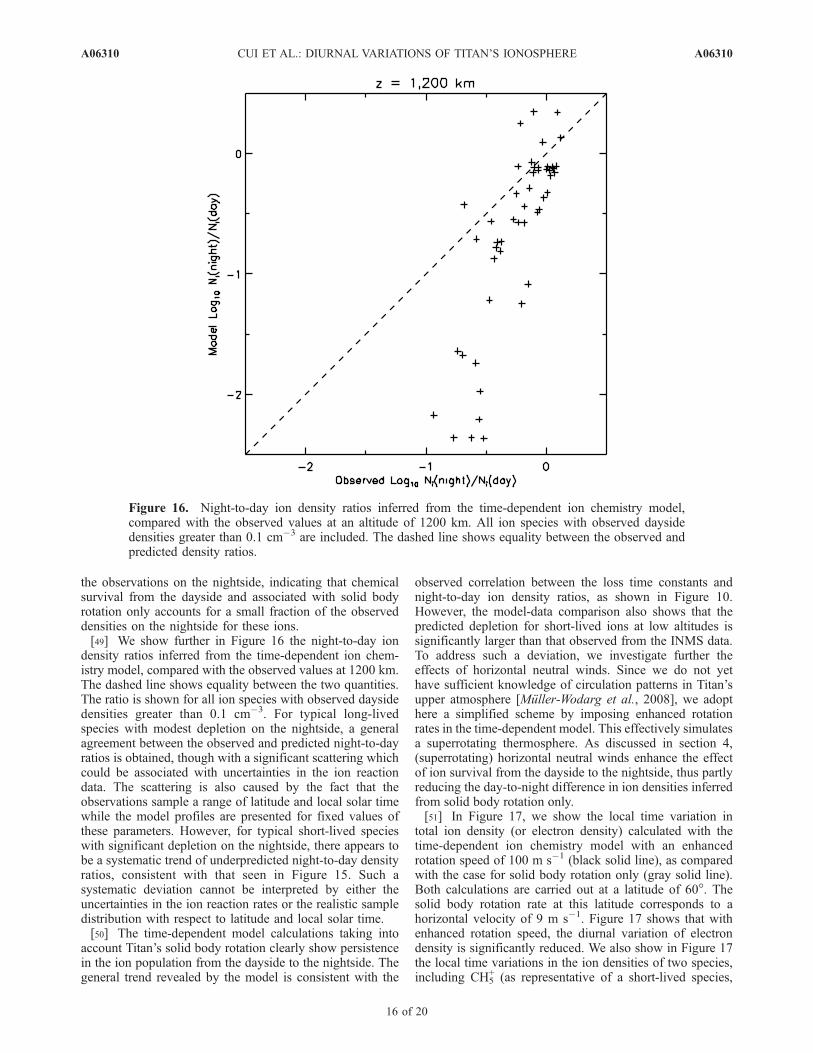
the observations on the nightside, indicating that chemicalsurvival from the dayside and associated with solid bodyrotation only accounts for a small fraction of the observeddensities on the nightside for these ions.[49] We show further in Figure 16 the night-to-day ion
density ratios inferred from the time-dependent ion chem-istry model, compared with the observed values at 1200 km.The dashed line shows equality between the two quantities.The ratio is shown for all ion species with observed daysidedensities greater than 0.1 cm�3. For typical long-livedspecies with modest depletion on the nightside, a generalagreement between the observed and predicted night-to-dayratios is obtained, though with a significant scattering whichcould be associated with uncertainties in the ion reactiondata. The scattering is also caused by the fact that theobservations sample a range of latitude and local solar timewhile the model profiles are presented for fixed values ofthese parameters. However, for typical short-lived specieswith significant depletion on the nightside, there appears tobe a systematic trend of underpredicted night-to-day densityratios, consistent with that seen in Figure 15. Such asystematic deviation cannot be interpreted by either theuncertainties in the ion reaction rates or the realistic sampledistribution with respect to latitude and local solar time.[50] The time-dependent model calculations taking into
account Titan’s solid body rotation clearly show persistencein the ion population from the dayside to the nightside. Thegeneral trend revealed by the model is consistent with the
observed correlation between the loss time constants andnight-to-day ion density ratios, as shown in Figure 10.However, the model-data comparison also shows that thepredicted depletion for short-lived ions at low altitudes issignificantly larger than that observed from the INMS data.To address such a deviation, we investigate further theeffects of horizontal neutral winds. Since we do not yethave sufficient knowledge of circulation patterns in Titan’supper atmosphere [Muller-Wodarg et al., 2008], we adopthere a simplified scheme by imposing enhanced rotationrates in the time-dependent model. This effectively simulatesa superrotating thermosphere. As discussed in section 4,(superrotating) horizontal neutral winds enhance the effectof ion survival from the dayside to the nightside, thus partlyreducing the day-to-night difference in ion densities inferredfrom solid body rotation only.[51] In Figure 17, we show the local time variation in
total ion density (or electron density) calculated with thetime-dependent ion chemistry model with an enhancedrotation speed of 100 m s�1 (black solid line), as comparedwith the case for solid body rotation only (gray solid line).Both calculations are carried out at a latitude of 60�. Thesolid body rotation rate at this latitude corresponds to ahorizontal velocity of 9 m s�1. Figure 17 shows that withenhanced rotation speed, the diurnal variation of electrondensity is significantly reduced. We also show in Figure 17the local time variations in the ion densities of two species,including CH5
+ (as representative of a short-lived species,
Figure 16. Night-to-day ion density ratios inferred from the time-dependent ion chemistry model,compared with the observed values at an altitude of 1200 km. All ion species with observed daysidedensities greater than 0.1 cm�3 are included. The dashed line shows equality between the observed andpredicted density ratios.
A06310 CUI ET AL.: DIURNAL VARIATIONS OF TITAN’S IONOSPHERE
16 of 20
A06310

see dotted lines) and HC3NH+ (as representative of a long-
lived species, see dashed lines), with the black lines givingthe results calculated with a wind speed of 100 m s�1 andthe gray lines for the case of solid body rotation only.
Superrotation affects the diurnal variations of both light andheavy ion species, though the difference in the ion densitiesof light species between the two model runs cannot be seenon the density scale of Figure 17.
Figure 17. The local time variations of total ion (or electron) density (solid lines), CH5+ density (dashed
lines), and HC3NH+ density (dotted lines), calculated with an enhanced rotation speed of 100 m s�1
(black lines) as compared with the case of solid body rotation only (gray lines). The enhanced rotationrate effectively simulates a superrotating horizontal wind in Titan’s upper atmosphere, which reduces theday-to-night difference in ion densities.
Figure 18. Same as Figure 15, except that an enhanced rotation speed of 100 m s�1 is adopted in themodel calculations.
A06310 CUI ET AL.: DIURNAL VARIATIONS OF TITAN’S IONOSPHERE
17 of 20
A06310
[52] Similar to Figure 15, we show in Figure 18 the iondensity profiles at different local solar times between 1000and 1500 km, calculated with the enhanced rotation rate of100 m s�1. At local noon, dawn and dusk, the densityprofiles calculated with the enhanced rotation rate aresimilar to those obtained for the case of solid body rotationonly. This implies that the ion densities at these local timesare primarily controlled by solar illumination. As we haveemphasized, the fact that solar illumination is still importantnear both the morning and evening terminators is because ofthe extended nature of Titan’s atmosphere [Muller-Wodarget al., 2000; Cravens et al., 2004; Agren et al., 2009]. On theother hand, at local midnight when photoionization is absentand chemical survival of dayside ions becomes important,the ion densities of all species shown in Figure 18 aresignificantly increased at all altitudes, as compared with themodel profiles for solid body rotation (see Figure 15). Thepredicted altitude profiles of long-lived ions are in roughagreement with the INMS data. However, Figure 18 showsthat even for the enhanced rotation rate, there is still cleardiscrepancy between the model and the data with respect tothe nightside densities of short-lived species such as CH5
+.We expect that such a discrepancy becomes less significantwhen imposing an even larger rotation rate. However, we donot present here model calculations with horizontal windspeeds larger than 100 m s�1 since they are probablyunrealistic [e.g., Muller-Wodarg et al., 2000, 2008]. Instead,the significant densities of short-lived ions observed onTitan’s nightside is more likely to be an indicator of impactionization by precipitating electrons from Saturn’s magne-tosphere, as mentioned in section 4. We will also attempt ina later work more rigorous modeling of the diurnal varia-tions of Titan’s ionosphere by adopting realistic generalcirculation patterns of neutral winds on Titan [e.g., Muller-Wodarg et al., 2000, 2008]. The downwelling and upwellingmotions associated with such wind patterns may redistributeboth short-lived and long-lived ions significantly.
6. Discussions and Conclusions
[53] In this paper, we present an analysis of the diurnalvariations of Titan’s ionosphere based on a sample ofINMS/OSI data obtained during 8 Cassini flybys with thesatellite. Though the INMS data show a general trend of iondepletion well beyond the terminator, the total ion densitieson the nightside are still appreciable, characterized by aplateau at a level of �700 cm�3 below �1300 km. There isclear asymmetry between the observed ion density profilesnear the morning and evening terminators, in that the iondensities at dawn are significantly lower than at dusk. Ouranalysis reveals clear distinctions between the ionosphericstructures of light and heavy ions in that light ions showstrong depletion on the nightside whereas the depletion ofheavy ions is less pronounced. The observed density plateauin the INMS total ion density distribution is the combinedresult of the distinct nightside distributions of light andheavy ions. The observed night-to-day ion density ratio isfound to be strongly correlated with ion lifetime.[54] The above observations suggest that the chemical
survival of dayside ions provides an important ion sourcefor the nightside of Titan. The distinctions between thediurnal variations of light and heavy ions are associated
with their different chemical loss pathways, in that light ionsare primarily lost through ion-neutral chemistry (with rela-tively small chemical time constants), while heavy ones areprimarily lost through electron dissociative recombination(with relatively large recombination time constants). Theobserved diurnal variation of the apparent exception, NH4
+,can also be interpreted by such a scenario, since NH4
+ isprimarily lost through recombination though it is a lightspecies. We have constructed a time-dependent ion chem-istry model to investigate the effects of chemistry andtransport on the ionospheric structures of Titan for the caseof solid body rotation and the case with superrotatinghorizontal winds. The general characteristics of the ob-served diurnal variations are well captured by the model.The model with superrotating winds presents significantlymore ions on the nightside, as compared with the case ofsolid body rotation only. However, in both cases thepredicted densities of short-lived ions (e.g., CH5
+) aresystematically lower than the observations on the nightside.[55] The discrepancy between the model and data with
respect to the nightside distribution of short-lived ions couldbe interpreted by electron precipitation from Saturn’s mag-netosphere. Both precipitation of magnetospheric electronsand ion survival from the dayside can contribute to Titan’snightside ionosphere and it is difficult to disentangle thecontributions of these two sources. There are several pow-erful arguments for the importance of electron precipitation.The significant densities of very short-lived ions (e.g., CH3
+,N+) on the nightside strongly suggests electron precipitationbecause it seems unlikely that these species could survivefrom the dayside. We have also shown that model calcu-lations based on electron precipitation can produce a night-side ion spectrum in rough agreement with the INMSobservations. Moreover, the correlations between electronflux and CH5
+ ion density demonstrated by Cravens et al.[2008b] shows that, at least for that encounter, electronimpact ionization was occurring on the nightside. However,it is dangerous to generalize this conclusion because themagnetospheric electron and ion fluxes measured during T5are far higher than for any other encounter [Cravens et al.,2008b]. One of the difficulties with assessing the impor-tance of magnetospheric precipitation is our lack of knowl-edge of the magnetic topology in the vicinity of Titan.Theoretical predictions of B field penetration into theionosphere are not yet precise enough to predict at whichlocations magnetospheric precipitation is important. Thusthough it is possible to explain much of the ionospheric datawith models that incorporate electron precipitation, it isunclear if agreement between models and data reflect thefree parameters that the models must employ or the under-lying physical reality. Finally, we note that electron precip-itation does not necessarily imply a connection withSaturn’s magnetosphere because it is possible that someregions on the nightside of Titan are magnetically connectedto the dayside and precipitating electrons could simply besuprathermal electrons from the dayside. Better knowledgeof the B field topology is required to investigate thispossibility.[56] Several characteristics of the observed ion densities
argue for the importance of chemical survival through day-to-night transport, enhanced by superrotating horizontalwinds. The different diurnal variations seen in short-lived
A06310 CUI ET AL.: DIURNAL VARIATIONS OF TITAN’S IONOSPHERE
18 of 20
A06310

and long-lived species, especially the strong correlationbetween the observed night-to-day ion density ratios andthe associated ion lifetimes, are naturally explained by sucha scenario. The observed asymmetry between the dawn anddusk ion density profiles also strongly supports this inter-pretation. Time-dependent model calculations show that thelong-lived ions can survive well into the nightside, with theobserved night-to-day density ratio of �2 naturallyexplained as a slow decay of density with local time. Forthe model calculations with superrotating horizontal winds,the good agreement between the calculated and observedaltitude profiles for long-lived ions on both the dayside andnightside of Titan is rather compelling since there is onlyone free parameter involved.[57] Investigation into the nature of Titan’s nightside
ionosphere can be extended in several ways. Collection ofmore data will certainly help, not only by further charac-terizing the variations with SZA, but also by enablingmeasurement of variations with other geophysical variables,such as longitude or magnetospheric interaction geometry(J. G. Luhmann et al., Magnetospheric plasma interactioneffects on Titan’s ionosphere, manuscript in preparation).Accurate models for the B field topology in the vicinity ofTitan would help enormously by permitting well con-strained theoretical predictions for the patterns and levelsof magnetospheric precipitation. Finally, simulations of thenightside ionosphere based on realistic general circulationmodels for neutral winds would allow more accurate esti-mation of the effects of chemical survival through day-to-night transport. We expect that the downwelling and up-welling motions associated with such models produce morecomplicated effects than predicted by the numerical experi-ments done so far. This also implies that with a betterunderstanding of the ion chemistry on Titan as well as abetter constraint on the contribution of electron precipita-tion, it may be possible to use the observed pattern ofdiurnal variations in Titan’s ionosphere to constrain thewind field.
[58] Acknowledgments. J.C. and M.G. are supported by the Scienceand Technology Facilities Council (STFC) rolling grant to Imperial CollegeLondon. R.V.Y. and P.P.L. acknowledge the support from NASA throughgrant NAG5-12699 to the University of Arizona and subcontract699083KC from the Southwest Research Institute. I.M.-W. is funded by aUniversity Research Fellowship of the British Royal Society. J.H.W. isfunded by NASA and the Jet Propulsion Laboratory contract 1283095 withSouthwest Research Institute.[59] Wolfgang Baumjohann thanks Janet Luhmann and Darrell Strobel
for their assistance in evaluating this paper.
ReferencesAgren, K., et al. (2007), On magnetospheric electron impact ionization anddynamics in Titan’s ram-side and polar ionosphere—A Cassini casestudy, Ann. Geophys., 25, 2359–2369.
Agren, K., J.-E. Wahlund, P. Garnier, R. Modolo, J. Cui, M. Galand, andI. C. F. Muller-Wodarg (2009), The ionospheric structure of Titan, Planet.Space Sci., doi:10.1016/j.pss.2009.04.012, in press.
Backes, H., et al. (2005), Titan’s magnetic field signature during the firstCassini encounter, Science, 308, 992–995, doi:10.1126/science.1109763.
Bird, M. K., R. Dutta-Roy, S. W. Asmar, and T. A. Rebold (1997), Detec-tion of Titan’s ionosphere from Voyager 1 radio occultation observations,Icarus, 130, 426–436, doi:10.1006/icar.1997.5831.
Carrasco, N., C. Alcaraz, O. Dutuit, S. Plessis, R. Thissen, V. Vuitton, R. V.Yelle, and P. Pernot (2008), Sensitivity of a Titan ionospheric model tothe ion-molecule reaction parameters, Planet. Space Sci., 56, 1644–1657, doi:10.1016/j.pss.2008.04.007.
Coates, A. J., F. J. Crary, G. R. Lewis, D. T. Young, J. H. Waite Jr., and E. C.Sittler Jr. (2007), Discovery of heavy negative ions in Titan’s ionosphere,Geophys. Res. Lett., 34, L22103, doi:10.1029/2007GL030978.
Cravens, T. E., J. Vann, J. Clark, J. Yu, C. N. Keller, and C. Brull (2004),The ionosphere of Titan: an updated theoretical model, Adv. Space Res.,33, 212–215, doi:10.1016/j.asr.2003.02.012.
Cravens, T. E., et al. (2005), Titan’s ionosphere: Model comparisons withCassini Ta data, Geophys. Res. Lett., 32, L12108, doi:10.1029/2005GL023249.
Cravens, T. E., et al. (2006), Composition of Titan’s ionosphere, Geophys.Res. Lett., 33, L07105, doi:10.1029/2005GL025575.
Cravens, T. E., I. P. Robertson, S. A. Ledvina, D. Mitchell, S. M. Krimigis,and J. H. Waite Jr. (2008a), Energetic ion precipitation at Titan, Geophys.Res. Lett., 35, L03103, doi:10.1029/2007GL032451.
Cravens, T. E., et al. (2008b), Model-data comparisons for Titans nightsideionosphere, Icarus, 199, 174–188, doi:10.1016/j.icarus.2008.09.005.
Cui, J., R. V. Yelle, and K. Volk (2008), Distribution and escape of mole-cular hydrogen in Titan’s thermosphere and exosphere, J. Geophys. Res.,113, E10004, doi:10.1029/2007JE003032.
Cui, J., et al. (2009), Analysis of Titan’s neutral upper atmosphere fromCassini Ion Neutral Mass Spectrometer measurements, Icarus, 200, 581–615, doi:10.1016/j.icarus.2008.12.005.
Davies, D. K., L. E. Kline, and W. E. Bies (1989), Measurements of swarmparameters and derived electron collision cross sections in methane,J. Appl. Phys., 65, 3311–3323, doi:10.1063/1.342642.
De La Haye, V., J. H. Waite Jr., T. E. Cravens, I. P. Robertson, and S.Lebonnois (2008), Coupled ion and neutral rotating model of Titan’supper atmosphere, Icarus, 197, 110 – 136, doi:10.1016/j.icarus.2008.03.022.
Flasar, F. M., R. E. Samuelson, and B. J. Conrath (1981), Titan’s atmo-sphere—Temperature and dynamics, Nature, 292 , 693 – 698,doi:10.1038/292693a0.
Fox, J. L., and R. V. Yelle (1997), Hydrocarbon ions in the ionosphere ofTitan, Geophys. Res. Lett., 24, 2179–2182.
English, M. A., L. M. Lara, R. D. Lorenz, P. R. Ratcliff, and R. Rodrigo(1996), Ablation and chemistry of meteoric materials in the atmosphereof Titan, Adv. Space Res. , 17 , 157 – 160, doi:10.1016/0273-1177(95)00774-9.
Galand, M., J. Lilensten, D. Toublanc, and S. Maurice (1999), The iono-sphere of Titan: Ideal diurnal and nocturnal cases, Icarus, 140, 92–105,doi:10.1006/icar.1999.6113.
Galand, M., R. V. Yelle, A. J. Coates, H. Backes, and J.-E. Wahlund (2006),Electron temperature of Titan’s sunlit ionosphere, Geophys. Res. Lett., 33,L21101, doi:10.1029/2006GL027488.
Gan, L., C. N. Keller, and T. E. Cravens (1992), Electrons in the ionosphereof Titan, J. Geophys. Res., 97, 12,137–12,151.
Hourdin, F., O. Talagrand, R. Sadourny, R. Courtin, D. Gautier, and C. P.McKay (1995), Numerical simulation of the general circulation of theatmosphere of Titan, Icarus, 117, 358–374, doi:10.1006/icar.1995.1162.
Hubbard, W. B., et al. (1993), The occultation of 28 SGR by Titan, Astron.Astrophys., 269, 541–563.
Ip, W.-H. (1990), Meteoroid ablation processes in Titan’s atmosphere,Nature, 345, 511–512, doi:10.1038/345511a0.
Keller, C. N., and T. E. Cravens (1994), One-dimensional multispecieshydrodynamic models of the wakeside ionosphere of Titan, J. Geophys.Res., 99, 6527–6536.
Keller, C. N., T. E. Cravens, and L. Gan (1992), A model of the ionosphereof Titan, J. Geophys. Res., 97, 12,117–12,135.
Keller, C. N., T. E. Cravens, and L. Gan (1994), One-dimensional multi-species magnetohydrodynamic models of the ramside ionosphere ofTitan, J. Geophys. Res., 99, 6511–6525.
Keller, C. N., V. G. Anicich, and T. E. Cravens (1998), Model of Titansionosphere with detailed hydrocarbon ion chemistry, Planet. Space Sci.,46, 1157–1174.
Kliore, A. J., et al. (2008), First results from the Cassini radio occultationsof the Titan ionosphere, J. Geophys. Res., 113, A09317, doi:10.1029/2007JA012965.
Liu, X., and D. E. Shemansky (2006), Analysis of electron impact ioniza-tion properties of methane, J. Geophys. Res., 111, A04303, doi:10.1029/2005JA011454.
Lopez-Moreno, J. J., et al. (2008), Structure of Titan’s low altitude ionizedlayer from the Relaxation Probe onboard HUYGENS, Geophys. Res.Lett., 35, L22104, doi:10.1029/2008GL035338.
Lummerzheim, D., and J. Lilensten (1994), Electron transport and energydegradation in the ionosphere: Evaluation of the numerical solution,comparison with laboratory experiments and auroral observations, Ann.Geophys., 12, 1039–1051, doi:10.1007/s005850050127.
Ma, Y.-J., A. F. Nagy, T. E. Cravens, I. V. Sokolov, K. C. Hansen, J.-E.Wahlund, F. J. Crary, A. J. Coates, and M. K. Dougherty (2006), Com-
A06310 CUI ET AL.: DIURNAL VARIATIONS OF TITAN’S IONOSPHERE
19 of 20
A06310

parisons between MHD model calculations and observations of Cassiniflybys of Titan, J. Geophys. Res., 111, A05207, doi:10.1029/2005JA011481.
McLain, J. L., V. Poterya, C. D. Molek, N. G. Adams, and L. M. Babcock(2004), Flowing afterglow studies of the temperature dependencies fordissociative recombination of O2
+, CH5+, C2H5
+ and C6H7+ with electrons,
J. Phys. Chem. A, 108, 6704–6708, doi:10.1021/jp040215l.Molina-Cuberos, G. J., H. Lammer, W. Stumptner, K. Schwingenschuh,H. O. Rucker, J. J. Lopez-Moreno, R. Rodrigo, and T. Tokano (2001),Ionospheric layer induced by meteoric ionization in Titan’s atmosphere,Planet. Space Sci., 49, 143–153, doi:10.1016/S0032-0633(00)00133-1.
Muller-Wodarg, I. C. F., R. V. Yelle, M. Mendillo, L. A. Young, and A. D.Aylward (2000), The thermosphere of Titan simulated by a global three-dimensional time-dependent model, J. Geophys. Res., 105, 20,833–20,856.
Muller-Wodarg, I. C. F., R. V. Yelle, J. Cui, and J. H. Waite Jr. (2008),Horizontal structures and dynamics of Titan’s thermosphere, J. Geophys.Res., 113, E10005, doi:10.1029/2007JE003033.
Nagy, A. F., and T. E. Cravens (1998), Titans ionosphere: A review, Planet.Space Sci., 46, 1149–1155.
Richards, P. C., J. A. Fennelly, and D. G. Torr (1994a), EUVAC: A solarEUV flux model for aeronomic calculations, J. Geophys. Res., 99, 8981–8992.
Richards, P. C., J. A. Fennelly, and D. G. Torr (1994b), Correction to‘‘EUVAC: A solar EUV flux model for aeronomic calculations’’, J. Geo-phys. Res., 99, 13,283.
Roboz, A., and A. F. Nagy (1994), The energetics of Titan’s ionosphere,J. Geophys. Res., 99, 2087–2093.
Samson, J. A. R., T. Masuoka, P. N. Pareek, and G. C. Angel (1987), Totaland dissociative photoionization cross sections of N2 from threshold to107 eV, J. Chem. Phys., 86, 6128–6132, doi:10.1063/1.452452.
Samson, J. A. R., G. N. Haddad, T. Masuoka, P. N. Pareek, and D. A. L.Kilcoyne (1989), Ionization yields, total absorption, and dissociativephotoionization cross sections of CH4 from 110–950 A, J. Chem. Phys.,90, 6925–6932, doi:10.1063/1.456267.
Schunk, R. W., and A. F. Nagy (2000), Ionospheres: physics, plasma phy-sics, and chemistry, in Cambridge Atmos. Space Sci. Ser., edited by A. J.Dressler, J. T. Houghton, and M. J. Rycroft, 117 pp., Cambridge Univ.Press, Cambridge, U. K.
Stolte, W. C., Z. X. He, J. N. Cutler, Y. Lu, and J. A. R. Samson (1998),Dissociative photoionization cross sections of N2 and O2 from 100 to800 eV, At. Data Nucl. Data Tables, 69, 171–179.
Tokano, T., F. M. Neubauer, M. Laube, and C. P. McKay (1999), Seasonalvariation of Titans atmospheric structure simulated by a general circula-tion model, Planet. Space Sci., 47, 493–520.
Vuitton, V., R. V. Yelle, and V. G. Anicich (2006), The nitrogen chemistryof Titan’s upper atmosphere revealed, Astrophys. J., 647, L175–L178,doi:10.1086/507467.
Vuitton, V., R. V. Yelle, and M. J. McEwan (2007), Ion chemistry andN-containing molecules in Titan’s upper atmosphere, Icarus, 191, 722–742, doi:10.1016/j.icarus.2007.06.023.
Vuitton, V., P. P. Lavvas, R. V. Yelle, M. Galand, A. Wellbrock, G. R.Lewis, A. J. Coates, and J.-E. Wahlund (2009), Negative ion chemistryin Titan’s upper atmosphere, Planet. Space Sci., doi:10.1016/j.pss.2009.04.004, in press.
Wahlund, J.-E., et al. (2005), Cassini measurements of cold plasma in theionosphere of Titan, Science, 308, 986, doi:10.1126/science.1109807.
Waite, J. H., Jr., et al. (2004), The Cassini Ion and Neutral Mass Spectro-meter (INMS) investigation, Space Sci. Rev., 114, 113–231, doi:10.1007/s11214-004-1408-2.
Waite, J. H., Jr., et al. (2005), Ion neutral mass spectrometer results from thefirst flyby of Titan, Science, 308, 982 – 986, doi:10.1126/science.1110652.
Waite, J. H., Jr., D. T. Young, T. E. Cravens, A. J. Coates, F. J. Crary,B. Magee, and J. Westlake (2007), The process of tholin formation inTitans upper atmosphere, Science, 316, 870 – 875, doi:10.1126/science.1139727.
Yelle, R. V., N. Borggren, V. de La Haye, W. T. Kasprzak, H. B. Niemann,I. C. F. Muller-Wodarg, and J. H. Waite Jr. (2006), The vertical structureof Titan’s upper atmosphere from Cassini Ion Neutral Mass Spectrometermeasurements, Icarus, 182, 567–576, doi:10.1016/j.icarus.2005.10.029.
Yelle, R. V., J. Cui, and I. C. F. Muller-Wodarg (2008), Methane escapefrom Titan’s atmosphere, J. Geophys. Res., 113, E10003, doi:10.1029/2007JE003031.
�����������������������T. E. Cravens, Department of Physics and Astronomy, University of
Kansas, Lawrence, KS 66045, USA.J. Cui, M. Galand, and I. C. F. Muller-Wodarg, Space and Atmospheric
Physics Group, Department of Physics, Imperial College, Prince ConsortRoad, London SW7 2BW, UK. ([email protected])W. T. Kasprzak, Solar System Exploration Division, NASA Goddard
Space Flight Center, Greenbelt, MD 20771, USA.P. P. Lavvas and R. V. Yelle, Lunar and Planetary Laboratory, University
of Arizona, 1629 East University Boulevard, Tucson, AZ 85721, USA.V. Vuitton, Laboratoire de Planetologie de Grenoble, Universite Joseph
Fourier/CNRS, F-38041 Grenoble, France.J.-E. Wahlund, Uppsala Division, Swedish Institute of Space Physics,
Box 537, SE-751 21 Uppsala, Sweden.J. H. Waite Jr., Space Science and Engineering Division, Southwest
Research Institute, 6220 Culebra Road, San Antonio, TX 78238, USA.
A06310 CUI ET AL.: DIURNAL VARIATIONS OF TITAN’S IONOSPHERE
20 of 20
A06310