diverse teams, team effectiveness, and the moderating
TRANSCRIPT

Minnesota State University, Mankato Minnesota State University, Mankato
Cornerstone: A Collection of Scholarly Cornerstone: A Collection of Scholarly
and Creative Works for Minnesota and Creative Works for Minnesota
State University, Mankato State University, Mankato
All Graduate Theses, Dissertations, and Other Capstone Projects
Graduate Theses, Dissertations, and Other Capstone Projects
2020
Diverse Teams, Team Effectiveness, and the Moderating Effect of Diverse Teams, Team Effectiveness, and the Moderating Effect of
Organizational Support Organizational Support
Hannah Tilstra Minnesota State University, Mankato
Follow this and additional works at: https://cornerstone.lib.mnsu.edu/etds
Part of the Industrial and Organizational Psychology Commons
Recommended Citation Recommended Citation Tilstra, H. (2020). Diverse teams, team effectiveness, & the moderating effect of organizational support [Master’s thesis, Minnesota State University, Mankato]. Cornerstone: A Collection of Scholarly and Creative Works for Minnesota State University, Mankato. https://cornerstone.lib.mnsu.edu/etds/1040
This Thesis is brought to you for free and open access by the Graduate Theses, Dissertations, and Other Capstone Projects at Cornerstone: A Collection of Scholarly and Creative Works for Minnesota State University, Mankato. It has been accepted for inclusion in All Graduate Theses, Dissertations, and Other Capstone Projects by an authorized administrator of Cornerstone: A Collection of Scholarly and Creative Works for Minnesota State University, Mankato.

Diverse Teams, Team Effectiveness, & the Moderating Effect of Organizational Support
By
Hannah Tilstra
A Thesis Submitted in Partial Fulfillment of the
Requirements for the Degree of
Master of Arts
In
Industrial Organizational Psychology
Minnesota State University, Mankato
Mankato, Minnesota
May 2020

i
April 30, 2020
Diverse Teams, Team Effectiveness, and the Moderating Effect of Organizational
Support
Hannah Tilstra
This thesis has been examined and approved by the following members of the student’s
committee.
__________________________________________________
Advisor
__________________________________________________
Committee Member
__________________________________________________
Committee Member
ii
Acknowledgements
I’ve been supported by many people in the process of developing this thesis, and
also through my graduate student career at Minnesota State University, Mankato (MSU).
First, I’d like to thank my advisor, Andi Lassiter, for her guidance throughout this
process, and for allowing me to use her dataset for this analysis. You’ve taught me more
about I/O psychology, and life, than you could ever imagine. Thank you for encouraging
me to do this!
Next, I’d like to thank my committee members, Lisa Perez and Emily Boyd.
Thank you for your suggestions and advice. Your insight has added a new layer to my
understanding of diversity in the workplace; you’ve made this a valuable learning
experience in my educational journey.
Special thanks to the faculty who have guided me during my time studying at
MSU. You have helped me grow as a student and a professional. The knowledge you’ve
helped me cultivate will guide me as I grow in my own career, and as I aim to help others
do the same; thank you.
Finally, I’d like to thank my family and friends for supporting me throughout this
project. I am so grateful for the encouragement you’ve given me. In particular, I’d like to
thank my mom, Janet, who allowed me to use her as a sounding board while I worked to
complete this project. Thank you for being my cheerleader and my devil’s advocate!

iii
Table of Contents
Acknowledgements ............................................................................................................. ii
Abstract .............................................................................................................................. iv
Introduction ..........................................................................................................................1
Theoretical Perspectives. .....................................................................................................1
Diversity Defined. ................................................................................................................3
Dimensions of Diversity. .....................................................................................................4
Mediators and Moderators of Team Diversity ...................................................................10
Team Research. .................................................................................................................. 11
Defining Team. ...................................................................................................................12
Team Training Research. ...................................................................................................13
Hypotheses .........................................................................................................................16
Methodology ......................................................................................................................17
The Archival Study ............................................................................................................18
Procedures ..........................................................................................................................19
Results ................................................................................................................................24
Discussion ..........................................................................................................................52
References ..........................................................................................................................58

iv
DIVERSE TEAMS, TEAM EFFECTIVENESS, AND THE MODERATING EFFECT
OF ORGANIZATIONAL SUPPORT.
HANNAH TILSTRA
A THESIS SUBMITTED IN PARTIAL FULFILLMENT OF THE
REQUIREMENTS FOR THE DEGREE OF
MASTER OF ARTS IN INDUSTRIAL ORGANIZATIONAL PSYCHOLOGY
MINNESOTA STATE UNIVERSITY, MANKATO
MANKATO, MINNESOTA
MAY 2020
Abstract
This study adds to the growing literature on diversity in teams and team effectiveness.
This study reviews the literature examining theoretical perspectives of diversity in teams,
surface-level diversity attributes, team training and team outcomes. To test hypotheses, an
archival dataset from a study focusing on team training, which is coded to represent the
presence of gender and ethnic diversity on teams. Variables including team performance,
shared mental models, and team behavioral processes are used to measure team
effectiveness. The results of this analyses suggest mixed results, but do indicate that
teams with diversity are more effective, particularly in measures of coordination,
interaction mental models, and transition processes. Teams with gender diversity are
shown to outperform teams without gender diversity for most measures, while teams with
ethnic diversity only outperformed teams without ethnic diversity on transition processes.
When teams received training, diverse teams were shown to be more effective than
homogenous teams for measures of coordination and team interaction accuracy mental
models. These results indicate a need for further research on the impact team training and
other forms of organizational support has for diverse teams. Practically, these results also
suggest that diverse teams are more effective than homogenous teams in many areas, and
that team training is a viable option for organizations looking to improve diverse team
effectiveness.

1
Introduction
The last century has seen major changes in the workforce: technology has grown,
businesses have expanded beyond their national boundaries, equality initiatives have
surfaced, and organizations now, more than ever, employ people of varied races, ages,
sexes, genders, and religions. These changes have created new challenges in the
workplace. Research related to benefits and difficulties present within diverse
organizations is important (Christian, Porter, & Moffit, 2006). Particularly relevant
perhaps, is research that can be prescribed to improve diverse team functioning in this
evolving, diverse workforce. One area that addresses this need is research on
organizational initiatives that can support diverse team effectiveness.
Theoretical Perspectives.
Findings from the literature on workplace diversity are, ironically, diverse. These
broad research findings are likely due to the complexity of the construct and frequent
oversimplification of this complex topic by researchers (Bell et al., 2010). Although
researchers have been studying the implications of diversity in the workforce for decades,
studies produce mixed results which can be confusing to untangle. Most researchers
study diversity by looking for differences between various attributes individuals in a
group possess and focus on ideas grounded in one of three theoretical perspectives
(Horwitz & Horwitz, 2007; Ely & Thomas, 2001).
The similarity attraction paradigm (Byrne, 1971), social categorization theory
(Tajfel, 1969; Tajfel & Turner, 1979), and the informational diversity-cognitive resource

2
perspective (Cox & Blake, 1991) lend themselves to opposing outcomes in diversity
research.
Both the similarity attraction paradigm and the social categorization theory
suggest that increased levels of diversity may decrease positive team outcomes. The
similarity attraction paradigm claims that we are attracted to people who are like us
(Wiersema & Bantel, 1992). Similarly, social categorization theory states that people
naturally categorize others into subgroups. For diverse work groups, this implies that
team members will categorize each other into different groups, potentially forming an in-
group out-group bias and ultimately, decreasing productivity due to subgroup dynamics
(Brewer, 1979; Brewer, 1995; Knippenberg et al., 2004). Based on social categorization
theory, McGrath’s Expectation Model (1995) goes further to suggest a negative link in
team performance and biodemographic diversity due to stereotypes, or expectations,
individuals possess about the other member’s social category.
In contrast to the aforementioned theories, the informational diversity – cognitive
resource perspective states that demographic diversity can improve productivity (Cox &
Blake, 1991). The informational diversity – cognitive resource perspective is the idea that
differences in demographics indicate a wider range of perspectives and information that
can be used by the group. In this case, diversity can contribute to group success, rather
than hinder it (Cox & Blake, 1991). Based on these theoretical perspectives, the type of
diversity (either job-related or less job-related demographic attributes) is thought to relate
to performance, (Pelled, 1996). Research that is informed by the information diversity-
cognitive resource perspective largely focuses on deep-level attributes of diversity,

3
however, little research on the impact team training may have on inducing understanding
of deep-level attributes has been conducted.
These theoretical perspectives support different conclusions, but all three agree
that there is evidence of a relationship between diversity and performance. The social
categorization theory and the similarity-attraction paradigm support a negative
relationship between diversity and performance (Price, Harrison, Gavin, & Florey, 2002;
Simons, Pelled, & Smith, 1999; Wiersema & Bantel, 1992). However, using the
informational diversity – cognitive resource perspective, Bantel (1994) suggests that
greater levels of diversity result in better team performance. Other researchers have
agreed with this notion, stating that certain attributes result in greater team performance
(Price et al., 2002; Mohammed & Angell, 2004). These results indicate that the
operationalization of diversity and team outcomes is important in distinguishing the
effects of diversity; they also indicate that further analysis of mediators and moderators of
diverse workgroups are necessary for a better understanding and application of diversity
literature.
This study will focus on the informational diversity – cognitive resource perspective,
which hypothesizes that diverse teams will perform better than homogenous teams due to
the varying perspectives of team members.
Diversity Defined.
Before further understanding the impacts of diversity, one must know how to
define diversity. One simple definition of diversity is “the condition of having or being
composed of differing elements or qualities” (Merriam-Webster, 2003). For the purpose
4
of defining workplace diversity, this definition is not enough. In organizational and
professional environments, diversity can be best described as the distributional
differences among members of a team along a common attribute (Harrison & Klein,
2007). In the context of team diversity, diversity is an umbrella term for the level of
heterogeneity or homogeneity team members’ attributes provide the group.
Dimensions of Diversity.
Dimensions of diversity vary throughout the literature. Researchers have categorized
diversity paradigms along spectrums of biodemographic and task-related diversity; heterogeneity
or sub-group differences; heterogeneity vs. homogeneity; detectable vs. undetectable; levels of
visibility vs. job relatedness; observable individual differences vs. underlying attributes, and
many others (Ely & Thomas, 2001; Kanter, 1977; Pelled, Eisenhardt & Xin, 1999, Bell, Villado,
Lukasik, Belau, & Briggs, 2010). Despite the broad range of characteristics operationalized in
diversity literature, the bulk of diversity research can be understood as focusing on either
demographic diversity, psychological diversity, and organizational diversity. Demographic
diversity is defined as characteristics of individuals easily diagnosed by others as similar or
different to themselves (e.g. race, sex, age, etc.). Psychological diversity is defined as
characteristics that contribute to the way an individual perceives job-related tasks and approaches
situations (e.g. personality traits, values, beliefs, etc.). Organizational diversity is defined as
attributes and differences in understanding of an individuals’ work based on their experience (e.g.
education, work experience, organizational tenure, etc.), (Jackson, Joshi, & Erhardt, 2003;
Milliken & Martins, 1996; Steward, 2006; Williams & O’Reilly, 1998).
These three categories of diversity can be, and often have been, simplified by
dichotomizing diverse attributes as either surface-level or deep-level diversity (Milliken &
Martens, 1996; Ely & Thomas, 2001; Mohammed & Angell, 2004). Surface-level diversity

5
accounts for diverse attributes that are visible and identifiable immediately (race, age, sex, etc.),
while deep-level diversity accounts for attributes under the psychological and organizational
diversity umbrellas. Deep-level diversity is made up of all the unseen aspects of diversity that
influence an individual’s perspective (education, personality, values, work experience, etc.)
(Mohammed & Angell, 2004). This study uses this dichotomy of diversity, surface-level and
deep-level attributes, in its understanding of diversity in teams.
Deep Level Diversity.
Deep-level diversity attributes have the strongest link to positive impacts on teams and
team performance (Mohammad & Angell, 2004; Horwitz & Horwitz, 2007). However, like most
diversity research, this link is only present under specific circumstances. One such circumstance
occurs when teams have been together for a long time. In cases where teams have been together
for some time, teams with more deep-level diversity perform better and are more cohesive.
Researchers speculate that this is due to the fact that teams have had time to identify and use each
other’s knowledge and background; it’s likely that deep-level attributes are not identified by
members in the short term, and thus are not as immediately impactful on team outcomes as other
factors (Mohammad & Angell, 2004). Research shows support for this idea, indicating that
homogenous teams have been found to perform better than diverse teams in the short term
(Simons, Pelled, & Smith, 1999).
In contrast, the purpose of a team affects whether deep-level diversity attributes,
specifically role-related knowledge and skill, have positive impact on team outcomes. In this
case, teams that have high levels of task diversity within the team structure are more productive
and more cohesive than teams that are low in task diversity (Mohammed & Angell, 2004; Bell,
Villado, Lukasik, Belau, and Briggs, 2010).

6
Deep-level diversity covers attributes such as personality traits (often measured by Big
Five personality traits), values, morals, beliefs, and organizational function and tenure
(Mohammed & Angell, 2004). The impact of these attributes on team functioning is again mixed.
Generally, deep-level diversity produces the strongest link between diversity and positive team
outcomes. It’s speculated that this occurs because teams develop knowledge of members’ deep-
level attributes over time through observation of behavior and disconfirmation of stereotypes
formed from initial surface-level attributes (Bell et al., 2010).
Surface Level Diversity.
Overall, the effects identified by surface-level diversity research are inconsistent.
This is likely because surface-level diversity attributes affect people immediately, and
often unconsciously (Mohammed & Angell, 2004; Bell et al., 2010; Simons et al., 1999).
However, research is clear that when it comes to surface-level attributes, people are
drawn to others most like themselves and thus form stronger initial attachments to those
with the most similarity to themselves (Simmons et al., 1999, Salazar, Feitosa, and Salas,
2017). Likely, for better or worse, a majority of the effects from surface-level diversity
are caused by individual schemas, stereotypes, and heuristics.
Research shows that increasing surface-level diversity among members of a team
tends to create greater perceptions of interpersonal conflict, decrease communication,
decrease cohesion, and increase perceptions of disrespectful behavior. Pelled (1996) was
the first to identify that the more visible a diverse attribute, the stronger the association
the attribute has with relationship conflict. Other research related to surface-level
diversity has identified negative effects of heterogeneity of gender, age, ethnicity, and

7
racial diversity on relationship conflict (Pelled, 1996; Jehn & Bezrukova, 2004; Thatcher,
Jehn, & Zanutto, 1998).
In time, these surface level diversity effects have been shown to mitigate
themselves as deep-level diverse attributes become more prominent (Pelled, 1996). This
pattern may result because surface-level attributes tend to have a greater impact on initial
impressions among team members than deep-level attributes. Additionally, surface-level
attributes have more negative, culturally reinforced associations linked to them.
However, when analyzed in a meta-analytic fashion, the effects of surface-level
attributes on team effectiveness are inconsistent. Horwitz and Horwitz (2007) found no
relationship with bio-demographic (surface-level) diversity and team performance quality
and quantity. The relationship between surface-level diversity and other areas of team
performance produced inconclusive results. In general, this research has focused on
surface-level attributes as one category of diversity, but upon further analysis, surface-
level attributes are an overarching category of many demographic traits, including race,
age, and gender. (Horwitz & Horwitz, 2007). These traits may be best researched
separately, given that in minority groups, each trait has different cultural stereotypes
associated with it.
When researchers examine specific individual attributes of surface-level diversity,
a clearer picture of these attributes’ implications is portrayed. An overview of the two
most commonly studied surface-level attributes (gender, race and ethnicity) is provided
below.

8
Racial & Ethnic Diversity.
Research on racial diversity reveals effects on team outcomes, but little research
has been conducted on specific team outcomes, including performance (Williams &
O’Reilly, 1998). Pelled (1999) found that racial diversity was related to higher levels of
emotional conflict in teams. Williams and O’Reilly (1998) on the other hand, reported
contrasting results – stating that high levels of racial diversity had no relationship or even
a positive relationship with team outcomes. However, Williams and O’Reilly (1998) also
stated that most evidence supports the idea that racial heterogeneity has negative effects
on team outcomes. They qualify this information by reporting that the negative effects of
racial heterogeneity are mitigated, and even eliminated in some cases, if the conflict is
handled appropriately (Timmerman, 2000). Traditionally, research supports the idea that
racial diversity has negative effects on team outcomes, however, recent research has
highlighted the need for research on the effects of racial diversity on team performance
with attention to additional factors including length of time together as a group, task type,
and specific types of ethnic diversity to come to more conclusive results (Bell et al.,
2010; Timmerman, 2000; Williams and O’Reilly, 1998).
Gender Diversity.
Gender diversity research indicates gender diversity significantly impacts team
performance, but how, is highly debated amongst researchers.
Some research indicates that though gender diversity may impact some team
performance outcomes positively, gender diversity may negatively impact team
processes, such as coordination and communication (Hamilton et al., 2003). In more

9
recent years, Adams and Ferreira (2009) used a field study to analyze the impact of
gender diversity on board success in several industries. Their results indicated that
overall, higher levels of gender diversity had a negative relationship with RoA (return on
assets).
In contrast, Hansen, Owan, and Pan (2006) in a study of student groups working
towards grades on a group assignment found that man-dominated groups performed
worse as a group than both diverse groups and woman-dominated groups. Similarly,
Hoogendoorn, Hessel, and Mirjam (2013) conducted a study which determined that
gender heterogeneous teams outperformed man-dominated, homogenous teams. Many
researchers agree that gender heterogeneity leads to higher levels of performance in
teams and may lead to other positive team outcomes (Hamilton et al., 2003; Adams &
Ferreira, 2009).
Studies of team process indicate that gender heterogenous groups were more
generous and egalitarian, among other factors (Dufwenberg & Muren, 2006).
Additionally, it should be noted that many studies have suggested that mediating factors,
(such as team tenure and personality traits of team members), may influence team
outcomes for gender heterogenous teams (Pelled et al., 1999). The research on gender
diversity in teams is mixed in results, with many confounding variables. However, it’s
important to understand that most studies consistently find an effect on team outcomes
and processes when teams are evenly mixed between men and women – whether that
effect is negative or positive may be dependent on situational factors.

10
Surface Level Attributes Summarized.
Many researchers have broken down attributes related to surface-level diversity
and team outcomes to determine how certain types of diversity affect team performance
(Amason, Shrader & Tompsen, 2006; Ancona and Caldwell, 1992; Bell, 2007; Edwards
et al. 2006; Ensley, and Hmieleski 2005; Hamilton, Nickerson, and Owan, 2012). The
results of these studies are primarily negative, but the impact of specific attributes vary.
There are many reasons why surface-level diversity in the workplace, although
contradictory in its results, is still important for future study. Primarily, this is because
surface-level attributes (e.g. race, gender, etc.) tend to cause more disadvantages for
minority groups in the workplace than deep-level attributes (e.g. values, beliefs,
functional background, etc.). This is widely due to heuristics, stereotypes and
unconscious biases play into these visible attributes more than other, less visible
characteristics (Mohammed & Angell, 2004; Bell, 2007; Hamilton et al., 2012).
It should also be noted that very little research exists to identify to what extent
organizational supports can overcome the negative effects surface-level diversity may
create. This study aims to shed a light on the impact team training may have on diverse
team effectiveness.
Mediators and Moderators of Team Diversity
In recent years, diversity researchers have shifted from identifying main effects of
diversity and have decided to look at mediators and moderators of diverse team
performance. Mediators and moderators are a third variable that will impact the strength
and direction of the relationship between team heterogeneity and team effectiveness

11
(Knippenberg & Schippers, 2007). This shift in approach is typically due to the lack of
consistent findings among diversity researchers.
Analysis of mediation and moderation effects on diversity suggest a need for
additional research on factors which impact diverse team success (Horwitz & Horwitz,
2007; Salazar et al., 2017; Wegge & Shemla, 2015; Wegge & Shemla, 2019; Price et al.,
2002; Hentschel, Shemla, Wegge & Kearney, 2013). One such area that could benefit
teams would be the moderating effect team training (and other organizational support
initiatives) has on performance for diverse teams, which may consequently impact team
perceptions of diversity. For example, it can be expected that organizational training
efforts designed to help team members identify their unique roles/expertise would
promote shared understanding among team members where it is lacking, thus improving
team effectiveness and team outcomes. It is important that research is conducted to
determine whether team training is indeed beneficial for diverse teams with high variance
in surface – level attributes. The purpose of the current study is to examine the affect
organizational support, such as team training, will have on the relationship between
surface – level diversity and team effectiveness.
Team Research.
Much of team diversity research, and team research in general, has focused on the
impact various attributes of teams have on team effectiveness. Results of team diversity
studies are mixed, but many speculate that this is due to differences in the categorization
of diversity in various studies, team characteristics, team purpose, and other team-specific
12
factors (Bell, 2007) - for the purpose of team diversity research, this is why it’s important
to clarify what is meant by team, and consequently, team effectiveness.
Defining Team.
Researchers can define team loosely or specifically, but most accept that the
definition of ‘team’ refers to two or more individuals who interact socially, possess
common goals, and perform tasks that are organizationally relevant. To be deemed a
‘team,’ individuals within the group must also exhibit some sort of interdependence in
respect to their workflow, outcomes, purpose, and goals (Salas, 2008).
The nature of a team requires teams to follow a process to complete their purpose.
Hackman & Morris (1975) indicated teams go through three phases: First, a team must
determine what ‘inputs’ they will provide to aid in the process the team embarks on.
Second, the team completes a ‘process’ in which they work toward accomplishing a goal.
When the process is completed, team ‘outputs’ are produced. Often, these outputs are the
result of a team accomplishing it’s goals. The quality of these outputs are how team
effectiveness and performance are evaluated (Hackman & Morris, 1975).
According to this model, multiple factors can impact effectiveness. Most relevant
to the purpose of this study is team composition. Team composition refers to the balance
(or imbalance) of team members’ knowledge, skills, abilities, and other identifying
characteristics as each relates to the team purpose (Hackman & Morris, 1975; Ensley et
al., 2005; Amason et al., 2006). Surface-level diversity directly contributes to team
composition. Aspects of team composition that will be investigated in this study include
the presence of diversity in two surface – level attributes (gender and ethnicity).

13
Team Training Research.
In addition to the recent surge in team diversity research, team training has been
consistently examined to determine optimal types of training and team building
interventions to improve team outcomes and processes. Team training has been defined as
a set of strategies that create a context in which team skills can be practiced, assessed and
learned (Salas & Cannon-Bowers, 1997). The way team training is used and implemented
varies across teams depending on the goal of the training and the structure of the team
(Stevens & Yarish, 1999).
Salas, E., DiazGranados, D., Klein, C., Burke, C. S., Stagl, K. C., Goodwin, G. F.,
& Halpin, S. M. (2008) comprehensively analyzed the impact of team training on team
outcomes. After conducting a metanalytic study on the effectiveness of team training
strategies the analysis determined that team training is effective in improving team
outcomes; thus, team training works. Based on this comprehensive analysis, this
conclusion stands regardless of type of team training/training content and team outcomes
(Salas et al., 2008).
Types of Team Training.
This study will use an archival dataset from a previous study which used two
types of team training to analyze diverse team outcomes: interpositional and interactional
training. Both forms of team training are designed to help teams improve performance,
but the catalyst for improving performance changes depending on the training strategy
(Salas & Cannon-Bowers, 1997; Cannon-Bowers & Salas, 2000; Salas, et al., 2008).
Interpositional training builds team members’ knowledge of different members’ roles,

14
which in turn improves team understanding of collective responsibilities (Volpe, Cannon-
Bowers, Salas, & Spector, 1996). On the other hand, interactional training aims to
improve team performance by developing behavioral strategies and knowledge of
effective teamwork skills (Fowlkes et al., 1994; Salas & Cannon-Bowers, 2000). The
effects of team training (both interpositional and interactional) may cause diverse teams
to acknowledge and become aware of deep – level diverse attributes which may lead to
more positive team outcomes.
Team Outcomes.
Team outcomes allow us to measure team success in a variety of areas. Salas et al.
(2008) identify outcomes as either cognitive, affective, process, or performance. It’s
important to note that some researchers have compiled process and performance
outcomes into one category, deeming them “skill-based” outcomes (Kraiger, Ford, &
Salas, 1993). This study will focus on task completion, cognitive team outcomes, and
skill-based team outcomes for diverse teams. Specific variables analyzed in this study
include overall team performance, shared mental models, and team behavioral processes.
Team Performance.
Team performance is often assessed by determining whether, and how well, a
team was able to achieve it’s goal. For the purposes of this study, two measures of
performance, total team points and total team kills earned on a video game simulation
activity, will be used.

15
Shared Mental Models.
Mental models are the structures that team members develop to translate
information regarding team and team performance requirements. These models may be
defined by connecting team purposes, team characteristics, and team collective actions
required by individual members to successfully complete their team purpose (Zaccaro,
Ardison, & Orvis, 2004, p. 279; Cannon-Bowers, Salas, & Converse, 1993; Klimoski &
Mohammed, 1994). When a team has a shared mental model, it means that team members
understand team characteristics, purposes, and collective actions similarly; they have a
shared understanding of knowledge, beliefs, perceptions, and expectations related to team
performance– in other words, these teams are “on the same page” (Klimoski &
Mohammed, 1994).
Both interpositional training and interactional training directly contribute to the
development of shared mental models among team members (Volpe et al., 1996;
McCann, Baranski, Thompson & Pigeau, 2000; Marks et al., 2000). Several types of
mental models have been identified in previous research: equipment, task, team-role, and
team-interaction (Cannon-Bowers et al., 1993). Team-role and team-interaction mental
models are used as shared mental model outcomes in this study.
In the context of diverse teams, shared mental models are particularly important
given each team member brings a different perspective based on their individual
attributes and experience. Despite the importance of the development of these shared
mental models in diverse teams, little research has been done to determine whether team
training impacts the quality of shared mental models for diverse teams.

16
Team Behavioral Processes.
Team behavioral processes are directly impacted by the development and use of
shared mental models; the knowledge team members possess from shared mental models
should allow them to integrate and coordinate their behaviors to work together more
effectively (Marks et al., 2000; Rittman, 2004). Team processes are the ways members
work together (and rely on one another) to collectively use the resources they have
amongst themselves to achieve their goal. Marks et al., (2001) identified two phases of
team performance in which team processes occur: transition and action. Transition phases
are portions of time when teams focus on strategizing and evaluating plans to achieve
their goal (Marks et al., 2001). Action phases are portions of time in which teams are
actively carrying out their plans and lead directly to goal accomplishment (Rittman,
2004; Dickinson & McIntyre, 1997). The main purpose of action processes is to align
team members efforts and roles to reach their goal and complete their purpose. This study
uses three measures of team behavioral processes: average scores from all transition
processes, average scores from all action processes, and a measure of team coordination.
Hypotheses
Results of previous diversity research indicate mixed results, due to the diverse
nature of the construct and factors which influence team effectiveness. This study further
explores diverse team effectiveness and identifies whether organizational support in the
form of team training can moderate the relationship between surface-level diversity and
team effectiveness. The two surface-level diversity attributes analyzed in this study are
gender diversity and ethnic diversity.

17
Based on diversity research findings and diversity theory related to surface-level
diversity attributes and team training, the following hypotheses are tested in this study.
Hypothesis 1: Teams with diversity will perform differently than homogenous
teams.
Hypothesis 1a: Ethnically diverse teams with no training will be less
effective than other teams.
Hypothesis 1b: Teams with gender diversity will be more effective than
other teams.
Hypothesis 1c: Teams with gender diversity and no training will be more
effective than teams with no gender diversity and no training.
Hypothesis 2: Organizational support (team training) will moderate diverse team
performance; diverse teams with team training will be more effective than other
teams.
Hypothesis 2a: Diverse teams who received team training will have better
shared mental models than homogenous teams with team training.
Hypothesis 2b: Diverse teams who received team training will have better
team processes than homogenous teams with team training.
Hypothesis 2c: Diverse teams with team training will be more effective
than diverse teams with no training.
Methodology
This study used an archival data set from a previous analysis of team training
(Rittman, 2004). Data includes 189 undergraduate students at a mid-Atlantic university
18
who were divided into 63 teams. 72 men and 117 women participated in the study.
Participant ages ranged from 17 to 40 years, with a majority stating they were 18.
Ethnicity was reported as either Caucasian/white, African American, Hispanic, Asian
American, or ‘other.’ 52% of participants reported their ethnicity as white, while the
remaining 48% reported their ethnicity as something other than white.
The Archival Study
The data set used in these analyses originated from a dissertation focused on
identifying the impact of specific types of team training on shared types of mental models
and behavioral processes. In total, 63 teams of three undergraduate students were
analyzed in the study.
The experiment required participants to take part in a half-day session, in which
they were placed on a team with two other participants and instructed to complete a series
of assessments which measured demographics, personality, cognitive ability, and other
individual variables. After completing the assessments, the teams assembled to complete
the first of two videogame-based military “missions.” These missions were designed to
imitate two different military settings; teams completed both types of missions, order in
which teams completed the missions was randomized. The study found no order effects
based on the type of mission completed first. For each mission, team members were
assigned a role: either as the ‘army,’ ‘navy,’ or ‘air force.’
Once the first mission was completed, teams were required to watch a video
training (either a control video, or a video which trained teams through interpositional,

19
interactional, or both interpositional and interactional training methods). After completing
training, teams completed a second mission.
Missions were used to assess team performance and effectiveness (in the form of
shared mental models and team behavioral processes). Total team points and team kills
were identified using the videogame software. Team members were assessed on mental
models separately and sharedness of mental models was compiled after receiving all three
members’ scores. Team role mental models were assessed through knowledge check
questions about each position held on the team (army, navy, or air force). Team
interaction mental models were assessed through a card sorting technique called concept
mapping. Behavioral processes were assessed by trained raters using an established
behaviorally anchored rating scale (BARs). These raters reviewed a recording of both
sessions after the teams had completed the study; action processes were evaluated during
missions, while transition processes were evaluated during preparation sessions.
Procedures
Teams were coded based on the presence of gender diversity and ethnic diversity.
Since teams were made up of three individuals, the presence of gender diversity indicates
that there is one member who identifies as a different gender than the others in the group.
After coding, 20 teams were found to have no gender diversity, while 43 had gender
diversity. Ethnic diversity was considered present when at least one member of the team
identified themselves as an ethnicity other than white. In total, 13 teams had no ethnic
diversity, while 50 had some ethnic diversity.

20
Table 1: Distribution of Teams with Gender Diversity
Frequency Percent Cumulative Percent
No Gender Diversity 20 31.7 31.7
Gender Diversity 43 68.3 100.0
Total 63 100.0
Table 2: Distribution of Teams with Ethnic Diversity
Frequency Percent Cumulative Percent
No Ethnic Diversity 13 20.6 20.6
Ethnic Diversity 50 79.4 100.0
Total 63 100.0
To determine the type of diversity in each team, teams were then coded as having
either no diversity, gender diversity, ethnic diversity, or both gender and ethnic diversity.
After teams were coded based on type of diversity (both ethnic and gender), there were a
total of 4 teams with no diversity at all, 16 teams with ethnic diversity only, 9 with gender
diversity only, and 34 with both gender and ethnic diversity. Once teams were coded by
type of diversity, they were identified as having received training or not. For the purpose
of simplicity, the three training conditions (interpositional, interactional, and both
interpositional and interactional) in the original study were lumped into one total
“received training” category. In total, 14 teams received no team training, while 49
received some type of team training. In the original study, teams who received the
training benefited.

21
Trained Teams
Untrained Teams
Gender
Diversity
No Gender
Diversity Gender
Diversity
No Gender
Diversity
Ethnic
Diversity
Gender & Ethnic
Diversity
N = 28
No Gender
Diversity &
Ethnic Diversity
N = 10
Ethnic
Diversity
Gender & Ethnic
Diversity
N = 6
No Gender
Diversity &
Ethnic Diversity
N = 6
No Ethnic
Diversity
Gender Diversity
& No Ethnic
Diversity
N = 8
No Gender or
Ethnic Diversity
N = 3
No Ethnic
Diversity
Gender Diversity
& No Ethnic
Diversity
N = 1
No Gender or
Ethnic Diversity
N = 1
Figure 1: Coding & Categorization of Teams by Diversity Type & Training
Teams then were coded based on the type of diversity they collectively had, and
whether they received training. Figure 1 illustrates how teams will be coded into these
categories, resulting in the ability to compare teams on gender diversity, ethnic diversity,
and training. This coding resulted in eight categories of teams: (1) No diversity and no
training, (2) Ethnic diversity and no training, (3) Gender diversity and no training, (4)
Both ethnic and gender diversity and no training, (5) No diversity and training, (6) Ethnic
diversity and training, (7) Gender diversity and training, and (8) Both ethnic and gender
diversity and training. Table 3 (below) indicates the number of teams present in each
category of training and type of diversity.
Table 3: Teams in Each Category based on Training and Diversity Type
Category Frequency Percent Cumulative Percent
1. No Diversity, No Training 1 1.6 1.6
2. Ethnic Diversity, No Training 6 9.5 11.1
3. Gender Diversity, No Training 1 1.6 12.7
4. Both Ethnic & Gender Diversity, No Training 6 9.5 22.2

22
5. No Diversity, Training 3 4.8 27.0
6. Ethnic Diversity, Training 10 15.9 42.9
7. Gender Diversity, Training 8 12.7 55.6
8. Both Ethnic & Gender Diversity, Training 28 44.4 100.0
Total 63 100.0
The archival data set used in the present study contained various measures of
team variables to measure team effectiveness. Measures of team performance, shared
mental models, and team processes are used in the current study.
Team Performance
The variables that were used as overall performance variables include total team
kills and total team points for the second mission each team completed. Team points
ranged from 20 to 170 points possible, with a mean score of 108.10. Higher team points
indicate better performance. Team kills indicate how many targets were destroyed, where
higher numbers indicate better performance. Scores ranged from 9 to 57 for each team,
with a mean score of 28.47.
Shared Mental Models
Two measures of shared mental models were used in this analysis: (1) total team
interaction accuracy, and (2) total team role accuracy (both for the second mission each
team completed). Total team mental model interaction accuracy is defined as knowledge
of member interactions or collective action needed to accomplish goals. Total team role
accuracy is defined as knowledge about member roles, position capabilities, position
responsibilities, strengths and weaknesses that influence goal accomplishment. (Rittman,
2004).

23
Team Behavioral Processes
Team behavioral processes (the interdependent acts members perform which
convert to various cognitive, verbal, and behavioral actions, which are then directed
towards the collective team goal) were measured using three variables measured after the
second mission each team completed: (1) team average transition processes, (2) team
average action processes, and (3) total coordinated kills. Team transition processes
(comprised of three specific processes: mission analysis, goal specification, and strategy
formulation and planning) and action processes (comprised of four specific processes:
monitoring progress toward goals, systems monitoring, team monitoring and backup, and
coordination) were measured using a team-level behaviorally anchored rating scales
(BARS) in the original study. This study will look at an average score for each team’s
transition processes and action processes to establish overall behavioral process
effectiveness. In addition, one of the four action processes measured in the original study,
coordination, is specifically evaluated using a measure of total coordinated kills, which
will be used to evaluate differences in coordination among teams with different types of
diversity. This specific action process is assessed in this study to establish coordination
amongst teams as they are performing; a specific process previous research suggests
teams with high surface-level diversity may struggle with.
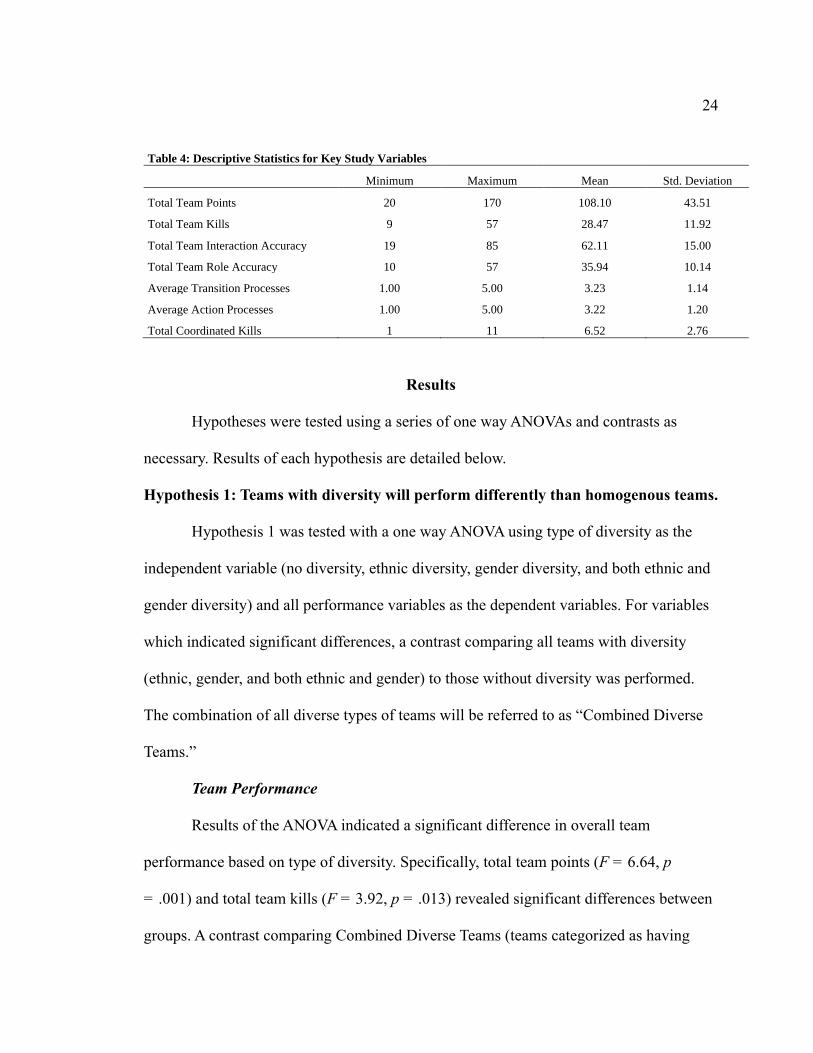
Table 4 indicates the mean, standard deviation, minimum, and maximum scores
achieved by teams for each of the variables used to measure overall team performance,
shared mental models, and team behavioral processes.
24
Table 4: Descriptive Statistics for Key Study Variables
Minimum Maximum Mean Std. Deviation
Total Team Points 20 170 108.10 43.51
Total Team Kills 9 57 28.47 11.92
Total Team Interaction Accuracy 19 85 62.11 15.00
Total Team Role Accuracy 10 57 35.94 10.14
Average Transition Processes 1.00 5.00 3.23 1.14
Average Action Processes 1.00 5.00 3.22 1.20
Total Coordinated Kills 1 11 6.52 2.76
Results
Hypotheses were tested using a series of one way ANOVAs and contrasts as
necessary. Results of each hypothesis are detailed below.
Hypothesis 1: Teams with diversity will perform differently than homogenous teams.
Hypothesis 1 was tested with a one way ANOVA using type of diversity as the
independent variable (no diversity, ethnic diversity, gender diversity, and both ethnic and
gender diversity) and all performance variables as the dependent variables. For variables
which indicated significant differences, a contrast comparing all teams with diversity
(ethnic, gender, and both ethnic and gender) to those without diversity was performed.
The combination of all diverse types of teams will be referred to as “Combined Diverse
Teams.”
Team Performance
Results of the ANOVA indicated a significant difference in overall team
performance based on type of diversity. Specifically, total team points (F = 6.64, p
= .001) and total team kills (F = 3.92, p = .013) revealed significant differences between
groups. A contrast comparing Combined Diverse Teams (teams categorized as having

25
gender, ethnic, or both types of diversity) to homogenous teams was conducted. The
results of the contrast determined that Combined Diverse Teams and homogenous teams
were significantly different in overall team performance for total team points (t(59) =
2.71, p = .009). Further analysis revealed that overall, Combined Diverse Teams (M =
110.91, SD = 42.87) scored higher on team points than homogenous teams (M = 62.50,
SD = 32.02).
Diverse team types were individually examined to determine significant
differences between specific diversity types and homogenous teams for total team points
and team kills. The analysis determined that teams with gender diversity (M = 150.00,
SD = 15.81) were significantly different from homogenous teams and scored the highest
on team points (M = 62.50, SD = 32.02; t(59) = 3.78, p < .001), teams with both gender
and ethnic diversity (M = 110.88, SD = 42.45) also significantly differed from
homogenous teams (M = 62.50, SD = 32.02; t(59) = 2.37, p = .021). Teams with ethnic
diversity (M = 90.00, SD = 39.33) did not significantly differ from homogenous teams on
team points (M = 62.50, SD = 32.02; t(59) = 1.28, p = .207).
Combined Diverse Teams (M = 29.42, SD = 11.58) did not significantly differ
from homogenous teams (M = 19.75, SD = 8.66) for total team kills (t(58) = 1.70, p
= .095). However, teams with gender diversity (M = 35.89, SD = 9.55) did significantly
differ from homogenous teams on team kills (M = 19.75, SD = 8.66; t(58) = 2.410, p
= .019). Other specific types of diversity were not significantly different from
homogenous teams on total team kills.

26
Shared Mental Models
Results of the ANOVA indicated mixed results in shared mental models. Team
total interaction accuracy (F = 2.89, p = .043) was found to be significant across types of
diversity. A contrast determined that Combined Diverse Teams (M = 63.73, SD = 13.98)
did not significantly differ from homogenous teams (M = 46.50, SD = 18.66) on team
interaction accuracy (t(59) = 1.20, p = .237). Similarly, specific types of diversity did not
significantly differ from homogenous teams on interaction accuracy. The ANOVA
determined that team total role accuracy (F = .659, p = .580) was not significantly
different based on type of diversity.
Team Behavioral Processes
Results of the one way ANOVA indicated mixed findings for team behavioral
processes. The ANOVA indicated the number of coordinated kills between teams was
significantly different between groups (F = 7.401, p < .001). A contrast revealed that
Combined Diverse Teams (M = 6.73, SD = 2.74) had a significantly (t(59) = 2.88, p
= .006) greater number of total coordinated kills than homogenous teams (M = 3.50, SD
= 1.73). Further contrasts analyzing specific types of diversity in comparison to
homogenous teams for coordinated kills indicate that teams with gender diversity (M =
9.33, SD = 1.00)had significantly more coordinated kills than homogenous teams (t(59) =
4.02, p < .001), as did teams with ethnic and gender diversity (M = 6.68, SD = 2.64; t(59)
= 2,49, p = .016). Those with ethnic diversity were not significantly different from
homogenous teams for coordinated kills (M = 5.38, SD = 2.55; t(59) = 1.39, p = .170).
27
The ANOVA indicated that transition processes (F = 1.541, p = .213) and action
processes (F = .581, p = .630) were not significantly different among teams.
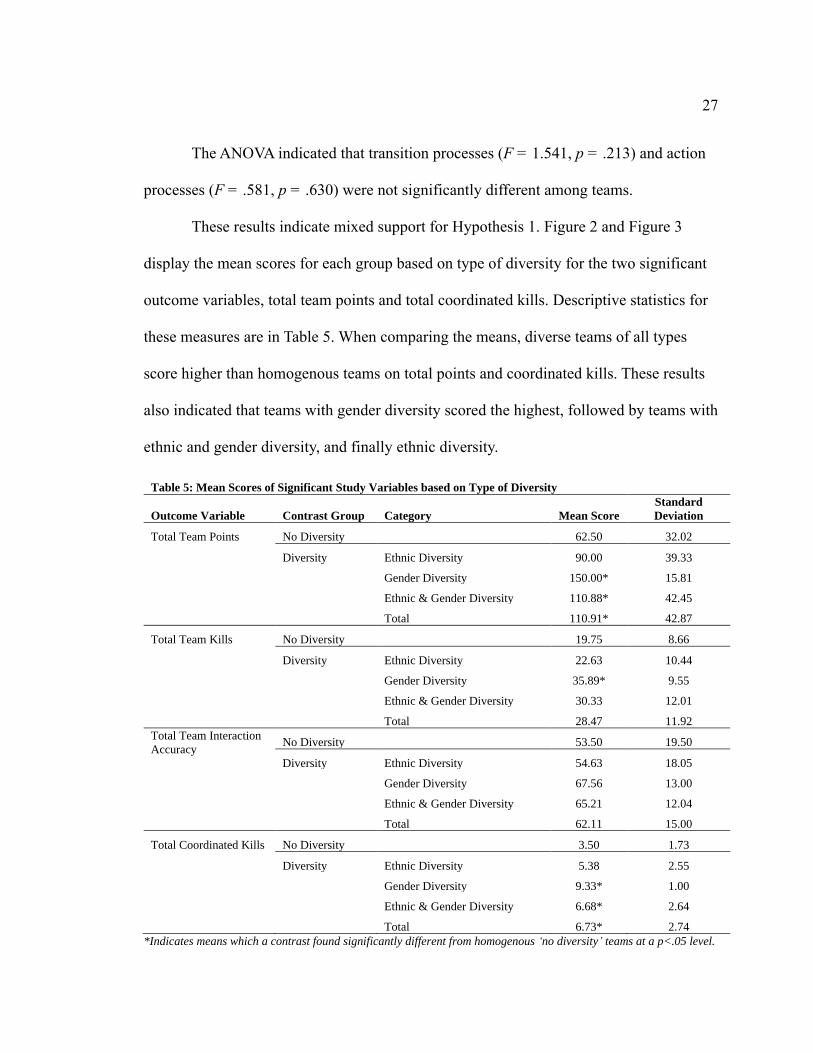
These results indicate mixed support for Hypothesis 1. Figure 2 and Figure 3
display the mean scores for each group based on type of diversity for the two significant
outcome variables, total team points and total coordinated kills. Descriptive statistics for
these measures are in Table 5. When comparing the means, diverse teams of all types
score higher than homogenous teams on total points and coordinated kills. These results
also indicated that teams with gender diversity scored the highest, followed by teams with
ethnic and gender diversity, and finally ethnic diversity.
Table 5: Mean Scores of Significant Study Variables based on Type of Diversity
Outcome Variable Contrast Group Category Mean Score
Standard
Deviation
Total Team Points No Diversity 62.50 32.02
Diversity Ethnic Diversity 90.00 39.33
Gender Diversity 150.00* 15.81
Ethnic & Gender Diversity 110.88* 42.45
Total 110.91* 42.87
Total Team Kills No Diversity 19.75 8.66
Diversity Ethnic Diversity 22.63 10.44
Gender Diversity 35.89* 9.55
Ethnic & Gender Diversity 30.33 12.01
Total 28.47 11.92
Total Team Interaction
Accuracy No Diversity 53.50 19.50
Diversity Ethnic Diversity 54.63 18.05
Gender Diversity 67.56 13.00
Ethnic & Gender Diversity 65.21 12.04
Total 62.11 15.00
Total Coordinated Kills No Diversity 3.50 1.73
Diversity Ethnic Diversity 5.38 2.55
Gender Diversity 9.33* 1.00
Ethnic & Gender Diversity 6.68* 2.64
Total 6.73* 2.74
*Indicates means which a contrast found significantly different from homogenous ‘no diversity’ teams at a p<.05 level.

28
Figure 2: Mean scores for total points based on type of diversity present in teams. Means
for contrast groups are indicated in the axis label.
Figure 3: Mean scores for total coordinated kills based on diversity type. Means for
contrast groups are indicated in the axis label.
62.50
90.00
150.00
110.88
0.00
20.00
40.00
60.00
80.00
100.00
120.00
140.00
160.00
No Diversity Ethnic Diversity Gender Diversity Ethnic & Gender
Diversity
No Diversity (M = 62.50) Diversity (M = 110.91)
Mean Scores for Total Points by Team Diversity
3.50
5.38
9.33
6.68
0.00
1.00
2.00
3.00
4.00
5.00
6.00
7.00
8.00
9.00
10.00
No Diversity Ethnic Diversity Gender Diversity Ethnic & Gender
Diversity
No Diversity (M = 3.50) Diversity (M = 6.73)
Mean Scores: Coordinated Kills

29
Hypothesis 1a: Ethnically diverse teams with no training will be less effective than
other teams.
A one way ANOVA was conducted to determine the difference between teams’
performance, shared mental models, and behavioral processes based on the presence of
ethnic diversity and training.
Team Performance
Results of the ANOVA revealed no significant differences in both overall
performance variables, total team points (F = 1.30, p = .285) and total team kills (F
= .87, p = .463), based on ethnic diversity and training.
Shared Mental Models
Similarly, results of the ANOVA revealed no significant differences in total team
interaction accuracy (F = 1.50, p = .224) and total role accuracy shared mental models (F
= .198, p = .897) based on ethnic diversity and training.
Team Behavioral Processes
Results of the ANOVA revealed that behavioral processes differed between teams
only for transition processes (F = 3.60, p = .019). A contrast comparing ethnically
diverse teams (those with ethnic diversity and those with ethnic and gender diversity) to
other untrained teams conducted to determine whether Hypothesis 1a is supported for the
significant outcome variable, transition processes. Results of the contrast did identify a
significant difference for transition processes between untrained teams with ethnic
diversity (M = 3.64, SD = 1.01) and other untrained teams (M = 3.37, SD = 1.10; t(57) =
-2.53, p = .014). Further analysis of comparing specific categories based on the presence
of ethnic diversity on a team and whether teams received training or not. This analysis

30
determined that teams with training and ethnic diversity significantly differed from teams
with ethnic diversity that were untrained (M = 3.37, SD = 1.14; t(57) = 2.85, p = .006).
Similarly, untrained teams with ethnic diversity were significantly different in transition
processes when compared to teams with no diversity and training (M = 2.22, SD = .67;
t(57) = 2.92, p = .005); the specific means of team transition processes are detailed in
Table 6 below, as well as illustrated in Figure 4. Further analysis of means indicated
teams with no ethnic diversity score lower than teams with ethnic diversity on transition
processes (regardless of training). Additionally, teams with ethnic diversity that were
untrained also outscored untrained teams without ethnic diversity. These results directly
contradict hypothesis 1a; suggesting that teams with ethnic diversity are more effective at
planning and evaluating processes than homogenous teams.
Results of the ANOVA determined that action processes (F = 1.59, p = .201) and
coordinated kills (F = 1.50, p = .201) were not significantly different between teams
based on ethnicity and training.
Table 6: Hypothesis 1a: Mean Scores of Significant Study Variables based on Ethnic Diversity
Variable Contrast Group Category Mean Score
Standard
Deviation
Average
Transition
Processes
Other Groups No Ethnic Diversity, No Training 2.80 1.33
No Ethnic Diversity, Training 2.22* .67
Ethnic Diversity, Training 3.37* 1.14
Total 3.37* 1.10
Ethnic Diversity, No
Training Ethnic Diversity, No Training 3.64 1.01
* Indicates means which a contrast found significantly different from teams in the ‘ethnic diversity, no training’
category (p < .05).

31
Figure 4: Mean scores for average transition processes based on presence of ethnic
diversity and training. Means for contrast groups are indicated in the axis label.
Hypothesis 1b: Teams with gender diversity will be more effective than other teams.
An ANOVA comparing performance variables for teams with gender diversity and
teams without gender diversity revealed mixed results.
Team Performance
Results of the ANOVA revealed that overall team performance was significantly
different for both variables (total team points and total team kills) for teams based on the
presence of gender diversity (F = 9.85, p = .003; F = 9.80, p = .003). A contrast found
significant differences in both overall performance variables, total points (t(61) = -3.14, p
= .003) and total team kills (t(60) = -3.31, p = .003). Mean scores for total team points
indicated that teams with gender diversity (M = 119.07, SD = 41.51) performed better
than teams without gender diversity (M = 84.50, SD = 38.86). The same is true for total
2.8
2.22
3.373.64
0
0.5
1
1.5
2
2.5
3
3.5
4
No Diversity, No Training No Diversity, Training Ethnic Diversity, Training Ethnic Diversity, No
Training
Other Teams (M = 3.37) Untrained, Ethnically
Diverse Teams (M =
3.64)
Mean Scores: Average Transition Processes
32
team kills; teams with gender diversity (M = 31.52, SD = 11.65) outperformed teams
without gender diversity (M = 22.05, SD = 9.96).
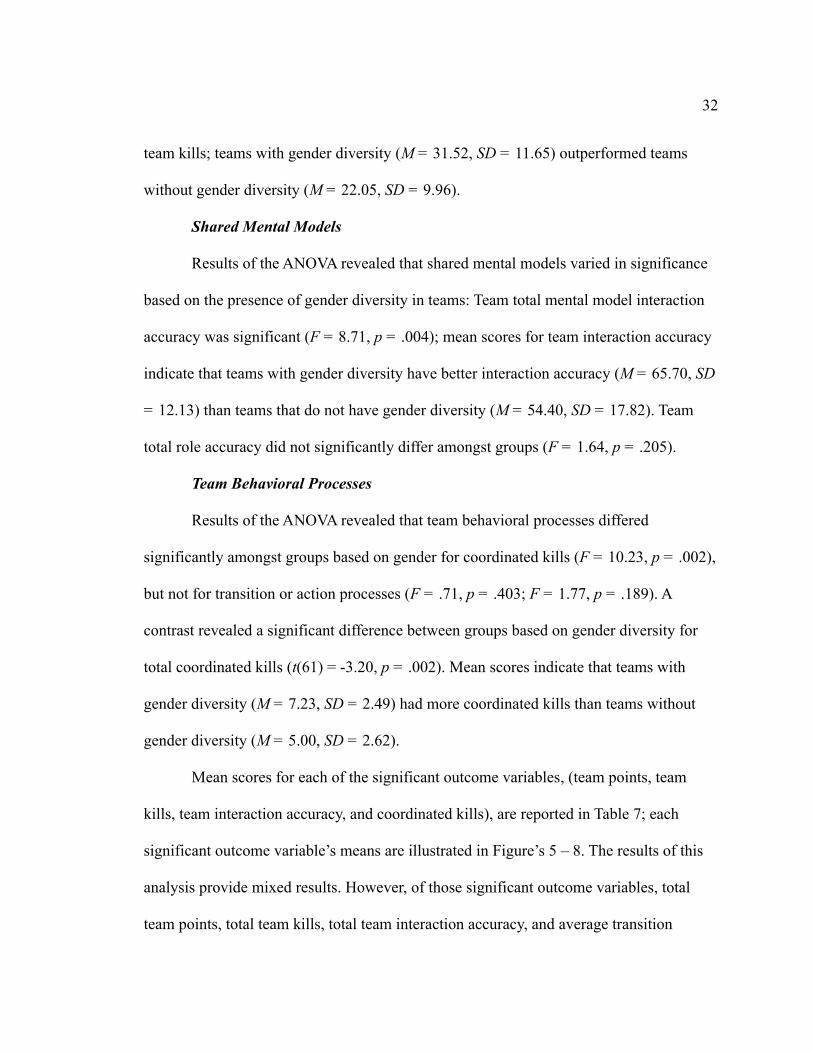
Shared Mental Models
Results of the ANOVA revealed that shared mental models varied in significance
based on the presence of gender diversity in teams: Team total mental model interaction
accuracy was significant (F = 8.71, p = .004); mean scores for team interaction accuracy
indicate that teams with gender diversity have better interaction accuracy (M = 65.70, SD
= 12.13) than teams that do not have gender diversity (M = 54.40, SD = 17.82). Team
total role accuracy did not significantly differ amongst groups (F = 1.64, p = .205).
Team Behavioral Processes
Results of the ANOVA revealed that team behavioral processes differed
significantly amongst groups based on gender for coordinated kills (F = 10.23, p = .002),
but not for transition or action processes (F = .71, p = .403; F = 1.77, p = .189). A
contrast revealed a significant difference between groups based on gender diversity for
total coordinated kills (t(61) = -3.20, p = .002). Mean scores indicate that teams with
gender diversity (M = 7.23, SD = 2.49) had more coordinated kills than teams without
gender diversity (M = 5.00, SD = 2.62).
Mean scores for each of the significant outcome variables, (team points, team
kills, team interaction accuracy, and coordinated kills), are reported in Table 7; each
significant outcome variable’s means are illustrated in Figure’s 5 – 8. The results of this
analysis provide mixed results. However, of those significant outcome variables, total
team points, total team kills, total team interaction accuracy, and average transition

33
processes, the results show that teams with high levels of gender diversity do perform
better in these areas. These specific results are consistent with the literature on gender
diversity in teams, which says that teams with gender diversity are more effective than
homogenous teams.
Table 7: Hypothesis 1b: Mean Scores of Significant Study Variables for Gender Diversity
Outcome Variable Category Mean Standard. Deviation
Total Team Points* No Gender Diversity 84.50 38.86
Gender Diversity 119.07 41.51
Total Team Kills* No Gender Diversity 22.05 9.96
Gender Diversity 31.52 11.65
Total Team Interaction Accuracy* No Gender Diversity 54.40 17.82
Gender Diversity 65.70 12.13
Total Coordinated Kills* No Gender Diversity 5.00 2.49
Gender Diversity 7.23 2.62
*Significant difference (p<0.05) in performance based on group gender diversity.
Figure 5: Mean scores for total team points based on
presence of gender diversity in the team.
Figure 7: Mean scores for total team interaction accuracy
based on presence of gender diversity in the team.
84.5
119.07
0
20
40
60
80
100
120
140
No Gender Diversity Gender Diversity
Mean Scores: Total Team Points
54.4
65.7
0
20
40
60
80
No Gender Diversity Gender Diversity
Mean Scores: Total Team
Interaction Accuracy

34
Figure 6: Mean scores for total team kills based on
presence of gender diversity in the team.
Figure 8: Mean scores for total coordinated kills based
on presence of gender diversity in the team.
Hypothesis 1c: Teams with gender diversity and no training will be more effective
than teams with no gender diversity and no training.
A one way ANOVA was conducted to test the difference between groups based on
gender diversity and training. Significant variables were tested using a contrast
comparing untrained teams with gender diversity to untrained teams without gender
diversity.
Team Performance
Results of the ANOVA determined there were mixed results in team performance
based on gender diversity. There was a significant difference in both overall team
performance variables, total team points and total team kills (F = 3.89, p = .013; F =
3.47, p = .022). However, a contrast comparing untrained groups with gender diversity to
untrained groups with no gender diversity determined that teams in these two categories
did not significantly differ for total team points and total team kills, indicating that
Hypothesis 1c is not supported for team performance (t(59) = .79, p = .434; t(58) = 2.00,
p = .051).
22.05
31.52
0
5
10
15
20
25
30
35
No Gender Diversity Gender Diversity
Mean Scores: Total Team Kills
5.00
7.23
0.00
2.00
4.00
6.00
8.00
No Gender Diversity Gender Diversity
Mean Scores: Total Coordinate
Kills
35
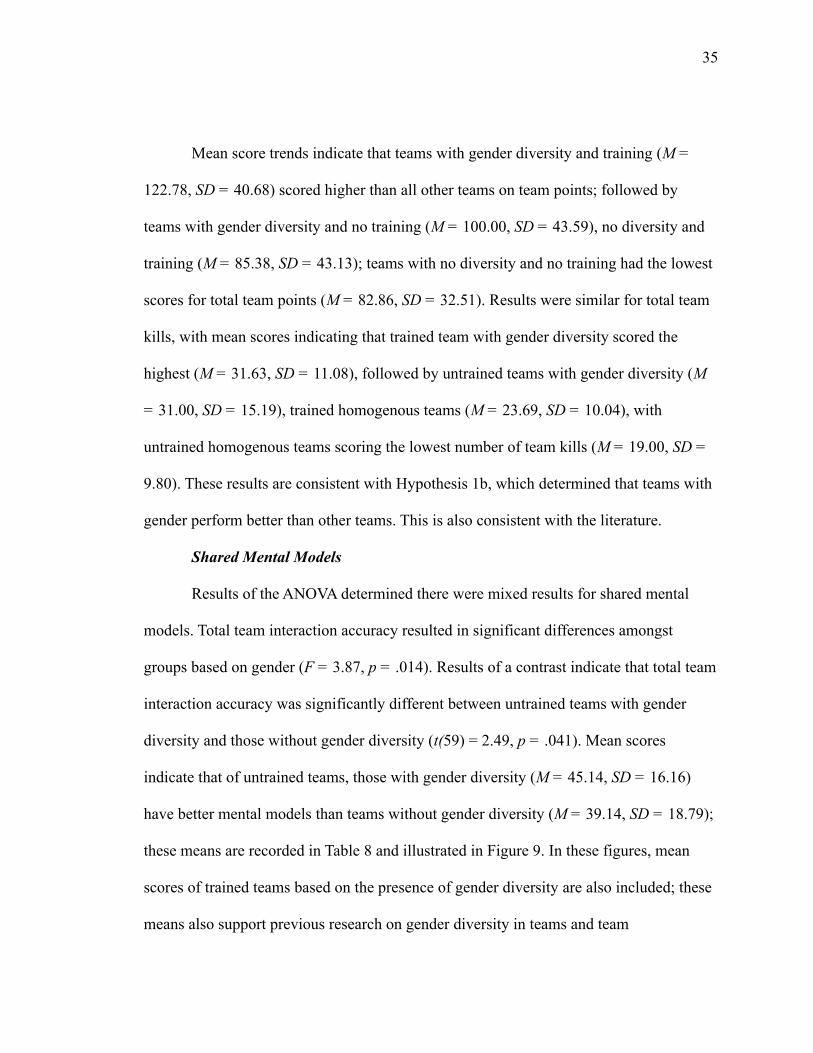
Mean score trends indicate that teams with gender diversity and training (M =
122.78, SD = 40.68) scored higher than all other teams on team points; followed by
teams with gender diversity and no training (M = 100.00, SD = 43.59), no diversity and
training (M = 85.38, SD = 43.13); teams with no diversity and no training had the lowest
scores for total team points (M = 82.86, SD = 32.51). Results were similar for total team
kills, with mean scores indicating that trained team with gender diversity scored the
highest (M = 31.63, SD = 11.08), followed by untrained teams with gender diversity (M
= 31.00, SD = 15.19), trained homogenous teams (M = 23.69, SD = 10.04), with
untrained homogenous teams scoring the lowest number of team kills (M = 19.00, SD =
9.80). These results are consistent with Hypothesis 1b, which determined that teams with
gender perform better than other teams. This is also consistent with the literature.
Shared Mental Models
Results of the ANOVA determined there were mixed results for shared mental
models. Total team interaction accuracy resulted in significant differences amongst
groups based on gender (F = 3.87, p = .014). Results of a contrast indicate that total team
interaction accuracy was significantly different between untrained teams with gender
diversity and those without gender diversity (t(59) = 2.49, p = .041). Mean scores
indicate that of untrained teams, those with gender diversity (M = 45.14, SD = 16.16)
have better mental models than teams without gender diversity (M = 39.14, SD = 18.79);
these means are recorded in Table 8 and illustrated in Figure 9. In these figures, mean
scores of trained teams based on the presence of gender diversity are also included; these
means also support previous research on gender diversity in teams and team

36
effectiveness, which have determined that team training improves shared mental models
and teams with gender diversity often outperform teams without gender diversity.
Team total scores for role accuracy were not significantly different between
groups (F = .591, p = .623).
Table 8: Hypothesis 1c: Mean Scores of Significant Study Variables for Training & Gender Diversity
Outcome Variable Category Mean Scores Standard Deviation
Total Team Points No Diversity, No Training 82.86 32.51
No Diversity, Training 85.38 43.13
Gender Diversity, No Training 100.00 43.59
Gender Diversity, Training 122.78 40.68
Total Team Kills No Diversity, No Training 19.00 9.80
No Diversity, Training 23.69 10.04
Gender Diversity, No Training 31.00 15.19
Gender Diversity, Training 31.63 11.08
Total Team Interaction Accuracy* No Diversity, No Training 39.14 18.79
No Diversity, Training 51.85 26.89
Gender Diversity, No Training 45.14* 16.16
Gender Diversity, Training 62.61 21.47
Average Transition Processes No Diversity, No Training 2.19 1.15
No Diversity, Training 3.51 .98
Gender Diversity, No Training 2.67 .69
Gender Diversity, Training 3.44 1.14
Total Coordinated Kills No Diversity, No Training 4.86 1.95
No Diversity, Training 5.08 2.81
Gender Diversity, No Training 5.86 2.55
Gender Diversity, Training 7.50 2.58
* Indicates means which a contrast found significant difference between the ‘gender diversity, no training’ category and the ‘no
diversity, no training’ category (p < .05), supporting Hypothesis 1c.

37
Figure 9: Mean scores of total team interaction accuracy based on the presence of gender diversity and
training. Variables used in the contrast tested in Hypothesis 1c are indicated in dark grey.
Team Behavioral Processes
Results of the ANOVA determined team behavioral processes were significantly
different between groups for transition processes and total coordinated kills (F = 3.57, p
= .019; F = 4.24, p = .009). However, a contrast comparing groups with no training and
gender diversity to those with no training and no gender diversity determined that teams
in these two categories did not significantly differ for transition processes and total
coordinated kills (t(59) = .83, p = .410; t(59) = .73, p = .469). Mean scores indicate that
trained teams with no diversity score the highest in transition processes (M = 3.51, SD
= .98), followed by teams with gender diversity and training (M = 3.44, SD = 1.14),
untrained teams with gender diversity (M = 2.67, SD = .69), with untrained homogenous
teams scoring the lowest on transition processes (M = 2.19, SD = 1.15). These mean
39.14
45.14
51.85
62.61
0
10
20
30
40
50
60
70
No Gender Diversity,
Untrained
Gender Diversity, Untrained No Gender Diversity,
Training
Gender Diversity, Training
Mean Scores: Total Team Interaction Accuracy

38
scores indicate that the true difference between groups on transition processes is not
between untrained teams with or without gender diversity, but teams that have training or
not.
Mean scores of coordinated kills suggest that trained teams with gender diversity
scored the highest on coordinated kills (M = 7.50, SD = 2.58), followed by untrained
teams with gender diversity (M = 5.86, SD = 2.55), trained homogenous teams (M =
5.08, SD = 2.81), with untrained homogenous teams scoring the lowest number of
coordinated kills (M = 4.86, SD = 1.95). These mean scores are consistent with the
results of Hypothesis 1b and previous research, which suggest there is a difference
between groups with gender diversity and homogenous teams in team effectiveness.
The ANOVA revealed no significant difference between groups in action
processes (F = 2.33, p = .083).
The results of this analysis suggest mixed results. However, the significant
outcome variables, total team points, total team kills, team interaction accuracy, transition
processes, and coordinated kills suggest that there is a difference between groups based
on gender diversity and training. This is consistent with previous research and previous
hypotheses (Hypothesis 1b).
Only one study variable, total team interaction accuracy, indicates support for
Hypothesis 1c. Differences in total team interaction accuracy show that teams with
gender diversity score higher than teams without gender diversity on some shared mental
models compared to their counterparts in each training condition. These results indicate

39
support for this hypothesis, and previous research stating that teams with gender diversity
will perform better than other teams.
Basis of Analysis for Hypotheses 2, 2a, 2b, and 2c: One Way ANOVA Results.
Results of Hypothesis 2, 2a, 2b, and 2c are based on the results of a one way
ANOVA. The ANOVA compared eight groups categorized based on type of diversity
(none, ethnic, gender, or both) and training. The variables testing team performance,
shared mental models, and team behavioral processes were the dependent variables. Each
hypothesis was tested using a specific contrast. However, it should be noted that further
statistical analysis of individual categories was not possible given the small sample size
of some groups.
Team Performance
Results of the ANOVA determined that both overall team performance variables
(total team points and total team kills) revealed a significant difference between teams
based on diversity and training (F = 3.20, p = .006; F = 2.92, p = .011). Means for total
team points and total team kills are displayed in Table 9 below. Further analysis of the
significant differences between groups are explored in the results sections of Hypotheses
2, 2a, 2b, and 2c.
Table 9: Mean Scores for Team Performance Variables based on Type of Diversity and Training
Variable Category Mean Standard Deviation
Total Team Points No Diversity, No Training 90.00 .
Ethnic Diversity, No Training 81.67 35.45
Gender Diversity, No Training 150.00 .
Both Ethnic & Gender Diversity, No Training 91.67 41.19
No Diversity, Training 53.33 32.15
Ethnic Diversity, Training 95.00 42.49

40
Gender Diversity, Training 150.00 16.90
Both Ethnic & Gender Diversity, Training 115.00 42.30
Total 108.10 43.51
Total Team Kills No Diversity, No Training 30.00 .
Ethnic Diversity, No Training 17.17 9.33
Gender Diversity, No Training 55.00 .
Both Ethnic & Gender Diversity, No Training 27.00 11.93
No Diversity, Training 16.33 6.51
Ethnic Diversity, Training 25.90 10.07
Gender Diversity, Training 33.50 6.74
Both Ethnic & Gender Diversity, Training 31.07 12.12
Total 28.47 11.92
Shared Mental Models
Results of the ANOVA determined that team total interaction accuracy was
significantly different between teams based on diversity type and training (F = 2.72, p
= .017). Team total role accuracy was not significant (F = 1.62, p = .149). Mean scores
for total interaction accuracy are displayed in Table 10. Further analysis of the significant
differences between groups are explored in the results sections of Hypotheses 2, 2a, 2b,
and 2c.
Table 10: Mean Scores for Significant Team Mental Model Variables based on Diversity Type and Training
Variable Category Mean Standard Deviation
Total Mental
Model Interaction
Accuracy
No Diversity, No Training 72.00 .
Ethnic Diversity, No Training 43.50 14.32
Gender Diversity, No Training 56.00 .
Both Ethnic & Gender Diversity, No Training 64.50 8.24
No Diversity, Training 47.33 18.50
Ethnic Diversity, Training 61.30 17.24
Gender Diversity, Training 69.00 13.10
Both Ethnic & Gender Diversity, Training 65.36 12.83
Total 62.11 15.00

41
Team Behavioral Processes
Results of the ANOVA determined that team behavioral process variables
differed in some contexts among teams based on diversity and training, but one did not:
Transition processes revealed a significant difference amongst groups (F = 2.80, p
= .014) and so did coordinated kills (F = 3.59, p = .003); action processes were not
significantly different amongst teams with different types of diversity and presence of
training (F = 1.30, p = .266). Mean scores for transition processes and coordinated kills
are listed in Table 11. Further analysis of the significant differences between groups are
explored in the results sections of Hypotheses 2, 2a, 2b, and 2c.
Table 11: Mean Scores for Team Behavioral Process Variables based on Type of Diversity and Training
Variable Category Mean Standard Deviation
Average Transition
Processes
No Diversity, No Training 4.67 .
Ethnic Diversity, No Training 1.78 .40
Gender Diversity, No Training 3.67 .
Both Ethnic & Gender Diversity, No Training 2.50 .59
No Diversity, Training 3.67 .88
Ethnic Diversity, Training 3.47 1.04
Gender Diversity, Training 3.63 1.10
Both Ethnic & Gender Diversity, Training 3.38 1.17
Total 3.23 1.14
Total Coordinated
Kills
No Diversity, No Training 5.00 .
Ethnic Diversity, No Training 4.83 2.14
Gender Diversity, No Training 9.00 .
Both Ethnic & Gender Diversity, No Training 5.33 2.34
No Diversity, Training 3.00 1.73
Ethnic Diversity, Training 5.70 2.83
Gender Diversity, Training 9.38 1.06
Both Ethnic & Gender Diversity, Training 6.96 2.65
Total 6.52 2.76

42
Hypothesis 2: Organizational support (team training) will moderate diverse team
performance; diverse teams with team training will be more effective than other
teams.
To test Hypothesis 2, a contrast testing the difference between the Combined
Diverse Teams with training (those with a presence of diversity, either ethnic, gender, or
both ethnic and gender, who had training) compared to all other groups was performed.
The results of this contrast revealed mixed results for differences in outcome variables
between trained groups with diversity and all other groups.
Team Performance
The contrast revealed that total team points and total team kills were not
significantly different when comparing Combined Diverse Teams with training to other
teams (t(55) = -1.87, p = .067; t(55) = -.214, p = .832).
A series of contrasts comparing total team points and total team kills for specific
diverse types with training to other groups were conducted. The results of these contrasts
indicated teams with gender diversity and training (M = 150.00, SD = 16.90) differed
significantly from ‘other groups’ on total team points (M = 84.71, SD = 35.65; t(55) = -
3.02, p = .004). Teams with ethnic diversity (t(55) = -.094, p = .925) and teams with both
ethnic and gender diversity (t(55) = -1.48, p = .146) did not differ significantly from other
groups on team points. Specific means for total team points are listed in Table 12.
None of the specific Combined Diverse Teams with training differed significantly
from other groups on total team kills; trained teams with ethnic diversity (t(54) = .653, p
= .517), gender diversity (t(54) = -.848, p = .400), and both gender and ethnic diversity (t(54)
= -.483, p = .631) were not significantly different from ‘other groups.’

43
Shared Mental Models
The contrast revealed that team total mental model interaction accuracy was not
significant for the Combined Diverse Teams with Training when compared to other
groups (t (55) = -1.64, p = .108). None of the specific Combined Diverse Teams with
training differed significantly from other groups on team interaction accuracy; trained
teams with ethnic diversity (t(55) = -.742, p = .461), gender diversity (t(55) = -1.866, p
= .067), and both gender and ethnic diversity (t(55) = -1.677, p = .099) were not significantly
different from ‘other groups.’
Team Behavioral Processes
The contrast determined that coordinated kills significantly differed between
Combined Diverse Teams with training (M = 7.11, SD = 2.74) to all other groups (M =
4.93, SD = 2.17; t (55) = -2.16, p = .035). A series of contrasts comparing coordinated
kills for specific diverse types with training to other groups were conducted. These results
indicate that only teams with gender diversity and training (M = 9.38, SD = 1.06)
significantly differed from ‘other teams’ on coordinated kills (M = 4.93, SD = 2.17; t(55)
= -3.37, p = .001). Teams with ethnic diversity (t(55) = -.241, p = .810) and teams with
both ethnic and gender diversity (t(55) = -1.67, p = .101) were not found to be
significantly different from ‘other teams.’ Specific means for coordinated kills are listed
in Table 12 and illustrated in Figure 10.
The contrast revealed that transition processes did not significantly differ between
Combined Diverse Teams with training compared to other teams (t(55) = -.653, p
= .517). None of the specific Combined Diverse Teams with training differed

44
significantly from other groups on transition processes; trained teams with ethnic
diversity (t(55) = -.447, p = .656), gender diversity (t(55) = -.739, p = .463), and both gender
and ethnic diversity (t(55) = -.320, p = .750) were not significantly different from ‘other
groups.’
The results of this analysis suggest mixed results. The significant outcome
variable, total coordinated kills, suggests that teams with diversity show more
coordination when they have training as compared to other teams (either homogenous
with training or teams with no training at all).
Table 12: Hypothesis 2: Mean Scores of Significant Outcome Variables for Training & Diversity Type
Outcome
Variable Contrast Group Category Mean Score
Standard
Deviation
Total Team
Points
‘Other Teams’ No Diversity, No Training 90.00 .
Ethnic Diversity, No Training 81.67 35.45
Gender Diversity, No Training 150.00 .
Ethnic & Gender Diversity, No Training 91.67 41.19
No Diversity, Training 53.33 32.15
Total 84.71 35.65
Diverse Teams with
Training
Ethnic Diversity, Training 95.00 42.49
Gender Diversity, Training 150.00* 16.90
Ethnic & Gender Diversity, Training 115.00 42.30
Total (Combined Diverse Teams with Training) 116.74 38.49
Total Coordinated
Kills ‘Other Teams’ No Diversity, No Training 5.00 .
Ethnic Diversity, No Training 4.83 2.14
Gender Diversity, No Training 9.00 .
Ethnic & Gender Diversity, No Training 5.33 2.34
No Diversity, Training 3.00 1.73
Total 4.93 2.17
Diverse Teams with
Training
Ethnic Diversity, Training 5.70 2.83
Gender Diversity, Training 9.38* 1.06
Ethnic & Gender Diversity, Training 6.96 2.65
Total (Combined Diverse Teams with Training) 7.11* 2.74
*Indicates means which a contrast found significantly different from total mean score of ‘Other Teams’ (p < .05).

45
Figure 10: Mean scores for total coordinated kills based on type of diversity and training.
Means for contrast groups are indicated in the axis label.
Hypothesis 2a: Diverse teams who received team training will have better shared
mental models than homogenous teams with team training.
Hypothesis 2b: Diverse teams who received team training will have better team
processes than homogenous teams with team training.
To test Hypothesis 2a and Hypothesis 2b, a contrast comparing shared mental
models and behavioral processes of Combined Diverse Teams who received training to
those who received training and had no diversity was performed. This contrast was
performed based on the results of the previously conducted one way ANOVA which
compared teams based on diversity type and training. Significant outcome variables from
the results of that ANOVA were the only variables that were assessed.
5 4.83
9
5.33
3
5.7
9.38
6.96
0
1
2
3
4
5
6
7
8
9
10
No Diversity,
Untrained
Ethnic
Diversity,
Untrained
Gender
Diversity,
Untrained
Ethnic &
Gender
Diversity,
Untrained
No Diversity,
Trained
Ethnic
Diversity
Gender
Diversity
Ethnic &
Gender
Diversity
Other Teams (M = 4.93) Diverse Teams with Training (M = 7.11)
Mean Scores: Coordinated Kills

46
Shared Mental Models
Results of the contrast determined that interaction accuracy of shared mental
models for teams were significantly different between Combined Diverse Teams with
training (ethnic, gender, and both ethnic and gender) and homogenous groups with
training. Total mental models of team interaction accuracy was significant (t(55) = 2.16, p
= .035), indicating that of teams with training, Combined Diverse Teams with training
have better mental models (M = 65.11, SD = 14.02) than those without diversity (M =
47.33, SD = 18.50). A series of contrasts comparing team interaction accuracy for
specific diverse types with training to homogenous groups with training were conducted.
The results of these contrasts indicated teams with gender diversity and training (M =
69.00, SD = 13.10) differed significantly from homogenous groups and training (M =
47.33, SD = 18.50) on team interaction accuracy (t(55) = 2.33, p = .023). Similarly,
trained teams with gender and ethnic diversity (M = 65.36, SD = 12.83) differed
significantly from homogenous teams with training on team interaction accuracy (M =
47.33, SD = 18.50; t(55) = 2.16, p = .035). Trained teams with ethnic diversity (M =
61.30, SD = 17.24) did not significantly differ from teams with homogenous teams with
training ((M = 47.33, SD = 18.50; t(55) = 1.55, p = .128).
The results of this contrast indicate mixed support for Hypothesis 2a. For the
significant outcome variable, total team interaction accuracy, diverse teams with training
consistently outperform homogenous teams with training. Mean scores for total team
interaction accuracy are detailed in Table 13 and illustrated in Figure 11.

47
Table 13: Hypothesis 2a: Mean Scores for Significant Mental Model Variables for Trained Teams by
Diversity Type
Outcome Variables Contrast Group Category Mean Score
Standard
Deviation
Total Team Interaction
Accuracy No Diversity No Diversity 47.33 18.50
Diversity Ethnic Diversity 61.30 17.24
Gender Diversity 69.00* 13.10
Ethnic & Gender Diversity 65.36* 12.83
Total 65.11* 14.02
*Indicates means which a contrast found significantly different from teams with ‘no diversity, training’ (p < .05).
Figure 11: Mean scores for total team interaction accuracy in trained teams based on type
of diversity. Means for contrast groups are indicated in the axis label.
Team Behavioral Processes
Results of the contrast were also used to determine support for Hypothesis 2b,
which focused on team behavioral processes. The contrast revealed a significant
difference between Combined Diverse Teams with training (M = 7.11, SD = 2.74) and
trained homogenous groups (M = 3.00, SD = 1.73) for coordinated kills (t(55) = 2.97, p
47.33
61.3
6965.36
0
10
20
30
40
50
60
70
80
No Diversity Ethnic Diversity Gender Diversity Ethnic & Gender Diversity
No Diversity (M = 47.33) Diversity (M = 65.11)
Mean Scores: Team Interaction Accuracy for Trained
Teams

48
= .004). A series of contrasts comparing coordinated kills for specific diverse team types
with training to homogenous groups with training were conducted. The results of these
contrasts indicated teams with gender diversity and training (M = 9.38, SD = 1.06) scored
significantly higher than homogenous groups with training on coordinated kills (t(55) =
3.87, p < .001). Similarly, trained teams with gender and ethnic diversity (M = 6.96, SD =
2.65) differed significantly from homogenous teams with training on coordinated kills
(t(55) = 2.68, p = .010). Trained teams with ethnic diversity (M = 5.70, SD = 2.83) did
not significantly differ from homogenous teams with training on coordinated kills (t(55)
= 1.69, p = .097).
The results of the contrast indicated that average transition processes were not
significantly different for Combined Diverse Teams with training and homogenous teams
with training (t(55) = -.281, p = .780). None of the specific Combined Diverse Teams
with training differed significantly from homogenous groups on average transition
processes; trained teams with ethnic diversity (t(55) = -.293, p = .771), gender diversity
(t(55) = -.059, p = .953), and both gender and ethnic diversity (t(55) = -.453, p = .652) were
not significantly different from homogenous teams with training for transition processes.
The results of this analysis indicate mixed results for Hypothesis 2b, but do
suggest that teams with diversity outperform homogenous teams on coordination when
trained. Mean scores for the significant outcome variable (coordinated kills) are recorded
in Table 14.
Table 14: Hypothesis 2b: Mean Scores for Significant Behavioral Processes for Trained Teams by Diversity Type
Outcome Variables
Contrast
Group Category
Mean
Score Standard Deviation

49
Total Coordinated
Kills No Diversity No Diversity 3.00 1.73
Diversity Ethnic Diversity 5.70 2.83
Gender Diversity 9.38* 1.06
Ethnic & Gender Diversity 6.96* 2.65
Total (Combined Diverse Teams with Training) 7.11* 2.74
*Indicates means which a contrast found significantly different from teams with ‘no diversity, training’ (p < .05).
Figure 12: Mean scores for total coordinated kills of teams with training based on
diversity type. Means for contrast groups are indicated in the axis label.
Hypothesis 2c: Diverse teams with team training will be more effective than diverse
teams without training.
A contrast was conducted to compare Combined Diverse Teams with training to
Combined Diverse Teams without training based on the results of the previously
conducted one way ANOVA.
3
5.7
9.38
6.96
0
1
2
3
4
5
6
7
8
9
10
No Diversity Ethnic Diversity Gender Diversity Ethnic & Gender Diversity
No diversity (M = 3.00) Diversity (M = 7.11)
Mean Score

50
Further analyses comparing specific types of diversity in teams based on training
was unable to be conducted due to small sample sizes in diversity types for teams who
did not receive training.
Team Performance
Results of the contrast indicate that performance scores, total team points and
total team kills, were not significantly different for the groups compared (t(55) = .746, p
= .459; t(55) = -.638, p = .526).
Shared Mental Models
Results of the contrast indicate that team interaction accuracy was not
significantly different for diverse groups with training compared to those without (t(55) =
1.83, p = .073).
Team Behavioral Processes
Results of the contrast indicate that transition processes were not significantly
different for diverse teams with training compared to those without training, and neither
were coordinated kills (t(55) = 1.93, p = .059; t(55) = .936, p = .353). The results of this
analysis indicate that training did not significantly improve diverse team performance or
processes.
Summary of Results
Team Performance
Results of this study indicate teams with diversity score higher on team points
than homogenous teams. Combined Diverse Teams outperformed homogenous teams on
team points, as did teams with gender diversity and teams with ethnic and gender
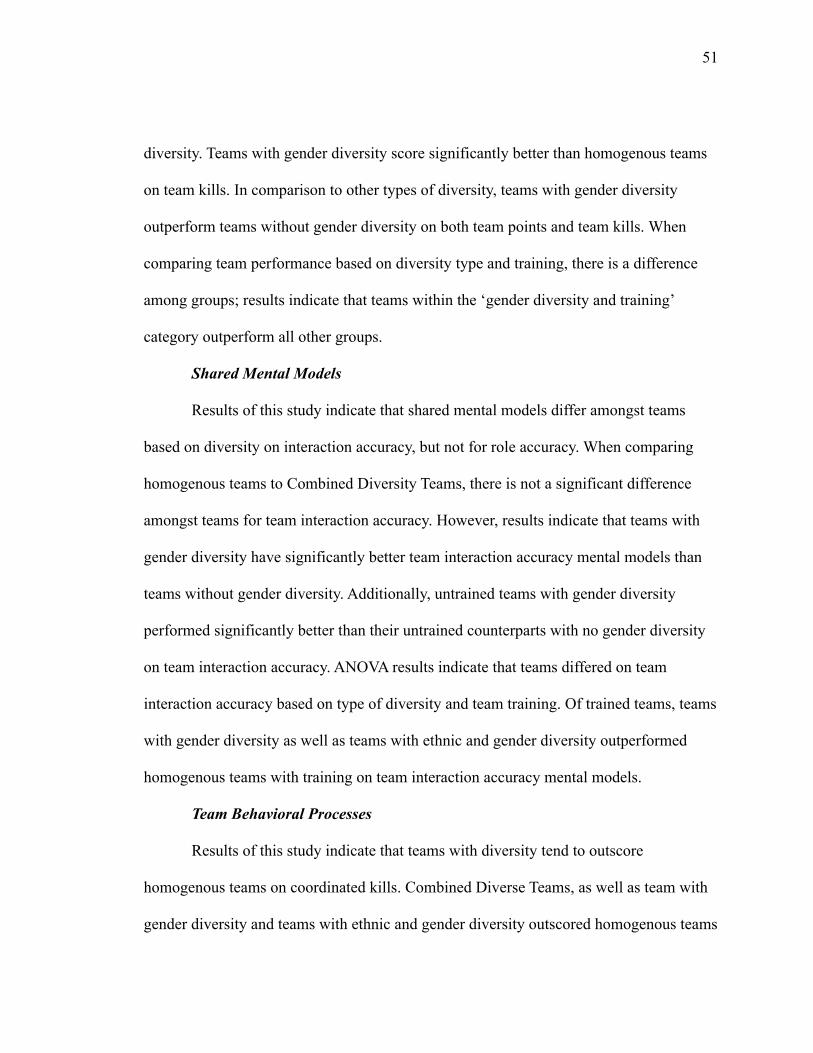
51
diversity. Teams with gender diversity score significantly better than homogenous teams
on team kills. In comparison to other types of diversity, teams with gender diversity
outperform teams without gender diversity on both team points and team kills. When
comparing team performance based on diversity type and training, there is a difference
among groups; results indicate that teams within the ‘gender diversity and training’
category outperform all other groups.
Shared Mental Models
Results of this study indicate that shared mental models differ amongst teams
based on diversity on interaction accuracy, but not for role accuracy. When comparing
homogenous teams to Combined Diversity Teams, there is not a significant difference
amongst teams for team interaction accuracy. However, results indicate that teams with
gender diversity have significantly better team interaction accuracy mental models than
teams without gender diversity. Additionally, untrained teams with gender diversity
performed significantly better than their untrained counterparts with no gender diversity
on team interaction accuracy. ANOVA results indicate that teams differed on team
interaction accuracy based on type of diversity and team training. Of trained teams, teams
with gender diversity as well as teams with ethnic and gender diversity outperformed
homogenous teams with training on team interaction accuracy mental models.
Team Behavioral Processes
Results of this study indicate that teams with diversity tend to outscore
homogenous teams on coordinated kills. Combined Diverse Teams, as well as team with
gender diversity and teams with ethnic and gender diversity outscored homogenous teams

52
on number of coordinated kills. Teams with gender diversity had significantly more
coordinated kills than teams without gender diversity. Training influenced coordinated
kills; results indicate that Combined Diverse Teams with training outscore other teams for
coordinated kills, as did teams with gender diversity and training and teams with ethnic
and gender diversity and training.
Differences among teams based on diversity type for transition processes varied,
but a key finding indicates that teams with ethnic diversity outperform homogenous
teams with training on average transition processes.
Discussion
This study adds to the growing literature on diversity in teams, team effectiveness,
and the moderating effect of organizational support on diverse team outcomes. Future
research should continue to examine the extent to which training and diversity of
members can contribute both uniquely and jointly to performance outcomes for teams.
Key Findings
Diverse Team Outcomes
The results of this study suggest that teams with diversity (ethnic and/or gender)
perform better on total team points than homogenous teams. Specifically, the results of
this study indicate that teams with gender diversity significantly outperformed other
teams on total team points, total team kills, total team interaction accuracy, average
transition processes, and coordinated kills, regardless of training. These results are
consistent with the literature on gender diversity, which show that teams with gender
diversity perform better than homogenous teams for most outcomes.

53
Results of this study also suggest that ethnically diverse teams outperformed other
teams on transition processes, regardless of training. These results add to the mixed
findings on ethnically diverse team effectiveness, suggesting that ethnically diverse teams
are more effective at planning/strategizing than other teams. These results also highlight a
need for more research on ethnically diverse teams, looking specifically at team
behavioral processes.
Training & Diverse Team Outcomes
The results of this study suggest the need for more research on the impact of team
training for heterogenous teams. Findings of this study determined that Combined
Diverse Teams performed better on coordinated kills and team interaction accuracy, key
issues that previous research suggests teams with high amounts of surface-level diversity
struggle with. These results imply that when trained, diverse teams are more effective
than homogenous teams in mental model interaction accuracy and coordination.
This study suggests that team training positively impacts diverse teams, indicating
that organizational support, in the form of team training, is an important intervention for
improving diverse team performance. This is especially true to improve team
effectiveness in areas that teams with surface-level diversity have traditionally struggled
with: team interaction accuracy, team transition processes, and coordination.
Additionally, teams with diversity consistently outperformed homogenous teams
on basic measures of performance, total team points and total team kills. These results are
consistent with the informational diversity-cognitive resource perspective, which claims
that team with diversity will perform better than homogenous teams. These results

54
indicate that diversity is an important, positive variable to consider when hoping to
improve team performance.
While many of the team effectiveness variables analyzed in this study indicated
significant results, not all variables were significantly different. Two variables, average
action processes and total role/team accuracy mental models, determined there were no
significant differences among groups on any of the analyses. This lack of significance
between different types of diversity may indicate something important as well: Teams
with gender and/or ethnic diversity do not perform significantly different than
homogenous teams, and thus these surface-level attributes do not inhibit performance as
some previous research suggests.
Limitations
This study faces several limitations. To start, the study uses archival data with a
limited sample size. While the use of this dataset allowed for the analysis of multiple
complex variables, the archival study was not designed to analyze data related to surface
level diversity. This resulted in an uneven number of groups, with two groups (gender
diversity, no training and no diversity, no training) only had one team in each category.
However, most of the hypotheses looked at groups through the results of contrasts,
meaning categories are grouped together to form larger groups for the analysis (eg. when
comparing groups with training and diversity to all others, groups are combined to form
two larger categories). It should also be noted that a Levine’s test for equality of variance
was performed for each analysis and determine that variance between group that were
contrasted were equal in variance in each case.

55
In addition, the archival study was conducted at a university in a very ethnically
diverse area. Because all participants were from the same university community, it is
impossible to determine whether participants knew each other before the study or the
extent to which their prior experiences interacting with diverse others may have
influenced their interpersonal interactions. This is a limitation because research shows
that team tenure impacts team outcomes, especially in the context of heterogenous teams.
On top of this, only gender and ethnic diversity were assessed as diverse
variables. These two variables are important surface level attributes, but they are by no
means generalizable to other attributes. Additionally, the way the two variables were
studied in this analysis is also a limitation. Gender was only examined as man/woman,
and ethnicity was lumped into white/not white categories. These categories, especially in
the political zeitgeist of 2020, are not enough when studying diversity variables. We now
identify gender on a spectrum, not simply as a categorical variable; something this data
set was unable to identify. Additionally, to get the best results it would be best to identify
specific types of ethnic diversity within teams, rather than simply coding teams as all
white or ethnically diverse; different ethnicities (as a group) may impact team
effectiveness differently. This is something the current study was unable to address given
the limitations of the dataset.
Future Research
This study sheds light on a host of areas in need of future research related to
diverse teams, team effectiveness, and the impact team training has on diverse team
outcomes.

56
First, it’s important to note that processes were looked at on average in this
analysis (in addition to an analysis specific to coordination). However, we know that
different processes make up each specific category; there were three transition processes
and four action processes involved in the archival study, and many more included in the
broader literature. The number of significant differences found in “coordinated kills”
indicate that team diversity may impact some team processes more than others,
suggesting this is an important area to consider for future research. Looking at the results
of specific processes rather than the average score each team received may be more
effective in identifying ways diverse team outcomes are impacted by training.
Second, there is also a need for more research on individual surface level diversity
variables. Factors that are important to consider in future research include age, religious
dress/religion, and physical disability, among others. Additionally, future research should
look at gender and ethnicity on a deeper level. For example, it would be beneficial to look
at gender as a spectrum, rather than simply man or woman. Additionally, looking at the
distribution of specific ethnicities rather than simply “ethnically diverse” (not
homogenously white) teams would be not only beneficial, but also a more holistic,
modern way to research ethnic diversity in teams.
Finally, future research should look at the effectiveness of diversity trainings in
comparison to team training. Currently, many corporations are investing in diversity
training as a popular intervention used to promote inclusion (and thus team cohesion and
effectiveness) in the workplace. However, little research has been conducted on the
impact these trainings have on team outcomes. Future research should seek to identify

57
first the impact of these diversity trainings on team outcomes, and next compare the
impact of diversity trainings on team outcomes to the impact of team training on diverse
teams. Currently, results of this study suggest that team training may be a viable
alternative option for organizations looking to support diverse teams, particularly in
transition processes, team interaction mental models, and coordination.
Conclusion
The results of this study indicate a need for more research on the impact team
training has for heterogenous team outcomes. Researchers should work to further identify
the impact of team training, and other forms of organizational support on teams with high
levels of surface level diversity.
Results also indicate that teams with gender and/or ethnic diversity that receive
training outperform homogenous teams on transition processes, interaction accuracy
mental models, and coordination. It’s important to note that these variables focus on a
team’s ability to effectively work together through activities like planning, evaluating,
communicating, and coordinating. Given these results, team training (specifically
interpositional and interactional training) is a viable option for organizations hoping to
improve the effectiveness of teams with ethnic and/or gender diversity in these areas.

58
References
Adams, R. B., & Ferreira, D. (2009). Women in the boardroom and their impact on
governance and performance. Journal of Financial Economics, 291–309.
Amason, A. C., Shrader, R. C., & Tompson, G. H. (2006). Newness and novelty: Relating
top management team composition to new venture performance. Journal of Business
Venturing, 125–148.
Ancona, D. G., & Caldwell, D. F. (1992). Demography and Design: Predictors of New
Product Team Performance. Organization Science, 321–341.
Bantel, K. A. (1994). Strategic Planning Openness. Group & Organization Management,
406–424.
Bell, M. P., Connerley, M. L., & Cocchiara, F. K. (2009). The Case for Mandatory Diversity
Education. Academy of Management Learning & Education, 597–609.
Bell, S. T. (2007). Deep-level composition variables as predictors of team performance: A
meta-analysis. Journal of Applied Psychology, 595–615.
Bell, S. T., Villado, A. J., Lukasik, M. A., Belau, L., & Briggs, A. L. (2010). Getting
Specific about Demographic Diversity Variable and Team Performance Relationships: A
Meta-Analysis. Journal of Management, 709–743.
Brannick, M. T., Roach, R. M., & Salas, E. (1993). Understanding Team Performance: A
Multimethod Study. Human Performance, 287–308.
Brewer, M. B. (1979). In-group bias in the minimal intergroup situation: A cognitive-
motivational analysis. Psychological Bulletin, 307–324.
Brewer, M. B. (1995). Managing diversity: The role of social identities. Diversity in Work
Teams: Research Paradigms for a Changing Workplace., 47–68.
Burke, C. S. (1999). Examination of the cognitive mechanisms through which team leaders
promote effective team process and adaptive team performance. Doctoral dissertation.
George Mason University, Fairfax, Virginia.
Cannon-Bowers, J. A., Salas, E., & Converse, S. A. (1993). Shared mental models in expert
team decision making. In N. J. Castellan Jr. (Ed.), Current issues in individual and group
decision making (pp. 221-246.). Hillsdale, NJ: LEA.

59
Cannon-Bowers, J. A., Salas, E., Blickensderfer, E., & Bowers, C. A. (1998). The Impact of
Cross-Training and Workload on Team Functioning: A Replication and Extension of
Initial
Findings. Human Factors: The Journal of the Human Factors and Ergonomics Society, 92–
101.
Christian, J., Porter, L. W., & Moffitt, G. (2006). Workplace Diversity and Group Relations:
An Overview. Group Processes & Intergroup Relations, 459–466.
Cox, T. H., & Blake, S. (1991). Managing cultural diversity: implications for organizational
competitiveness. Academy of Management Perspectives, 45–56.
Dickinson, T. L., & McIntyre, R. M. (1997). A conceptual framework for teamwork
measurement. In M. T. Brannick, E. Salas, & C. Prince. (Eds.) Team performance
assessment and measurement. (pp. 19-43). Mahwah, NJ: Lawrence Erlbaum Associates,
Inc.
Dufwenberg, M., & Muren, A. (2006). Gender composition in teams. Journal of Economic
Behavior & Organization, 50–54.
Edwards, B. D., Day, E. A., Arthur, W., & Bell, S. T. (2006). Relationships among team
ability composition, team mental models, and team performance. Journal of Applied
Psychology, 727–736.
Ely, R. J., & Thomas, D. A. (2001). Cultural Diversity at Work: The Effects of Diversity
Perspectives on Work Group Processes and Outcomes. Administrative Science Quarterly,
229.
Ensley, M. D., & Hmieleski, K. M. (2005). A comparative study of new venture top
management team composition, dynamics and performance between university-based and
independent start-ups. Research Policy, 1091–1105.
Fleishman, E.A. & Zaccaro, S.J. (1992). Toward a taxonomy of team performance functions.
In R.W. Sweezy & E. Salas (Eds.), Teams: Their training and performance. Norwood, NJ:
Ablex Publishing Company.
Fowlkes, J. E., Lane, N. E., Salas, E., Franz, T., & Oser, R. (1994). Improving the
Measurement of Team Performance: The TARGETs Methodology. Military Psychology,
47–61.
60
Hackman, J., & Morris, C. G. (1975). Group Tasks, Group Interaction Process, and Group
Performance Effectiveness: A Review and Proposed Integration. Advances in
Experimental Social Psychology Advances in Experimental Social Psychology Volume 8,
45–99.
Hamilton, B. H., Nickerson, J. A., & Owan, H. (2001). Team Incentives and Worker
Heterogeneity: An Empirical Analysis of the Impact of Teams on Productivity and
Participation. SSRN Electronic Journal.
Hamilton B, Nickerson J, Owan H (2012) Advances in the economic analyses of
participatory and labor-managed firms. Bryson A, ed. Diversity and Productivity in
Production Teams, Vol. 13. (Emerald Group Publishing Limited, Bingley, UK), 99-138.
Hansen, Z., Owan, H., & Pan, J. (2006). The Impact of Group Diversity on Performance and
Knowledge Spillover -- An Experiment in a College Classroom. National Bureau of
Economic Research.
Harrison, D. A., & Klein, K. J. (2007). Whats the difference? diversity constructs as
separation, variety, or disparity in organizations. Academy of Management Review, 32(4),
1199–1228.
Hentschel, T., Shemla, M., Wegge, J., & Kearney, E. (2013). Perceived Diversity and Team
Functioning. Small Group Research, 33–61.
Hoogendoorn, S., Oosterbeek, H., & Praag, M. V. (2011). The Impact of Gender Diversity
on the Performance of Business Teams: Evidence from a Field Experiment. SSRN
Electronic Journal.
Horwitz, S. K., & Horwitz, I. B. (2007). The Effects of Team Diversity on Team Outcomes:
A Meta-Analytic Review of Team Demography. Journal of Management, 987–1015.
Jackson, S. E., Joshi, A., & Erhardt, N. L. (2003). Recent Research on Team and
Organizational Diversity: SWOT Analysis and Implications. Journal of
Management, 801–830.
Jehn, K. A., & Bezrukova, K. (2004). A field study of group diversity, workgroup context,
and performance. Journal of Organizational Behavior, 703–729.
Kanter, R. M. (2010). Men and women of the corporation. New York, NY: Basic Books.

61
Klimoski, R., & Mohammed, S. (1994). Team Mental Model: Construct or
Metaphor? Journal of Management, 403–437.
Knippenberg, D. and Schippers, M.C. (2007) Work group diversity. Annual Review of
Psychology 58: 515-541.
Knippenberg, D. V., Dreu, C. K. W. D., & Homan, A. C. (2004). Work Group Diversity and
Group Performance: An Integrative Model and Research Agenda. Journal of Applied
Psychology, 1008–1022.
Knouse, S. B., & Dansby, M. R. (1999). Percentage of Work-Group Diversity and Work-
Group Effectiveness. The Journal of Psychology, 486–494.
Kraiger, K., Ford, J. K., & Salas, E. (1993). Application of cognitive, skill-based, and
affective theories of learning outcomes to new methods of training evaluation. Journal of
Applied Psychology, 311–328.
Marks, M. A., Zaccaro, S. J., & Mathieu, J. E. (2000). Performance implications of leader
briefings and team-interaction training for team adaptation to novel
environments. Journal of Applied Psychology, 971–986.
Marks, M. A., Mathieu, J. E., & Zaccaro, S. J. (2001). A Temporally Based Framework and
Taxonomy of Team Processes. The Academy of Management Review, 356.
Mccann, C., Baranski, J. V., Thompson, M. M., & Pigeau, R. A. (2000). On the utility of
experiential cross-training for team decision making under time stress. Ergonomics,
1095–1110.
Mcgrath, J. E., Berdahl, J. L., & Arrow, H. (1995). Traits, expectations, culture, and clout:
The dynamics of diversity in work groups. Diversity in Work Teams: Research
Paradigms for a Changing Workplace., 17–45.
Merriam-Webster, Inc. (2003). Merriam-Websters collegiate dictionary & thesaurus. United
States of America.
Milliken, F. J., & Martins, L. L. (1996). Searching for Common Threads: Understanding the
Multiple Effects of Diversity in Organizational Groups. Academy of Management
Review, 402–433.

62
Mohammed, S., & Angell, L. C. (2004). Surface- and deep-level diversity in workgroups:
examining the moderating effects of team orientation and team process on relationship
conflict. Journal of Organizational Behavior, 1015–1039.
Nichols, L. O., De Friese, A. M., & Malone, C. C. (2002). Team process. In G.D. Heinemann
& A,M. Zeiss Team Performance in health Care (p. 71-88). Kluwer Academic: New York.
Pelled, L. H. (1996). Demographic Diversity, Conflict, and Work Group Outcomes: An
Intervening Process Theory. Organization Science, 615–631.
Pelled, L. H., Eisenhardt, K. M., & Xin, K. R. (1999). Exploring the Black Box: An Analysis
of Work Group Diversity, Conflict, and Performance. Administrative Science
Quarterly, 44(1), 1.
Price, K. H., Harrison, D. A., Gavin, J. H., & Florey, A. T. (2002). Time, Teams, And Task
Performance: Changing Effects Of Surface- And Deep-Level Diversity On Group
Functioning. Academy of Management Journal, 1029–1045.
Rittman, A. (2004). A Comparison of Team Training Strategies for Team Effectiveness.
Doctoral dissertation. George Mason University, Fairfax, Virginia.
Salas, E. & Cannon-Bowers, J. A. (1997). Methods, tools, and strategies for team training. In
M. A. Quinones & A. Ehrenstein (Eds.) Training for a rapidly changing workplace:
Applications of psychological research. Washington DC: APA.
Salas, E., Diazgranados, D., Klein, C., Burke, C. S., Stagl, K. C., Goodwin, G. F., & Halpin,
S. M. (2008). Does Team Training Improve Team Performance? A Meta-
Analysis. Human Factors: The Journal of the Human Factors and Ergonomics Society,
903–933.
Salas, E. & Cannon-Bowers, J. A. (2000). The anatomy of team training. In Tobias &
Fletcher, Eds. Training and Retraining: A handbook for business, industry, government
and the military (pp. 312-335). New York: MacMillan Reference.
Salazar, M. R., Feitosa, J., & Salas, E. (2017). Diversity and team creativity: Exploring
underlying mechanisms. Group Dynamics: Theory, Research, and Practice, 187–206.
Simons, T., Pelled, L. H., & Smith, K. A. (1999). Making Use of Difference: Diversity,
Debate, And Decision Comprehensiveness in Top Management Teams. Academy of
Management Journal, 662–673.

63
Stewart, G. L. (2006). A Meta-Analytic Review of Relationships Between Team Design
Features and Team Performance. Journal of Management, 29–55.
Stevens, M. J. & Yarish, M. E. (1999). Training for team effectiveness. In E. Sundstrom,
Supporting Work Team Effectiveness: Best Management Practices for Fostering High
Performance. San Francisco: Jossey-Bass.
Tajfel, H. (1969). Cognitive Aspects of Prejudice. Journal of Social Issues, 79–97.
Tajfel, H., & Turner, J. C. 1979. An integrative theory of intergroup conflict. In W. G. Austin
& S. Worchel (Eds.), The social psychology of intergroup relations (pp. 33-47).
Monterey, CA: Brooks/Cole.
The attraction paradigm. (1971). Behavior Therapy, 337–338.
Thatcher, S. M. B., Jehn, K. A., & Zanutto, E. (2003). Cracks in diversity research: the
effects of diversity fault lines on conflict and performance. Group Decision and
Negotiation, 12, 217–241.
Timmerman, T. A. (2000). Racial Diversity, Age Diversity, Interdependence, and Team
Performance. Small Group Research, 592–606.
Volpe, C. E., Cannon-Bowers, J. A., Salas, E., & Spector, P. E. (1996). The Impact of Cross-
Training on Team Functioning: An Empirical Investigation. Human Factors: The Journal
of the Human Factors and Ergonomics Society, 87–100.
Wagner, W. G., Pfeffer, J., & Oreilly, C. A. (1984). Organizational Demography and
Turnover in Top-Management Group. Administrative Science Quarterly, 74.
Wegge, J., & Shemla, M. (2015). Managing Diverse Teams by Enhancing Team
Identification: The Mediating Role of Perceived Diversity. Academy of Management
Proceedings, 2015(1), 12464.
Wiener, E. L., Kanki, B. G., & Helmreich, R. L. (1993). Cockpit resource management. San
Diego, CA: Academic Press.
Wiersema, M. F., & Bantel, K. A. (1992). Top Management Team Demography And
Corporate Strategic Change. Academy of Management Journal, 91–121.

64
Wiersema, M. F., & Bird, A. (1993). Organizational Demography In Japanese Firms: Group
Heterogeneity, Individual Dissimilarity, And Top Management Team Turnover. Academy
of Management Journal, 996–1025.
Williams, K. Y., & O’Reilly, C. A., III. (1998). Demography and diversity in organizations: A
review of 40 years of research. In B. M. Staw &L. L. Cummings (Eds.), Research in
organizational behavior (Vol. 20, pp. 77–140). Greenwich, CT: JAI Press.
Zaccaro, S. J., Ardison, S., & Orvis, K. L. (2004). Leadership in virtual teams. In D. Day, S.
Zaccaro, & S. Halpin (Eds.) Leader Development for Transforming Organizations, pp.
267-292. Mahwah, NJ: Lawrence Erlbaum Associates, Publishers.