diversidade genÉtica estrutura populacional...
TRANSCRIPT

PONTIFÍCIA UNIVERSIDADE CATÓLICA DO RIO GRANDE DO SUL
DISSERTAÇÃO DE MESTRADO
DIVERSIDADE GENÉTICA E ESTRUTURA
POPULACIONAL DO LOBO-GUARÁ (CHRYSOCYON BRACHYURUS)
MANOEL LUDWIG DA FONTOURA RODRIGUES ORIENTADOR: EDUARDO EIZIRIK
PORTO ALEGRE, 2009
II
PONTIFÍCIA UNIVERSIDADE CATÓLICA DO RIO GRANDE DO SUL
FACULDADE DE BIOCIÊNCIAS
PROGRAMA DE PÓS-GRADUAÇÃO EM ZOOLOGIA
DIVERSIDADE GENÉTICA E ESTRUTURA POPULACIONAL DO
LOBO-GUARÁ (Chrysocyon brachyurus)
Manoel Ludwig da Fontoura Rodrigues Orientador: Dr. Eduardo Eizirik
DISSERTAÇÃO DE MESTRADO
PORTO ALEGRE – RS – BRASIL
2009
III
Sumário Resumo .......................................................................................................................... IV Abstract .......................................................................................................................... V Apresentação ................................................................................................................. VI Artigo Científico .......................................................................................................... VII Abstract ................................................................................................................ 2 Introduction ......................................................................................................... 2 Materials and Methods ........................................................................................ 7 Results ................................................................................................................ 12 Discussion .......................................................................................................... 15 Acknowledgements ............................................................................................. 22 References .......................................................................................................... 23 Figures ............................................................................................................... 29 Tables ................................................................................................................. 31
IV
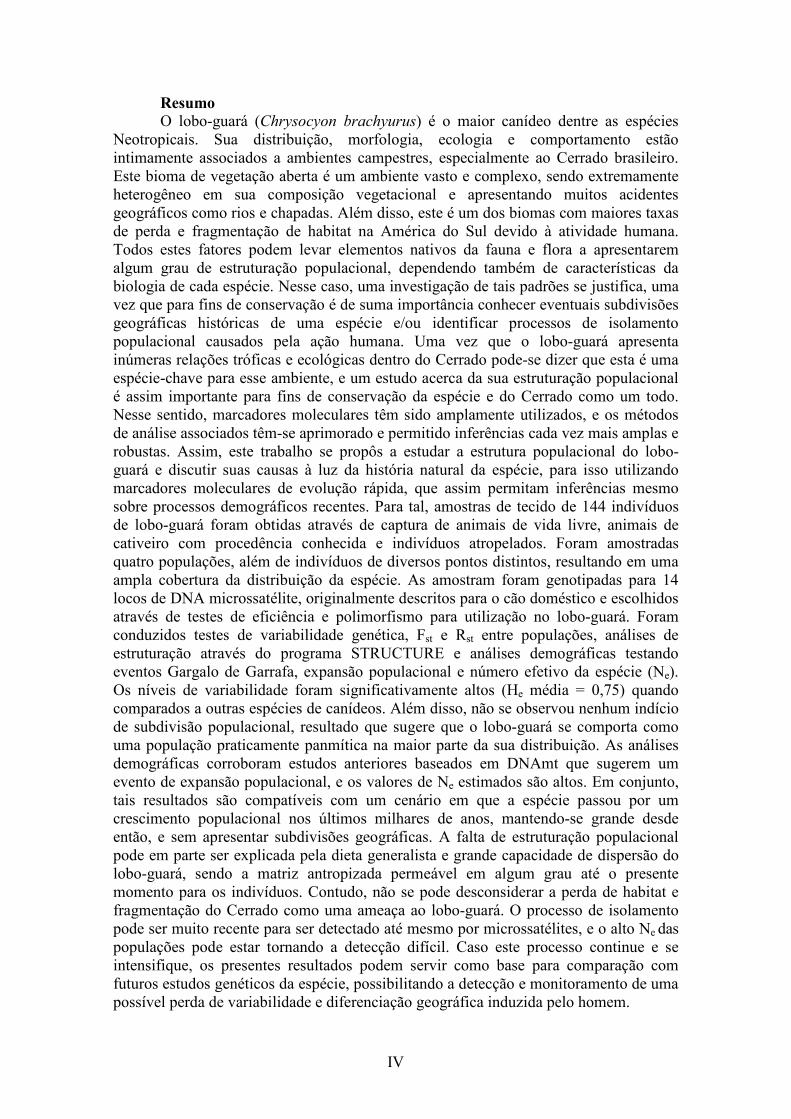
Resumo O lobo-guará (Chrysocyon brachyurus) é o maior canídeo dentre as espécies Neotropicais. Sua distribuição, morfologia, ecologia e comportamento estão intimamente associados a ambientes campestres, especialmente ao Cerrado brasileiro. Este bioma de vegetação aberta é um ambiente vasto e complexo, sendo extremamente heterogêneo em sua composição vegetacional e apresentando muitos acidentes geográficos como rios e chapadas. Além disso, este é um dos biomas com maiores taxas de perda e fragmentação de habitat na América do Sul devido à atividade humana. Todos estes fatores podem levar elementos nativos da fauna e flora a apresentarem algum grau de estruturação populacional, dependendo também de características da biologia de cada espécie. Nesse caso, uma investigação de tais padrões se justifica, uma vez que para fins de conservação é de suma importância conhecer eventuais subdivisões geográficas históricas de uma espécie e/ou identificar processos de isolamento populacional causados pela ação humana. Uma vez que o lobo-guará apresenta inúmeras relações tróficas e ecológicas dentro do Cerrado pode-se dizer que esta é uma espécie-chave para esse ambiente, e um estudo acerca da sua estruturação populacional é assim importante para fins de conservação da espécie e do Cerrado como um todo. Nesse sentido, marcadores moleculares têm sido amplamente utilizados, e os métodos de análise associados têm-se aprimorado e permitido inferências cada vez mais amplas e robustas. Assim, este trabalho se propôs a estudar a estrutura populacional do lobo-guará e discutir suas causas à luz da história natural da espécie, para isso utilizando marcadores moleculares de evolução rápida, que assim permitam inferências mesmo sobre processos demográficos recentes. Para tal, amostras de tecido de 144 indivíduos de lobo-guará foram obtidas através de captura de animais de vida livre, animais de cativeiro com procedência conhecida e indivíduos atropelados. Foram amostradas quatro populações, além de indivíduos de diversos pontos distintos, resultando em uma ampla cobertura da distribuição da espécie. As amostram foram genotipadas para 14 locos de DNA microssatélite, originalmente descritos para o cão doméstico e escolhidos através de testes de eficiência e polimorfismo para utilização no lobo-guará. Foram conduzidos testes de variabilidade genética, Fst e Rst entre populações, análises de estruturação através do programa STRUCTURE e análises demográficas testando eventos Gargalo de Garrafa, expansão populacional e número efetivo da espécie (Ne). Os níveis de variabilidade foram significativamente altos (He média = 0,75) quando comparados a outras espécies de canídeos. Além disso, não se observou nenhum indício de subdivisão populacional, resultado que sugere que o lobo-guará se comporta como uma população praticamente panmítica na maior parte da sua distribuição. As análises demográficas corroboram estudos anteriores baseados em DNAmt que sugerem um evento de expansão populacional, e os valores de Ne estimados são altos. Em conjunto, tais resultados são compatíveis com um cenário em que a espécie passou por um crescimento populacional nos últimos milhares de anos, mantendo-se grande desde então, e sem apresentar subdivisões geográficas. A falta de estruturação populacional pode em parte ser explicada pela dieta generalista e grande capacidade de dispersão do lobo-guará, sendo a matriz antropizada permeável em algum grau até o presente momento para os indivíduos. Contudo, não se pode desconsiderar a perda de habitat e fragmentação do Cerrado como uma ameaça ao lobo-guará. O processo de isolamento pode ser muito recente para ser detectado até mesmo por microssatélites, e o alto Ne das populações pode estar tornando a detecção difícil. Caso este processo continue e se intensifique, os presentes resultados podem servir como base para comparação com futuros estudos genéticos da espécie, possibilitando a detecção e monitoramento de uma possível perda de variabilidade e diferenciação geográfica induzida pelo homem.
V
Abstract The maned wolf (Chrysocyon brachyurus) is the largest species among the Neotropical canids. Its distribution, morphology, ecology and behavior are closely associated to open vegetation environments, especially the Brazilian Cerrado. This savanna-like biome is a large and complex environment, presenting highly heterogeneous vegetational composition and many geographic elements, such as rivers and mountains. Moreover, this is one of the most human-disturbed biomes in South America, undergoing a high rate of habitat loss and fragmentation. These natural and human-induced factors can lead to different degrees of population structuring of native fauna and flora, depending on ecological and behavioral characteristics of each species. A broad investigation of such patterns is justified, once it is very important in terms of conservation to know possible historical geographic subdivisions of a species, and/or to identify processes of population isolation caused by humans. Once the maned wolf presents many ecological interactions with other Cerrado-dwelling species, it can be considered a keystone species in this ecosystem, which highlights the need to characterize its population structure in the context of adequately conserving and managing the Cerrado biota. For such purposes, molecular markers are a widely utilized tool, and the associated analytical methods are becoming increasingly broad and robust. Thus, this study aimed to investigate the population structure of the maned wolf and to analyze it in the context of the species’ natural history, through the utilization of fast evolving molecular markers that allow inferences on even recent demographic processes. To do that, tissue samples of 144 maned wolves were obtained through the capture of free living animals, captive animals with known geographic origin and road-killed individuals. Four local populations were sampled in addition to individual collection from many geographic points, resulting in a broad coverage of the species’ distribution. The individuals were genotyped for 14 microsatellite loci, originally developed for the domestic dog and selected for use in this species after an initial screening for amplification efficiency and polymorphism. Analyses were performed to assess genetic variability, population pairwise Fst and Rst, structure analyses with the software STRUCTURE, and demographic tests to check for bottleneck events, population expansion and effective number of individuals (Ne). The diversity levels verified were quite high (mean He = 0.75) when compared to other canid species. Furthermore, no clear-cut population subdivision was detected, leading to the conclusion that the maned wolf exists as an almost panmictic population throughout a large portion of its distribution. The results of the demographic analyses corroborated previous analyses based on mtDNA data that had inferred a population expansion in this species, and Ne estimated numbers were high. Jointly, these results are compatible with a scenario where maned wolves underwent a population growth in the last few thousand years, maintaining a large number of individuals since then and not presenting any geographic subdivision. Lack of population structure can be, at least in part, explained by the generalist dietary habits and the great dispersal capability of the maned wolf, also implying that so far the anthropic habitat matrix has been permeable to a certain degree for the individuals of this species. However, habitat loss and fragmentation cannot be discarded as a threat for the maned wolf. The isolation process can be too recent to be detected even with microsatellites, and the still large effective size of regional populations may also delay the ability to detect ongoing processes of genetic fragmentation. In case such process continues and becomes even more intense, our present data set should provide a baseline for comparison with future genetic assessments of the maned wolf, allowing the detection of population-level trends of loss of variation and human-induced geographic differentiation.
VI
Apresentação
Esta dissertação é um dos requisitos exigidos para obtenção do título de Mestre
pelo Programa de Pós-Graduação em Zoologia, Faculdade de Biociências, Pontifícia
Universidade Católica do Rio Grande do Sul.
Os resultados aqui apresentados foram gerados ao longo dos meus últimos dois
anos de estudos, realizados no Laboratório de Biologia Genômica e Molecular,
vinculado a esta universidade, sob orientação do Professor Eduardo Eizirik.
O trabalho está sendo apresentado sob forma de artigo científico, segundo as
normas da revista Molecular Ecology, para o qual o mesmo será posteriormente
submetido (categoria Original article). As normas de submissão para autores estão
disponíveis no sítio “http://www.wiley.com/bw/submit.asp?ref=0962-1083&site=1”.
Acompanha o artigo um resumo estendido do trabalho (versões em português e inglês,
ver acima). Tabelas e figuras podem ser encontradas após o texto principal do artigo.
VII
Artigo Científico
“High microsatellite diversity and remarkable lack of population
structure in the maned wolf (Chrysocyon brachyurus) (Carnivora,
Canidae)”
Manoel L. da Fontoura-Rodrigues and Eduardo Eizirik
A ser submetido ao periódico científico Molecular Ecology
1
Molecular Ecology 1
Revised Manuscript, 15 May 2009. 2
Original Article 3
High microsatellite diversity and remarkable lack of population structure 4
in the maned wolf (Chrysocyon brachyurus) (Carnivora, Canidae) 5
6
Manoel L. da Fontoura-Rodrigues1 and Eduardo Eizirik1,2 7
8
1Faculdade de Biociências, PUCRS. Av. Ipiranga 6681, prédio 12. Porto Alegre, RS 90619-9
900, Brazil. 10
2Instituto Pró-Carnívoros. Av. Horácio Neto, 1030, Casa 10, Parque Edmundo Zanoni, 11
Atibaia, SP 12940-970, Brazil. 12
13
Keywords: maned wolf, microsatellites, demography, evolution, population structure, 14
conservation 15
16
Corresponding author: 17
Eduardo Eizirik, Faculdade de Biociências, PUCRS. Av. Ipiranga 6681, prédio 12. Porto 18
Alegre, RS 90619-900, Brazil. Fax: 55-51-3320-3612. Email: [email protected] 19
20
Running Title: Population history of the maned wolf 21
22
23
24
2
Abstract 25
The maned wolf is the largest South American canid, and its distribution and habits are 26
closely associated with the Brazilian Cerrado. As this is a highly heterogeneous environment, 27
as well as one of most disturbed Neotropical Biomes (suffering from intense habitat loss and 28
fragmentation), the population structure and history of this keystone species was investigated 29
through the use of microsatellite markers. Fourteen tetranucleotide loci were genotyped for 30
samples from most of the species’ range, revealing a high level of genetic diversity (mean He 31
= 0.75). Surprisingly, no evidence of historical or current geographic partitioning was 32
observed. All the analyses pointed to the existence of an almost panmictic population 33
spanning the main portion of the maned wolf distribution, which could be explained by some 34
ecological and behavioral traits of this species. Furthermore, demographic analyses support a 35
scenario of a population expansion in the last few thousand years, whose genetic signature 36
can still be detected in the patterns of microsatellite variation. 37
38
Introduction 39
The population structure and natural history of organisms that are closely associated to one 40
Biome or to a specific habitat can be shaped by past and present processes that affect the 41
characteristics, range and continuity of this environment. Biomes occupying large areas are 42
often subdivided into smaller domains, consisting of slightly different environments or 43
separated by natural barriers such as rivers and mountains. Furthermore, anthropogenic 44
activities are currently responsible for recent habitat loss and fragmentation, which may also 45
lead to subdivisions of formerly continuous environments. 46
This scenario of natural and/or anthropogenic discontinuity might be expected for the 47
Brazilian Cerrado, one of the largest South American Biomes (Silva & Bates 2005). This 48
3
savanna-like environment occupies most of the central region of Brazil, and harbors high 49
levels of biodiversity (Myers et al. 2000; Klink & Machado 2005). Because of its large area, 50
the Cerrado may contain biotic subdivisions, once it presents large rivers and other such 51
geographic elements. Moreover, it is composed by a mosaic of well defined vegetational 52
formations, ranging from totally open fields to forested areas (Silva & Bates 2005). Finally, 53
the Cerrado is one of the environments in South America that is most impacted by human 54
activities, as it is now widely utilized for agriculture and cattle ranching (Klink & Machado 55
2005). Some studies reveal that no more than 20% of the original biome remains intact to the 56
present day (Myers et al. 2000), with the rate of habitat loss being very high (1.5% of the total 57
area of the Cerrado per year – Machado et al. 2004). 58
All of these aspects can shape the distribution and spatial structure of this Biome, thus 59
affecting the geographic range and population structure of its associated fauna and flora. 60
Therefore, studying the population structure of its elements can shed light on natural 61
processes leading to environmental disjunction, as well as on human-induced fragmentation. 62
The latter issue is of great conservation concern, once it can lead to the isolation of Cerrado-63
dwelling species in small remnant populations. The consequences of this process are well 64
documented by population genetics (Frankham et al. 2002), and to know if this is happening 65
is crucial for the design of adequate management plans and conservation efforts. 66
The maned wolf (Chrysocyon brachyurus) is one of the most conspicuous components 67
of the Cerrado, and presents a geographic distribution that largely coincides with the range of 68
this Biome (Figure 1). It is the largest Neotropical canid, ranging from 20 to 30 kg of total 69
body weight and from 95 to 115 cm in body length (Rodden et al. 2004). The morphology of 70
the species is highly distinctive and well adapted to the life on savannas and prairies, as can 71
be noticed by the presence of long legs, large ears and slender body. Behavioral traits, such as 72
4
the pacing gait, also denote the species’ adaptations to this kind of environment (Dietz 1985). 73
In addition to its stronghold in the Cerrado, this species also occurs in some patches of the 74
South American Pampas (in Brazil, Uruguay and Argentina), Paraguayan Chaco and the 75
savannas of northern Bolivia, all of which are being formations (Rodden et al. 2004). The 76
dietary habits of this species also reveal close association to several fruits and small animals 77
that are typical of the Cerrado. Several studies have reported that the most important item of 78
the maned wolf diet is the fruit of Solanum lycocarpum, which may account for as much as 79
30-50% of the ingested food. Its diet also includes many other fruits and small animals such 80
as birds, lizards, snakes, rodents, marsupials and arthropods (Dietz 1984; Juarez & Marinho-81
Filho 2002; Santos et al. 2003; Jácomo et al. 2004; for a review see Rodden et al. 2004). 82
Regarding the species’ social structure, many issues remain to be understood. Since 83
the analysis of maned wolf ecology by Dietz (1984), few studies have been published 84
expanding those observations with larger sample sizes, or further refining our understanding 85
of the species’ biology. Current knowledge suggests that the species is monogamous, 86
breeding once a year and raising usually 2-5 cubs (Dietz 1985). Pups and juveniles are 87
thought to spend their first year with parents, dispersing in the second year as they reach 88
sexual maturity (Rodden et al. 2004). However, details on patterns of parental care and 89
dispersal events are poorly known. Except for the mating season, individuals are solitary, 90
sharing large living areas apparently only with mates (Dietz 1984). However, tolerance to 91
home range overlap with pups and adjacent pairs has not yet been sufficiently investigated. 92
The territorialism and the large size of the living areas (ca. 27 km2 [Dietz 1984]) lead 93
to the prediction that long-term viable populations of maned wolf need large continuous areas 94
of habitat. Once the Cerrado is facing a rapid process of habitat loss and fragmentation, the 95
study of the species’ population structure is very important to verify (i) if there are 96
5
geographically defined populations prior to any structure caused by current habitat 97
fragmentation, and (ii) if the current discontinuous distribution of the Cerrado is already 98
causing populations to become isolated. As mentioned before, to know if such processes are 99
happening and to what degree is an important issue for conservation biology, further 100
considering that the maned wolf can be seen as a key species for the Cerrado due to the high 101
number of trophic and ecological interactions (Simberloff 1998). 102
However, it is important to be noted that many aspects of the maned wolf ecology and 103
behavior can affect the existence and degree of such possible population structure. Species 104
with large home ranges, such as most canids, tend to present long distance dispersal 105
(Macdonald 1980 apud Macdonald & Sillero-Zubiri 2004; Macdonald & Bacon 1982 apud 106
Macdonald & Sillero-Zubiri 2004), thus being expected to exhibit more gene flow than those 107
that barely disperse. The matrix permeability is also expected to be species-specific, being 108
related not only to dispersal capability, but also to availability of resources, such as food and 109
cover, in the matrix. 110
Finally, an issue related to the power of isolation detection, and not to the isolation 111
process itself, is the effective size (Ne) of each population. Reduction of gene flow between 112
large populations tends to take longer to be detectable, as genetic drift is less effective (Page 113
& Holmes 1998). In the case of the maned wolf, estimates of the number of living individuals 114
are relatively large – ca. 20,000 – 30,000 (Paula et al. 2007), suggesting that Ne might also be 115
quite large. Nevertheless, it is important to note that the species’ distribution is considerably 116
broad, and functional populations can actually present low numbers of individuals due to low 117
demographic densities (Rodden et al. 2004). Moreover, a large number of individuals does 118
not necessarily imply a large effective size, since this estimation is more directly related to the 119

6
species genetic variability and determined by mating system and demographic history 120
(Frankham et al. 2002). 121
Further than only measuring genetic diversity (which is in itself an important indicator 122
of demographic aspects such as Ne, and a significant parameter in the context of population 123
long-term viability [Franklin & Frankham 1998; Lynch & Lande 1998]), the utilization of 124
molecular markers can be a useful approach to investigate if historical or current subdivision 125
processes affecting the Cerrado have influenced the population structure of the maned wolf. 126
In this context, molecular approaches would help to answer questions such as the occurrence, 127
degree and timing of population isolation episodes, presence of migrants among areas, and 128
identification of spatial barriers to the movement of individuals. The species’ evolutionary 129
history can also be investigated, once past demographic fluctuations can be inferred by such 130
tools (Page & Holmes 1998). 131
In a recent molecular survey, P. Prates et al. (in preparation) have analyzed 132
mitochondrial DNA (mtDNA) sequences of maned wolves sampled throughout most of their 133
range, and found very low levels of genetic diversity, with no evidence of geographic 134
structuring. In addition, no molecular diversity was found in a sample of nuclear introns. 135
Their analyses suggested that the species suffered a population bottleneck followed by a 136
significant demographic expansion process ca. 15-20 thousand years ago (kya). 137
However, the exact dimension of this growth and the resulting genetic diversity – 138
especially as measured by rapidly evolving markers – is still a question to be answered, so as 139
to shed light on the maned wolf recent demographic history. Fast evolving loci (e.g. 140
microsatellites) can also eliminate the problem of low information content present in mtDNA 141
and nuclear sequences, thus helping to address the current population structure of the maned 142
wolf. The high mutation rates that are typical of microsatellites allow the identification of 143
7
even recent or slight processes of isolation (Ellegren 2004), so that even the impact of the 144
current environmental fragmentation caused by human activities might be detected using 145
these markers. 146
Given that the low genetic diversity observed so far with sequence-based markers 147
might have hampered the detection of population structuring in this species, the objective of 148
this study was to investigate this issue using microsatellite markers. In addition to measuring 149
current levels of microsatellite diversity, and inferring aspects of the demographic history of 150
the maned wolf, we thus set out to test whether fast-evolving markers could detect the 151
existence of recent population structure in this species, attempting to verify the presence of 152
even subtle patterns of geographic differentiation that might be caused by environmental 153
discontinuities or human-induced habitat fragmentation. 154
155
Materials and Methods 156
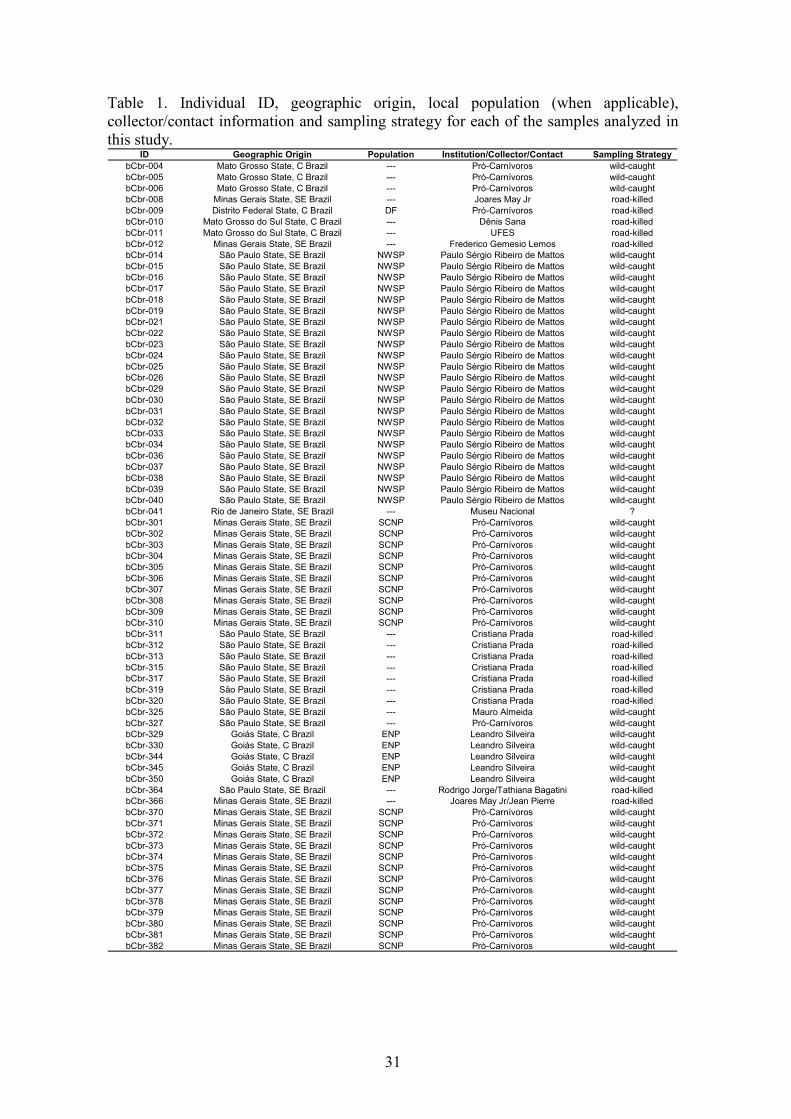
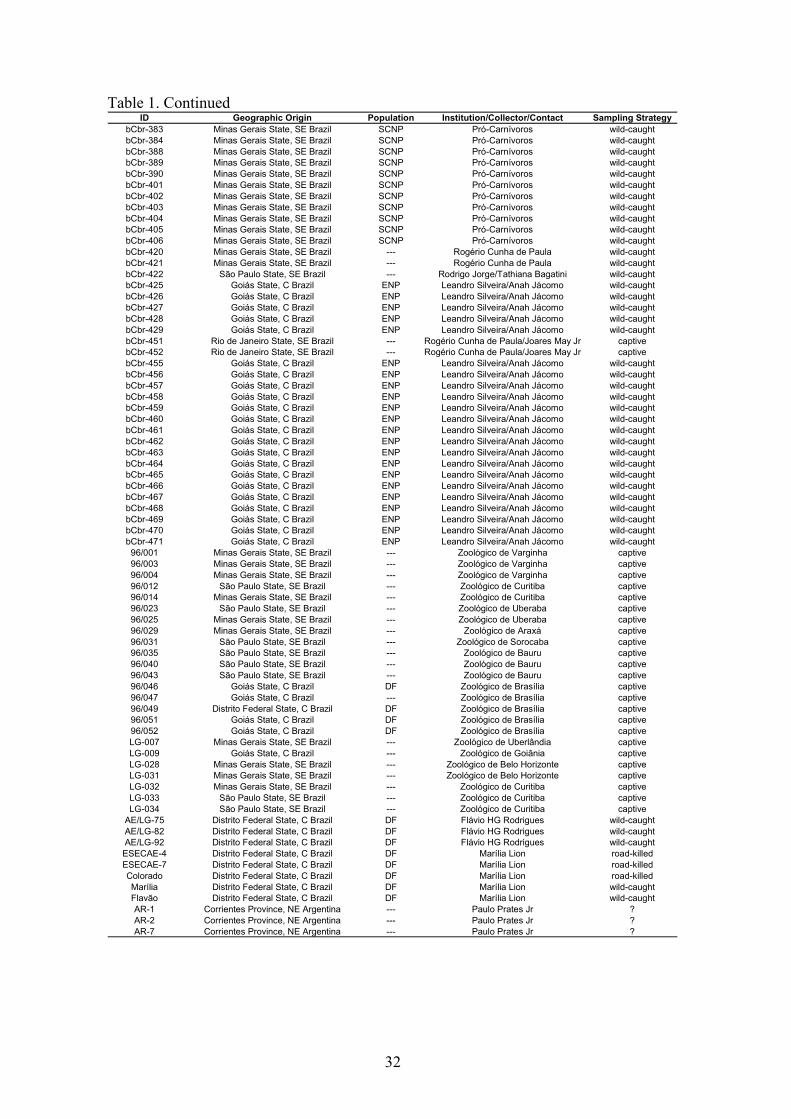
Samples 157
A total set of 144 tissue samples was utilized in this study. Sample collection was conducted 158
over the past ten years, and covers most of the species’ range (Fig. 1). Three free living 159
populations were sampled more thoroughly, through the analysis of wild-caught individuals: 160
Serra da Canastra National Park, MG (SCNP, n = 34), Emas National Park, GO (ENP, n = 27) 161
and Northwestern São Paulo State (NWSP, n = 23) – captured for ecology and/or genetic 162
surveys. Additional samples were collected in different parts of the species’ distribution (from 163
road-killed and captive individuals of known origin), including the Argentinean province of 164
Corrientes and the Brazilian states of Mato Grosso do Sul (MS), Mato Grosso (MT), São 165
Paulo (SP), Minas Gerais (MG), Rio de Janeiro (RJ), Goiás (GO) and Distrito Federal (DF) 166
(see Table 1). In addition to SCNP, ENP and NWSP, samples from Distrito Federal and 167

8
surrounding areas were considered to comprise a fourth definable population (referred to here 168
as DF, n = 13) because of their closely spaced collection points, even though they were 169
collected over a longer time span. In the case of dead animals, muscle or cartilage was 170
collected and preserved in ethanol. For live individuals, blood samples were obtained and 171
preserved in TES solution (100mM Tris, 100mM EDTA and 2% SDS). A phenol-chloroform 172
DNA extraction was conducted for all samples following the protocol of Sambrook & Russel 173
(2001), with slight modifications. 174
175
Markers and PCR 176
Fourteen microsatellite loci were utilized to characterize the genetic diversity of the maned 177
wolf (Table 2). Ten of them had been previously tested and optimized by Fontoura-Rodrigues 178
et al. (2008), and four others were selected based on additional efficiency and polymorphism 179
tests of the same set of tetranucleotide markers developed for the domestic dog (Francisco et 180
al. 1996). PCRs were conducted with a standardized protocol for all loci in a 10 µL volume, 181
using 0.2 µM reverse and M13 fluorescent-labeled primers (FAM, NED or HEX) and 0.013 182
µM forward M13-labeled primer (Boutin-Ganache et al. 2001), 2 mM MgCl2, 0.2 mM each 183
dNTP, 0.5 U of Taq DNA Polymerase (Invitrogen) and 10-30 ng of the target DNA. 184
Reactions began with an initial denaturing step at 94ºC for 3 min, followed by ten cycles of 185
touchdown with denaturing at 94ºC for 45s, annealing at 60-51ºC for 45s and extension at 186
72ºC for 1.5 min. Thirty cycles with the same profile as above were then run, but maintaining 187
the annealing temperature at 50ºC. The last step was a final extension at 72°C for 30 min. 188
Products were run on a MEGABACE 1000 (GE-Healthcare) automated sequencer, with an 189
ET-ROX 550 internal size ladder (GE-Healthcare). The 14 loci were optimized to fit a three 190
multiplex set, according to their dye label and allele size range (Table 2). Fragment length 191
9
was determined using GENETIC PROFILER 2.0 (GE-Healthcare). From the initial set of 192
samples, only those that achieved a minimum genotyping efficiency of ca. 66% (i.e. nine out 193
of 14 loci) were utilized in the final analyses. 194
195
Genetic diversity analyses 196
The entire set of genotypes was tested for Hardy-Weinberg equilibrium (HWE) (Hardy-197
Weinberg Exact Tests [Guo & Thompson 1992]) and linkage equilibrium (LE) using 198
GENEPOP 3.4 (Raymond & Rousset 1995), with default parameters for the statistical 199
significance tests. Genetic diversity indices (expected heterozygosity, observed 200
heterozygosity, polymorphic information content, number of alleles and allelic size range) 201
and the probability of identity (P(ID)) (Waits et al. 2001) per locus, as well as the estimated 202
frequency of null alleles, were calculated using CERVUS 3.0.3 (Marshall et al. 1998). P(ID) is 203
defined as the chance of two individuals presenting the same genotypes at all loci, given the 204
sample size and observed levels of diversity. It is estimated for each locus, but can be easily 205
combined for a set of loci. The lower the combined result, the greater is the power of the 206
marker set to perform analyses. An identity test, to check for the existence of individuals with 207
fully matching genotypes, was also run using CERVUS. 208
209
Population differentiation and structure analyses 210
To investigate the presence of long-term demographic structure (i.e. spanning thousands of 211
years, and caused by geographic barriers or environmental discontinuities) or recent isolation 212
due to habitat fragmentation, population differentiation and structure tests were performed. 213
Pairwise values of Fst and Rst (Reynolds et al. 1983; Slatkin 1995) were estimated for the four 214
assumed populations (SCNP, ENP, NWSP and DF; see Fig. 1) with ARLEQUIN 3.11 215
10
(Excoffier et al. 2005) using 10,000 permutations for the significance test. A population 216
structure analysis was also performed using the Bayesian clustering approach implemented in 217
STRUCTURE 2.2 (Pritchard et al. 2000), which assesses how many populations (k) best 218
explain the data. First, only the individuals belonging to the four well-delimited local 219
populations were included in the analysis. In a second set of runs, all genotyped individuals 220
were included. The parameters of the STRUCTURE analysis were 50,000 burn-in steps plus 221
1,000,000 MCMC iterations for sampling, under the admixture model. For each value of k, 222
ten runs were performed. Finally, we checked for the existence and degree of isolation by 223
distance using a Mantel Test (Mantel 1967), carried out with the program AIS (Miller 2005), 224
employing 1,000 replicates for the significance test. 225
226
Demographic analyses 227
Demographic analyses were conducted to investigate the species’ population history over the 228
past several thousand years. Genetic diversity is not only affected by population structure, but 229
also by demographic processes such as population growth, bottleneck events and other types 230
of fluctuations in the number of individuals over many generations. The inference of 231
demographic parameters affected by such historical processes allows the investigation of the 232
underlying causes of the variability observed today. All demographic tests were conducted 233
without using loci 2137 and 2119, as they likely presented a switch from a tetranucleotide to a 234
dinucleotide repeat motif (see the ‘Results’ section for details). If that is the case, both loci 235
would not fit any of the simplified mutation models available for analysis, and could thus bias 236
the results. 237
To investigate whether drastic population size changes have occurred in the recent 238
past, expansion and bottleneck tests were performed. To check for population expansion, two 239
11
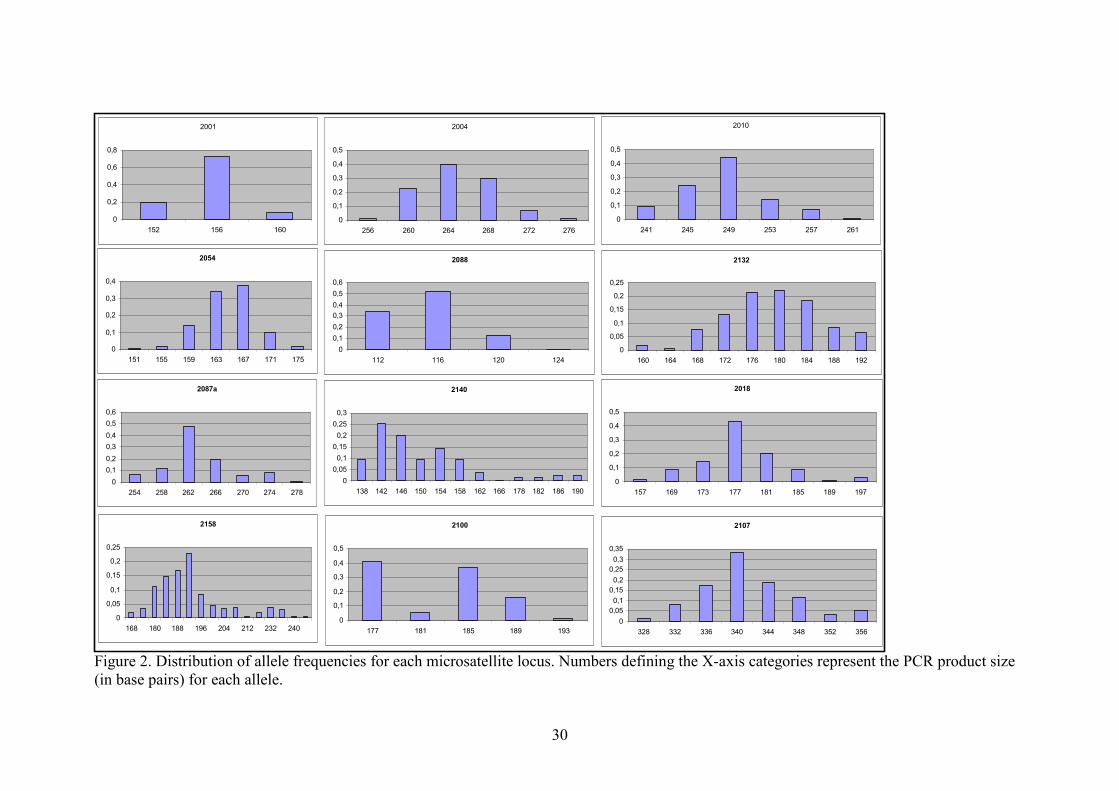
analyses from Reich & Goldstein (1998) were employed: frequency distribution of allele 240
lengths at homologous loci (Fig. 2) and g-statistics. The former analysis is visual, based on 241
the prediction that populations that underwent a severe bottleneck and then expanded will 242
show a more smoothly peaked distribution of the allele length frequencies. Considering a 243
single-step mutation model (SMM) it is expected that all the alleles in the population that 244
descend from the single remaining copy will present increasingly low frequencies as they 245
differ from the ancestral size by more repeat units. The latter analysis is based on the 246
prediction that populations of constant size will present a great variance in the time of allele 247
bifurcation events from locus to locus. On the other hand, populations under growth 248
conditions tend to have a similar time for bifurcation events across loci. Thus, the test 249
compares the variance among loci of the variance in allele length distribution, relative to 250
values estimated for a constant size population. A low ratio between the first and the second 251
terms indicates population growth. Critical values of statistical significance for α = 0.05 based 252
on simulations were drawn from Reich et al. (1999). 253
Bottleneck tests were conducted using the program BOTTLENECK 1.2 (Piry et al. 254
1999), whose principle is the prediction that, after a severe reduction of population size, allele 255
number is reduced faster than heterozygosity. Thus, heterozygosity expected at mutation-drift 256
equilibrium (Heq) is calculated and compared with the expected heterozygosity (He) obtained 257
from the data. Three statistical tests are available to test whether or not there are more loci 258
than expected showing He > Heq. The program also supports calculation under three 259
microsatellite mutation models: infinite allele model (IAM), single-step mutation model 260
(SMM) and a settable intermediate two-phase model (TPM) (for a review see Estoup et al. 261
2002). All statistical tests were performed under all three mutation models, setting the TPM 262
12
for a small deviation from the SMM as suggested by the authors (variance: 12; SMM 263
proportion: 95%). 264
The effective population size (Ne) was estimated through the formula θ = 4Neµ, where 265
µ is the mutation rate per generation (Watterson 1975). Estimates of θ were performed in 266
ARLEQUIN 3.11 for microsatellite data under the SMM, as described by the program 267
authors. For µ, a range of 10-3 to 10-5 was utilized, once a high variation in mutation rate has 268
been reported to occur among loci in various species of animals (Goldstein & Schlötterer, 269
1999). 270
271
Results 272
Genetic diversity indices 273
Genotypes of 144 maned wolves were obtained for 14 loci. Minimum genotyping efficiency 274
for a single individual was nine loci (i.e. ~66%), and the mean proportion of individuals typed 275
across all loci was 86%. Identity tests showed that there were no two individuals with 276
matching genotypes at all loci. Estimated genetic diversity indices were notably high, with the 277
expected heterozygosity (He) ranging from 0.43 to 0.93 (mean 0.75) and the number of alleles 278
per locus ranging from three to 27 (mean 10.21). The overall P(ID), as expected for a highly 279
variable data set, was very low: 1.4-16. Per locus diversity indices, null allele frequency 280
estimates and P(ID) are shown in Table 2. The full genotype data set is available upon request. 281
Although all 14 loci were described for the domestic dog as tetranucleotide 282
microsatellites (Francisco et al. 1996), two of them (2137 and 2119) presented two base pair 283
variation between alleles in the maned wolf. Furthermore, they presented the highest levels of 284
diversity, which were also similar to each other. A possible explanation for this phenomenon 285
is a past insertion/deletion event of 2 base pairs (bp) in the flanking sequence or inside the 286
13
repetitive region. From this ancestral allele others could arise by simple microsatellite 287
mutation steps (i.e. insertion/deletion of whole repeat units). Once the primers utilized on this 288
study are originally designed for the domestic dog, whose lineage diverged from that of the 289
maned wolf ca. 10 million years ago (Wayne et al. 1997; Lindblad-Toh et al. 2005), it is not 290
difficult to imagine that such a situation could happen. The implications of this switch (from 291
tetranucleotide for dinucleotide) in these loci are negligible if the analysis considers data 292
qualitatively. However, analyses that make assumptions based on the mutational process or 293
uses the coalescent theory could be biased by the fact that these loci may deviate substantially 294
to any of the assumed mutational models. Therefore, markers 2137 and 2119 were not used in 295
some analyses. 296
297
Equilibrium tests 298
The first round of HWE and LE tests was performed with all individuals, i.e. not dividing 299
samples into pre-defined populations. Even so, no significant disequilibrium was verified in 300
any test after sequential Bonferroni corrections (α = 0.05) (Rice 1989). Therefore, no 301
subsequent equilibrium analyses were performed for each population separately, as would be 302
advisable if any disequilibrium had been observed. Null allele frequency estimates were close 303
to zero at most loci, with the exception of 2018, 2054, 2088 and 2100 (which had values 304
higher than 0.05). However, these values were still rather low, and the HWE inferred for these 305
loci also suggests that the existence of non-genotyped alleles is unlikely. 306
307
Population structure 308
Fst estimates among the four initial populations were very low, even in the cases where they 309
were statistically significant (Table 3). The highest observed Fst value was 0.025, between the 310

14
DF and NWSP populations. The pair SCNP-ENP presented an Fst of 0.01, while all other 311
pairwise values were not statistically different from zero. No Rst value was statistically 312
different from zero (see Table 3). 313
The best likelihood value for k (number of estimated populations) calculated with the 314
method implemented in STRUCTURE (Table 4) was 1 for both approaches – (i) considering 315
only the individuals from the four local populations and (ii) considering all individuals. 316
Furthermore, the lowest likelihood variance (which tends to be smaller for the best k) was also 317
observed when k = 1. A Mantel test performed with AIS resulted in a correlation between 318
genetic and geographic distances of 0.14. Although statistically significant, this value is quite 319
low, and suggests a weak influence of geographic distance on genetic structuring. 320
321
Demographic analyses 322
The shape of the allele frequency distributions at all loci indicated a general trend for a 323
unimodal pattern, except for some deviations at loci 2140, 2158 and 2100. For loci 2140 and 324
2158 the shapes fit a multimodal distribution. For marker 2100, one allele (177-bp) had a 325
frequency that was higher than expected for a unimodal distribution. However, the shape did 326
not seem to fit a bimodal distribution either. An unknown molecular mechanism may be 327
biasing the mutational events at this locus, generating a tendency to generate the 177-bp allele 328
and thus increasing its frequency. The value found for the g-test of Reich & Goldstein (1998) 329
was 0.1601. Following the table of cutoff values given in Reich et al. (1999) for p = 0.05 this 330
result is statistically significant (i.e. lower than 0.19, which is the critical value for 12 loci and 331
a sample size of 80-160 individuals). 332
The BOTTLENECK results for the three types of statistical significance analysis were 333
congruent for the three mutation models. Under IAM, all tests pointed to a bottleneck event. 334
15
Under the SMM and TPM, no bottleneck was supported. As IAM and SSM are extreme 335
models, only the TPM results were considered. P values were 0.41 for the Sign Test, 0.34 for 336
the Standardized Differences Test and 0.25 for the Wilcoxon Test. 337
The value of θH as calculated by ARLEQUIN was 1.97 when averaged across all 12 338
loci used for this analysis. As a range of mutation rates was utilized, the resulting estimates of 339
Ne also ranged widely, from 492 to 49,250. However, considering the most utilized rate 340
among mammals, of ca. 10-4 (Paetkau et al. 1998; Rooney et al. 1999; Abdelkrim et al. 2005), 341
we estimated an Ne of 4,925 for this species. 342
343
Discussion 344
Microsatellite diversity and population history 345
The maned wolf presented very high genetic diversity at microsatellite markers based on a 346
broad sampling of its geographic distribution. This result is quite remarkable when contrasted 347
to the finding that this species exhibits extremely low diversity at the mtDNA and nuclear 348
introns, indicating the occurrence of a past bottleneck event in this species that drove its 349
genetic variability to near zero (P. Prates et al., in preparation). Observed and estimated levels 350
of heterozygosity are similar to or higher than those recorded for other canids, even when 351
compared to species or populations for which no recent drastic demographic changes have 352
been reported (Girman et al. 2001; Klukowska et al. 2003; for a review see Wayne et al. 353
2004). This result is in agreement with previous genetic assessments of the maned wolf (Lion 354
2007; Salim et al. 2007), which have also reported microsatellite diversity levels that are 355
comparable to those observed in other canids. Therefore, it can be assumed that this species 356
recovered normal levels of microsatellite diversity in a rather short period of time, an 357
inference that is similar to that reported for cheetahs (Driscoll et al. 2002). 358
16
The present results of maned wolf heterozygosity levels are in total agreement with 359
our previous assessment (Fontoura-Rodrigues et al. 2008), which employed only nine loci and 360
20 individuals from a single population. The mean heterozygosity found in that study (0.729) 361
is almost the same as our present estimate for the same nine loci (0.723), now genotyped for 362
144 individuals, and still very close of our overall mean (0.75). These very similar values 363
indicate that (i) sampling a single population in our previous study yielded diversity estimates 364
that mirror those of the species as a whole, illustrating the effect of a virtual absence of 365
population structure; and (ii) the nine loci selected in our previous study as standardized 366
markers for Neotropical canids did capture a similar amount of genetic information as this 367
larger data set, highlighting their potential for future comparative assessments in multiple 368
species. If this observation is upheld by additional scrutiny, it will be interesting to further 369
investigate the rather high diversity levels that were also observed in that study for two other 370
species of Neotropical canids (Lycalopex gymnocercus and L. vetulus; mean He of 0.79 and 371
0.81, respectively). 372
The high variability observed in maned wolves is not only a good indicator of genetic 373
health, but also suggests a post-bottleneck population expansion, followed by the maintenance 374
of a large population size since then. The significant result of the g-test provides statistical 375
support for this expansion hypothesis, a scenario that is also compatible with the general trend 376
presented by the allele frequency distribution graphs (Fig. 2). Nine out of 12 graphs show an 377
unequivocal unimodal shape, which has been suggested to be a signal of population expansion 378
(Reich & Goldstein 1998). Even in the loci that did not present such a clear shape, either (i) a 379
trend suggestive of it could be discerned, or (ii) few peaks were present, which is still 380
compatible with a scenario of population bottleneck and expansion where a few ancestral 381
alleles survived. No bottleneck was identified here, indicating that the demographic reduction 382

17
prior to the inferred expansion could not be detected with microsatellites, implying that this 383
signal has been ‘erased’ by the subsequent population growth. Also, it indicates that since this 384
recent episode of population growth the number of individuals has remained fairly large, with 385
no evidence of further dramatic reductions. Maintenance of large historical population size is 386
also supported by the estimated values of Ne. Even the lowest estimate (492) corresponds to a 387
relatively large effective size, approaching the critical long-term Ne of 500-5,000 suggested 388
by Franklin & Frankham (1998) to be desirable for maintaining the evolutionary potential of 389
populations. Assuming the microsatellite mutation rate most commonly utilized for mammals, 390
and consequently estimating an Ne of ca. 5,000 individuals, it can be concluded that the 391
effective population size of the maned wolf may be appreciable large, even when compared to 392
the estimated current census size (Nc) of the species (20,000 – 30,000), given that Ne/Nc ratios 393
are usually low in animals (Frankham et al. 2002). This relatively high Ne/Nc ratio may be 394
due to the maintenance in the last few thousand years of a rather large, almost panmictic 395
population (see below) over a broad area, and also to recent human-induced reductions in the 396
census size, which likely have not yet had any effect on the effective size. 397
398
Population structure 399
Population structure analyses are all consistent with a scenario of no geographic partitions or 400
population fragmentation due to old or recent barriers. Our genotypic data set is in HW and 401
linkage equilibrium, which not only shows that it can be utilized as a single unit for all 402
analyses, but also indicates a lack of detectable population divisions. If that was not the case, 403
probably some degree of HW disequilibrium due to the Wahlund effect would have been 404
observed (Hartl & Clark 1997). The Bayesian algorithm implemented in STRUCTURE, 405
which is based on the attempt to minimize HW and linkage disequilibrium by subdividing 406
18
populations, also indicated that a single demographic unit was the best-fitting scenario for our 407
data set. 408
Furthermore, pairwise Fst and Rst estimates for local populations were also concordant 409
with the inference of high levels of gene flow among them (see Table 3). No Rst value was 410
statistically significant, which was also the case for four out of six for Fst estimates. The only 411
two significant Fst values were 2% for DF vs. NWSP, and 1% for ENP vs. SCNP. Although 412
significantly different from zero, these are very low values, with probably little biological 413
significance. It may also be noted that at least two of these four populations (ENP and SCNP) 414
were intensively sampled during a narrow window of time (no more than five years) and on a 415
limited geographic scale. So, it is possible that some of the sampled individuals are related to 416
each other, which might lead to a decrease in within-population diversity relative to random 417
expectations. Even so, there was no sign of restriction of gene flow between populations that 418
are on average 550 km distant from each other (ranging from 250 km [NWSP-SCNP] to 685 419
km [ENP-SCNP]). 420
Finally, the Mantel test also corroborated this general picture. The correlation between 421
geographic and genetic distances of ca. 14% indicates that there is a pattern of isolation by 422
distance in this species, but that even this effect is rather weak in terms of generating 423
population differentiation. 424
Based on these convergent results, we hypothesize a scenario in which maned wolves 425
behave as an almost panmictic population throughout most of its distribution. However, some 426
areas near the edge of the species’ distribution have not been sampled, and others (such as 427
Argentina) were represented by few individuals. Thus it can not be definitively stated that 428
there are no geographic partitions at any point of the maned wolf range until populations can 429
be sampled throughout its entire distribution. Nevertheless, it may be concluded that the lack 430
19
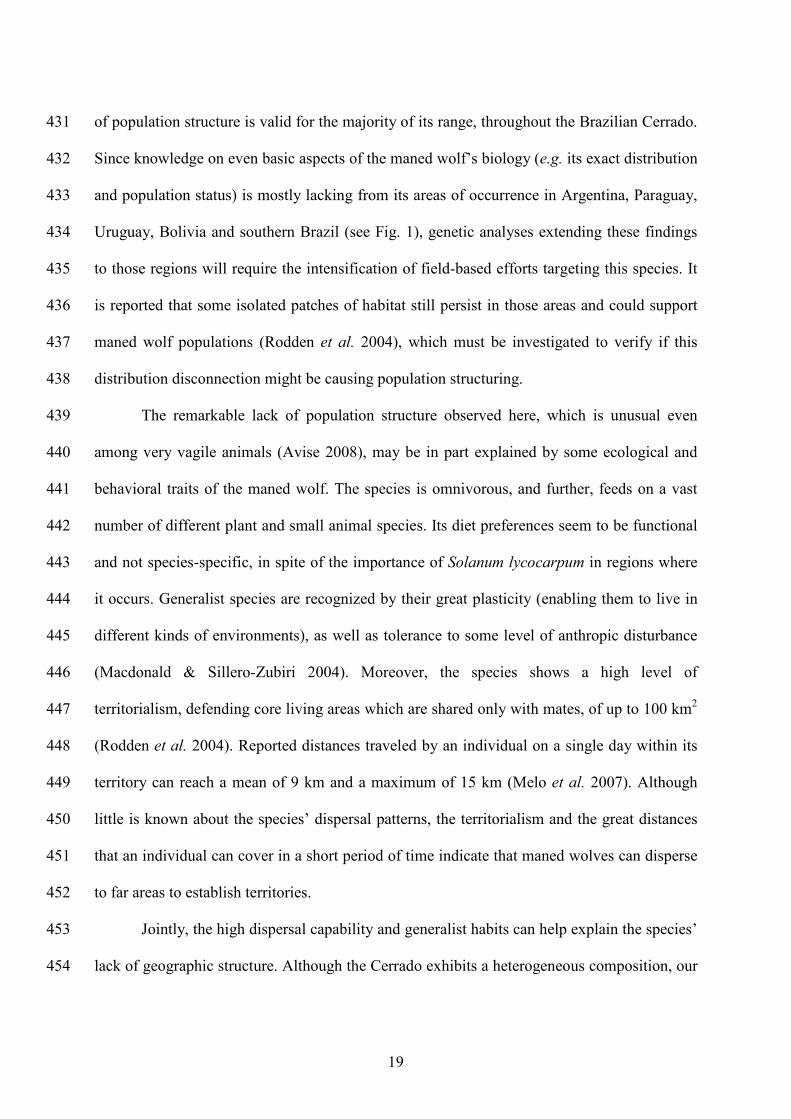
of population structure is valid for the majority of its range, throughout the Brazilian Cerrado. 431
Since knowledge on even basic aspects of the maned wolf’s biology (e.g. its exact distribution 432
and population status) is mostly lacking from its areas of occurrence in Argentina, Paraguay, 433
Uruguay, Bolivia and southern Brazil (see Fig. 1), genetic analyses extending these findings 434
to those regions will require the intensification of field-based efforts targeting this species. It 435
is reported that some isolated patches of habitat still persist in those areas and could support 436
maned wolf populations (Rodden et al. 2004), which must be investigated to verify if this 437
distribution disconnection might be causing population structuring. 438
The remarkable lack of population structure observed here, which is unusual even 439
among very vagile animals (Avise 2008), may be in part explained by some ecological and 440
behavioral traits of the maned wolf. The species is omnivorous, and further, feeds on a vast 441
number of different plant and small animal species. Its diet preferences seem to be functional 442
and not species-specific, in spite of the importance of Solanum lycocarpum in regions where 443
it occurs. Generalist species are recognized by their great plasticity (enabling them to live in 444
different kinds of environments), as well as tolerance to some level of anthropic disturbance 445
(Macdonald & Sillero-Zubiri 2004). Moreover, the species shows a high level of 446
territorialism, defending core living areas which are shared only with mates, of up to 100 km2 447
(Rodden et al. 2004). Reported distances traveled by an individual on a single day within its 448
territory can reach a mean of 9 km and a maximum of 15 km (Melo et al. 2007). Although 449
little is known about the species’ dispersal patterns, the territorialism and the great distances 450
that an individual can cover in a short period of time indicate that maned wolves can disperse 451
to far areas to establish territories. 452
Jointly, the high dispersal capability and generalist habits can help explain the species’ 453
lack of geographic structure. Although the Cerrado exhibits a heterogeneous composition, our 454
20
data suggest that it represents a homogeneous environment for the maned wolf, whose 455
patterns of habitat use may imply continuous connectivity among distant areas. Indeed, the 456
species can occupy environments as diverse as tall grasslands, shrub habitats, woodland with 457
open canopy and damp fields (Rodden et al. 2004), all of which are typical and well-delimited 458
formations within the Cerrado (Silva & Bates 2005). In addition, recent reports of maned wolf 459
sightings or captures include disturbed areas formerly covered by dense Amazonian or 460
Atlantic rainforest (Paula et al. 2007; this study); moreover, individuals have been seen 461
hunting and resting on lands under cultivation for agriculture and pasture (Rodden et al. 462
2004). This set of observations reinforces the view that the maned wolf’s habitat requirements 463
are quite flexible, allowing it to cross or even stably occupy a broad range of vegetational 464
landscapes. 465
466
Conclusions and implications for conservation 467
The maned wolf has a complex and not fully understood evolutionary history. Recent 468
molecular phylogenies of the family Canidae are all concordant in strongly placing 469
Chrysocyon brachyurus as the sister-species of the bush dog (Speothos venaticus) (Zrzavy & 470
Ricankova 2004; Bardeleben et al. 2005; Lindblad-Toh et al. 2005). This is a remarkable 471
finding point, since these species are very different regarding morphological, ecological and 472
behavioral traits. The bush dog is small, communal and lives mostly in forested areas 473
(Zuercher et al. 2004), while the maned wolf has a large size, solitary habits and occupies 474
open environments (Dietz 1984). The exact time and conditions that led their lineages to split, 475
as well as the evolutionary forces that drove these species to achieve such distinct 476
ecomorphological states, are interesting questions that remain to be answered. 477
21
The demographic history of the maned wolf subsequent to its divergence from the 478
bush dog is also quite unique. Current mtDNA and nuclear sequence data indicate that species 479
has recently expanded subsequent to being almost devoid of any sequence variation. Further 480
work is required to verify if an extreme population bottleneck in the Late Pleistocene is the 481
most likely explanation for this lack of variation at those markers. Although both mtDNA and 482
microsatellite markers bear evidence of a recent population expansion, the exact time and 483
magnitude of this demographic process should be further refined, allowing better inferences 484
on the underlying processes and their genetic consequences. 485
With respect to the current structure of maned wolf populations, our findings indicate 486
that this species is almost panmictic, with no significant geographic subdivisions. If this 487
observation is affirmed by the analysis of additional genomic loci, it may simplify the design 488
of conservation plans for this species, as it may represent a single management unit from a 489
genetic standpoint. Still, the possibility that local adaptation to specific environments affects 490
some genomic loci in this species should be considered, so that artificial translocations of 491
individuals across large areas should be discouraged. Nevertheless, given the species lack of 492
population structure and inferred ability to efficiently traverse varied types of habitat 493
matrices, our data provide an optimistic perspective for the long-term persistence of the 494
species in the Cerrado, in spite of current levels of anthropogenic disturbance. However, it is 495
probable that maned wolf individuals would not tolerate indefinite levels of habitat alteration 496
and isolation of preserved patches due to its close association to animal and plant species of 497
the original Cerrado, so that eventually the process of fragmentation should become an 498
important threat for the species. Even if this detrimental process is already ongoing, the 499
reduction of gene flow due to habitat disconnection may be such a recent process that it may 500
not yet be detectable, especially given the rather large Ne estimated for the species. As a large 501
22
Ne reduces the intensity of genetic drift, analyses that are based on the time-dependent 502
differentiation of allele frequencies and composition between isolated populations (such as 503
Fst) lose detection power, and might be not able to demonstrate the isolation even if the it is 504
actually ongoing. Although also recent, the human-induced fragmentation of the Atlantic 505
Forest is already resulting on drastic isolation of jaguar (Panthera onca) populations (Haag et 506
al., in preparation), a process that is likely accelerated by the small size of remnant 507
populations and thus higher levels of genetic drift. The same process may be starting for 508
maned wolves, although their more generalist habits would make them less vulnerable to 509
complete isolation by an anthropogenic matrix, but still susceptible depending on the degree 510
of disturbance. Further studies are needed to better understand the maned wolf evolutionary 511
and natural history, and to monitor current gene flow across its distribution. In this sense, the 512
data collected in this study can serve as a baseline framework allowing future assessments of 513
spatial differentiation in the face of continuing habitat loss and fragmentation, so as to 514
monitor their effects on the structure and long-term viability of maned wolf populations. 515
516
Acknowledgements 517
We would like to thank all the people and institutions listed in Table 1, especially Flávio H. 518
G. Rodrigues, Rogério C. de Paula, Paulo Prates Jr., Marília B. Lion, Rodrigo Jorge, Joares 519
May Jr., Jean Pierre, Cristiana Prada, Paulo Sérgio R. de Mattos, Dênis Sana, Tathiana 520
Bagatini, Mauro Almeida, Nazaré Klautau, Leandro Silveira, Anah Jácomo, Frederico G. 521
Lemos, Museu Nacional (Brazil), UFES DNA Collection and Instituto Pró-Carnívoros for 522
providing biological samples. We are also grateful to Cladinara Roberts Sarturi, Sandro L. 523
Bonatto, Ricardo Kanitz and Nelson Fagundes for assisting with study design and 524
23
implementation. We especially thank Felipe Grazziotin for assistance with some aspects of 525
data analysis and relevant discussions. 526
527
References 528
Abdelkrim J, Pascal M, Samadi S (2005) Island colonization and founder effects: the invasion 529
of the Guadeloupe islands by ship rats (Rattus rattus). Molecular Ecology, 14, 2923-2931. 530
Avise JC (2008) Phylogeography: retrospect and prospect. Journal of Biogeography, 36, 3-531
15. 532
Bardeleben C, Moore RL, Wayne RK (2005) A molecular phylogeny of the Canidae based on 533
six nuclear loci. Molecular Phylogenetics and Evolution, 37, 815-831. 534
Boutin-Ganache I, Raposo M, Raymond M, Deschepper, CF (2001) M13-tailed primers 535
improve the readability and usability of microsatellite analyses performed with two 536
different allele-sizing methods. Biotechniques, 31, 24-28. 537
Dietz JM (1984) Ecology and social organization of the maned wolf (Chrysocyon 538
brachyurus). Smithsonian Contributions to Zoology, 392, 1-51. 539
Dietz JM (1985) Chrysocyon brachyurus. Mammalian Species, 234, 1-4. 540
Driscoll CA, Menotti-Raymond M, Nelson G, Goldstein D, O’Brien SJ (2002) Genomic 541
microsatellites as evolutionary chronometers: a test in wild cats. Genome Research, 12, 542
414-423. 543
Ellegren H (2004) Microsatellite: simple sequences with complex evolution. Nature Reviews 544
Genetics, 5, 435-445. 545
Estoup A, Jarne P, Cornuet JM (2002) Homoplasy and mutation model at microsatellite loci 546
and their consequences for population genetics analysis. Molecular Ecology, 11, 1591-547
1604. 548
24
Excoffier L, Laval G, Schneider S (2005) Arlequin ver. 3.0: An integrated software package 549
for population genetics data analysis. Evolutionary Bioinformatics Online, 1, 47-50. 550
Fontoura-Rodrigues ML, Lima-Rosa CAV, Tchaicka L et al. (2008) Cross-amplification and 551
characterization of 13 tetranucleotide microsatellites in multiple species of Neotropical 552
canids. Molecular Ecology Resources, 8, 898–900. 553
Francisco LV, Langston AA, Mellersh CS, Neal CL, Ostrander EA (1996) A class of highly 554
polymorphic tetranucleotide repeats for canine genetic mapping. Mammalian Genome, 7, 555
359–362. 556
Frankham R, Ballou JD, Briscoe D (2002) Introduction to Conservation Genetics. Cambridge 557
University Press, Cambridge. 558
Franklin IR, Frankham R (1998) How large must populations be to retain evolutionary 559
potencial? Animal Conservation, 1, 69-73. 560
Girman DJ, Vilà C, Geffen E et al. (2001) Patterns of population subdivision, gene flow and 561
genetic variability in the African wild dog (Lycaon pictus). Molecular Ecology, 10, 1703-562
1723. 563
Goldstein DB, Schlötterer C (1999) Microsatellites – Evolution and Applications. Oxford 564
University Press, New York. 565
Guo S, Thompson E (1992) Performing the exact test of Hardy-Weinberg proportion for 566
multiple alleles. Biometrics, 48, 361-372. 567
Hartl D, Clark AG (1997) Principles of Population Genetics, 3rd edn. Sinauer Associates, 568
Sunderland, MA. 569
Jácomo ATA, Silveira L, Diniz-Filho AF (2004) Niche separation between the maned wolf 570
(Chrysocyon brachyurus), the crab-eating fox (Dusicyon thous) and the hoary fox 571
(Dusicyon vetulus) in central Brazil. Journal of Zoology, 262, 99-106. 572
25
Juarez KM, Marinho-Filho J (2002) Diet, habitat use, and home ranges of sympatric canids in 573
central Brazil. Journal of Mammalogy, 83, 925-933. 574
Klink CA, Machado RB (2005) Conservation of the Brazilian Cerrado. Conservation Biology, 575
19, 707-713. 576
Klukowsca J, Strabel T, Mackowski M, Switonski M (2003) Microsatellite polymorphism and 577
genetic distances between the dog, red fox and arctic fox. Journal of Animal Breeding and 578
Genetics, 120, 88-94. 579
Lindblad-Toh K, Wade CM, Mikkelsen TS et al. (2005) Genome sequence, comparative 580
analysis and haplotypes structure of the domestic dog. Nature, 438, 803–819. 581
Lion MB (2007) Diversidade genética e conservação do lobo-guará, Chrysocyon brachyurus 582
em áreas protegidas do Distrito Federal. Msc. Dissertation. Universidade de Brasília, 583
Brazil. 584
Lynch M, Lande R (1998) The critical effective size for a genetically secure population. 585
Animal Conservation, 1, 69-73. 586
Macdonald DW, Sillero-Zubiri C (2004) Dramatis Personae. In: The Biology and 587
Conservation of Wild Canids (ed. Macdonald DW, Sillero-Zubiri C), pp. 3-36. Oxford 588
University Press, New York. 589
Machado RB, Ramos Neto MB, Pereira PGP et al. (2004) Estimativas de perda da área do 590
Cerrado brasileiro. Conservation International do Brasil, Brasília. 591
Mantel N (1967) The detection of disease clustering and a generalized regression approach. 592
Cancer Research, 27, 209-220. 593
Marshall TC, Slate J, Kruuk LEB, Pemberton JM (1998) Statistical confidence for likelihood-594
based paternity inference in natural populations. Molecular Ecology, 7, 639-655. 595
Melo LFB, Sábato MAL, Magni EMV, Young RJ, Coelho CM (2006) Secret lives of maned 596
26
wolves (Chrysocyon brachyurus Illiger 1815): as revealed by GPS tracking collars. 597
Journal of Zoology, 271, 27-36. 598
Miller MP (2005) Alleles In Space: Computer software for the joint analysis of 599
interindividual spatial and genetic information. Journal of Heredity, 96, 722-724. 600
Myers N, Mittermeier RA, Mittermeier CG, Fonseca GAB, Kent J (2000) Biodiversity 601
hotspots for conservation priorities. Nature, 403, 853-858. 602
Paetkau D, Waits LP, Clarkson PL et al. (1998) Variation in genetic diversity across the range 603
of North American Brown Bears. Conservation Biology, 12, 418-429. 604
Page RDM, Holmes E (1998) Molecular Evolution – A Phylogenetic Approach. Blackwell 605
Science, Cambridge. 606
Paula RC, Medici P, Morato RG (2007). Plano de Ação para Conservação do Lobo-Guará – 607
Análise de Viabilidade Populacional e de Hábitat (PHVA). Ministério do Meio Ambiente, 608
Brasília, Brazil. 609
Piry S, Luikart G, Cornuet J-M (1999) Statistical properties of two tests that use multilocus 610
data sets to detect population expansions. Journal of Heredity, 90, 502-503. 611
Pritchard JK, Stephens M, Donnely P (2000) Inference of a population structure using 612
multilocus genotype data. Genetics, 155, 945-959. 613
Raymond M, Rousset F (1995) GENEPOP (version 1.2): population genetics software for 614
exact tests and ecumenicism. Journal of Heredity, 86, 248-249. 615
Reich DE, Goldstein DB (1998) Genetic evidence for a Paleolithic human population 616
expansion in Africa. Proceedings of the National Academy of Sciences of the USA, 95, 617
8119-8123. 618
27
Reich DE, Feldman MW, Goldstein DB (1999) Statistical properties of two tests that use 619
multilocus data sets to detect population expansions. Molecular Biology and Evolution, 620
16, 453-466. 621
Reynolds J, Weir BS, Cockerham CC (1983) Estimation for the coancestry coefficient: basis 622
for a short-term genetic distance. Genetics, 105, 767-779. 623
Rice WR (1989) Analyzing tables of statistical tests. Evolution, 43, 223-225. 624
Rodden M, Rodrigues FHG, Bestelmeyer S (2004) Chrysocyon brachyurus (Illiger, 1815) – 625
Maned wolf. In: Canids: Foxes, Wolves, Jackals and Dogs. Status Survey and 626
Conservation Action Plan (ed. Sillero-Zubiri C, Hoffmann M, Macdonald DW), pp. 38-627
43. Oxford University Press, New York. 628
Rooney AP, Honeycutt RL, Davis SK, Derr JN (1999) Evaluating a putative bottleneck in a 629
population of Bowhead Whales from patterns of microsatellite diversity and genetic 630
disequilibria. Journal of Molecular Evolution, 49, 682-690. 631
Salim DC, Akimoto AA, Carvalho et al. (2007) Genetic variability in maned wolf based on 632
heterologous short-tandem repeat markers from domestic dog. Genetics and Molecular 633
Research, 6, 248-257. 634
Sambrook J, Russel DW (2001) Molecular Cloning: A Laboratory Manual, 3rd edn. Cold 635
Spring Harbor Laboratory Press, New York. 636
Santos EF, Setz EZF, Gobbi N (2003) Diet of the maned wolf (Chrysocyon brachyurus) and 637
its role in seed dispersal on a cattle ranch in Brazil. Journal of Zoology, 260, 203-208. 638
Silva JMC, Bates JM (2005) Biogeographic patterns and conservation in the South American 639
Cerrado: a tropical savanna hotspot. Bioscience, 52, 225-233. 640
Simberloff D (1998) Flagships, umbrellas, and keystones: Is single-species management passé 641
in the landscape era? Biological Conservation, 83, 247-257. 642
28
Slatkin M (1995) A measure of population subdivision based on microsatellite allele 643
frequencies. Genetics, 139, 457-462. 644
Waits LP, Luikart G, Taberlet P (2001) Estimating the probability of identity among 645
genotypes in natural populations: cautions and guidelines. Molecular Ecology, 10, 249-646
256. 647
Watterson GA (1975) On the number of segregating sites in genetical models without 648
recombination. Theoretical Population Biology, 7, 256-276. 649
Wayne RK, Geffen E, Girman DJ, Koepfli KP, Lau LM, Marshall CR (1997) Molecular 650
systematics of the Canidae. Systematic Biology, 46, 622-653. 651
Wayne RK, Geffen E, Vilà C (2004) Population genetics. In: The Biology and Conservation 652
of Wild Canids (ed. Macdonald DW, Sillero-Zubiri C), pp. 55-84. Oxford University 653
Press, New York. 654
Zrzavy J, Ricancova V (2004) Phylogeny of recent Canidae (Mammalia, Carnivora): relative 655
reliability and utility of morphological and molecular datasets. Zoologica Scripta, 33, 311-656
333. 657
Zuercher GL, Swarner M, Silveira L, Carrillo O (2004) Speothos venaticus (Lund, 1842) – 658
Bush dog. In: Canids: Foxes, Wolves, Jackals and Dogs. Status Survey and Conservation 659
Action Plan (ed. Sillero-Zubiri C, Hoffmann M, Macdonald DW), pp. 76-80. Oxford 660
University Press, New York. 661
29
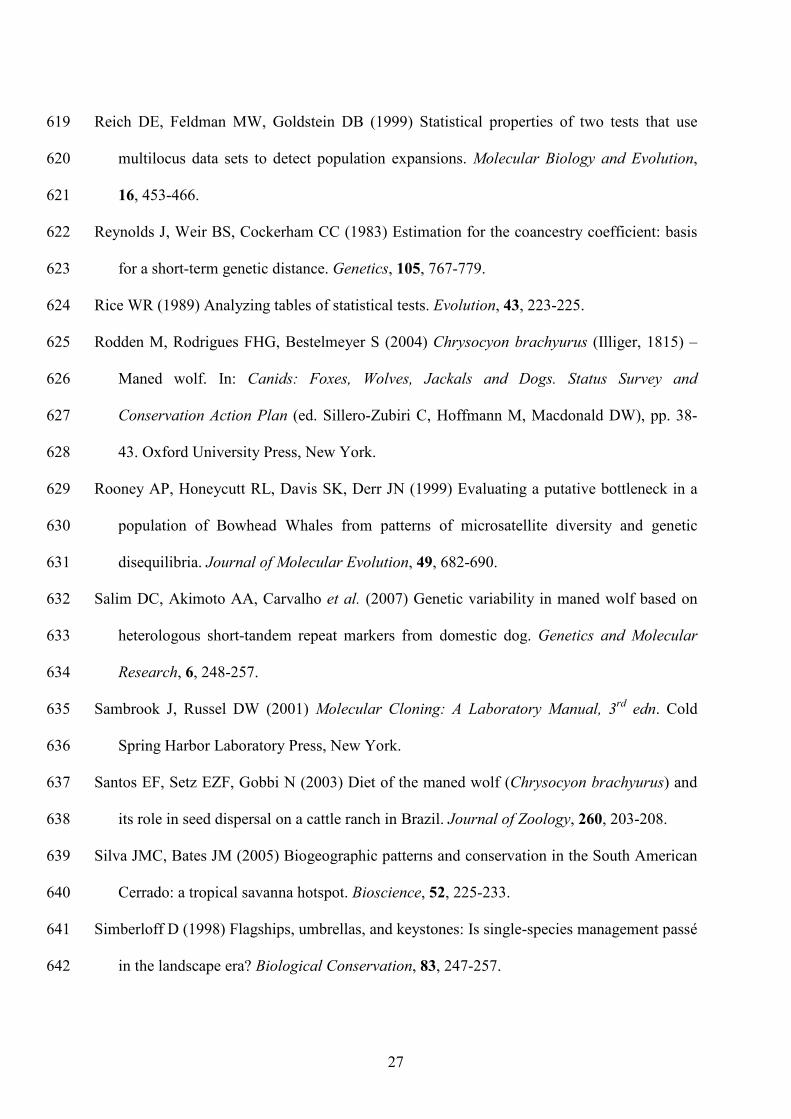
Figure 1. Geographic distribution of the maned wolf (in dark green) (Rodden et al. 2004) overlaid on that of the Cerrado biome (in white) (Silva & Bates 2005). The light green areas indicate the overlapping portions of both distributions. Red circles indicate individual collection points. Yellow circles indicate the four local populations analyzed in this study.
30
Figure 2. Distribution of allele frequencies for each microsatellite locus. Numbers defining the X-axis categories represent the PCR product size (in base pairs) for each allele.
2001
0
0,2
0,4
0,6
0,8
152 156 160
2004
0
0,1
0,2
0,3
0,4
0,5
256 260 264 268 272 276
2010
0
0,1
0,2
0,3
0,4
0,5
241 245 249 253 257 261
2054
0
0,1
0,2
0,3
0,4
151 155 159 163 167 171 175
2088
0
0,1
0,2
0,3
0,4
0,5
0,6
112 116 120 124
2132
0
0,05
0,1
0,15
0,2
0,25
160 164 168 172 176 180 184 188 192
2140
0
0,05
0,1
0,15
0,2
0,25
0,3
138 142 146 150 154 158 162 166 178 182 186 190
2018
0
0,1
0,2
0,3
0,4
0,5
157 169 173 177 181 185 189 197
2158
0
0,05
0,1
0,15
0,2
0,25
168 180 188 196 204 212 232 240
2100
0
0,1
0,2
0,3
0,4
0,5
177 181 185 189 193
2107
0
0,05
0,1
0,15
0,2
0,25
0,3
0,35
328 332 336 340 344 348 352 356
2087a
0
0,1
0,2
0,3
0,4
0,5
0,6
254 258 262 266 270 274 278
31
Table 1. Individual ID, geographic origin, local population (when applicable), collector/contact information and sampling strategy for each of the samples analyzed in this study.
ID Geographic Origin Population Institution/Collector/Contact Sampling Strategy
bCbr-004 Mato Grosso State, C Brazil --- Pró-Carnívoros wild-caught
bCbr-005 Mato Grosso State, C Brazil --- Pró-Carnívoros wild-caught
bCbr-006 Mato Grosso State, C Brazil --- Pró-Carnívoros wild-caught
bCbr-008 Minas Gerais State, SE Brazil --- Joares May Jr road-killed
bCbr-009 Distrito Federal State, C Brazil DF Pró-Carnívoros road-killed
bCbr-010 Mato Grosso do Sul State, C Brazil --- Dênis Sana road-killed
bCbr-011 Mato Grosso do Sul State, C Brazil --- UFES road-killed
bCbr-012 Minas Gerais State, SE Brazil --- Frederico Gemesio Lemos road-killed
bCbr-014 São Paulo State, SE Brazil NWSP Paulo Sérgio Ribeiro de Mattos wild-caught
bCbr-015 São Paulo State, SE Brazil NWSP Paulo Sérgio Ribeiro de Mattos wild-caught
bCbr-016 São Paulo State, SE Brazil NWSP Paulo Sérgio Ribeiro de Mattos wild-caught
bCbr-017 São Paulo State, SE Brazil NWSP Paulo Sérgio Ribeiro de Mattos wild-caught
bCbr-018 São Paulo State, SE Brazil NWSP Paulo Sérgio Ribeiro de Mattos wild-caught
bCbr-019 São Paulo State, SE Brazil NWSP Paulo Sérgio Ribeiro de Mattos wild-caught
bCbr-021 São Paulo State, SE Brazil NWSP Paulo Sérgio Ribeiro de Mattos wild-caught
bCbr-022 São Paulo State, SE Brazil NWSP Paulo Sérgio Ribeiro de Mattos wild-caught
bCbr-023 São Paulo State, SE Brazil NWSP Paulo Sérgio Ribeiro de Mattos wild-caught
bCbr-024 São Paulo State, SE Brazil NWSP Paulo Sérgio Ribeiro de Mattos wild-caught
bCbr-025 São Paulo State, SE Brazil NWSP Paulo Sérgio Ribeiro de Mattos wild-caught
bCbr-026 São Paulo State, SE Brazil NWSP Paulo Sérgio Ribeiro de Mattos wild-caught
bCbr-029 São Paulo State, SE Brazil NWSP Paulo Sérgio Ribeiro de Mattos wild-caught
bCbr-030 São Paulo State, SE Brazil NWSP Paulo Sérgio Ribeiro de Mattos wild-caught
bCbr-031 São Paulo State, SE Brazil NWSP Paulo Sérgio Ribeiro de Mattos wild-caught
bCbr-032 São Paulo State, SE Brazil NWSP Paulo Sérgio Ribeiro de Mattos wild-caught
bCbr-033 São Paulo State, SE Brazil NWSP Paulo Sérgio Ribeiro de Mattos wild-caught
bCbr-034 São Paulo State, SE Brazil NWSP Paulo Sérgio Ribeiro de Mattos wild-caught
bCbr-036 São Paulo State, SE Brazil NWSP Paulo Sérgio Ribeiro de Mattos wild-caught
bCbr-037 São Paulo State, SE Brazil NWSP Paulo Sérgio Ribeiro de Mattos wild-caught
bCbr-038 São Paulo State, SE Brazil NWSP Paulo Sérgio Ribeiro de Mattos wild-caught
bCbr-039 São Paulo State, SE Brazil NWSP Paulo Sérgio Ribeiro de Mattos wild-caught
bCbr-040 São Paulo State, SE Brazil NWSP Paulo Sérgio Ribeiro de Mattos wild-caught
bCbr-041 Rio de Janeiro State, SE Brazil --- Museu Nacional ?
bCbr-301 Minas Gerais State, SE Brazil SCNP Pró-Carnívoros wild-caught
bCbr-302 Minas Gerais State, SE Brazil SCNP Pró-Carnívoros wild-caught
bCbr-303 Minas Gerais State, SE Brazil SCNP Pró-Carnívoros wild-caught
bCbr-304 Minas Gerais State, SE Brazil SCNP Pró-Carnívoros wild-caught
bCbr-305 Minas Gerais State, SE Brazil SCNP Pró-Carnívoros wild-caught
bCbr-306 Minas Gerais State, SE Brazil SCNP Pró-Carnívoros wild-caught
bCbr-307 Minas Gerais State, SE Brazil SCNP Pró-Carnívoros wild-caught
bCbr-308 Minas Gerais State, SE Brazil SCNP Pró-Carnívoros wild-caught
bCbr-309 Minas Gerais State, SE Brazil SCNP Pró-Carnívoros wild-caught
bCbr-310 Minas Gerais State, SE Brazil SCNP Pró-Carnívoros wild-caught
bCbr-311 São Paulo State, SE Brazil --- Cristiana Prada road-killed
bCbr-312 São Paulo State, SE Brazil --- Cristiana Prada road-killed
bCbr-313 São Paulo State, SE Brazil --- Cristiana Prada road-killed
bCbr-315 São Paulo State, SE Brazil --- Cristiana Prada road-killed
bCbr-317 São Paulo State, SE Brazil --- Cristiana Prada road-killed
bCbr-319 São Paulo State, SE Brazil --- Cristiana Prada road-killed
bCbr-320 São Paulo State, SE Brazil --- Cristiana Prada road-killed
bCbr-325 São Paulo State, SE Brazil --- Mauro Almeida wild-caught
bCbr-327 São Paulo State, SE Brazil --- Pró-Carnívoros wild-caught
bCbr-329 Goiás State, C Brazil ENP Leandro Silveira wild-caught
bCbr-330 Goiás State, C Brazil ENP Leandro Silveira wild-caught
bCbr-344 Goiás State, C Brazil ENP Leandro Silveira wild-caught
bCbr-345 Goiás State, C Brazil ENP Leandro Silveira wild-caught
bCbr-350 Goiás State, C Brazil ENP Leandro Silveira wild-caught
bCbr-364 São Paulo State, SE Brazil --- Rodrigo Jorge/Tathiana Bagatini road-killed
bCbr-366 Minas Gerais State, SE Brazil --- Joares May Jr/Jean Pierre road-killed
bCbr-370 Minas Gerais State, SE Brazil SCNP Pró-Carnívoros wild-caught
bCbr-371 Minas Gerais State, SE Brazil SCNP Pró-Carnívoros wild-caught
bCbr-372 Minas Gerais State, SE Brazil SCNP Pró-Carnívoros wild-caught
bCbr-373 Minas Gerais State, SE Brazil SCNP Pró-Carnívoros wild-caught
bCbr-374 Minas Gerais State, SE Brazil SCNP Pró-Carnívoros wild-caught
bCbr-375 Minas Gerais State, SE Brazil SCNP Pró-Carnívoros wild-caught
bCbr-376 Minas Gerais State, SE Brazil SCNP Pró-Carnívoros wild-caught
bCbr-377 Minas Gerais State, SE Brazil SCNP Pró-Carnívoros wild-caught
bCbr-378 Minas Gerais State, SE Brazil SCNP Pró-Carnívoros wild-caught
bCbr-379 Minas Gerais State, SE Brazil SCNP Pró-Carnívoros wild-caught
bCbr-380 Minas Gerais State, SE Brazil SCNP Pró-Carnívoros wild-caught
bCbr-381 Minas Gerais State, SE Brazil SCNP Pró-Carnívoros wild-caught
bCbr-382 Minas Gerais State, SE Brazil SCNP Pró-Carnívoros wild-caught
32
Table 1. Continued ID Geographic Origin Population Institution/Collector/Contact Sampling Strategy
bCbr-383 Minas Gerais State, SE Brazil SCNP Pró-Carnívoros wild-caught
bCbr-384 Minas Gerais State, SE Brazil SCNP Pró-Carnívoros wild-caught
bCbr-388 Minas Gerais State, SE Brazil SCNP Pró-Carnívoros wild-caught
bCbr-389 Minas Gerais State, SE Brazil SCNP Pró-Carnívoros wild-caught
bCbr-390 Minas Gerais State, SE Brazil SCNP Pró-Carnívoros wild-caught
bCbr-401 Minas Gerais State, SE Brazil SCNP Pró-Carnívoros wild-caught
bCbr-402 Minas Gerais State, SE Brazil SCNP Pró-Carnívoros wild-caught
bCbr-403 Minas Gerais State, SE Brazil SCNP Pró-Carnívoros wild-caught
bCbr-404 Minas Gerais State, SE Brazil SCNP Pró-Carnívoros wild-caught
bCbr-405 Minas Gerais State, SE Brazil SCNP Pró-Carnívoros wild-caught
bCbr-406 Minas Gerais State, SE Brazil SCNP Pró-Carnívoros wild-caught
bCbr-420 Minas Gerais State, SE Brazil --- Rogério Cunha de Paula wild-caught
bCbr-421 Minas Gerais State, SE Brazil --- Rogério Cunha de Paula wild-caught
bCbr-422 São Paulo State, SE Brazil --- Rodrigo Jorge/Tathiana Bagatini wild-caught
bCbr-425 Goiás State, C Brazil ENP Leandro Silveira/Anah Jácomo wild-caught
bCbr-426 Goiás State, C Brazil ENP Leandro Silveira/Anah Jácomo wild-caught
bCbr-427 Goiás State, C Brazil ENP Leandro Silveira/Anah Jácomo wild-caught
bCbr-428 Goiás State, C Brazil ENP Leandro Silveira/Anah Jácomo wild-caught
bCbr-429 Goiás State, C Brazil ENP Leandro Silveira/Anah Jácomo wild-caught
bCbr-451 Rio de Janeiro State, SE Brazil --- Rogério Cunha de Paula/Joares May Jr captive
bCbr-452 Rio de Janeiro State, SE Brazil --- Rogério Cunha de Paula/Joares May Jr captive
bCbr-455 Goiás State, C Brazil ENP Leandro Silveira/Anah Jácomo wild-caught
bCbr-456 Goiás State, C Brazil ENP Leandro Silveira/Anah Jácomo wild-caught
bCbr-457 Goiás State, C Brazil ENP Leandro Silveira/Anah Jácomo wild-caught
bCbr-458 Goiás State, C Brazil ENP Leandro Silveira/Anah Jácomo wild-caught
bCbr-459 Goiás State, C Brazil ENP Leandro Silveira/Anah Jácomo wild-caught
bCbr-460 Goiás State, C Brazil ENP Leandro Silveira/Anah Jácomo wild-caught
bCbr-461 Goiás State, C Brazil ENP Leandro Silveira/Anah Jácomo wild-caught
bCbr-462 Goiás State, C Brazil ENP Leandro Silveira/Anah Jácomo wild-caught
bCbr-463 Goiás State, C Brazil ENP Leandro Silveira/Anah Jácomo wild-caught
bCbr-464 Goiás State, C Brazil ENP Leandro Silveira/Anah Jácomo wild-caught
bCbr-465 Goiás State, C Brazil ENP Leandro Silveira/Anah Jácomo wild-caught
bCbr-466 Goiás State, C Brazil ENP Leandro Silveira/Anah Jácomo wild-caught
bCbr-467 Goiás State, C Brazil ENP Leandro Silveira/Anah Jácomo wild-caught
bCbr-468 Goiás State, C Brazil ENP Leandro Silveira/Anah Jácomo wild-caught
bCbr-469 Goiás State, C Brazil ENP Leandro Silveira/Anah Jácomo wild-caught
bCbr-470 Goiás State, C Brazil ENP Leandro Silveira/Anah Jácomo wild-caught
bCbr-471 Goiás State, C Brazil ENP Leandro Silveira/Anah Jácomo wild-caught
96/001 Minas Gerais State, SE Brazil --- Zoológico de Varginha captive
96/003 Minas Gerais State, SE Brazil --- Zoológico de Varginha captive
96/004 Minas Gerais State, SE Brazil --- Zoológico de Varginha captive
96/012 São Paulo State, SE Brazil --- Zoológico de Curitiba captive
96/014 Minas Gerais State, SE Brazil --- Zoológico de Curitiba captive
96/023 São Paulo State, SE Brazil --- Zoológico de Uberaba captive
96/025 Minas Gerais State, SE Brazil --- Zoológico de Uberaba captive
96/029 Minas Gerais State, SE Brazil --- Zoológico de Araxá captive
96/031 São Paulo State, SE Brazil --- Zoológico de Sorocaba captive
96/035 São Paulo State, SE Brazil --- Zoológico de Bauru captive
96/040 São Paulo State, SE Brazil --- Zoológico de Bauru captive
96/043 São Paulo State, SE Brazil --- Zoológico de Bauru captive
96/046 Goiás State, C Brazil DF Zoológico de Brasília captive
96/047 Goiás State, C Brazil --- Zoológico de Brasília captive
96/049 Distrito Federal State, C Brazil DF Zoológico de Brasília captive
96/051 Goiás State, C Brazil DF Zoológico de Brasília captive
96/052 Goiás State, C Brazil DF Zoológico de Brasília captive
LG-007 Minas Gerais State, SE Brazil --- Zoológico de Uberlândia captive
LG-009 Goiás State, C Brazil --- Zoológico de Goiânia captive
LG-028 Minas Gerais State, SE Brazil --- Zoológico de Belo Horizonte captive
LG-031 Minas Gerais State, SE Brazil --- Zoológico de Belo Horizonte captive
LG-032 Minas Gerais State, SE Brazil --- Zoológico de Curitiba captive
LG-033 São Paulo State, SE Brazil --- Zoológico de Curitiba captive
LG-034 São Paulo State, SE Brazil --- Zoológico de Curitiba captive
AE/LG-75 Distrito Federal State, C Brazil DF Flávio HG Rodrigues wild-caught
AE/LG-82 Distrito Federal State, C Brazil DF Flávio HG Rodrigues wild-caught
AE/LG-92 Distrito Federal State, C Brazil DF Flávio HG Rodrigues wild-caught
ESECAE-4 Distrito Federal State, C Brazil DF Marília Lion road-killed
ESECAE-7 Distrito Federal State, C Brazil DF Marília Lion road-killed
Colorado Distrito Federal State, C Brazil DF Marília Lion road-killed
Marília Distrito Federal State, C Brazil DF Marília Lion wild-caught
Flavão Distrito Federal State, C Brazil DF Marília Lion wild-caught
AR-1 Corrientes Province, NE Argentina --- Paulo Prates Jr ?
AR-2 Corrientes Province, NE Argentina --- Paulo Prates Jr ?
AR-7 Corrientes Province, NE Argentina --- Paulo Prates Jr ?
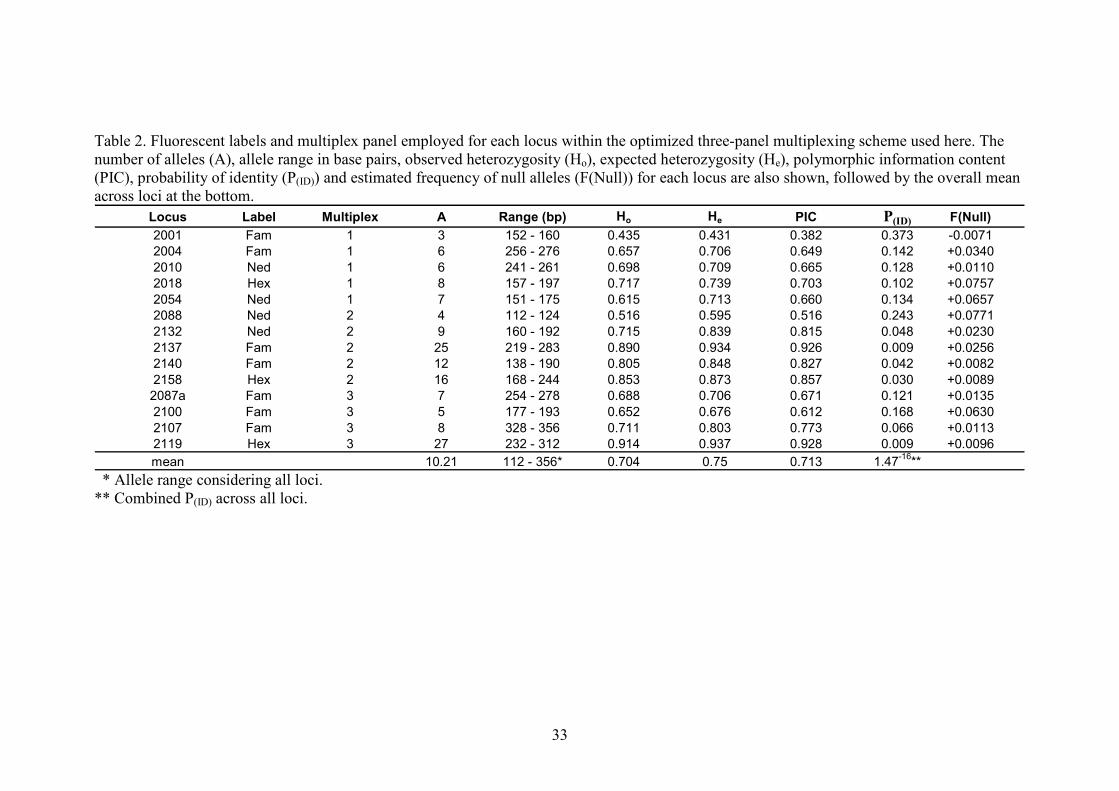
33
Table 2. Fluorescent labels and multiplex panel employed for each locus within the optimized three-panel multiplexing scheme used here. The number of alleles (A), allele range in base pairs, observed heterozygosity (Ho), expected heterozygosity (He), polymorphic information content (PIC), probability of identity (P(ID)) and estimated frequency of null alleles (F(Null)) for each locus are also shown, followed by the overall mean across loci at the bottom.
Locus Label Multiplex A Range (bp) Ho He PIC P(ID) F(Null)
2001 Fam 1 3 152 - 160 0.435 0.431 0.382 0.373 -0.0071
2004 Fam 1 6 256 - 276 0.657 0.706 0.649 0.142 +0.0340
2010 Ned 1 6 241 - 261 0.698 0.709 0.665 0.128 +0.0110
2018 Hex 1 8 157 - 197 0.717 0.739 0.703 0.102 +0.0757
2054 Ned 1 7 151 - 175 0.615 0.713 0.660 0.134 +0.0657
2088 Ned 2 4 112 - 124 0.516 0.595 0.516 0.243 +0.0771
2132 Ned 2 9 160 - 192 0.715 0.839 0.815 0.048 +0.0230
2137 Fam 2 25 219 - 283 0.890 0.934 0.926 0.009 +0.0256
2140 Fam 2 12 138 - 190 0.805 0.848 0.827 0.042 +0.0082
2158 Hex 2 16 168 - 244 0.853 0.873 0.857 0.030 +0.0089
2087a Fam 3 7 254 - 278 0.688 0.706 0.671 0.121 +0.0135
2100 Fam 3 5 177 - 193 0.652 0.676 0.612 0.168 +0.0630
2107 Fam 3 8 328 - 356 0.711 0.803 0.773 0.066 +0.0113
2119 Hex 3 27 232 - 312 0.914 0.937 0.928 0.009 +0.0096
mean 10.21 112 - 356* 0.704 0.75 0.713 1.47-16
** * Allele range considering all loci. ** Combined P(ID) across all loci.
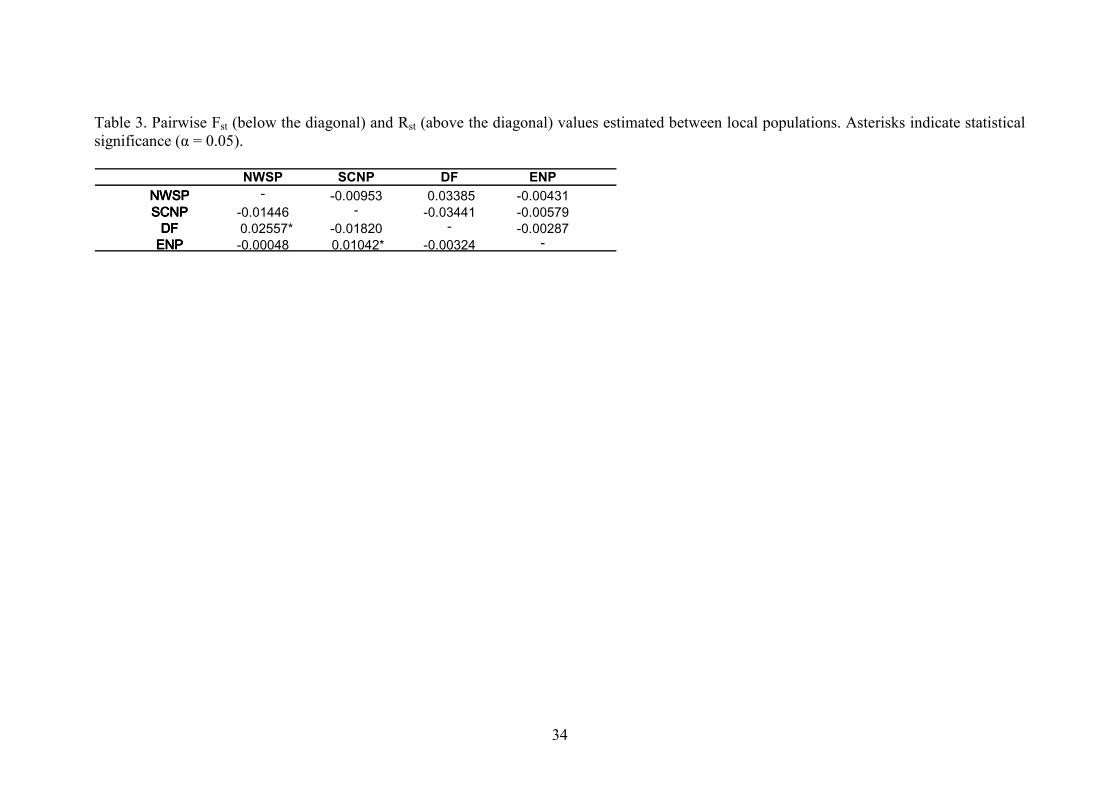
34
Table 3. Pairwise Fst (below the diagonal) and Rst (above the diagonal) values estimated between local populations. Asterisks indicate statistical significance (α = 0.05).
NWSP SCNP DF ENP
NWSPNWSPNWSPNWSP - -0.00953 0.03385 -0.00431SCNPSCNPSCNPSCNP -0.01446 - -0.03441 -0.00579
DFDFDFDF 0.02557* -0.01820 - -0.00287ENPENPENPENP -0.00048 0.01042* -0.00324 -
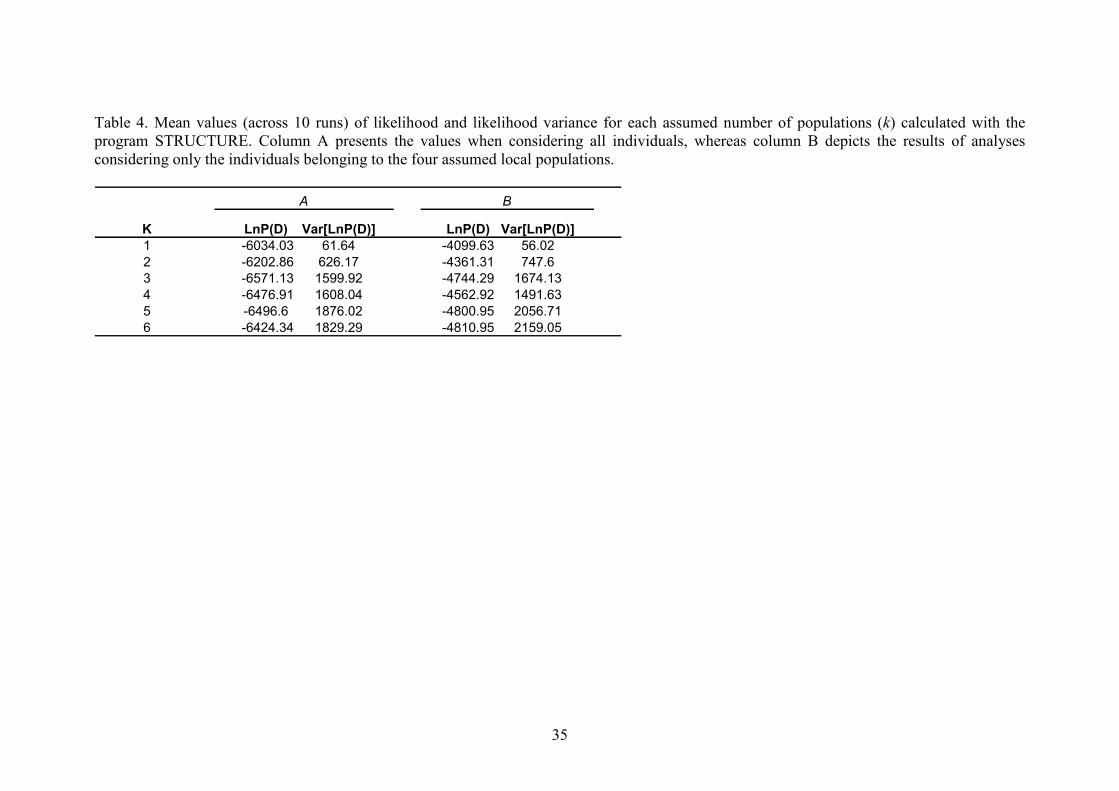
35
Table 4. Mean values (across 10 runs) of likelihood and likelihood variance for each assumed number of populations (k) calculated with the program STRUCTURE. Column A presents the values when considering all individuals, whereas column B depicts the results of analyses considering only the individuals belonging to the four assumed local populations.
K LnP(D) Var[LnP(D)] LnP(D) Var[LnP(D)]
1 -6034.03 61.64 -4099.63 56.02
2 -6202.86 626.17 -4361.31 747.6
3 -6571.13 1599.92 -4744.29 1674.13
4 -6476.91 1608.04 -4562.92 1491.63
5 -6496.6 1876.02 -4800.95 2056.71
6 -6424.34 1829.29 -4810.95 2159.05
A B