diversification in amazonian woody plant lineages...
TRANSCRIPT

Centre d’Etude de la Biodiversité Amazonienne - © 2012
DIVERSIFICATION IN AMAZONIAN
WOODY PLANT LINEAGES AND THE
FUTURE OF AMAZONIA
Jerome Chave
CNRS,
laboratoire Evolution Diversité Biologique,
Université Paul Sabatier
Toulouse, FRANCE

Centre d’Etude de la Biodiversité Amazonienne - © 2012
Davidson et al. Nature (2012)
The Amazon basin in
transition

Centre d’Etude de la Biodiversité Amazonienne - © 2012
It is our moral responsibility to
know and protect biodiversity
Act so that the consequences of
your actions are compatible with
the permanence of a genuine
human life on Earth
Hans Jonas (1979)

Centre d’Etude de la Biodiversité Amazonienne - © 2012
Engaging citizen in the study
of biodiversity

Centre d’Etude de la Biodiversité Amazonienne - © 2012
Outline
1. The pace of diversification in the
Neotropical tree flora
2. Environmental drivers of
diversification
3. Modelling the future of Amazonian
forest ecosystems

Centre d’Etude de la Biodiversité Amazonienne - © 2012
1. At what pace has
the Neotropical flora
diversified?
Photo credit: Oliver Phillips, Leeds U

Centre d’Etude de la Biodiversité Amazonienne - © 2012
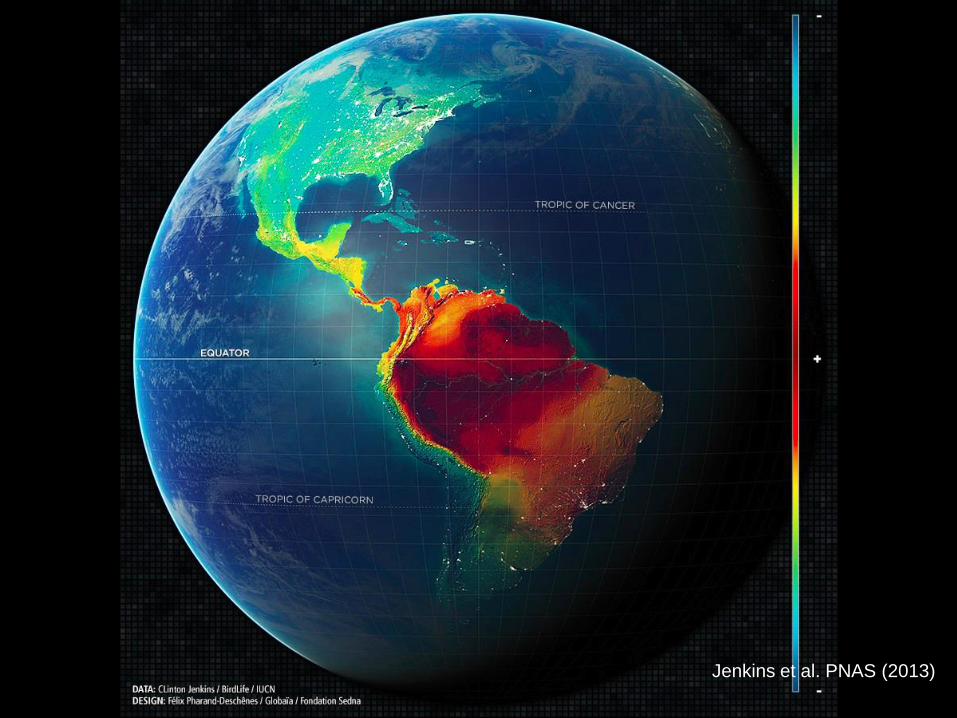
The Neotropics
Top-canopy
height (m)
Centre d’Etude de la Biodiversité Amazonienne - © 2012
Vertebrates
MammalsBirds Amphibians
Jenkins et al. PNAS (2013)

Centre d’Etude de la Biodiversité Amazonienne - © 2012
‘One of the outstanding features of
the neotropical flora is it extreme
richness in species (90,000 species
according to Raven 1976)’
Gentry Ann Miss Bot Garden (1982)

Centre d’Etude de la Biodiversité Amazonienne - © 2012
Time‘Museum’ diversification
‘Cradle’ diversification
Rate of change are calibrated using the fossil record
Phylogenetic trees and the fossil record
provide a crucial information on the
tempo of diversification
Origin
OLD
RECENT

Centre d’Etude de la Biodiversité Amazonienne - © 2012Science (2010)
Age of genera

Centre d’Etude de la Biodiversité Amazonienne - © 2012Hoorn et al. Science (2010)

Centre d’Etude de la Biodiversité Amazonienne - © 2012
Roncal et al. Bot J Linn Soc (2013)Genus Astrocaryum
(palm) in the Neotropics

Centre d’Etude de la Biodiversité Amazonienne - © 2012Fine et al. Evolution (2014)
Protiae (fam.
Burseraceae) in the
Neotropics

Centre d’Etude de la Biodiversité Amazonienne - © 2012
Meliaceae
Koenen et al. New Phytol (2015)
Cedrela
Trichilia
Ruagea/
Guarea

Centre d’Etude de la Biodiversité Amazonienne - © 2012Lohmann et al. Bot J Linn Soc (2013)
Bignoniaceae

Centre d’Etude de la Biodiversité Amazonienne - © 2012
Program
1. Provide/streamline plastid DNA genomic
resources across tree species in Amazonia
2. Document the evolutionary history of more
major tree families in Amazonia
3. Search for commonalities across these
lineages
Centre d’Etude de la Biodiversité Amazonienne - © 2012
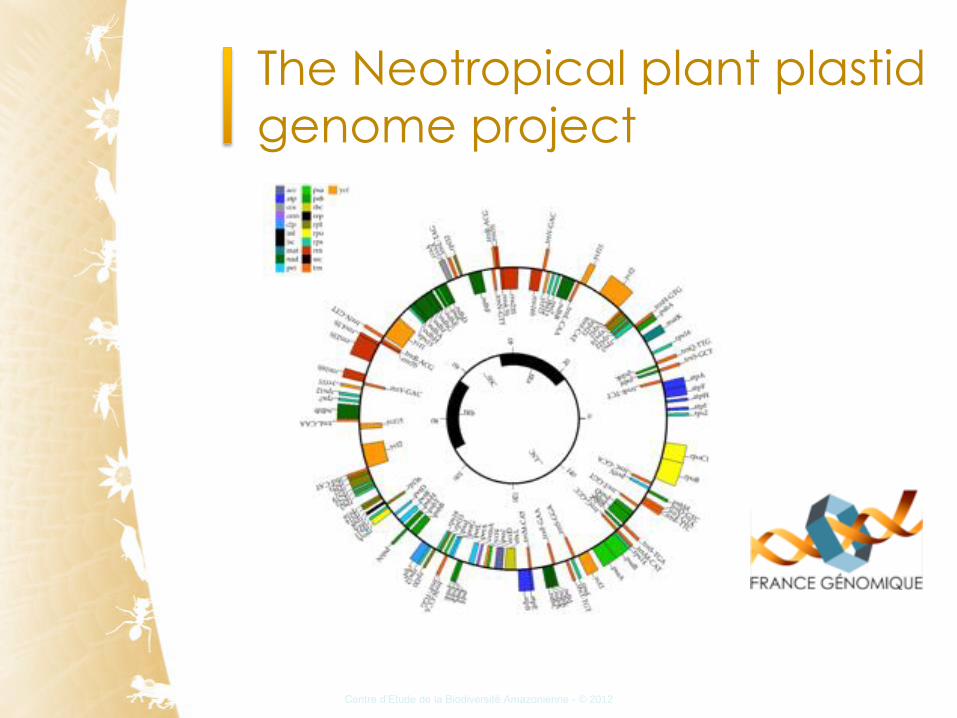
The Neotropical plant plastid
genome project

Centre d’Etude de la Biodiversité Amazonienne - © 2012
Methods
1. Extract DNA from dry leaf material
2. Prepare one high throughput
sequencing library per species
3. Multiplex 24 libraries per HiSeq run
4. Reconstruct the plastid DNA genome by
‘genome walking assembly’ technique
5. Align and annotate genomes
6. Construct a phylogenetic hypothesis

Centre d’Etude de la Biodiversité Amazonienne - © 2012
Total sequencing effort
• 200 plastid genomes from ‘focal’
tree families
– Chrysobalanaceae (ca. 100 spp/533)
– Sapotaceae: Chrysophylloideae (ca.
100 spp/500)
• 200 plastid genomes from ‘other’
tree families

Centre d’Etude de la Biodiversité Amazonienne - © 2012
What a plastid genome
looks like

Centre d’Etude de la Biodiversité Amazonienne - © 2012
Plastid genome size statistics
0
100
200
300
400
500
600
700
800
900
140000 150000 160000 170000 180000 190000
Genome length
Se
qu
en
cin
gd
ep
th n=82
Chaunochiton kappleri (Olacaceae)
Amphirrhox longifolia (Violaceae)Apocynaceae, Annonaceae
Centre d’Etude de la Biodiversité Amazonienne - © 2012
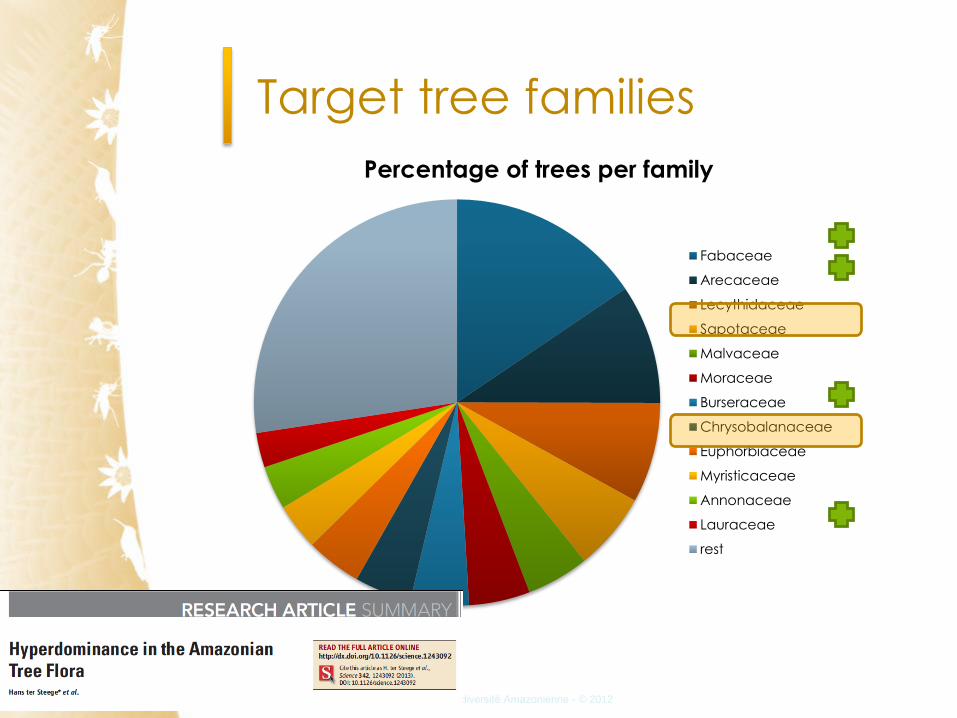
Target tree families
Percentage of trees per family
Fabaceae
Arecaceae
Lecythidaceae
Sapotaceae
Malvaceae
Moraceae
Burseraceae
Chrysobalanaceae
Euphorbiaceae
Myristicaceae
Annonaceae
Lauraceae
rest

Centre d’Etude de la Biodiversité Amazonienne - © 2012
Mid-sized family with ca 500
species, 80% of them in the
Neotropics
Taxonomy of the family has
been carefully researched
since the 1960s
Chrysobalanaceae

Centre d’Etude de la Biodiversité Amazonienne - © 2012
Jud et al. Am J Bot (2016)
Fossil record
Centre d’Etude de la Biodiversité Amazonienne - © 2012
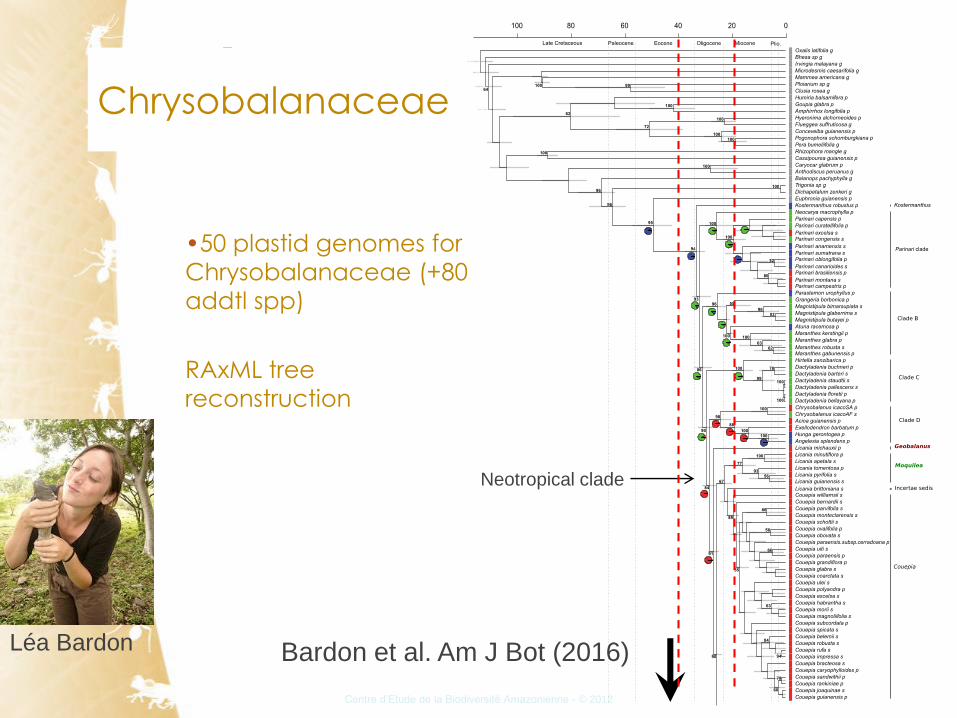
Chrysobalanaceae
•50 plastid genomes for
Chrysobalanaceae (+80
addtl spp)
RAxML tree
reconstruction
Neotropical clade
Bardon et al. Am J Bot (2016)Léa Bardon

Centre d’Etude de la Biodiversité Amazonienne - © 2012 Hirtella duckei s
Hirtella elongata s
Hirtella magnifolia s
Hirtella pilosissima s
Hirtella rodriguesii s
Hirtella glandulosa sHirtella bicornis s
Hirtella glabrata s
Hirtella suffulta pHirtella tenuifolia s
Hirtella macrosepala pHirtella dorvalii s
Hirtella glandistipula sHirtella hebeclada s
Hirtella ciliata s
Hirtella araguariensis s
Hirtella punctillata sHirtella triandra s
Hirtella margae s
Hirtella paniculata sHirtella bullata s
Hirtella davisii s
Hirtella arenosa s
Hirtella physophora p
Hirtella racemosa p
Licania laevigata sLicania latifolia s
Licania amapaensis s
Licania heteromorpha p
Licania egleri s
Licania intrapetiolaris s
Afrolicania elaeosperma p
Licania glabriflora p
Licania macrophylla pLicania licaniiflora s
Gaulettia amaraliae s
Gaulettia elata pGaulettia canomensis s
Licania lanceolata s
Licania micrantha pLicania cordata s
Licania densiflora s
Licania caudata s
Licania membranacea p
Licania ovalifolia p
Licania hypoleuca s
Licania parvifructa s
Licania gracilipes s
Licania leptostachya s
Licania canescens pLicania incana s
Licania orbicularis s
Licania alba pLicania laxiflora s
Licania discolor s
Licania irwinii s
Licania unguiculata sLicania urceolaris s
Licania majuscula pLicania octandra s
Licania sprucei p
Licania cf.longistyla p
Licania emarginata s
Licania granvillei sLicania lata s
57
56
87
91
63
55
87
92
87
85
100
95
81
79
84
55
51
54
88
76
99
75
70
40 20 0
Oligocene Miocene Plio.
Par inariopsis
Lican ia ss
Gaulet t ia
Afrolicania
Leptoba lanus
Hym enopus
Hym enopus
Chrysobalanaceae
New generic delineation for
Licania (Sothers et al. 2017)
Now 6 genera (Geobalanus,
Moquilea, Leptobalanus, Licania,
Parinariopsis, Hymenopus)
75% of the family belongs to a
single Neotropical clade that
diversified < 30 Ma ago
Centre d’Etude de la Biodiversité Amazonienne - © 2012
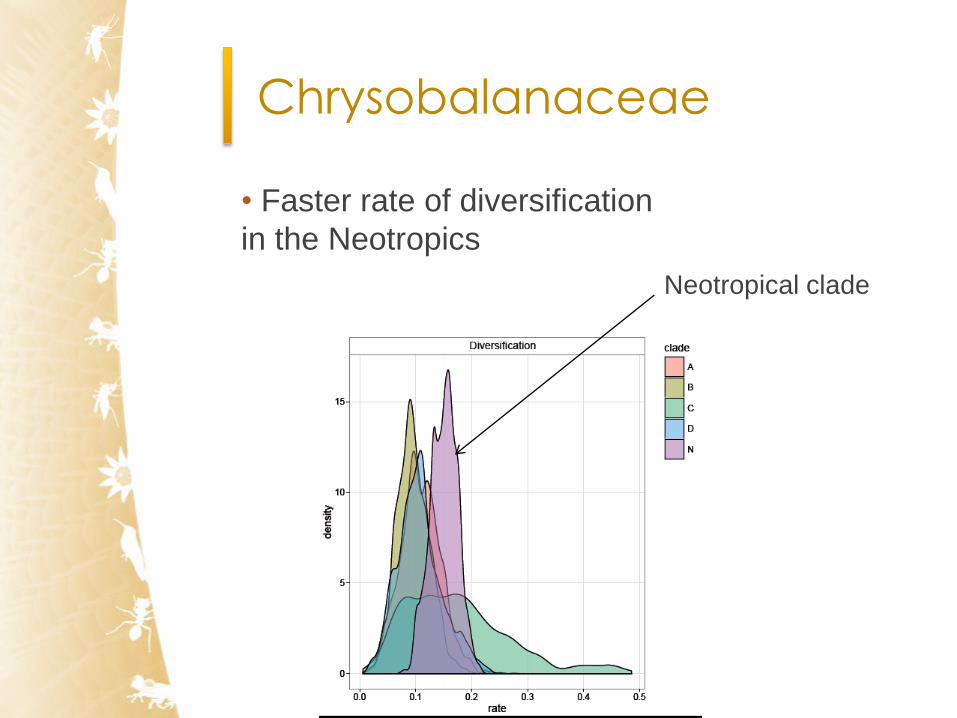
• Faster rate of diversification
in the Neotropics
Chrysobalanaceae
Neotropical clade
Centre d’Etude de la Biodiversité Amazonienne - © 2012
Chrysobalanaceae
• A paleotropical family, that diversified ca
50 Ma ago
• 75% of the diversity is contained in a
single Neotropical clade which diversified
rapidly
• The Neotropical evolutionary history for
this family is concentrated in the past 25
Ma
Centre d’Etude de la Biodiversité Amazonienne - © 2012
Second example:
Sapotaceae
• A pantropical family of trees with
ca. 1000 species
• Includes useful species (argan,
chicle, massaranduba)
• Subfamily Chrysophylloideae (ca.
500 spp) is predominantly
Neotropical
Centre d’Etude de la Biodiversité Amazonienne - © 2012
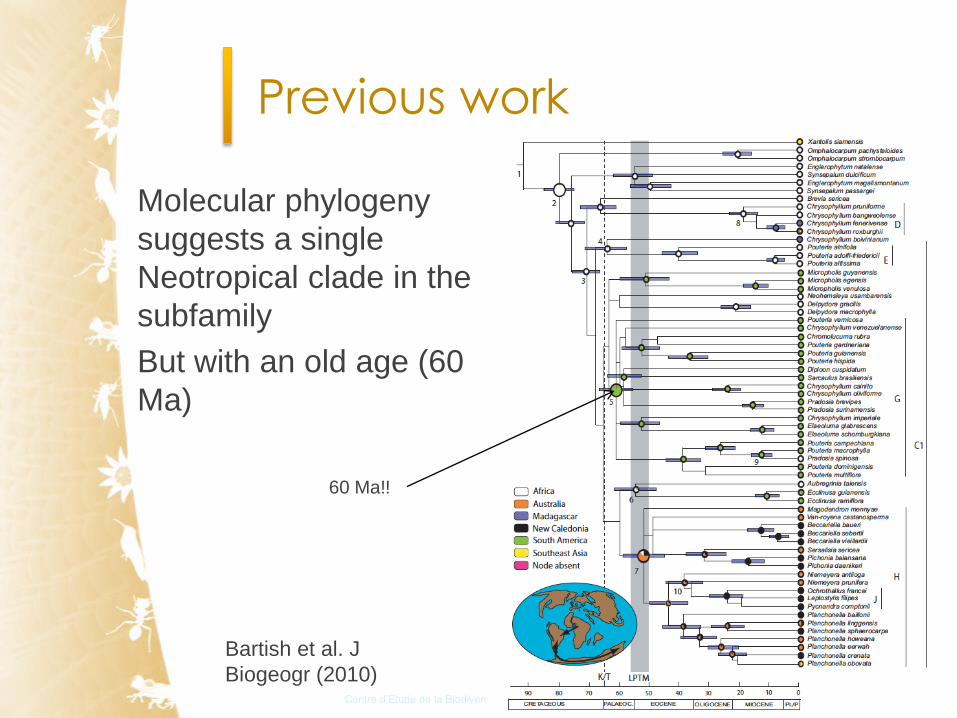
Previous work
60 Ma!!
Bartish et al. J
Biogeogr (2010)
Molecular phylogeny
suggests a single
Neotropical clade in the
subfamily
But with an old age (60
Ma)
Centre d’Etude de la Biodiversité Amazonienne - © 2012
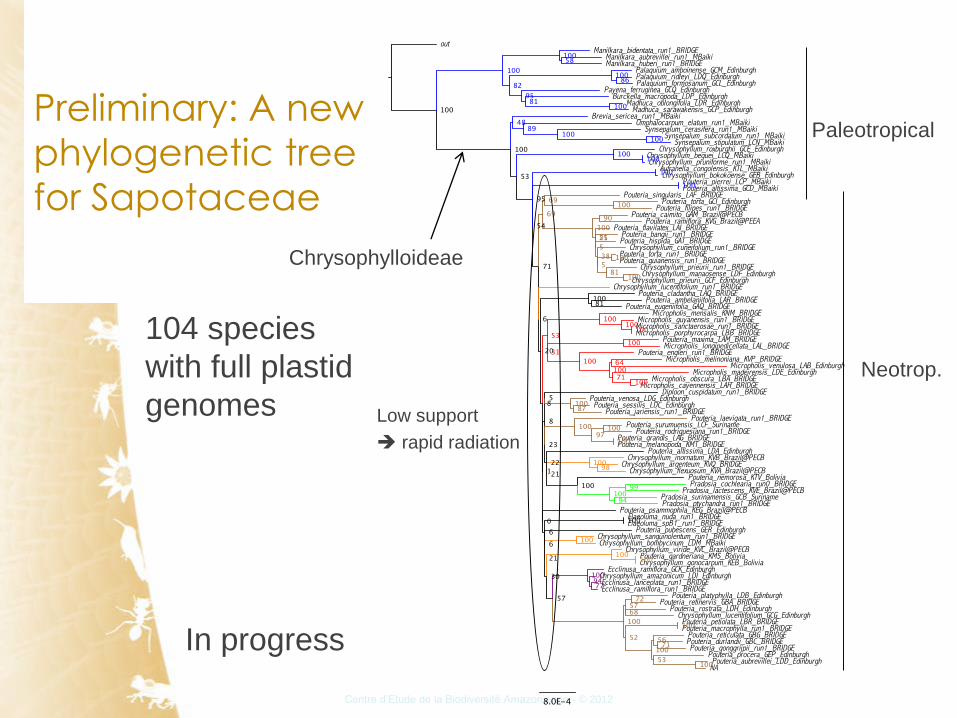
Preliminary: A new
phylogenetic tree
for Sapotaceae
Paleotropical
Neotrop.
Low support
rapid radiation
Chrysophylloideae
104 species
with full plastid
genomes
In progress

Centre d’Etude de la Biodiversité Amazonienne - © 2012
Sapotoideae
Pouteria
Micropholis
Chrysophyllum
Pradosia
Elaeoluma
Ecclinusa
Chrysophylloideae Chrysophyllum
Synsepalum
Neotropics
Neotropical node
In progress

Centre d’Etude de la Biodiversité Amazonienne - © 2012
Part 1: conclusions
• The origins of many plant lineages that
are currently predominantly Neotropical
is usually less than 40 Ma.
• After their arrival in the Neotropics, many
lineages seem to have evolved in situ,
with very rare dispersal from the
Neotropics
• For the lineages studied, diversification
rates have been consistently higher in the
Neotropics than in Africa

Centre d’Etude de la Biodiversité Amazonienne - © 2012
2. Are Amazonian
forests homogeneous
environmentally?

Centre d’Etude de la Biodiversité Amazonienne - © 2012

Centre d’Etude de la Biodiversité Amazonienne - © 2012
Allopatric speciation
Genetic
reinforcement
Creation of a
barrier
Mayr (1963)
Time

Centre d’Etude de la Biodiversité Amazonienne - © 2012

Centre d’Etude de la Biodiversité Amazonienne - © 2012•Pennington et al. PNAS 2010
Cyathostegia.
Centre d’Etude de la Biodiversité Amazonienne - © 2012
Finding environmental
regions for Amazonia• Define an environmental space for each pixel of
the Amazon
• Define a distance metric for pairs of pixels in the
environmental space
• Define a graph where each node is a pixel, and
the edge materialize the connection between
most similar pixels in environmental space
(adaptive nearest neighbor)
• Construct ‘natural’ clusters using a clsutering
algorithm

Centre d’Etude de la Biodiversité Amazonienne - © 2012
Canopy height
Sao
Paulo
Sao
Pedro
Top-canopy
height (m)

Centre d’Etude de la Biodiversité Amazonienne - © 2012
Topography
SRTM instrument
(space shuttle) NASA
Elevation
(m a.s.l)

Centre d’Etude de la Biodiversité Amazonienne - © 2012
Rainfall
Monthly
rainfall
(mm)
CHIRPS product
(Funk et al. 2015)

Centre d’Etude de la Biodiversité Amazonienne - © 2012
Soil moisture
SMOS satellite
(2010-2016) soil
moisture product
Moist
Dry
Centre d’Etude de la Biodiversité Amazonienne - © 2012
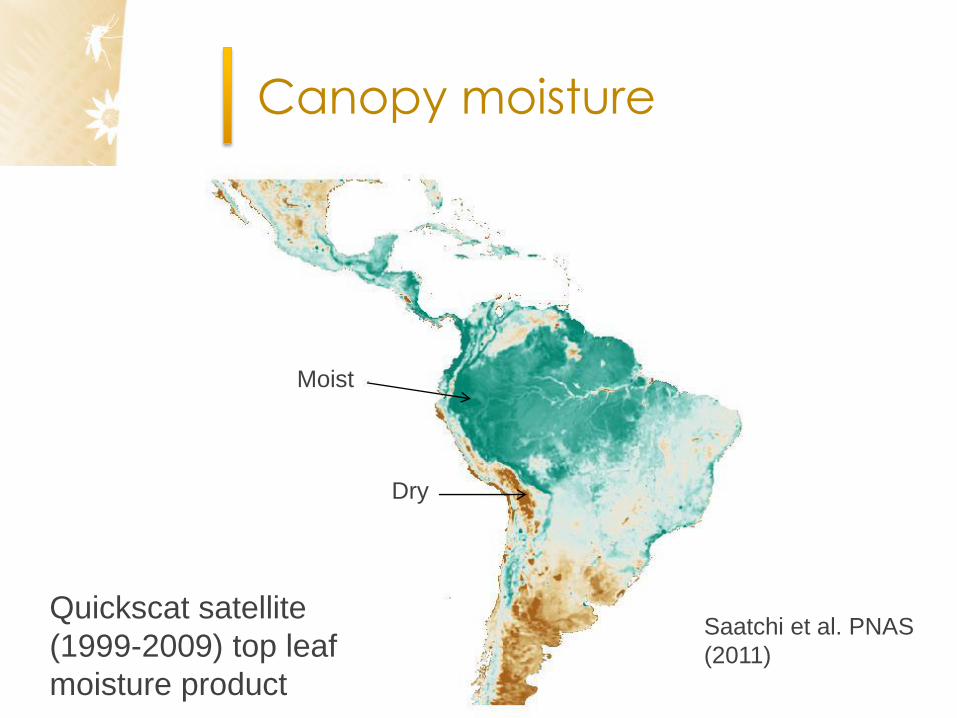
Canopy moisture
Quickscat satellite
(1999-2009) top leaf
moisture product
Saatchi et al. PNAS
(2011)
Moist
Dry
Centre d’Etude de la Biodiversité Amazonienne - © 2012
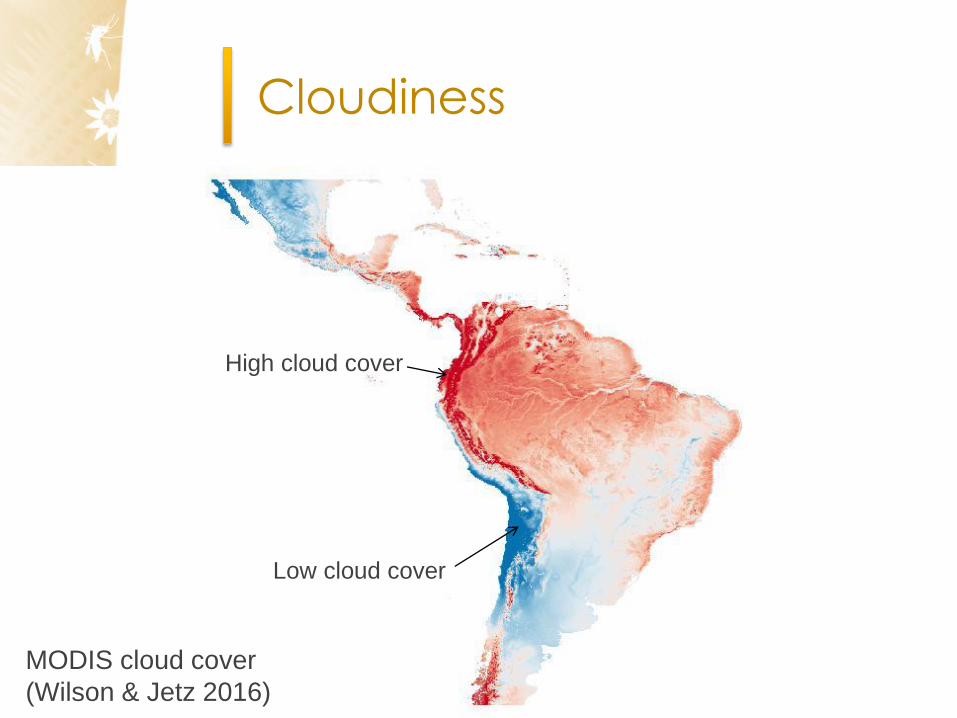
Cloudiness
Low cloud cover
High cloud cover
MODIS cloud cover
(Wilson & Jetz 2016)

Centre d’Etude de la Biodiversité Amazonienne - © 2012
Finding environmental
regions for Amazonia• Define an environmental space for each pixel of
the Amazon
• Define a distance metric for pairs of pixels in the
environmental space
• Define a graph where each node is a pixel, and
the edge materialize the connection between
most similar pixels in environmental space
(adaptive nearest neighbor)
• Construct ‘natural’ clusters using a clsutering
algorithm

Centre d’Etude de la Biodiversité Amazonienne - © 2012
Result: environmental regions
for Amazonia
S Tao, J Murienne, A Fouquet, J Chave, unpublished results

Centre d’Etude de la Biodiversité Amazonienne - © 2012
Implications
• The Amazon is more environmentally diverse than
any single environmental layer would suggest
(topography, climate, forest structure)
• This implies that biogeographic barriers, which
trigger diversification, are common in Amazonia –we should not only consider rivers
• Looking into the past of these environments is a
necessity, but will require a careful exploration of
how past environmental variables correlate with
each other

Centre d’Etude de la Biodiversité Amazonienne - © 2012
Caveat – Amerindian
footprint in Amazonia

Centre d’Etude de la Biodiversité Amazonienne - © 2012
The future of remote sensing in
Amazonia (and the globe)

Centre d’Etude de la Biodiversité Amazonienne - © 2012
Several mission designs are in preparation for launch (EnMAP by
Germany, PRISMA by Italy)
New mission designs are needed(NASA, Israel, ESA, China are working
on this)
•Map of alpha-
diversity
Feret and Asner Ecol Appl (2014)
Shannon’s diversity index
Inferring biodiversity from
space: hyperspectral sensing

Centre d’Etude de la Biodiversité Amazonienne - © 2012
Outline
1. The pace of diversification in the
Neotropical tree flora
2. Environmental drivers of
diversification
3. Modelling the future of Amazonian
forest ecosystems

Centre d’Etude de la Biodiversité Amazonienne - © 2012
3. Can we model the
Amazonian forest to
predict its future
state(s)?

Centre d’Etude de la Biodiversité Amazonienne - © 2012•Cox et al. 2000 Nature; Cox et al. 2004 Theor. Appl. Climatol; Good et al. 2013 Journal of Climate
Towards an Amazonian dieback ?
First model
2001, 2004
Modified model
2013
An uncertain future

Centre d’Etude de la Biodiversité Amazonienne - © 2012
CO2
Photosynthesis Respiration
Mortality
Roots, leaves, fruits …
Mortalit
Net Primary Production of Wood
Sitch et al. GCB (2003) 9, 161-185
Dynamic vegetation models
Centre d’Etude de la Biodiversité Amazonienne - © 2012
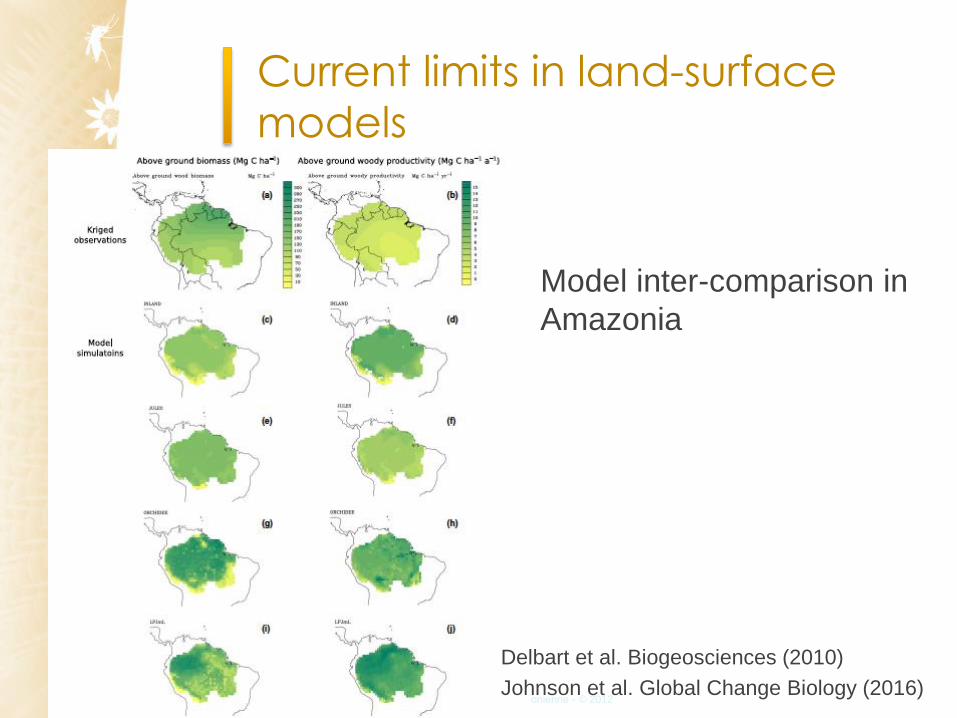
Current limits in land-surface
models
Model inter-comparison in
Amazonia
Delbart et al. Biogeosciences (2010)
Johnson et al. Global Change Biology (2016)

Centre d’Etude de la Biodiversité Amazonienne - © 2012
Current limits in climate
forecasting models
Joetzjer et al. Clim Dyn (2014)
Observed climatology
(GPCC)
Emilie Joetzjer
Centre d’Etude de la Biodiversité Amazonienne - © 2012
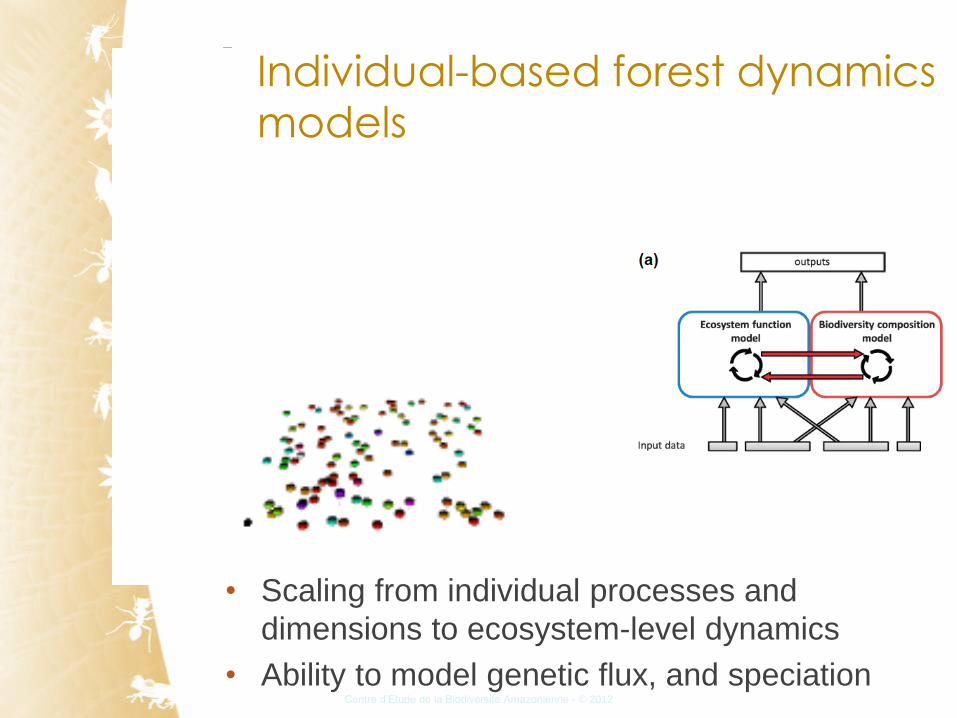
Individual-based forest dynamics
models
• Scaling from individual processes and
dimensions to ecosystem-level dynamics
• Ability to model genetic flux, and speciation
Centre d’Etude de la Biodiversité Amazonienne - © 2012
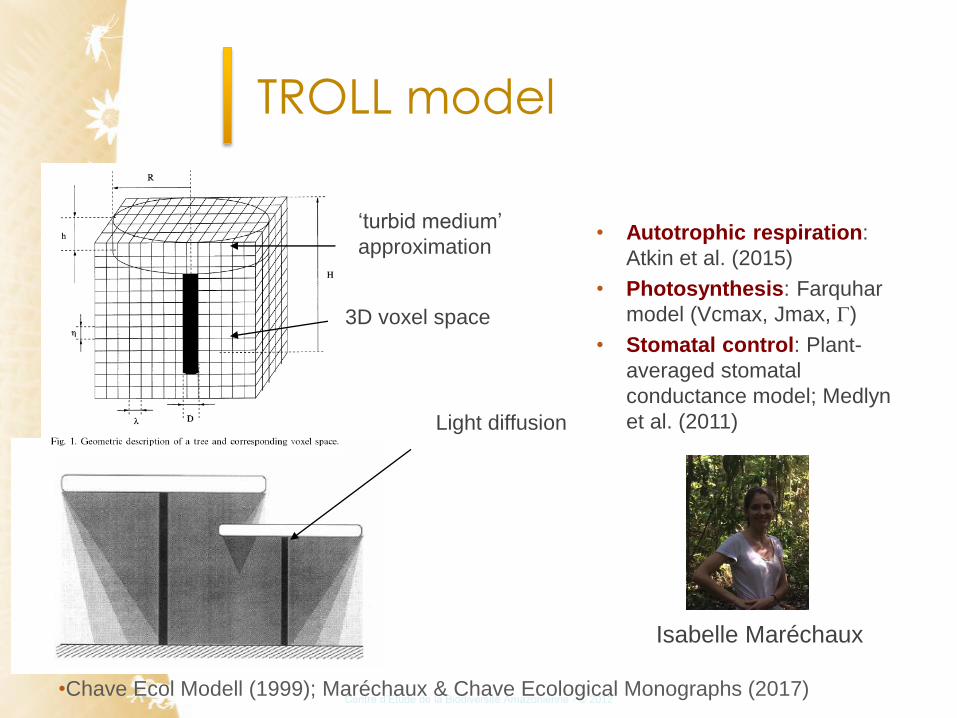
‘turbid medium’
approximation
3D voxel space
Light diffusion
• Autotrophic respiration:
Atkin et al. (2015)
• Photosynthesis: Farquhar
model (Vcmax, Jmax, G)
• Stomatal control: Plant-
averaged stomatal
conductance model; Medlyn
et al. (2011)
•Chave Ecol Modell (1999); Maréchaux & Chave Ecological Monographs (2017)
TROLL model
Isabelle Maréchaux

Centre d’Etude de la Biodiversité Amazonienne - © 2012
TROLL model
Maréchaux & Chave Ecological Monographs (2017)

Centre d’Etude de la Biodiversité Amazonienne - © 2012
•PARACOU
•NOURAGUES
163 species
parameterized.
Parameterizing TROLL: sites
and data

Centre d’Etude de la Biodiversité Amazonienne - © 2012
Early-regeneration plot
Undisturbed mature forest plots
Forest regeneration from
bare ground
0 100 200 300 400 500
0
100
200
300
400
Aboveground biomass (in tons/hectare)
Time (in years)
Maréchaux & Chave Ecological Monographs (2017)

Centre d’Etude de la Biodiversité Amazonienne - © 2012
0 100 200 300 400 500
0
10
20
30
40
50
60
70
Bonal et al. 2008 Global Change Biology; Malhi 2012 Journal of Ecology
Time (years)
GPP = NPP + Rmaintenance + Rgrowth
Carbon flux (in Mg C ha-1 year-1)
GPP
Rmaintenance
NPP
Rgrowth
Guyaflux
Paracou
French Guiana
Forest regeneration from
bare ground

Centre d’Etude de la Biodiversité Amazonienne - © 2012
0 100 200 300 400 500
0
2
4
6
8
Species relative abundances (%)
Time (in years)
0 100 200 300 400 500
0
2
4
6
8Laetia proceraCecropia obtusaDicorynia guianensisEschweilera grandifloraPouteria guyanensisEperua grandifloraGoupia_glabraMicropholis cayennensis
Laetia procera
Cecropia obtusa
Dicorynia guianensis
Eschweilera grandiflora
Pouteria guyanensis
Eperua grandiflora
Goupia glabra
Micropholis cayennensis
Forest regeneration from
bare ground
Maréchaux & Chave Ecological Monographs (2017)
Centre d’Etude de la Biodiversité Amazonienne - © 2012313100 313300 313500
4512
0045
1400
4516
0045
1800
4520
00
0
10
20
30
40
50
v
Freq
uenc
y
0 10 30 50
010
000
2000
030
000
4000
0
Histogram of Canopy_height
Canopy_height
Freq
uenc
y
0 10 20 30 40 50 60
010
000
2000
030
000
4000
0
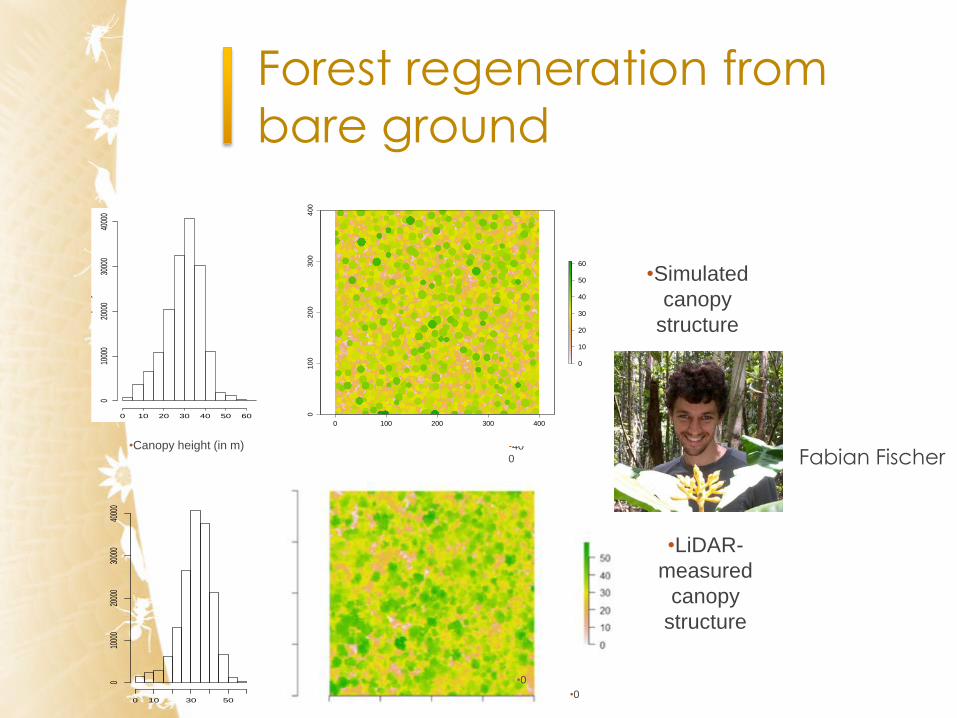
•Canopy height (in m)
•Simulated
canopy
structure
•LiDAR-
measured
canopy
structure
•0
•0
•40
0
0 100 200 300 400
01
00
200
300
400
0
10
20
30
40
50
60
Forest regeneration from
bare ground
Fabian Fischer

Centre d’Etude de la Biodiversité Amazonienne - © 2012
Biodiversity and ecosystem
functioning
Tilman et al 2007

Centre d’Etude de la Biodiversité Amazonienne - © 2012
Test of the effect of biodiversity on forest productivity
by changing simulated species richness and composition.
5 LEVELS
OF
SPECIES RICHNESS
100 SIMULATIONS
EACH
500 SIMULATIONS THAT DIFFER IN SPECIES RICHNESS AND COMPOSITION
2 species 5 species 10 species 50 species 100 species
…
…
…
…
…
Maréchaux & Chave Ecological Monographs (2017)
A virtual biodiversity experiment

Centre d’Etude de la Biodiversité Amazonienne - © 2012
Test of the effect of biodiversity on forest productivity
by changing simulated species richness and composition.
2 5 10 50 100
25
30
35
40
45
50
55
2 5 10 50 100
0
10
20
2 5 10 50 100
0
10
20
2 5 10 50 100
−1.5
−1.0
−0.5
0.0
0.5
1.0
1.5
2 5 10 50 100
100
200
300
400
500
2 5 10 50 100
−200
−100
0
100
200
300
2 5 10 50 100
−200
−100
0
100
200
300
2 5 10 50 100
−20
−10
0
10
20
a
a,b
b
b b
Species richness
GP
P (
in M
g C
ha
-1 y
ear-1
)
GPP
A virtual biodiversity experiment

Centre d’Etude de la Biodiversité Amazonienne - © 2012
Test of the effect of biodiversity on forest productivity
by changing simulated species richness and composition.
2 5 10 50 100
25
30
35
40
45
50
55
2 5 10 50 100
0
10
20
2 5 10 50 100
0
10
20
2 5 10 50 100
−1.5
−1.0
−0.5
0.0
0.5
1.0
1.5
2 5 10 50 100
100
200
300
400
500
2 5 10 50 100
−200
−100
0
100
200
300
2 5 10 50 100
−200
−100
0
100
200
300
2 5 10 50 100
−20
−10
0
10
20
a
a,b
b
b b
***
a
***
a,b
***
a,b
***
b
***
ΔG
PP
(in
Mg C
ha
-1 y
ea
r-1)
Species richness (S) Species richness (S)
GP
P (
in M
g C
ha
-1 y
ear-1
)
Net biodiversity effectGPP
- + + + + S
Net
biodiversity
effect=
A virtual biodiversity experiment

Centre d’Etude de la Biodiversité Amazonienne - © 2012
2 5 10 50 100
25
30
35
40
45
50
55
2 5 10 50 100
0
10
20
2 5 10 50 100
0
10
20
2 5 10 50 100
−1.5
−1.0
−0.5
0.0
0.5
1.0
1.5
2 5 10 50 100
100
200
300
400
500
2 5 10 50 100
−200
−100
0
100
200
300
2 5 10 50 100
−200
−100
0
100
200
300
2 5 10 50 100
−20
−10
0
10
20
a
a,b
b
b b
***
a
***
a,b
***
a,b
***
b
*** ******
a***
a
***
a
***
a
**
b,c
***
c
a,b,c
a,ba
ΔG
PP
(in
Mg C
ha
-1 y
ea
r-1)
SE
GP
P(in
Mg C
ha
-1 y
ea
r-1)
CE
GP
P(in
Mg C
ha
-1 y
ea
r-1)
Species richness (S) Species richness (S) Species richness (S) Species richness (S)
GP
P (
in M
g C
ha
-1 y
ear-1
)
Net biodiversity effectGPP Complementarity effectSelection effect
selection effect
Test of the effect of biodiversity on forest productivity
by changing simulated species richness and composition.
Loreau & Hector 2001 Nature
Net
biodiversity
effect= +
complementarity
effect
A virtual biodiversity experiment

Centre d’Etude de la Biodiversité Amazonienne - © 2012
Conclusions
1. The pace of diversification in the Neotropical tree
flora– Chrysobalanaceae and Sapotaceae tell similar stories:
one dispersal event and in-situ diversification, consistent
with other plant groups
– The in-situ diversification history is more recent than 40 Ma
2. Environmental drivers of diversification– Careful exploration into the environmental diversity today
holds key to understand past events
– Tropical forest observation by remote sensing is entering a
new era
3. Modelling the future of Amazonian forest
ecosystems– New modelling tools are emerging and they help
reconcile questions in environmental science and
biodiversity research

Centre d’Etude de la Biodiversité Amazonienne - © 2012
It is our moral responsibility to
know and protect biodiversity
Act so that the consequences of
your actions are compatible with
the permanence of a genuine
human life on Earth
Hans Jonas (1979)
Centre d’Etude de la Biodiversité Amazonienne - © 2012