diversifying psychometric tools for intelligence
TRANSCRIPT

Diversifying Psychometric Tools for Intelligence Assessment and Screening in Latin America
by
Emily C. Duggan
Bachelor of Arts, Boston University, 2009 Master of Science, University of Victoria, 2014
A Dissertation Submitted in Partial Fulfillment of the Requirements for the Degree of
DOCTOR OF PHILOSOPHY
In the Department of Psychology
© Emily C. Duggan, 2019
University of Victoria
All rights reserved. This dissertation may not be reproduced in whole or in part, by photocopy or other means, without the permission of the author.

ii
Diversifying Psychometric Tools for Intelligence Assessment and Screening in Latin America
by
Emily C. Duggan Bachelor of Arts, Boston University, 2009
Master of Science, University of Victoria, 2014
Supervisory Committee Dr. Mauricio Garcia-Barrera, Supervisor Department of Psychology Dr. Scott M. Hofer, Departmental Member Department of Psychology Dr. Alfredo Ardila, Outside Member Florida International University

iii
Abstract
Objective: Cultural neuropsychologists face barriers such as access to culturally appropriate
psychometric instruments and norms. Further, three commonly encountered dilemmas in cultural
neuropsychology include the following questions: (1) How do psychologists determine the best
normative data to use for a given assessment scenario? (2) Do measures and models developed with
North American samples also work in adaptations of instruments used with cross-cultural samples? (3)
How can alternative and cost-effective measures be developed to meet the need for additional
assessment tools? In response to these dilemmas, this dissertation consists of three papers aimed at
developing Latinx and cultural neuropsychology psychometric resources for one of the most common
cultural assessment scenarios: intelligence assessment amongst Spanish-speaking individuals using the
Wechsler Adult Intelligence Scale – Fourth Edition (WAIS-IV). Chapter 1. A sample of 305 highly
educated Colombian corporate executives completed the WAIS-IV. Data were scored using norms from
Colombia, Chile, Mexico, Spain, United States, and Canada and scores were compared using ANOVA.
Additionally, a comparative sociodemographic framework was established to contextualize our sample
to the standardization samples and populations of the six countries. Chapter 2. Accumulating evidence
indicates the original factor structures published in the Wechsler Intelligence Scales may not best
describe the data captured by these tests, and instead supports a five factor Cattell-Horn-Carroll (CHC)
model over a four factor Wechsler model, and a bifactor model over a higher-order model. Confirmatory
factor analysis and structural equation modeling was used to evaluate factor structure of the Chilean-
WAIS-IV (Wechsler, 2013) normative sample (ages 18-60; N=672) to better understand its psychometrics
and to contribute to much needed cross-cultural study of alternative WAIS-IV factor models. Results
marginally favored CHC and bifactor models but provided strong support for higher-order and Wechsler
model variants as well, pointing to the need of further theoretical, methodological, clinical, and cross-
cultural research. Chapter 3. The recent publication of the Chilean adaptation of the WAIS-IV has

iv
contributed to ongoing efforts to provide more psychometric instruments culturally appropriate for
regions in South America. While not all assessment situations necessitate administration of the full WAIS
and calculation of a full-scale intelligence quotient (FSIQ), there is virtually no published research on
WAIS-IV short forms for estimating IQ in Latin America. This study used a rigorous series of methods
(adapted from Smith et al., 2000) to develop robust estimated IQ short forms, aligned with Wechsler
and CHC models, using the Chilean WAIS-IV standardization data (ages 18-90; N=887). Linear scaling was
used to produce normative tables for the 28 best two-, three-, four-, and five subtest short forms of the
Chilean WAIS-IV. Discussion. Together, the three papers of this dissertation provide psychometric
guidance and resources not only for Latin American neuropsychologists in the area of intelligence
assessment, but also more broadly for all cultural neuropsychology researchers and clinicians.

v
Table of Contents
Supervisory Committee ................................................................................................................................. ii
Abstract ......................................................................................................................................................... iii
Table of Contents ........................................................................................................................................... v
List of Tables ................................................................................................................................................ vii
List of Figures .............................................................................................................................................. viii
List of Supplemental Tables .......................................................................................................................... ix
Acknowledgements ....................................................................................................................................... x
Dedication ..................................................................................................................................................... xi
Prologue ......................................................................................................................................................... 1
Chapter 1. Contributing Towards a Cultural Neuropsychology Assessment Decision-Making Framework: Comparison of WAIS-IV Norms from Colombia, Chile, Mexico, Spain, United States, and Canada ............. 3
Abstract ..................................................................................................................................................... 4
Introduction ............................................................................................................................................... 5
Sources of Cross-Cultural Differences and Hispanic Neuropsychology ................................................ 6
Cross-Cultural Intelligence Assessment and Hispanic Neuropsychology ............................................. 8
Current Study ...................................................................................................................................... 11
Methods .................................................................................................................................................. 11
Considering the Colombian Context ................................................................................................... 12
Participants ......................................................................................................................................... 12
Measures and Establishing a Comparative Framework...................................................................... 13
Analyses .............................................................................................................................................. 16
Results ..................................................................................................................................................... 18
Sample Characteristics ........................................................................................................................ 18
Sample Characteristics in Relation to Country-Specific Sociodemographic Information .................. 18
Relating Sample and Country Sociodemographics to WAIS-Level Information ................................. 19
Comparison of WAIS-IV Scores ........................................................................................................... 22
Discussion ................................................................................................................................................ 27
Chapter 2. Examining Bifactor and Hierarchical Intelligence Factor Structures in the Chilean adaptation of the WAIS-IV.............................................................................................................................................. 36
Abstract ................................................................................................................................................... 37
Introduction ............................................................................................................................................. 38
Methods .................................................................................................................................................. 43
Measures ............................................................................................................................................. 43
Participants ......................................................................................................................................... 44

vi
Procedure ............................................................................................................................................ 44
Results ..................................................................................................................................................... 46
Four-factor (Wechsler) models ........................................................................................................... 47
Five-factor (CHC) models .................................................................................................................... 47
Combined results ................................................................................................................................ 48
Discussion ................................................................................................................................................ 50
Summary.................................................................................................................................................. 55
Chapter 3. Developing Short Forms of the Chilean adaptation of the WAIS-IV for Intellectual Screening 57
Abstract ................................................................................................................................................... 58
Introduction ............................................................................................................................................. 59
Methods .................................................................................................................................................. 63
Measures ............................................................................................................................................. 63
Participants ......................................................................................................................................... 64
Procedure for Establishing Best Short Forms ..................................................................................... 64
Results ..................................................................................................................................................... 71
Short Form Derivation Process ........................................................................................................... 71
Two-Subtest Short Forms.................................................................................................................... 73
Three-Subtest Short Forms ................................................................................................................. 73
Four-Subtest Short Forms ................................................................................................................... 74
Five-Subtest Short Forms .................................................................................................................... 75
Discussion ................................................................................................................................................ 75
Epilogue ....................................................................................................................................................... 82
References ................................................................................................................................................... 84
Tables ......................................................................................................................................................... 114
Figures ........................................................................................................................................................ 138
Supplementary Materials .......................................................................................................................... 147
vii
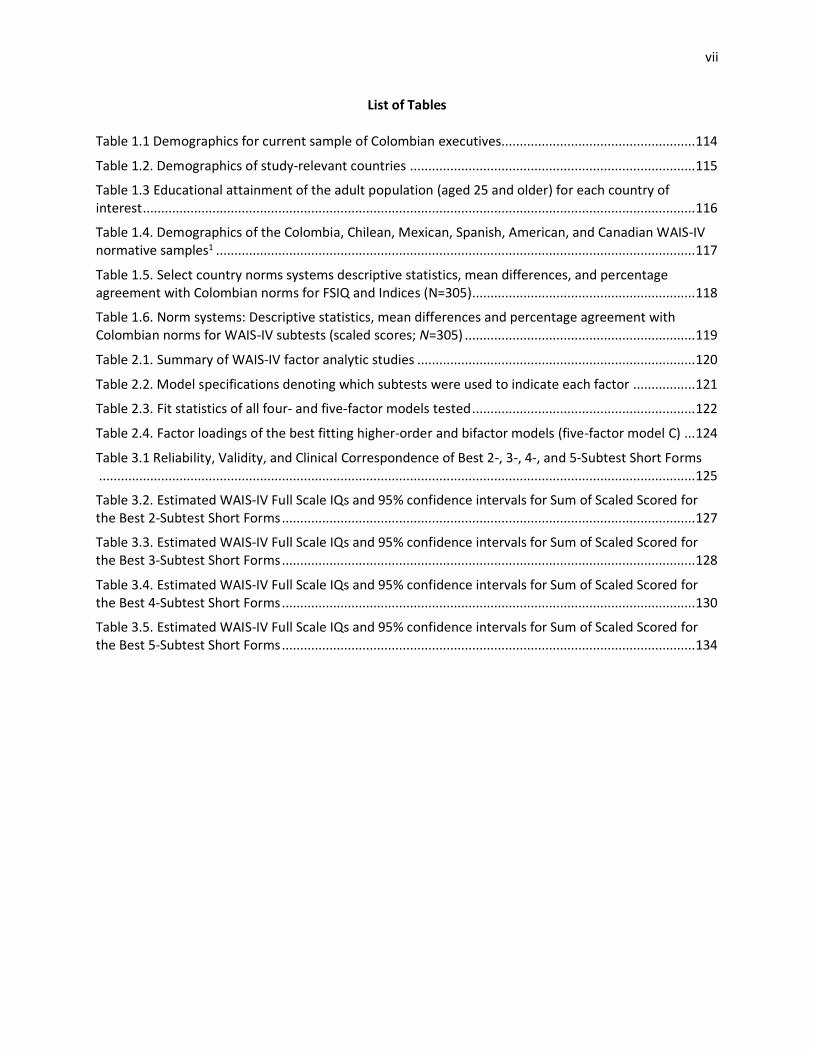
List of Tables
Table 1.1 Demographics for current sample of Colombian executives..................................................... 114
Table 1.2. Demographics of study-relevant countries .............................................................................. 115
Table 1.3 Educational attainment of the adult population (aged 25 and older) for each country of interest ....................................................................................................................................................... 116
Table 1.4. Demographics of the Colombia, Chilean, Mexican, Spanish, American, and Canadian WAIS-IV normative samples1 ................................................................................................................................... 117
Table 1.5. Select country norms systems descriptive statistics, mean differences, and percentage agreement with Colombian norms for FSIQ and Indices (N=305)............................................................. 118
Table 1.6. Norm systems: Descriptive statistics, mean differences and percentage agreement with Colombian norms for WAIS-IV subtests (scaled scores; N=305) ............................................................... 119
Table 2.1. Summary of WAIS-IV factor analytic studies ............................................................................ 120
Table 2.2. Model specifications denoting which subtests were used to indicate each factor ................. 121
Table 2.3. Fit statistics of all four- and five-factor models tested ............................................................. 122
Table 2.4. Factor loadings of the best fitting higher-order and bifactor models (five-factor model C) ... 124
Table 3.1 Reliability, Validity, and Clinical Correspondence of Best 2-, 3-, 4-, and 5-Subtest Short Forms ................................................................................................................................................................... 125
Table 3.2. Estimated WAIS-IV Full Scale IQs and 95% confidence intervals for Sum of Scaled Scored for the Best 2-Subtest Short Forms ................................................................................................................. 127
Table 3.3. Estimated WAIS-IV Full Scale IQs and 95% confidence intervals for Sum of Scaled Scored for the Best 3-Subtest Short Forms ................................................................................................................. 128
Table 3.4. Estimated WAIS-IV Full Scale IQs and 95% confidence intervals for Sum of Scaled Scored for the Best 4-Subtest Short Forms ................................................................................................................. 130
Table 3.5. Estimated WAIS-IV Full Scale IQs and 95% confidence intervals for Sum of Scaled Scored for the Best 5-Subtest Short Forms ................................................................................................................. 134

viii
List of Figures
Figure 1.1. Mean WAIS-IV Full Scale Intelligence Quotient and Index scores when scored with each of the selected six country norms ........................................................................................................................ 138
Figure 1.2. Mean WAIS-IV subtest scaled scores when scored with each of the selected six country norms ................................................................................................................................................................... 139
Figure 1.3. Percentage of individuals within each clinical classification for the Full-Scale Intelligence Quotient (FSIQ) when scored with each of the selected six country norms ............................................. 140
Figure 1.4. Percentage of individuals within each clinical classification for the Wechsler Adult Intelligence Scale – Fourth Edition (WAIS-IV) indexes when scored with each of the selected six country norms. .... 141
Figure 2.1. Four-factor (Wechsler) models and their variants .................................................................. 142
Figure 2.2. Five-factor (CHC) models and their variants............................................................................ 143
Figure 2.3. Best fitting higher-order model ............................................................................................... 144
Figure 2.4. Best fitting bifactor model ....................................................................................................... 145
Figure 3.1. Flow Chart of the Chilean WAIS-IV Derivation Process ........................................................... 146
ix
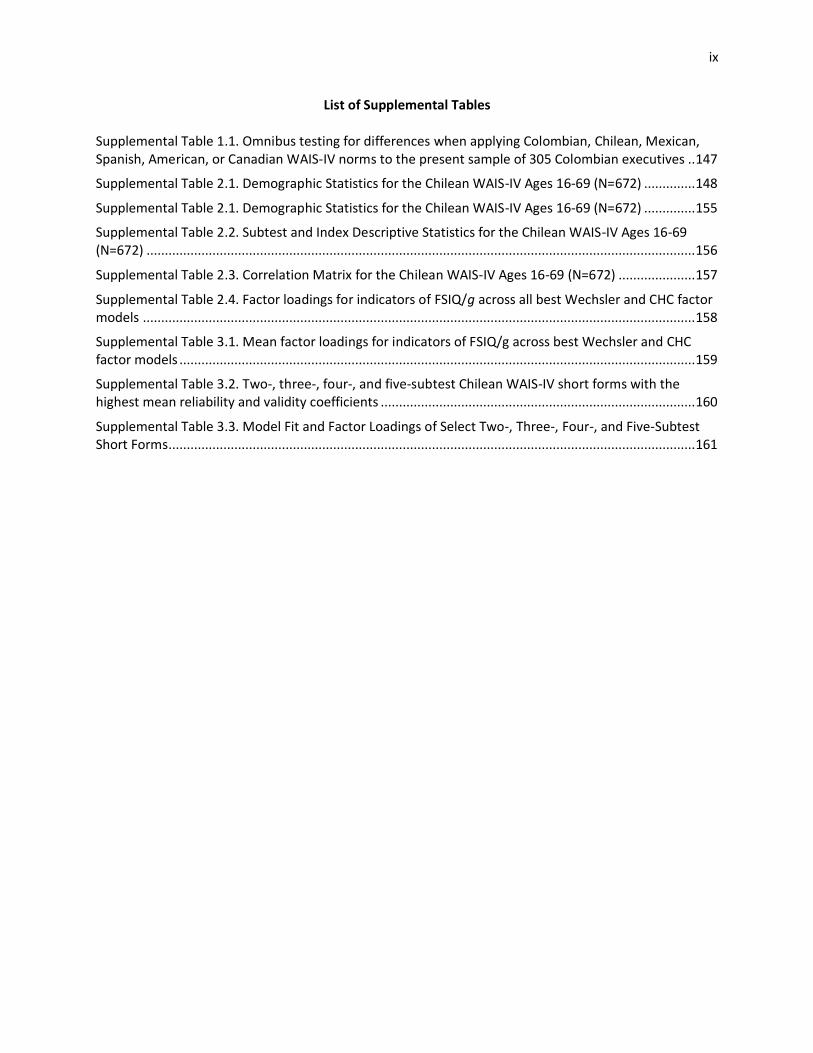
List of Supplemental Tables
Supplemental Table 1.1. Omnibus testing for differences when applying Colombian, Chilean, Mexican, Spanish, American, or Canadian WAIS-IV norms to the present sample of 305 Colombian executives .. 147
Supplemental Table 2.1. Demographic Statistics for the Chilean WAIS-IV Ages 16-69 (N=672) .............. 148
Supplemental Table 2.1. Demographic Statistics for the Chilean WAIS-IV Ages 16-69 (N=672) .............. 155
Supplemental Table 2.2. Subtest and Index Descriptive Statistics for the Chilean WAIS-IV Ages 16-69 (N=672) ...................................................................................................................................................... 156
Supplemental Table 2.3. Correlation Matrix for the Chilean WAIS-IV Ages 16-69 (N=672) ..................... 157
Supplemental Table 2.4. Factor loadings for indicators of FSIQ/g across all best Wechsler and CHC factor models ....................................................................................................................................................... 158
Supplemental Table 3.1. Mean factor loadings for indicators of FSIQ/g across best Wechsler and CHC factor models ............................................................................................................................................. 159
Supplemental Table 3.2. Two-, three-, four-, and five-subtest Chilean WAIS-IV short forms with the highest mean reliability and validity coefficients ...................................................................................... 160
Supplemental Table 3.3. Model Fit and Factor Loadings of Select Two-, Three-, Four-, and Five-Subtest Short Forms................................................................................................................................................ 161

x
Acknowledgements
Standardization data from the Wechsler Adult Intelligence Scale – Fourth Edition Chilean edition
(WAIS-IV), Copyright © 2013 NCS Pearson, Inc. Used with permission per Dr. Ricardo Rosas, Pontificia
Universidad Católica de Chile. All rights reserved. Data provided with permission from Tecnoquímicas, S.
A. I gratefully thank the Vanier Canada Graduate Scholarship and the Natural Sciences and Engineering
Research Council of Canada for their financial support of my research. Additionally, this work was
supported by Mitacs through the Mitacs Globalink Partnership Award-Abroad Program. I am also
appreciative of the contributions of my colleagues Cilia Carolina Loaiza A., Lina Marcela Awakon L.,
Isabella Irurita P., Diana Aribel Guzmán, and Angela Marcela Garcia at Tecnoquímicas, S. A., Dr. Elena
Pérez-Hernández at the Universidad Autónoma de Madrid, Yaira Chamorro-Diaz and Pablo Álvarez-
Tostado at the Neurosciences Institute, Universidad de Guadalajara, and Victor Skrzypczynski and Chloe
Swabey at the University of Victoria. Muchas gracias.

xi
Dedication
To Anne Anastasi, Martha Denckla, Edith Kaplan, Muriel Deutsch Lezak, Brenda Milner,
Mónica Rosselli, Esther Strauss, and all the women who have paved the way. Thank you.

Prologue
This dissertation consists of three related, but distinct manuscripts designed to expand the
selection of robust psychometric tools for the assessment and screening of intelligence in Latin America.
This work stems from my experiences while doing a research consulting internship for three months in
Colombia. The psychologists and researchers I came to know there were eager to have more
theoretically and empirically supported assessment resources, developed specifically for the populations
they work with, and adaptive to the unique problems they regularly encounter. Through my exposure to
Latin American psychometrics, I came to better appreciate the disparity between the amount of quality
assessment resources that exist for English-speaking populations (particularly in the United States and
Europe) versus for non-English-speaking populations. In facing this “cultural neuropsychology gap” with
my colleagues, I was driven to ask what could be done now to start pragmatically addressing this
problem. The three manuscripts forming this dissertation represent my ideas and efforts to make a
small contribution in helping narrow that gap.
Historically, intelligence assessment lies at the heart of all contemporary psychometrics and
remains one of the most widely evaluated constructs within the fields of psychology and
neuropsychology, with the Wechsler Intelligence Scales among the most popular set of intelligence
assessment instruments around the world. Thus, I decided to focus the scope of this research to
intelligence assessment in Latin America using the Wechsler Intelligences Scales. The first paper
provides a clinical decision-making framework in a cross-cultural assessment situation and demonstrates
the effects of applying different sets of intelligence norms. The second paper empirically evaluates the
replicability of alternate factor structure models that have been well validated in United States and
European populations (including the Cattell-Horn-Carroll theory of intelligence). The third paper derives
intelligence screening tools aimed at meeting the urgent need for additional assessment instruments in
Latin America.

2
Together, these papers form a cohesive collection of empirical research related to helping fill
the cultural neuropsychological assessment gap, particularly for Latinx populations. Of note, the first
chapter uses the term Hispanic instead of Latinx, which is favored in rest of the manuscript and is a
more accurate term reflecting the sociocultural contexts discussed herein. This shift in terminology
corresponds to the chronology of the manuscripts as well as broader ongoing sociocultural change that
has become more evident to me through the writing of this dissertation. The three chapters are inter-
related in that their findings inform each other, but they are largely standalone research contributions
(written for individual submissions for publication), each with specific aims, methods, conclusions, and
limitations. As a result, the autonomous nature of the articles introduces some redundancies within the
dissertation including the reviewed literature and, to a lesser extent, the individual discussions and
conclusions provided. However, the manuscripts are written to complement one another and to
contribute to current and future research pertaining to the assessment of Latinx individuals in the
Americas.

3
Chapter 1. Contributing Towards a Cultural Neuropsychology Assessment Decision-Making Framework:
Comparison of WAIS-IV Norms from Colombia, Chile, Mexico, Spain, United States, and Canada*
*Manuscript published under the following citation: Duggan, E. C., Awakon, L. M., Loaiza, C. C., & Garcia-Barrera, M. A. (2018). Contributing towards a cultural neuropsychology assessment decision-making framework: Comparison of WAIS-IV norms from Colombia, Chile, Mexico, Spain, United States, and Canada. Archives of Clinical Neuropsychology, online first. doi:10.1093/arclin/acy074 All work in this chapter was conceived of and carried out by me, with the exception of some contributions colleagues who assisted with aspects of data collection and management (see acknowledgments) and the critical feedback incorporated into the execution of some analyses and the writing of this manuscript by Mauricio Garcia-Barrera and my other committee members.

4
Abstract
Objective: Test and normative data selection in cross-cultural neuropsychology remain a complex issue.
Despite growing awareness, more studies and instruments are needed to adequately address the impact
of cultural factors, such as quantity and quality of education. In this study, we examine the interpretive
effects of applying six relevant WAIS-IV norms to a Colombian sample. Method: A sample of 305 highly
educated Colombian corporate executives completed the WAIS-IV. Data were scored using norms from
Colombia, Chile, Mexico, Spain, United States, and Canada and scores were compared using ANOVA.
Additionally, a comparative sociodemographic framework was established to contextualize our sample
to the standardization samples and populations of the six countries. Results: Colombian and Chilean
norms yielded systematically similar FSIQ/Index scores (mean range=117-121), while incrementally
lower scores were found with norms from Mexico (-3-9 points), Spain (-3-11 points), United States (-8-13
points), and Canada (-11-18 points). Verbal scores differed, with highest scores obtained with Mexican
and Spanish norms. Working memory and processing speed scores had the lowest score agreement
across norms. Conclusions: Although the Chilean norms are more frequently used in Colombia, the
recently developed Colombian norms appear optimal for our sample; the scores do not have meaningful
differences with those obtained with Chilean norms and offer local population representation fidelity.
Mexican, Spanish, United States, and Canadian norms underestimated WAIS-IV scores and distorted the
sample’s score distribution. Finally, verbal scores highlight potential education representation within
Spanish and Mexican norms, while working memory and processing speed scores suggest cultural
nuances likely captured within different norms.
Keywords: Intelligence; Assessment; Cross-cultural/minority; Norms/normative studies

5
Introduction
With increasing globalization, there has been growing concern amongst neuropsychologists regarding
best cross-cultural assessment practices (Cagigas & Manly, 2014; Hambleton, Merenda, & Spielberger,
2005). One area of rapid development has been the field of Hispanic neuropsychology, which has not
only been tied to changing immigration patterns, but also professional and cultural collaborations
throughout North and Latin America (Puente & Ardila, 2000; Puente, Perez-Garcia, Vilar Lopex, Hidalgo-
Ruzzante, & Fasfous, 2013). A number of ethical and practice guidelines and standards providing
recommendations for assessment practices with culturally diverse populations have been put forth
(American Educational Research Association, American Psychological Association [APA], & National
Council on Measurement in Education, 2014; APA, 2003, 2017; Clauss-Ehlers, Chiriboga, Hunter, &
Roysircar, 2019; see also Suzuki & Ponterotto, 2008; Uzzell, Ponton, Ardila, 2007) and the professional
and ethical obligation to develop competency in cross-cultural assessment, including consideration of
cultural and sociodemographic factors and use of appropriate norms, has been widely discussed in the
literature (Boone, Victor, Wen, Razani, & Pontón, 2007; Brickman, Cabo, & Manly, 2006; Judd et al.,
2009; Rivera Mindt, Byrd, Saez, & Manly, 2010). Despite this, a recent study found that almost 40% of
psychologists surveyed do not use any multicultural assessment theories or frameworks in their
assessments, and many clinicians omit basic strategies such as consulting the literature on a client’s
cultural background (Edwards, Burkard, Adams, & Newcomb, 2017). Further, a survey of
neuropsychologists who provide services to Hispanic populations found that most are not adequately
prepared and lack the appropriate tools to work with this population (Echemendia & Harris, 2004;
Echemendia, Harris, Congett, Diaz, & Puente, 1997). These results speak to potential barriers in
translating cross-cultural assessment theory into day-to-day practice.
Several barriers appear to affect the implementation of effective cross-cultural assessment.
First, education and supervision appear to be a significant factor. Edwards et al. (2017) found that

6
younger clinicians tend to incorporate more multicultural assessment approaches in their work, which
they suggest is likely a function of changing accreditation standards. Another barrier may simply be a
scarcity of assessment resources to put cross-cultural information to meaningful use. In fact, North
American neuropsychologists report lack of appropriate normative data as a leading barrier to
multicultural assessment (Elbulok-Charcape, Rabin, Spadaccini, & Barr, 2014). Similarly, Latin American
and Spanish neuropsychologists report lack of norms for their respective countries as a top barrier
affecting their neuropsychological assessments (Arango-Lasprilla, Stevens, Morlett Paredes, Ardila, &
Rivera, 2017; Fernandez, Ferreres, Morlett-Paredes, Rivera, & Arango-Lasprilla, 2016; Fonseca-Aguilar et
al., 2015; Olabarrieta-Landa et al., 2016). Further, when conducting culturally informed assessments,
clinicians routinely encounter scenarios that fall within the gray-area of ethical standards and practice
guidelines and psychometric resources often force clinicians to make assumptions or prioritize some
sociodemographic variables over others (e.g., age, sex, education, primary language, native language,
country of origin, and country of residence). These factors likely add to the self-reports of clinicians
feeling ill-equipped to adequately address complexity of these cases (Echemendia et al. 1997; Edwards
et al., 2017; Elbulok-Charcape et al., 2014; Fernandez et al., 2016; Fonseca-Aguilar et al., 2015;
Olabarrieta-Landa et al., 2016).
Sources of Cross-Cultural Differences and Hispanic Neuropsychology
Despite the challenges associated with cross-cultural assessment, many resources are available
to help guide clinicians in the use of multicultural frameworks and understanding which factors may be
more relevant than others (Dana, 2005; Hays, 2016; Ridley, Tracy, Pruitt-Stephens, Wimsatt, & Beard,
2008). Overall, education is a key sociodemographic variable that contributes to neuropsychological
performance and normative data differences (Lezak, Howieson, Bigler, & Tranel, 2012; Lynn, Fuerst, &
Kirkegaard, 2018). Within Hispanic neuropsychology, substantial educational effects on
neuropsychological test performance among English and Spanish-speaking individuals have been well

7
documented in the literature (Abad, Sorrel, Roman, & Colomn, 2016; Acevedo et al., 2007; Ardila, 1998;
Ardila, Ostrosky-Solís, Rosselli, & Gómez, 2000; Cavé, 2008; Pontón & Ardila, 1999; Renteria, Li, & Pliskin,
2008). For example, in a sample of Spanish-speaking foreign-raised older adults living in the United
States, education was the most influential sociodemographic variable on neuropsychological test scores.
Specifically, Acevedo, Loewenstein, Agrón, and Duara (2007) report lower levels of education (3-8 years)
were associated with significantly worse test performance. Comparatively, age, gender, age of arrival in
the United States, proportion of lifetime residence in the United States, acculturation, and depression
had limited effects (Acevedo et al., 2007). Quality of education—known to vary greatly between and
within countries— is also associated with neuropsychological test performance, such that poorer
education results in lower test scores (Llorente, 2007; Puente et al., 2013). In a study of young adults in
Chile, there were no Wechsler Adult Intelligence Scale—Fourth Edition (WAIS-IV; Wechsler, 2013)
differences among rural residents with basic, medium, or high levels of education, nor were there
differences between rural and urban residents with basic education. However, urban residents with
medium or higher levels of education had better WAIS-IV performance across indices and full-scale
intelligence quotient (FSIQ; Fuica et al., 2014).
In addition to education, other cultural influences and values substantially impact
neuropsychological assessment (Ardila, 2005). For instance, at least two studies have found no effects of
education on neuropsychological test performance in low education (Guerroer-Berroa et al., 2016) and
education-matched samples (LaRue, Romano, Ortiz, Liang, & Lindeman, 1999) from different Latin
American regions. Although a growing literature investigates neuropsychological test performance
among Spanish speaking immigrants in the United States, we must be aware of heterogeneity and
United States Spanish-speaking immigrants may not be representative of broader cultural groups
(Llorente, Pontón, Taussig, & Satz, 1999; Pontón & Ardila, 1999). As such, determining which norms to
apply within the multicultural assessment context may not always be an easy decision. For example,

8
comparison of a highly-educated individual in a Spanish-speaking country to a low education normative
group from the same country may not be appropriate. Similarly, comparison of a Spanish-speaking
individual from one country to Spanish-speaking individuals from another country may also be
inappropriate (Buré-Reyes et al., 2013). All together, these findings underscore the importance of cross-
cultural research aimed at improving testing practice.
Cross-Cultural Intelligence Assessment and Hispanic Neuropsychology
One of the most widely used assessment instruments in the world is the Wechsler Adult
Intelligence Scale (WAIS; Rabin, Paolillo, & Barr, 2016; Ready & Barnett Veague, 2014). Now in its fourth
edition, the WAIS-IV (Wechsler, 2008b, 2008c) has been adapted into more than 25 different cultural
versions (Pearson Clinical, 2019). In general, the WAIS-IV family of instruments has been noted to
feature many psychometric improvements over prior versions of the WAIS, including improved factor
analytic evidence and scores but less affected by ethnicity (but more by education) than the WAIS-III
(Weiss, Saklofske, Coalson, & Raiford, 2010; Whipple Drozdick, Wahlstrom, Zhu, & Weiss, 2012). Given
the prolific cross-cultural development of the WAIS and other assessment instruments, understanding
sociodemographic normative sample differences is a critical component of cross-cultural assessment
practices. While selection of incongruous norms affects accuracy and applicability (Bender, García, &
Barr, 2010), clinicians recognize that a specific set of norms may not best reflect a person’s cultural
demographics (e.g., amount and quality of education), despite nationality and recommendations from
the APA (2017). This issue has been widely discussed in the context of the WAIS-III and IV in South
Africa, where it has been debated if it would be more suitable to use United States or United Kingdom
norms for the minority of individuals with significant educational advantage over the general population
(e.g., those with access to private, European or North American style education; Shuttleworth-Edwards,
2016; Shuttleworth-Edwards, 2017; Shuttleworth-Edwards, Gaylard, & Radloff, 2013; Shuttleworth-
Edwards, Kemp, Rust, Muirhead, Hartman, & Radloff, 2004; Suchy, 2016; Sunderaraman, Zahodne, &

9
Manly; 2016; Taylor, 2016; Wicherts, 2016). A lack of consensus on how to deal with these gray-areas
involving so-called educationally or culturally advantaged individuals speaks to the difficulty surrounding
decision-making within cross-cultural neuropsychological assessment and the likely complex and
multifactorial approach it will take to arrive at a solution.
Unfortunately, studies investigating the interpretation effects of applying different WAIS-IV
norms to cross-cultural populations are surprisingly uncommon, with a large proportion relating to the
use of the WAIS-IV in South Africa, and nearly all the rest comparing English versions of the WAIS-IV with
one another (e.g., United States and Canada; Wechsler, 2008d; 2008e). Overall, this research has
supported the generality of the construct validity of the WAIS-IV across United States and Canadian
samples, but also reiterates the importance of local norms (Bowden, Saklofske, & Weiss, 2011; Harrison,
Armstrong, Harrison, Lange, & Iverson, 2014; Iverson, Lange, Viljoen, 2006). For example, scores on the
WAIS-III and WAIS-IV are higher in the Canadian standardization sample than the United States sample
(Bowden et al., 2008; Bowden et al., 2011). Comparatively, the Canadian WAIS-IV sample has a mean
FSIQ (104.5) slightly higher than the British WAIS-IV sample (102.5), both of which are slightly higher
than the United States WAIS-IV sample (100; Dutton & Lynn, 2014). These differences are thought to
represent sociocultural effects, rather than true IQ differences. For example, cultural factors, such as
education differences and test-taking attitudes appear to drive American and European (British, Finnish,
French, German, and Spanish) cross-national test profile differences on the WAIS-R and III (Roivainen,
2010).
The largest body of research investigating the use of the WAIS in Spanish-speaking populations
has centered around the earlier third edition, the WAIS-III (Wechsler, 1997) and three of its Spanish
versions, including those from Puerto Rico (EIWA-II-PR; Wechsler, 2008a), Spain (WAIS-III-S; Wechsler,
2001), and Mexico (WAIS-III-M; Wechsler, 2003). Overall, research has consistently shown the English-
version of the WAIS-III risks overestimating deficits and is not adequately standardized for use in
10
Spanish-speaking populations. Further, the Spanish-language versions of the WAIS-III generally risk
underestimating deficits and have validity concerns (Funes, Hernandez Rodriquez, & Lopez, 2016;
Maldonado, & Geisinger, 2005; Renteria, et al., 2008; Thaler & Jones-Forrester, 2013). In general,
practitioners and researchers tend to view the WAIS-III and its corresponding Spanish-language versions
as historically informative to cross-cultural assessment; however, they caution against its continued use
(Llorente, 2007). Current Spanish-versions of the WAIS-IV include those for Spain (Wechsler, 2012a),
Mexico (Wechsler, 2014a), Chile (Wechsler, 2013), and just recently Colombia (Wechsler, 2016). Aside
from the validation studies for these instruments, very little research has examined the use of the WAIS-
IV in Spanish-speaking populations, particularly outside of North America, and no studies to our
knowledge have directly compared the interpretive effects of Spanish versions of the WAIS-IV with other
Spanish and English versions of the WAIS-IV.
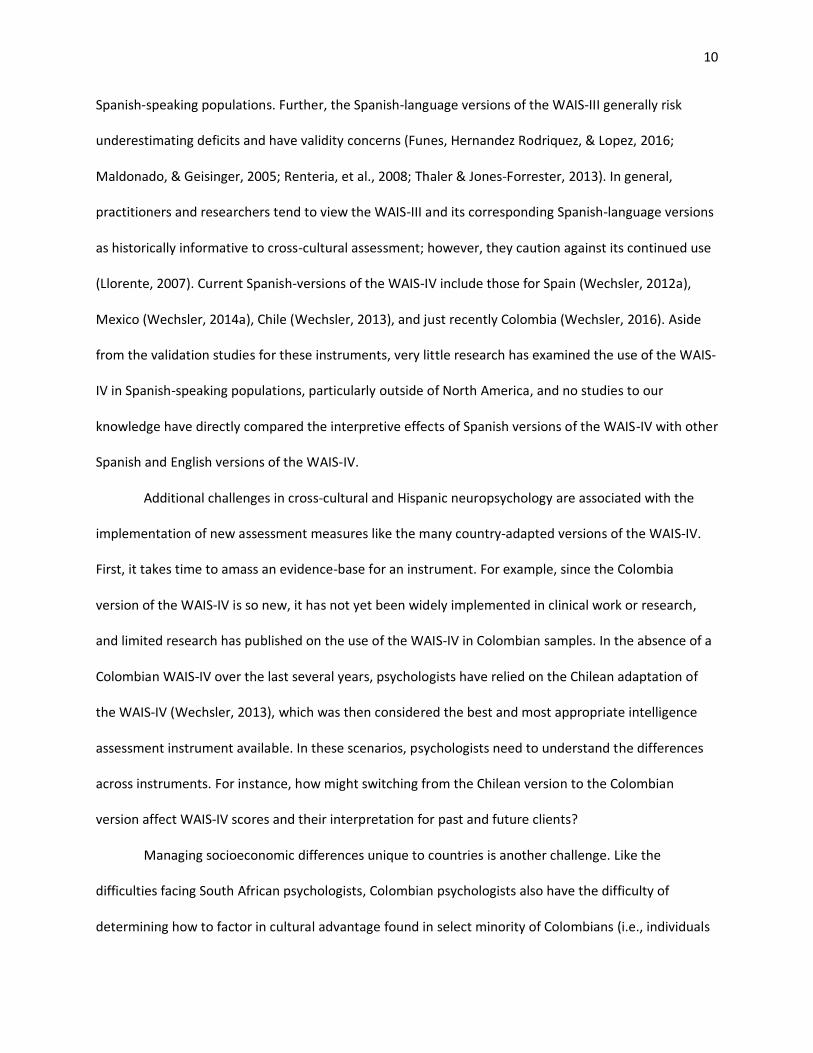
Additional challenges in cross-cultural and Hispanic neuropsychology are associated with the
implementation of new assessment measures like the many country-adapted versions of the WAIS-IV.
First, it takes time to amass an evidence-base for an instrument. For example, since the Colombia
version of the WAIS-IV is so new, it has not yet been widely implemented in clinical work or research,
and limited research has published on the use of the WAIS-IV in Colombian samples. In the absence of a
Colombian WAIS-IV over the last several years, psychologists have relied on the Chilean adaptation of
the WAIS-IV (Wechsler, 2013), which was then considered the best and most appropriate intelligence
assessment instrument available. In these scenarios, psychologists need to understand the differences
across instruments. For instance, how might switching from the Chilean version to the Colombian
version affect WAIS-IV scores and their interpretation for past and future clients?
Managing socioeconomic differences unique to countries is another challenge. Like the
difficulties facing South African psychologists, Colombian psychologists also have the difficulty of
determining how to factor in cultural advantage found in select minority of Colombians (i.e., individuals

11
with disproportionately high socioeconomic resources, including access to private compulsory education
that differs substantially from public compulsory education). In this context, Colombian
neuropsychologists may be tempted to use alternate norms for this select minority, but there are no
resources available to help them understand the norm differences between the Colombian WAIS-IV and
other Spanish-speaking nations in North America (i.e., the Mexican WAIS-IV; Wechsler, 2014a) and in
Europe (i.e., the Spanish WAIS-IV; Wechsler, 2012a), as well as widely used and researched English
versions including the United States WAIS-IV (Wechsler, 2008b) and the Canadian WAIS-IV (Wechsler,
2008d).
Current Study
The present study used WAIS-IV data from a Colombian sample of highly-educated and high-
achieving adults to investigate several key issues pertaining to norm selection within cross-cultural and
Hispanic neuropsychology. Specifically, the interpretive effects of applying different WAIS-IV norms
potentially applicable to this culturally advantaged population were compared. Based on multicultural
assessment guidelines (American Educational Research Association, American Psychological Association
[APA], & National Council on Measurement in Education, 2014; APA, 2003, 2017), a study-appropriate
framework was established and key sociodemographic data and resources from the literature were
compiled. Thus, this framework was used to contextualize results. Overall, the two main goals of this
study were to generate practical resources for clinicians working in the field of Hispanic
neuropsychology, and to contribute to research designed to help bridge the gap between theory and
practice within cross-cultural neuropsychology more broadly.
Methods
In determining the appropriateness of a given set of norms for an individual or group, first a context
must be established (Hays, 2016). That is, how well is the present sample of Colombian executives
represented by their country-specific norms or potentially other relevant normative samples? To

12
address this issue, multiple levels of information, as follows, were integrated to provide a functional
cultural contextualization.
Considering the Colombian Context
Colombia is the third largest Spanish-speaking country in the world, behind Mexico and the
United States (Instituto Cervantes, 2015), and is comprised of immense ethnic and cultural diversity.
While the development of Colombia and its citizens has been greatly affected by conflict, particularly
from the 1960s to the 1990s, the country is now characterized by improved political stability and
increasing economic growth. Clinicians working with individuals from Colombia, therefore, must be
aware that Colombians can differ drastically in terms of quantity and quality of education received,
socioeconomic status (SES), and the broader sociopolitical climate of the country during their upbringing
and development (cf. LeGrand, 2003 for a brief overview and LaRosa & Mejía, 2017 for a more
comprehensive overview of pertinent issues and factors to consider). Although beyond the context of
this paper, it is worth noting that substantial effort was put into developing awareness and
understanding of these factors and considering the broader Colombian context throughout this study.
Participants
Data was collected from a sample of 305 professionals occupying executive positions within a
large multinational corporation headquartered in Cali, Colombia. Approximately 65% of the participants
currently hold strategic/tactic positions within the corporation, while the remaining participants are a
select group of trainees who aspire to occupy strategic/tactic positions in the future. Individuals hired
into these positions typically occupy higher socioeconomic levels and have received high quality
education through at least the post-secondary level (e.g., private schools modeled on North American or
European systems). History of significant neurologic or psychiatric conditions is unknown and not within
the corporation’s purview; however, given the functional status of these participants, any substantial
presence neurologic or psychiatric history affecting the results and interpretation of this study is

13
unlikely. All data was collected under a built-in contractual agreement with their employees that
includes stipulations for regular internal assessments. The purpose of the company’s internal
assessments is to identify strengths and weaknesses to inform programs aimed at strengthening the
cognitive and behavioral conditions of company professionals. In this context, employees were invited
to participate in our study and a written informed consent for the use of their deidentified data in this
study was obtained from all participants and approved by the Human Research Ethics Board at the
University of Victoria (Protocol Number 16-244). All participants are Colombian natives, with Spanish as
their first and primary language. A demographic summary of the participants is provided in Table 1.1.
Measures and Establishing a Comparative Framework
All participants were administered the entire (core and supplementary) WAIS-IV (Wechsler,
2013) by a team of trained, native Spanish-speaking administrators, in accordance with standardized
practice. Given the aims of this paper to investigate the interpretive effects of applying WAIS-IV norms
that could potentially be applicable to our atypical Colombian sample, we chose six sets of WAIS-IV
norms to use in our research. First, we chose the Colombian WAIS-IV norms, as per APA guidelines,
these would be the most applicable to our sample. Second, we chose the Chilean WAIS-IV norms,
because these are the norms that have been used throughout Colombia prior to the recent release of
the Colombian WAIS-IV. Additionally, Chile and Colombia share many sociocultural, economic, and
historic similarities. Next, we chose two additional sets of norms derived from Spanish-speaking
populations, one from North America – the Mexican WAIS-IV, and one from Europe – the Spanish WAIS-
IV. In theory, these normative groups could encompass some cultural and educational aspects unique to
our sample of Colombian executives. Finally, we chose two sets of norms derived from primarily English-
speaking populations: the United States WAIS-IV and Canadian WAIS-IV. These normative groups were
selected based on their potential educational similarities with our sample. Additionally, since most of
the literature comparing interpretive effects of applying different sets of WAIS norms has used the

14
United States and Canadian norms, including them in our present research provides a good benchmark
to help compare our research to the current literature. Descriptive information for these normative
samples is briefly summarized below and in detail in Table 1.4.
The (United States) WAIS-IV. The WAIS-IV (Wechsler, 2008b; 2008c) is the most widely used
intelligence assessment instrument for individuals 16-90 years old and is the mother instrument for all
other cultural adaptations of the WAIS-IV. It includes 10 core and 5 supplemental subtests and yields a
full-scale IQ (FSIQ) and 4 index scores (verbal comprehension index, VCI; perceptual reasoning index,
PRI; working memory index, WMI, and processing speed index, PSI). The WAIS-IV was standardized with
a sample 2,200 individuals selected to represent the 2005 United States Census. It was stratified across
13 age-bands along with sex, ethnicity (white, African American, Hispanic, Asian, or “other”), education
attainment of self (for ages 20-90) or parents (for ages 16-19; four levels ranging from no education to
tertiary education), and geographic region (North East, Mid-West, South, and West).
The Canadian WAIS-IV. The Canadian version of the WAIS-IV (Wechsler, 2008d; 2008e) was
adapted from the original WAIS-IV (Wechsler, 2008b) and it includes the same subtests, items, and score
structure with only minor cultural adaptations in item content/scoring. It was standardized with a
Canadian, English-speaking sample (ages 16-90) of 668 individuals selected to represent the 2006
Canadian Census. Like the original WAIS-IV, the sample was stratified across 13 age-bands along with
age, sex, ethnicity (Caucasian, Asian, First Nations, and “other”), education of self (for ages 20-90) or
parents (for ages 16-19; four levels ranging from ‘incomplete secondary education’ to ‘university degree
or greater’), and geographic region (West, Central, and East; Wechsler, 2008d).
The Spanish WAIS-IV. The Spanish version of the WAIS-IV (Wechsler, 2012a, 2012b) was the first
published Spanish-language adaptation of the WAIS-IV (Wechsler, 2008b). Like the WAIS-IV, it includes
the same subtests, items, and score structure as the WAIS-IV with only minor item content/scoring
adaptations to adjust for language and culture. It was standardized in a representative sample of 1,002

15
Spanish-speaking Spaniards ages 16-90 years stratified across 10 age-bands based on the Spanish
census. Norms were also stratified based on educational attainment level (ranging from “no education”
to “tertiary education”) and community characteristic (i.e., urban, suburban, or rural).
The Mexican WAIS-IV. The Mexican version of the WAIS-IV (Wechsler, 2014a) is an adaptation
of the Spanish WAIS-IV (Wechsler, 2012a) for the Mexican population. It includes the same subtests,
items, and score structure as the Spanish WAIS-IV (and thus, the WAIS-IV) with only minor cultural
adaptations to item content/scoring. The Mexican WAIS-IV standardization sample included 1,450
Mexican, Spanish-speaking individuals, ages 16-90 years, reflective of the Mexican population according
to the 2010 Mexican census (INEGI, 2010). The normative sample was stratified across 13 age-bands,
geographic region, and education; however, the technical manual provides little education information
about the normative sample.
The Chilean WAIS-IV. The Chilean version of the WAIS-IV (Wechsler, 2013) is a Chilean
adaptation of the Spanish WAIS-IV (Wechsler, 2012a). It includes the same subtests, items, and score
structure as the Spanish WAIS-IV (and thus, WAIS-IV) with only minor cultural adaptations to item
content/scoring. It was standardized in a sample of 887 Chilean, Spanish-speaking individuals
representative of the general Chilean population (Census information not provided) and stratified by 13
age-bands as well as sex, geographic region, and an education proxy variable. More specifically, the
sample was stratified into three socioeconomic levels based on the country’s socioeconomic
stratification systems ranging from 1 to 6 (strata 1-2=low, strata 3-4=middle, strata 5-6=high). Using this
system and its high correlation with educational attainment, education was approximated with
socioeconomic level. Thus, low socioeconomic status approximately comprises individuals with <8 years
of formal education, middle socioeconomic status comprises mostly individuals with 9-17 years of
formal education (advanced basic education and some technical study), and high socioeconomic status

16
comprises mainly individuals with a completed undergraduate degree or more (approximately >18 years
of formal education; Rosas et al., 2014).
The Colombian WAIS-IV. As with the Mexican and Chilean versions of the WAIS-IV, the
Colombian WAIS-IV (Wechsler, 2016) is a Colombian adaptation of the Spanish WAIS-IV (Wechsler,
2012a), that includes the same subtests, items, and score structure as the WAIS-IV-Es (and thus, the
WAIS-IV) with only minor cultural adaptations to item content/scoring. It was standardized with a
Colombian, Spanish-speaking sample of 156 individuals purportedly representative of the general
Colombian population (Census information not provided) and stratified by 13 age-bands along with sex,
geographic region, and the same socioeconomic-education proxy variable as in the Chilean sample
based on the identical Colombian socioeconomic strata system (R. Rosas, personal communication, June
1, 2017). Of note, no technical manual for the Colombian WAIS-IV or any other related research has
been published to the authors’ knowledge as of the date of this paper.
Analyses
Descriptive statistics for the present sample of 305 Colombian executives were calculated,
including age, sex, and education. In Colombia, ethnicity is not a construct readily discussed or
measured; therefore, participants’ ethnicity was not surveyed as it would not be a meaningful or
accurate question to ask. Qualitative ethnicity information, however, is reported in our results (cf.
Cadavid-Ruiz, del Río, Egido, & Gallindo, 2016 and DANE, 2007 for an example of how demographic
variables are typically treated in a Colombian sample). Sociodemographic characteristics for the six
WAIS-IV normative groups were compiled from their manual and technical documentation (Rosas et al.,
2014; Wechsler, 2008b, 2008c, 2008d, 2008e, 2012a, 2012b, 2013, 2014, 2016). The most up-to-date
country level sociodemographics available were compiled from multiple high quality population
statistics recourses (Instituto Cervantes, 2016; UNESCO Institute for Statistics, 2012, 2017; World Bank,
2017, World Economic Forum, 2017-2018). All sociodemographics were converted into the same scale

17
or units to facilitate comparisons. For example, all educational data is reported using the International
Standard Classification of Education (ISCED; UNESCO Institute for Statistics, 2012). Sample-level
sociodemographics are reported in Table 1.1, country-level sociodemographics are reported in Tables
1.2 and 1.3, and WAIS-level sociodemographics are reported in Table 1.4.
WAIS-IV scores including subtest scaled scores, indices (VCI, PRI, WMI, and PSI) and FSIQ for
each of the 305 Colombian executives were calculated six times, using the selected country norms from
Colombia, Chile, Mexico, Spain, United States, and Canada. This yielded six sets of scores for each
participant, which were then compared using repeated measures analysis of variance (ANOVA). In cases
in which the assumption of sphericity was violated, the Greenhouse-Geisser correction was used and
multivariate tests (general linear model) were reported. Significance was set at p <.05 and effect sizes
for overall comparisons are reported using partial eta squared ( 2). All analyses were followed up with
post-hoc comparisons that included simple within-subjects contrasts of the effect of Colombian against
the other five select country norms as well as comprehensive pairwise comparisons (all norms against all
other norms based on estimated marginal means), adjusted using the Bonferroni correction. Effect sizes
(r) for simple within-subjects contrasts between scores obtained with Colombian norms and the other
five select countries (r = √ (F(1,dfR)/ (F(1,dfR)+dfR))) are also reported, with effect sizes greater than 0.50
classified as high, 0.30 to 0.49 as medium, and less than 0.30 as low (Cohen 1988). Note that effect sizes
could only be calculated for comparisons against Colombian norms due to the selected post-hoc
analyses which protectively restrict the numbers of statistical tests computed. Percent agreement
between scores calculated with the Colombian norms and the five other normative systems (Chile,
Mexico, Spain, United States, and Canada) was calculated using three criteria: (1) percent within 1/3 of a
standard deviation (SD; i.e., ± 5 points for FSIQ/Index scores and 1 point for subtest scores), (2) percent
within the same descriptive classification level (i.e., ranging from very low to very superior for
FSIQ/Index scores, and low-to-high for subtest scores; Wechsler, 2008b), and (3) percent within 1/3 SD

18
or within one classification level. All statistics were calculated using Microsoft Excel and SPSS Statistics
Version 24 (IBM, 2017).
Results
Sample Characteristics
As reported in Table 1.1, the sample comprised a nearly even amount of men and women (52%
and 48%, respectively) with a mean age of 34 years. Although the age range is wide (ranging from 20 to
68), 44% are between ages 20-30 and 53% are between the ages of 30 and 55. Using the ISCED, just over
half of the sample has some graduate education (54%) and the remainder has education falling between
completed secondary school and a Bachelor’s degree (46%). Only one individual (0.33%) completed
compulsory education. Data on education quality were unavailable; however, many individuals in
Colombia who pursue higher education traditionally come from higher socioeconomic levels and based
on internal company information, approximate SES for most of the sample likely falls between SES strata
3-6 (i.e., middle to high SES). Although ethnicity is not a highly relevant construct to measure according
to North American perceptions, we can report general information. According to the most recent
Colombian census, the three primary ethnic categories are “no-ethnicity” (including white and mestizo,
86%), afrocolombian (11%), and indigenous (3%; DANE, 2007). In Valle del Cauca, the region where our
sample is situated, ethnic group representation is similar: 72% no ethnicity, 27% afrocolombian, and
0.6% indigenous (DANE, 2007). Qualitatively, most our sample would fall into the “no-ethnicity”
category, mostly identifying as white or mestizo.
Sample Characteristics in Relation to Country-Specific Sociodemographic Information
Tables 1.2 and 1.3 provide relevant country-level education and socioeconomic statistics for
Colombia, Chile, Mexico, Spain, United States, and Canada. The World Bank (2017) estimates that on
average, Colombian adults have 9.35 years of education. Further, according to the UNESCO Institute for
Statistics (2017) about 16.3% of the adult Colombian population has a bachelor’s level of education, and
19
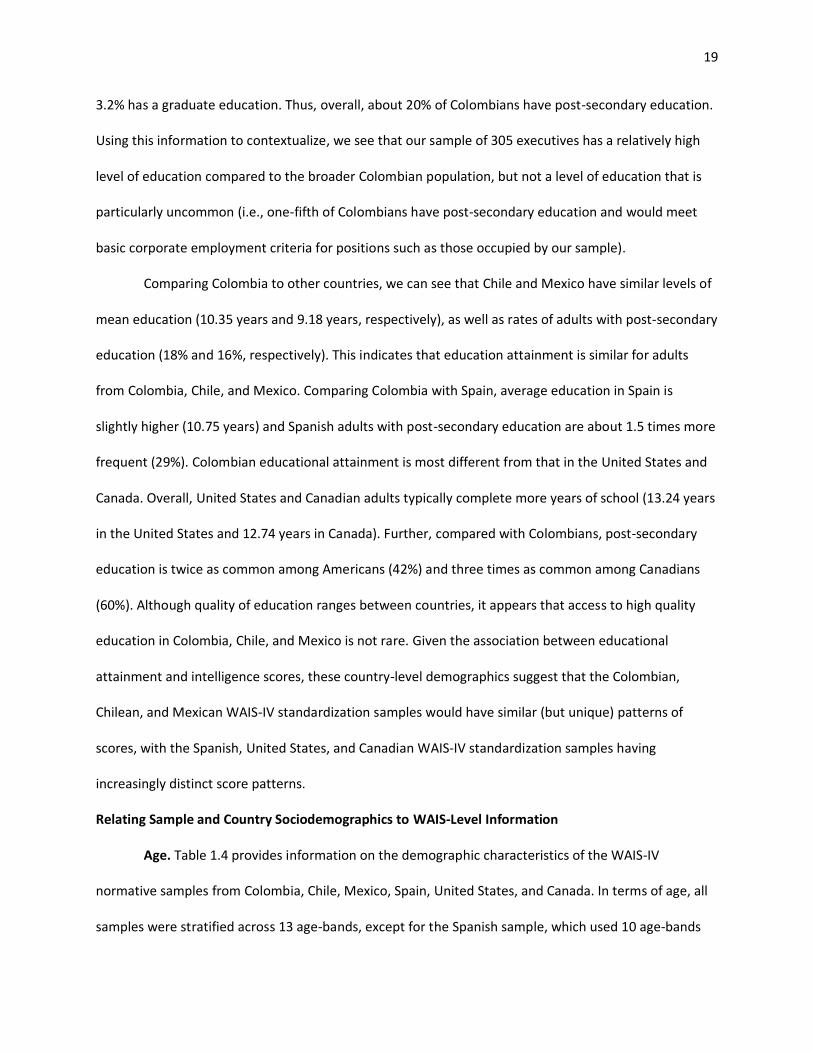
3.2% has a graduate education. Thus, overall, about 20% of Colombians have post-secondary education.
Using this information to contextualize, we see that our sample of 305 executives has a relatively high
level of education compared to the broader Colombian population, but not a level of education that is
particularly uncommon (i.e., one-fifth of Colombians have post-secondary education and would meet
basic corporate employment criteria for positions such as those occupied by our sample).
Comparing Colombia to other countries, we can see that Chile and Mexico have similar levels of
mean education (10.35 years and 9.18 years, respectively), as well as rates of adults with post-secondary
education (18% and 16%, respectively). This indicates that education attainment is similar for adults
from Colombia, Chile, and Mexico. Comparing Colombia with Spain, average education in Spain is
slightly higher (10.75 years) and Spanish adults with post-secondary education are about 1.5 times more
frequent (29%). Colombian educational attainment is most different from that in the United States and
Canada. Overall, United States and Canadian adults typically complete more years of school (13.24 years
in the United States and 12.74 years in Canada). Further, compared with Colombians, post-secondary
education is twice as common among Americans (42%) and three times as common among Canadians
(60%). Although quality of education ranges between countries, it appears that access to high quality
education in Colombia, Chile, and Mexico is not rare. Given the association between educational
attainment and intelligence scores, these country-level demographics suggest that the Colombian,
Chilean, and Mexican WAIS-IV standardization samples would have similar (but unique) patterns of
scores, with the Spanish, United States, and Canadian WAIS-IV standardization samples having
increasingly distinct score patterns.
Relating Sample and Country Sociodemographics to WAIS-Level Information
Age. Table 1.4 provides information on the demographic characteristics of the WAIS-IV
normative samples from Colombia, Chile, Mexico, Spain, United States, and Canada. In terms of age, all
samples were stratified across 13 age-bands, except for the Spanish sample, which used 10 age-bands

20
(as reflected in Tables 1.4 as well as for our sample in Table 1.1). Our sample has almost no people in the
lower- and upper-most age-bands; however, the sample is well distributed across the remaining groups.
For the Colombian WAIS-IV standardization sample, all age-bands contained the same number of
individuals. The Chilean, Mexican, Spanish, United States, Canadian samples were well-represented
across the age-bands and based on census figures, though representation proportions were determined
using varying methods. While difficult to make comparisons, the age range of our sample is adequately
represented in each of the six WAIS-IV normative samples.
Education. WAIS-IV normative samples differed in terms of representation of education. In the
Colombian and Chilean WAIS-IV samples, education was not measured directly, but instead
approximated through a SES variable – economic stratification level (strata), ranging from 1 to 6, which
is strongly associated with education attainment (Buchmann & Hannum, 2001). Thus, the Chilean and
Colombian WAIS-IV research teams approximated education by approximating low SES individuals
(strata 1-2) to have 8 years of education or less, medium SES individuals (strata 3-4) to have
approximately 9-17 years of education, and high SES individuals (strata 5-6) to have more than 17 years
of education. These normative samples were evenly distributed across the SES groups (i.e., 33% low,
33% medium, and 33% high). After converting all data into ISCED units where ISCED 0-3 = high school
education or less and ISCED 4-8 = post-secondary education and beyond, the Colombian WAIS-IV
standardization sample comprises 67% falling with ISCED 0-3 and 33% within ISCED 4-8. At the country
level (Table 1.3), 80% of education rates fall within ISCED 0-3 and 20% within ISCED 4-8. The statistics
are nearly identical for Chilean WAIS-IV and country level education rates: WAIS-IV ISCED 4-8 = 33% and
country ISCED 4-8 = 18%. This suggests that higher levels of education (post-secondary and beyond) are
overly represented in the Colombian and Chilean WAIS-IV standardization samples. Likewise, these
figures indicate over representation of the education level (proxy socioeconomic level) of our sample
within the Colombian and Chilean WAIS-IV standardization samples.

21
Little information for the Mexican WAIS-IV standardization sample beyond a census reference
was provided (INEGI, 2010); however, of most people without compulsory education, most left school
during the high school years (9-11 years of education total). Without the precise figure, it is not clear
how well population rates of education in Mexico are represented by the Mexican WAIS-IV norms, or
how well education rates within our sample may be reflected in the Mexican WAIS-IV norms, other than
to say that very low rates of education are likely not overrepresented. At the population level, 83% fall
within ISCED 0-3 and 16% within ISCED 4-8.
The Spanish WAIS-IV standardization sample was stratified on four levels: no education, primary
education, secondary education, and tertiary education, with 90% of the sample having compulsory
education or less (ISCED 0-3) and 9% with education beyond compulsory levels (ISCED 4-8). Education
rates at the country level (Table 1.3) are markedly different, with 70% within ISCED 0-3 and 30% within
ISCED 4-8. This indicates that population levels of higher education are potentially underrepresented
within the Spanish WAIS-IV norms. Further, this information also suggests the education level of our
sample is likely underrepresented within the Spanish WAIS-IV norms.
The United States and Canadian WAIS-IV samples were stratified based on four levels:
incomplete compulsory education (11 years or less), complete compulsory education (high school
degree/12 years), post-secondary education (some college/vocational school/13-15 years), and
university degree (17 years or more). For both the United States and Canadian WAIS-IV normative
samples, higher education (post-secondary and beyond) appears slightly overrepresented based on
current population levels (Table 1.3): 53% United States norms versus 42% for the population and 67%
Canadian norms versus 60% Canadian population. This information suggests the education level of our
sample is well captured within the United States and Canadian WAIS-IV norms, but it also indicates that
the quality of education being captured by these norms is notably different than that captured within

22
the WAIS-IV norms for Colombia, Chile, Mexico, and Spain (combining information from Tables 1.2, 1.3,
and 1.4).
Comparison of WAIS-IV Scores
Omnibus tests (ANOVA and Multivariate) for score differences when applying Colombian,
Chilean, Mexican, Spanish, United States, and Canadian WAIS-IV norms to our sample are presented in
Supplemental Table 1.1. All omnibus test results show that FSIQ, Index and subtest scores were
significantly affected by the type of norms applied (Supplemental Table 1.1). Looking more closely at the
differences, descriptive statistics, mean comparisons, and effect sizes when applying these six norms
sets to our sample are presented for FSIQ and Index scores in Figure 1.1 and Table 1.5, and for subtest
scores in Figure 1.2 and Table 1.6. Data supporting post-hoc comparisons are referenced in Figures 1.1-
1.2 and Tables 1.5-1.6 and reported fully in Supplemental Table 1.2. Mean classification agreement
between applying the six normative systems to our sample are reported in Table 1.5 (FSIQ and Index
scores) and Table 1.6 (subtest scores) and shown in Figures 1.3 (FSIQ) and 1.4 (Index scores).
FSIQ and Index scores. Rounding to whole scores (Table 1.5), mean FSIQs ranged from 121
(Chilean norms) to 109 (Canadian norms), VCIs from 126 (Spanish norms) to 111 (Canadian norms), PRIs
from 118 (Colombian norms) to 107 (Canadian norms), WMIs from 118 (Colombian/Chilean norms) to
100 (Canadian norms), and PSIs from 121 (Colombian norms) to 108 (Canadian norms). Overall, the
highest mean FSIQ and Index scores (except for the VCI) were obtained using the Colombian and Chilean
norms (less than one point difference, mean scores ranging between 117 and 121); the next highest
scores resulted when using the Mexican norms (3-9 points lower), followed by Spanish norms (3-11
points lower), United States norms (8-13 points lower), and the lowest mean scores were obtained using
Canadian norms (11-18 points lower). For the VCI highest mean scores were obtained using Mexican
norms (7 points higher than Colombian norms) and the Spanish (4 points higher), followed by those

23
obtained with Colombian (mean VCI=119), Chilean norms (1 point lower), United States (5 points lower),
and then Canadian norms (8 points lower).
Although several mean values in Table 1.5 appear exceedingly close, nearly all are statistically
different. All mean FSIQ and Index scores obtained using Chilean, Mexican, Spanish, United States, and
Canadian norms are significantly different (p <.0005) except for the Colombian versus Chilean WMI.
Additionally, nearly all corresponding effect sizes for the 25 comparisons were high (22=high, 1=medium
[Colombia versus Spain FSIQ], and 2=low [Colombia versus Chile FSIQ and WMI]). This indicates
statistical differences between the mean FSIQ and Index scores obtained with Colombian norms and
those obtained with each of the other five norm samples (Chilean, Mexican, Spanish, United States, and
Canadian).
While ANOVA and corresponding post-hoc testing restricts the number of tests that can and
should be performed (i.e., all combinations of norms), some additional information is available through
pairwise comparisons based on estimated marginal means. This information is comprehensively
reported in Supplemental Table 1.2 and more easily visualized in Figure 1.1 (FSIQ and Index scores) and
Figure 1.2 (subtests scores). Empty bars within charts indicate mean scores that are significantly
different (p <.05) from other scores. For examples, all mean VCI and PSI scores differ from one another
(i.e., Colombia VCI ≠ Chile VCI ≠ Mexico VCI ≠ Spain VCI ≠ United States VCI ≠ Canada VCI). Filled bars
indicate mean scores that are the same as each other, but different from all other scores. For example,
all mean FSIQs differ from one another except those obtained using norms from Mexico and Spain
(Mexico FSIQ = Spain FSIQ ≠ Colombia FSIQ ≠ Chile FSIQ ≠ United States FSIQ ≠ Canada FSIQ). All PRI
mean scores differ except those obtained with norms from Spain and Canada and all WMI scores differ
except those obtained with norms from Colombia and Chile.
The interpretive differences of applying different norms was evaluated with percent agreement
of scores calculated with Colombian norms against those calculated with Chilean, Mexican, Spanish,

24
United States, and Canadian norms using three criteria: within 1/3 SD, within same classification level,
and within 1/3 SD or same classification level. Comparing scores calculated with Colombian norms and
Chilean norms showed an extremely high percentage of agreement. Nearly all FSIQ/Index scores
calculated with Chilean norms fell within 1/3 SD of the scores calculated with Colombian norms
(FSIQ=99%; VCI, PRI, WMI, and PSI=100%). A high proportion of Chilean scores also fell within the same
classification level (FSIQ=97%, VCI=88%, PRI=100%, WMI=85%, and PSI=100%). When scores did not fall
in the same classification level, they usually fell one classification lower (e.g., from high average to
average), although there were some cases of scores falling one classification higher. Using the more
inclusive criteria of 1/3 SD or same classification level, 100% of the Chilean and Colombian scores were
in agreement.
Substantially more Mexican scores were within 1/3 SD of Colombian scores for FSIQ (82%) and
VCI (78%) than for PRI (31%), WMI (21%), and PSI (17%). A similar, but less pronounced trend was also
found for Mexican-Colombian classification level agreement (FSIQ=66%, VCI=64%, PRI=45%, WMI=46%,
and PSI=32%). For scores not falling in the same classification level, FSIQ, PRI, WMI, and PSI usually were
lower by one or two classification levels, but VCI scores were higher by one or two classification levels.
Using the combined criterion, Mexican and Colombian agreement was 89% for FSIQ, 82% for VCI, 51%
for PRI, 50% for WMI, and 33% for PSI.
There was a wide range of agreement between scores obtained with Spanish and Colombian
norms. Only about half of FSIQ scores were within 1/3 SD of each other (57%), while all others were
substantially less (VCI=35%, PRI=25%, WMI=19%, and PSI=4%). Classification agreement also ranged
(FSIQ=63%, VCI=43%, PRI=30%, WMI=28%, and PSI=21%). FSIQ classification levels not in agreement
were more commonly one level lower (27%) than higher (10%), and WMI and PSI classification levels not
in agreement were always one or two levels lower (66% and 7% respectively for WMI and 75% and 12%,
respectively, for PSI). VCI classification levels not in agreement, however, were always higher by one or

25
two levels (53% and 4%, respectively), and PRI non-agreeing classification levels ranged widely from two
levels lower (15% combined) to three levels higher (55% combined). Using the combined criterion,
Spanish and Colombian score agreement was 76% for FSIQ, 54% for VCI, 50% for PRI, 36% for WMI, and
23% for PSI.
Agreement between scores obtained with United States and Colombian norms also ranged.
Using the 1/3 SD criterion, agreement was 57% for FSIQ, 45% for VCI, 31% for PRI, 2% for WMI, and 15%
for PSI. Classification level agreement was 41% for FSIQ, 52% for VCI, 39% for PRI, 10% for WMI, and
30% for PSI. For classification level scores non in agreement, they were almost always one or two
classification levels lower (FSIQ=57%, VCI=44%, PRI=61%, WMI=90%, PSI=70%) with only a few scores
falling in a classification one level higher (0.33%-5%). With the combined criterion, United States and
Colombian score agreement was 74% for FSIQ, 59% for VCI, 48% for PRI, 11% for WMI, and 33% for PSI.
Scores obtained with Canadian and Colombian norms had the least agreement. Using the 1/3 SD
criterion, VCI score agreed approximately a third of the time (32%), while all others had little agreement
(FSIQ=12%, PRI=15%, WMI=0.33%, and PSI=2%). According to the classification level criterion,
agreement was slightly higher, but overall still low (FSIQ=18%, VCI=40%, PRI=25%, WMI=2%, and
PSI=13%). For classification level scores not in agreement, they were one or two levels lower for 82% of
the FSIQ scores, 60% of VCI scores, 65% of PRI scores, 78% for PSI scores, and one to three levels lower
for 98% of the WMI scores. Only a very small amount of non-agreeing VCI scores were higher (0.66%).
Combining the agreement criterion, Canadian and Colombian score agreement was 21% for FSIQ, 50%
for VCI, 29% for PRI, 2% for WMI, and 14% for PSI.
The broad impact of classification level score agreement across norms applied can be visualized
in Figures 1.3 (FSIQ) and 4 (Index scores). Although this information is redundant with values reported in
Table 1.5, presenting it visually adds the ability to more easily understand how the distribution of scores
changes when applying different norms. Looking at Figures 1.3 and 1.4, the distribution of scores

26
obtained with Colombian norms appears roughly normal. The distribution of classification scores
obtained with Chilean norms is almost identical to the Colombian norms distribution for FSIQ, PRI and
PSI, and reasonably close for VCI and WMI. The distribution shapes of scores obtained with Mexican,
Spanish, United States, and Canadian scores, however, are markedly different, with proportions of the
sample obtaining higher and lower scores than one another altered notably.
Subtest scores. At the subtest level (Table 1.6), there were no statistical differences between
the mean scaled scores obtained using Colombian norms and Chilean norms; however, nearly all other
mean scales scores differed from the Colombian norm scores, with 57 out of 60 having significant
differences (p <.01), and only three with no differences (Colombia versus Mexico Vocabulary, United
States Cancellation, and Canada Cancellation). Similarly, nearly all corresponding effect sizes were high
(52/60 high, 3/60 medium [Colombia versus Mexico Information and Blocks, Colombia versus Spain
Information], and 5/60 low [Colombia versus Mexico Vocabulary, Colombia versus United States
Information and Cancellation, Colombia versus Canada Information and Cancellation]). Note that effect
sizes for Colombia versus Chile subtests could not be computed since there were no differences. Overall,
these results show systematic similarities between mean subtest scores obtained with Colombia and
Chilean norms, but systematic differences between mean subtest scores obtained with Colombian and
Mexican, Spanish, United States, and Canadian norms.
Looking at mean subtest scores, Figure 1.2 again simply illustrates how mean subtest scores
obtained with Colombian and Chilean norms never differ in the study sample. Further, mean Vocabulary
scores obtained with Mexican norms also do not differ from the Colombian and Chilean scores, and
mean Cancellation scores obtained with United States and Canadian norms also do not differ from the
Colombian and Chilean scores. In addition, Figure 1.2 shows that subtest means obtained with Mexican
and United States norms are the same for Information, Matrix Reasoning, Figure Weights; subtest
means obtained with Mexican and Spanish norms are the same for Comprehension and Cancellation;

27
and subtest means obtained with Spanish and Canadian norms are the same for Figure Weights. Overall,
most of the mean subtest differences are 1-2 scaled score points from those obtained with Colombian
norms, with only five of the 75 comparisons resulting in differences greater than 2.5 scaled score points.
Using the combined criterion (i.e., within 1/3 SD or same classification level), percent agreement
was much higher on the subtest level (ranging from 31 to 100% across subtests and norms). Scores
obtained with Chilean norms agreed 100% of the time. Mexican score agreement ranged from 84%
(Cancellation) to 100% (Vocabulary). Spanish score agreement ranged from 68% (Coding) to 97%
(Cancellation). United States score agreement ranged from to 48% (Digit Span) to 100% (Information
and Cancellation). Canadian score agreement ranged from to 31% (Digit Span) to 99% (Information and
Cancellation). Lowest rates of agreement for VCI subtests were 74% for Similarities (Spain), 74% for
Vocabulary (Canada), 94% for Information (Spain), and 82% for Comprehension (Canada). Lowest rates
of agreement for PRI subtests were 70% for Block Design (Spain), 73% for Matrix Reasoning (Spain and
Canada), 80% for Visual Puzzles (Spain), 71% for Figure Weights (Spain), and 78% for Picture Completion
(Canada). Lowest rates of agreement for WMI subtests were 31% for Digit Span (Canada), 66% for
Arithmetic (Canada), and 54% for Letter-Number Sequencing. Lowest rates of agreement for PSI
subtests were 71% for Symbol Search (Canada), 65% for Coding (Canada), and 84% Cancellation
(Mexico).
Discussion
In the ideal assessment scenario, psychologists should identify and use the most appropriate
tests and norms for a given situation (American Educational Research Association, et al., 2014; APA,
2003, 2017; Clauss-Ehlers, Chiriboga, Hunter, & Roysircar, 2019). However, as nations diversify,
immigration and emigration patterns increase, and psychologists increasingly face complex issues calling
for nuanced integration of cultural factors, the most appropriate course of action may not be easily
determined (Byrne et al. 2009). This study examined one such cultural assessment scenario, in which a

28
case could be made to use a variety of different norms for WAIS-IV data from a large sample of
Colombian executives with a potential educational advantage over the general Colombian population.
Given the rarity of resources for this type of cultural assessment decision making, this paper first
developed resources to contextualize our sample against selected norm and population groups with
relevant sociodemographic and cultural features (e.g., language, socioeconomic structure, education),
namely: Colombia, Chile, Mexico, Spain, the United States, and Canada. Second, this study examined the
interpretive effects of applying the norms from the six target countries to the Colombian executive
sample WAIS-IV data.
Determining how well a given individual or group is represented within a standardization
sample, and in turn, how both relate to the broader population is a fundamental step in the test and
norms selection process (Anastasi, 1981; Hamnbleton, et al., 2005). For this study, we specifically aimed
to understand how well the education of our Colombian executive sample is represented at the WAIS-IV
norms and population levels for the six target countries. Of the 305 Colombian executives, nearly all
individuals completed post-secondary education (38.69% with bachelor’s degree/ISCED 4-6, and 60.98%
with graduate education/ISCED 7-8). These education levels are well within the expected range for
individuals hired into corporate executive roles in Colombia. Using the compiled data, the education
levels of the WAIS-IV standardization samples was compared to current nation-level population
statistics, then sample education was compared against both norm and population statistics. Education
reporting across adaptations of the WAIS-IV varied widely. For the Colombian and Chilean adaptations,
education was reported via a socioeconomic proxy variable. For the United States and Canadian WAIS-
IV, education was reported using similar culturally significant milestones (e.g., high school,
college/vocational, university) and slightly different milestones (primary, secondary, tertiary) were used
in the Spanish WAIS-IV. The Mexican WAIS-IV did not report specific statistics on educational
attainment. Considering the widely documented association between educational attainment and

29
intelligence assessment performance (Flanagan & Harrison, 2012), along with the fact that these
instruments are produced by the same publisher, it is surprising that education is not reported
consistently across them. Additionally, none of the WAIS-IV technical information on education is
reported using an international metric such as the ISCED. Without standardized reporting, it is not easy
for psychologists to understand the cross-cultural meanings and implications within a given
standardization process. Table 1.4 simplifies this comparison procedure for neuropsychologists looking
to make comparisons between the WAIS-IV for any of the six target countries by converting everything
into equivalent ISCED units (as best possible given currently reported technical information). From a
cultural psychology perspective, development of future versions of the WAIS, as well as other
psychometric instruments would benefit from rigorous detailed and consistent sociodemographics
reporting, including categorization of education using the ISCED (UNESCO, 2012).
Another pitfall potentially facing cultural neuropsychologists is the assumption that the
standardization sample of a well-known instrument like the WAIS-IV adequately represents its
corresponding nation. This study demonstrates the danger in this assumption. After converting all data
into ISCED units and comparing frequencies of post-secondary education at the sample, WAIS-IV, and
population levels, several trends emerged. Post-secondary education is likely overrepresented in the
Colombian and Chilean norms and thus, the education levels of our sample (albeit high) are likely well-
captured within these norms; however, this is difficult to say with certainty because these norms use a
socioeconomic proxy variable for education. Without education levels for the Mexican WAIS-IV it is
nearly impossible to come to any conclusions about educational representation within the norms. In
Spain, population levels of higher education occur at more than three times the rate in which they occur
within the Spanish WAIS-IV. This means that the Spanish WAIS-IV norms might not be well-suited for
individuals with advanced education, including the individuals in our sample. In the United States and
Canada, population and WAIS-IV levels of education were most closely matched, despite WAIS-IV

30
standardization sample alignment to census data from nearly a decade ago. While this suggests the
education level of our sample may be well-captured within the United States and Canadian WAIS-IV
norms, it also indicates that the quality of education being captured by these norms is notably different
than that which is available to the 20% of the Colombian population that pursues higher education and
that which is captured within the WAIS-IV norms for Colombia, Chile, Mexico, and Spain (Tables 1.2 and
1.3). Taking all of this information combined, the best a priori case could be made for using either the
Colombian or the Chilean WAIS-IV norms with the present sample of Colombian executives as both have
superior sociocultural and educational alignment with our sample as compared with the Mexican,
Spanish, United States, and Canadian WAIS-IV. While the Colombian WAIS-IV would be the best a priori
selection according to guidelines prioritizing use of local norms, the Chilean WAIS-IV would be the best a
priori selection according to guidelines prioritizing most-local and best-psychometrically developed
norms and has been routinely used in Colombia prior to the recent release of the Colombian WAIS-IV
(Wechsler, 2016; and see Measures above).
For the second part of this study, these a priori hypotheses were tested by examining the
interpretive effects of applying norms from the six target countries to the Colombian executive sample
using ANOVA and percent agreement values (Colombian norms versus other norms) using three criteria:
percent within 1/3 of a SD, percent within same descriptive classification level, and a more liberal
combined criterion (percent within 1/3 SD or classification level). Overall, interpretive effects varied
widely across norms applied. With the exception of the verbal subtest and VCI scores, highest mean
scores were obtained using Colombian and Chilean norms (FSIQ, PRI, WMI, and PSI means in the high
average to superior range), with incrementally lower scores obtained using norms from Mexico, Spain,
the United States, and Canada with lowest mean scores falling in the average range. For the VCI, mean
Colombian and Chilean scores were again similar, but higher means were obtained with norms from
31
Mexico and Spain (in the superior range) and lower with norms from the United States and Canada (in
the high average range). Subtest scores followed these trends, to a narrower degree.
Despite some slight statistical differences between mean Colombian and Chilean FSIQ and index
scores, there were no mean WMI or subtest differences and percent agreement across all scores using
the three criteria was 100%. While mean Colombian and Chilean index scores for our sample tended to
vary between one-half and one point, these results demonstrate that these differences have little-to-no
clinical or interpretive meaning. This finding is surprising given that the Chilean norms were developed
with a standardization sample nearly six times larger than that of the Colombian standardization sample.
Although this study cannot speak to the presence or absence of underlying systematic differences
between the Colombian and Chilean WAIS-IV norms, nor to findings that would be obtained when
applying these norms to other samples, the results provide support for use of the Colombian norms in
our sample because the scores do not have meaningful differences with those obtained with Chilean
norms and offer better fidelity to local population representation.
While some could argue that in the absence of knowing the true intelligence scores for our sample,
Colombian or Chilean norms may overestimate ability. However, comparing results obtained with
Colombian (and Chilean) norms against results obtained with Mexican, Spanish, United States, and
Canadian norms, all mean FSIQ, Index and subtest scores (except for cancellation) it is clear that these
outside norms yield what should be considered significant underestimates given the known level of
functioning across the sample. Percent agreement ranged vastly depending on criterion used, score
examined, and selected norms. While the combined percent agreement criterion logically had the
highest rates of agreement, the criterion using classification level typically, but not always, had the next
highest rates of agreement. Further, combined percent agreement was consistently much higher on the
subtest level over the index level. Specifically, highest rates of FSIQ/Index level score agreement were
always found with the FSIQ and the VCI, followed by the PRI. Lowest rates of agreement were always

32
found with the WMI and PSI. Similarly, the best agreement on the subtest level were always found with
verbal and perceptual reasoning subtests and the worst agreement on subtests scores was found
consistently with working memory and processing speed subtests. Further, the impacts of these
inconsistent effects on score distributions when applying different norms are well-captured in Tables
1.5-1.6 and Figures 1.3-1.4. While it was more common for individuals scores to drop in clinical
classification when applying norms from Mexico, Spain, the United States, and Canada, some scores
changed by as much as +3 clinical classification levels which is particularly substantial for a non-clinical,
high ability sample. Overall, this demonstrates that our sample’s level of acculturation to outside norms
is low, even despite high education levels.
Some of the most surprising outcomes from this study are the patterns of findings across the
index level. The VCI was the only index to have highest mean scores produced from norms other than
those from Colombia and Chile: Mexican and Spanish norms produced mean VCI scores 4-7 points
higher while United States and Canadian norms produced mean VCI scores 5-8 points lower than the
mean Colombian VCI. Further, the VCI and verbal subtests had the highest percent agreement scores
using the three established criteria. This finding is counterintuitive given the substantial literature linking
education to enhanced verbal performance on the WAIS and the hypothesis that educational-cultural
effects likely drive many intelligence test norm differences (Flanagan & Harrison, 2012; Lezak et al.,
2012; Lynn et al., 2018). In fact, working memory and processing speed indices and subtests scores that
neuropsychologists often think of as more “culture-free” had the worst percent agreement in this study.
The exception to this was the cancellation subtest, which had the fewest score differences.
Although these findings cannot be used to make conclusive determinations about differences
among the selected norms, they point to several key issues. First, these findings demonstrate that
clinicians in this scenario who might be tempted to use Mexican, Spanish, United States, or Canadian
norms for high performing, Colombian individuals with advanced education could run the risk of

33
drastically under- (but occasionally over-) estimating WAIS-IV scores, and changing their within-score
relation (i.e., patterns of strengths and weaknesses). For example, imagine a Colombian native moving
to Spain and subsequently undergoing neuropsychological assessment. With Colombian norms, this
person obtains an FSIQ of 114 falling into the high average range, with consistently high average index
scores: VCI=113, PRI=116, WMI=111, and PSI=117. Using the relative differences from this study, when
this same person is scored with Spanish norms they again obtain a high average FSIQ of 111, but their
index scores would range from average to very superior, with a projected VCI of 120, PRI of 105, WMI of
101 and PSI of 106. Here, this study demonstrates the importance of neuropsychologists not only
familiarizing themselves to an assessment instrument, but also to the broad and nuanced context of the
assessment scenario (Cagigas & Manly, 2014; Hays, 2016; Judd, 2009). Second, notably different VCI
score patterns suggests the verbal comprehension WAIS-IV construct may have some cultural nuances
likely associated with education system differences and representation of advanced education in the
Spanish and Mexican WAIS-IV standardization samples may be disproportion to national levels and to
the other versions of the WAIS-IV examined in the study. Neuropsychologists must be aware that
cultural adaptations may not adequately assess the constructs they are purported to assess, with
variable structural and measurement equivalence (Bryne et al., 2009; Cagigas & Manly, 2014). Finally,
the significantly low consistency of working memory and processing speed scores obtained from the six
WAIS-IV norm sets suggests there may be substantial cultural effects associated with performance on
these tests and/or differences in the psychometric treatment of these scores during the norms
development process. These findings align with the cultural psychology and neuropsychology literature
highlighting how cultural values such as competitive and quick thinking versus cooperative and
deliberate behavior may affect test performance (Cagigas & Manly, 2014). For all of these issues, greater
access to technical information for cultural-adaptations of the WAIS-IV and increased studies examining
34
their psychometric properties in standardization, non-clinical, and clinical samples would help clarifying
factors contributing to cross-test norm differences.
Numerous strengths make this study a useful contribution to the cultural neuropsychology
literature. It is the first study to make systematic comparisons of WAIS-IV norms from multiple Spanish-
speaking countries and it supports previous research demonstrating systematic score differences when
applying norms from the United States and Canada (Harrison et al., 2014; Iverson et al., 2006). It also
integrates methods to culturally contextualize data which provide decision-making considerations and
resources for cultural neuropsychologists, particularly those working with native Spanish speakers. This
study highlights the fact that cross-cultural test standardization procedures are not always equivalent,
even when overseen by the same multination test company. It also emphasizes the importance of
thorough technical reporting for psychometric instruments and calls for test developers to incorporate
metrics that facilitate cross-cultural work, such as the ISCED. Additionally, this study helps raise further
awareness to American-Eurocentric assessment bias, such cultural advantage/disadvantage assumptions
for individuals from developing nations, and highlights application of culturally responsive assessment
practices (Hays, 2016).
A number of limitations and areas for improvement are also apparent in this research. First, the
results of this study should not be used as the basis of clinical decision-making. The study is limited by a
sample of convivence, and better understanding of inherent norm differences between the selected
versions of the WAIS-IV could only be obtained through direct comparison of the original normative data
as well as examination of the effects when applying norms to more diverse clinical and non-clinical
samples, ranging more widely in socioeconomic background and ability. While this study outlines some
cultural assessment resources and decision-making frameworks for this particular assessment scenario,
it is far from providing the more comprehensive set of resources needed within the field of cultural
neuropsychology to adequately respond to increasing demands. In acknowledgment of these
35
limitations, however, this study demonstrates some of the first steps that can be taken in responses to
the call for clinical neuropsychology “to reinvent itself in face of global increases in diversity, and an
increased focus on the development of new, theoretically and clinically viable approaches to
measurement […] applicable locally as well as globally” (Suchy, 2016, pp. 973).
36
Chapter 2. Examining Bifactor and Hierarchical Intelligence Factor Structures in the Chilean adaptation of the WAIS-IV*
Emily C. Duggan1, 2, 3 & Mauricio A. Garcia-Barrera1
1University of Victoria, Victoria, BC, Canada
2Medical University of South Carolina, Charleston, SC, USA
3Ralph H. Johnson Veteran Affairs Medical Center, Charleston, SC, USA
*Manuscript to be submitted to Intelligence.
All work in this chapter was conceived of and carried out by me, with the exception of the critical feedback incorporated into the execution of some analyses and the writing of this manuscript by my other committee members.

37
Abstract
Objective: Accumulating evidence indicates the original factor structure published in the
Wechsler Intelligence Scales (Wechsler, 2008b, 2008c) may not best describe the data captured by these
tests. Instead some evidence supports a five-factor Cattell-Horn-Carroll (CHC) model (Benson et al.,
2018; Weiss et al., 2013b) over a four-factor Wechsler model, and a bifactor model over a higher-order
model (Gignac, 2016). Considering most extant research focuses on North American samples, our study
objectives were to examine the psychometric properties and determine the best model fit of the Chilean
Wechsler Adult Intelligence Scale-Fourth Edition (WAIS-IV; Wechsler, 2013; Rosas et al., 2013).
Participants and method: Confirmatory factor analysis was used to evaluate the factor structure of the
Chilean-WAIS-IV normative sample (ages 16-69, N=672). Four-factor and five-factor models were
examined in oblique, higher order, and bifactor variants and compared using fit indices. The Schmid-
Leiman (1957) procedure was compare higher-order and bifactor loadings. Results: Cross-loading the
arithmetic subtest on a verbal factor resulted in negative loadings. As hypothesized, the five-factor CHC
models fit better than the four-factor Wechsler models (average CFI=+0.014). Also, bifactor models fit
better than traditional higher-order models (four-factor CFI=+0.016 and five-factor CFI=+0.012).
Overall, a bifactor CHC model (based on Weiss et al., 2013b) best fit the data (CFI=0.996, RMSEA=0.025);
but the Schmid-Leiman transformation demonstrated high similarity between the bifactor and higher-
order model variants. Conclusions: This research contributes to the much-needed cross-cultural study of
alternative WAIS-IV factor models and our results are consistent with the growing literature supporting
a five-factor CHC model in WAIS-IV data. While results have implications for the clinical interpretation of
the Chilean WAIS-IV (e.g., conceptualizing full-scale intelligence quotient as a breadth factor rather than
a superordinate factor of index-level abilities), further studies examining the clinical utility of WAIS-IV
bifactor and CHC models are needed.
38
Introduction
The Wechsler intelligence scales for adults (WAIS-IV; Wechsler, 2008b, 2008c) and children
(WISC-V, Wechsler, 2014b; WPPSI-IV, Wechsler, 2012c;) are the among the most widely used
assessment instruments in the world (Rabin, Paolillo, Barr, 2016). Because of this, substantial research
has scrutinized the theoretical underpinnings and psychometric quality of the Wechsler scales,
ultimately leading to significant changes and improvements through their revisions (Benisz, Dumont, &
Willis, 2015). Perhaps the greatest change has been moving from a largely atheoretical orientation to
increasing alignment with the Cattell-Horn-Carroll (CHC) model of cognitive abilities (Flanagan, McGrew,
& Ortiz, 2000; Wechsler, 2008b, 2008c; Wechsler, 2014b).
The CHC model is a theoretically-driven, and psychometrically-based integration of research on
intelligence and cognitive ability conducted since the beginning of the 20th century (Schneider &
McGrew, 2012). Evident in its name, it combines two of the most prominent psychometric cognitive
ability theories, Horn-Cattell Gf-Gc theory (Horn & Cattell, 1966) and Carroll’s three-stratum theory
(Carroll, 1993), which both grew out of Spearman’s influential (and subsequently well-replicated)
research demonstrating the tendency for all mental ability tests to be positively correlated (the positive
manifold; Spearman, 1904; Jensen, 1998). Essentially, CHC theory describes cognitive abilities in three
levels, with numerous narrow abilities (striatum one) that can be clustered into general abilities
(striatum two), which then give rise to general intelligence (g) at the apex of the model (stratum three).
While evidence remains incomplete as to the precise number of narrow and broad abilities, there
appear to be at least 10 and perhaps up to 20 (striatum two) clusters of narrow abilities, including: fluid
intelligence (Gf), crystallized intelligence (Gc), short-term memory (Gsm), visual processing (Gv), and
auditory processing (Ga), long-term storage and retrieval (Glr), processing speed (Gs), quantitative
knowledge (Gq), reading and writing ability (Grw), and reaction time (Gt; Schneider & McGrew, 2018;
Woodcock, Maricle, Miller, & McGill, 2018). While CHC theory is far from being a comprehensive or

39
complete cognitive model and is not without flaws or criticism, it has provided an adaptive framework,
capable of being applied to a wide range of contemporary psychometric research (Schneider & McGrew,
2018). To date, the CHC model is the most well-supported and utilized model of cognitive abilities
(Jewsbury, Bowden, & Duff, 2016; Schneider & McGrew, 2018; Woodcock et al., 2018).
In its current iteration, the WAIS-IV is described as a four-factor, higher-order model (Wechsler,
2008c). The 10 core subtests and five additional supplementary subtests (analogous to striatum one
abilities) give rise to four (striatum two) factors representing verbal abilities (Verbal Comprehension
Index; VCI), perceptual reasoning abilities (Perceptual Reasoning Index; PRI), working memory abilities
(Working Memory Index; WMI), and speed of cognitive processing (Processing Speed Index; PSI).
Combined, these four factors are indicators of an overall intellectual ability (striatum three) factor (Full-
Scale Intelligence Quotient; FSIQ). In further relating the CHC model to the traditional Wechsler factor
structure, it has been shown that the VCI is akin to crystallized intelligence (Gc), WMI akin to short-term
memory (Gsm), and PSI akin to processing speed (Gs), while PRI appears to capture a combination of
fluid intelligence (Gf) and visual processing (Gv; Keith & Reynold, 2018). Thus, when describing the
WAIS-IV in terms of the CHC framework, the Wechsler four-factor model is adjusted into a five-factor
CHC model, by having a slightly different arrangement of factor loadings, which then give rise to a
broader general intelligence factor (g).
Overall, accumulating research has provided psychometric support for many iterations of five-
factor, CHC-derived models (Gc, Gv, Gf, Gsm, and Gs) in the Wechsler scales (Benson, Hulac, & Kranzler,
2010; Canivez & Watkins, 2010a, 2010b; Gignac & Watkins, 2013; Lecerf, Golay, Reverte, Senn, Favez, &
Rosseir, 2012; Lecerf, Golay, & Reverte, 2012; Jewsbury, et al., 2016; Keith & Reynolds, 2010; Niileksela,
Reynolds, & Kaufman, 2013; Ward, Bergman, & Hebert, 2012; Weiss, Keith, Zhu, & Chen, 2013b). While
research has demonstrated acceptable fit of both four-factor (VCI, PRI, WMI, and PSI) and five-factor
(Gc, Gv, Gf, Gsm, and Gs) models in the WAIS-IV, five-factor models have generally been favored for
40
displaying better psychometrics and alignment with the well-supported CHC model (Alfonso, Flanagan,
& Radwan, 2005; Benson et al., 2010; van Aken et al., 2017; Weiss et al., 2013b).
In considering the broader world of intelligence tests, a number of factor-analytic review and
meta-analytic papers (including data from the Wechsler scales) have concluded that most widely-used
intellectual and cognitive tests theoretically and psychometrically align with CHC theory, either
explicitly, like the CHC-driven Woodcock-Johnson Tests of Cognitive Abilities (Schrank, Mather, &
McGrew, 2014), or implicitly, as it is the case for the Wechsler scales (Benson, Beaujean, McGill, &
Dombrowski, 2018; Grégoire, 2013; Jewsbury, Bowden, & Duff, 2016; Keith & Reynolds, 2010).
Researchers, however, have disagreed on the specific way the CHC model represents, and should be fit
to, the data derived from intelligence tests (as evidenced the numerous variations how the CHC model
has been applied to intelligence data; c.f. Flanagan & Harrison, 2018; Grégoire, 2013;). Thus, this
disagreement has added significant complexity to the CHC picture.
In general, the current limitations within the CHC psychometric literature can be characterized
by two overarching themes: model specification (configuration) and broader model structure. First,
since the Wechsler scales are not explicitly developed based on the CHC model, exploratory or
confirmatory factor analysis is used to determine how individual subtests may fit into a CHC model
configuration. In practice, this results in the foundational four-factor model of the WAIS-IV (with two or
three subtests on each factor/index) being reconfigured with several cross-loaded subtests to result in
five factors (Gc, Gv, Gf, Gm, and Gs) aligning with the CHC model (see Figures 2.1 and 2.2, Panels 1 and
2). Four and five-factor model fit statistics are then typically compared in some fashion to determine the
model that best describes the intelligence data. With cross-loadings, however, comes more room for
complexity of analysis and interpretation, and studies have ranged from testing a single model to testing
over 20 configurations (or modifications) of each four and five-factor models (see Table 2.1 for a
summary of models tested in factor analysis studies of WAIS-IV scales). The inconsistency of model

41
configurations tested across studies actually makes it remarkably difficult to make direct comparisons
and draw conclusions from the broader research.
The second main difficulty within the literature has to do with the way the broad and specific
factors are structured in relation to one another. As originally published (Wechsler, 2008c), a higher-
order factor structure was used to conceptualize and evaluate the Wechsler scales, with each subtest as
an indicator of a factor (index), and each factor an indicator of a higher-order mental ability factor (e.g.,
FSIQ/g; see Figure 2.1, Panels 1 and 2). Conveyed within the higher-order model is the premise that
each subtest entirely contributes to its parent factor, and those factors alone give rise to the higher-
order construct of general mental ability (FSIQ/g). Subsequent work has further evaluated higher order
models in the Wechsler intelligence scales, and many researchers present strong arguments for the
theoretical rationale as to why a higher-order model is preferable to alternate models (e.g., Keith &
Reynolds, 2018; Weiss, Keith, Zhu, & Chen, 2013a; 2013b). Other researchers disagree with this notion,
asserting that information from individual subtests may best be described as directly contributing to the
general factor (FSIQ/g) first, and then secondarily (through remaining unaccounted variance) to striatum
two (index level) factors, often referred to as a bifactor model (see Figure 2.1, Panel 3). Much of this
thinking has been driven by revisiting the underpinnings of Spearman and Cattell’s work (Benson,
Beaujean, McGill, & Drombrowski, 2018; Kan, Klevit, Dolan, & van der Maas, 2011; Warne &
Burningham, 2019) and many researchers have provided support for the bifactor model in WAIS and
other intelligence data (e.g., Cucina & Byle, 2017; Frisby & Beaujean, 2015; Gignac, 2008; Gignac &
Watkins, 2013).
The arguments for and against the application of higher-order and bifactor models have been
increasingly documented in the literature. While accumulating research has shown that bifactor models
tend to have slightly better fit indices than their higher-order counterparts, several papers demonstrate
the overfit tendency of the bifactor model and argue that the models are not-directly comparable

42
(without statistical corrections) due to differences in model parameters, essentially resulting in
comparing apples with oranges (Gignac, 2008; Gignac, 2016; Keith & Reynolds, 2018; Mansof, 2017;
Reise, Schenies, Widaman, & Haviland, 2013). While consensus has yet to be reached on the theoretical
validity of a higher-order versus bifactor model (largely due to lack of consensus for a unified definition
of intelligence), few papers tend to take an agnostic approach and test either higher-order models or
bifactor models, but not both (Table 2.1).
While the two main issues of model configuration and model structure are well-discussed in the
literature, there is a third often overlooked issue relating to the lack of data diversity within this body of
research. Despite a prolific amount of research on CHC theory in intelligence assessment,
proportionately little work has been done to validate the CHC model cross-culturally in current
intelligence batteries (Jewsbury et al., 2016; Schneider & Flanagan, 2015). In fact, to our knowledge,
most Wechsler factor structure papers draw from North American and European samples and many
papers are analytic variants using the same (often standardization sample) data (Table 2.1). This is
surprising because the WAIS-IV (Wechsler, 2008b) alone currently has at least 26 international cultural
and language adaptations (Pearson Clinical, 2019). Additionally, recent work has shown inconsistent
patterns of WAIS-IV subtest and index standardized scores across different national standardization
samples, which may point to underlying differences in psychometric properties (Duggan, Awakon,
Loaiza, & Garcia-Barrera, 2018). Given the incredible influence of CHC theory in contemporary
intelligence assessment, as well as the international popularity of the Wechsler scales, further cross-
cultural work in this area is essential.
Here, this study extends prior research to South America by examining the factor structure of
the Chilean WAIS-IV standardization data (Wechsler, 2013). Specifically, confirmatory factor analysis
(CFA) was used to consistently examine model configuration (the Wechsler index-based four-factor
model and the CHC-based five factor model) and model structure (higher-order and bifactor models).
43
We anticipated that all models would display adequate fit and good psychometric properties, including
commonly used cross-loadings and other model variants, as described in the extant literature. We
hypothesized that five-factor models would demonstrate more robust psychometric properties than
four-factor models. We also anticipated bifactor models to demonstrate stronger fit statistics than
higher-order models, but that bifactor and higher-order factor loadings would be similar after applying
the necessary transformation to make them directly comparable.
Within a sociocultural framework, this study more broadly evaluates the cross-cultural construct
validity of the WAIS-IV. While adaptations of the WAIS-IV are based on the premise of universalism, or
“culture-free” intelligence, research has shown this concept to be misguided and incorrect, with
systematic group differences demonstrated in a range of neuropsychological testing, particularly in
nonverbal measures (Duggan et al., 2018; Gasquoine, 1999; Rosselli & Ardila, 2003; Olson & Jacobson,
2014). Given the unlikely universalism of entire WAIS-IV, we hypothesized that differences in subtest
and index factor loadings in the Chilean WAIS-IV factor models would exhibit relative differences from
those seen in United States models, despite expecting good fit of the overall Wechsler and CHC models.
Methods
Measures
The Chilean version of the WAIS-IV (Wechsler, 2013; Rosas et al., 2014) is an adaptation of the
Spanish WAIS-IV (Wechsler, 2012a), which was the first Spanish-language test adapted from the original
United States WAIS-IV (Wechsler, 2008b, 2008c). The Chilean WAIS-IV includes the same subtests, items,
and score structure as the Spanish and United States WAIS-IV, with only minor cultural adaptations to
item content/scoring. Consequently, it has 10 core subtests (Similarities [SI], Vocabulary [VC],
Information [IN], Block Design [BD], Matrix Reasoning [MR], Visual Puzzles [VP], Digit Span [DS],
Arithmetic [AR], Symbol Search [SR], and Coding [CD]) and five supplemental subtests (Comprehension
[CO], Figure Weights [FW], Picture Completion [PC], Letter-Number Sequencing [LN], and Cancellation

44
[CA]), which yield four index scores (Verbal Comprehension Index [VCI], Perceptual Reasoning Index
[PRI], Working Memory Index [WMI], and Processing Speed Index [PSI]) and a Full-Scale Intelligence
Quotient (FSIQ). According to the Chilean WAIS-IV technical data, internal consistency for the test as
whole (FSIQ) is 0.941, with mean index alpha coefficients of 0.951 for VCI, 0.874 for PRI, 0.912 for WMI,
and 0.854 for PSI, and subtest reliabilities ranging from 0.733 to 0.925. These reliabilities are
comparable to those reported in the United States WAIS-IV manual (mean reliability for United States
FSIQ=0.98, VCI=0.96, PRI=0.95, WMI=0.94, PSI=0.90, and subtests ranging from 0.78 to 0.94). Additional
technical information about the Chilean WAIS-IV is provided in the administration manual (Wechsler,
2013) and the accompanying technical paper (Rosas et al., 2014).
Participants
This study used the original Chilean WAIS-IV standardization sample data, which comprises 887
Chilean, Spanish-speaking individuals ages 16:00 to 90:11 years, representative of the general Chilean
population (Wechsler, 2013; Rosas et al., 2014). Individuals aged 70 years and older were excluded from
this study because they were administered only 12 of the 15 WAIS-IV subtests (FW, LN, and CA omitted).
Thus, the final sample for this study was 672 individuals who completed all 15 WAIS-IV subtests
(Mage=36.93, SDage=17.12, 50.45% women). Demographic and descriptive statistics for this sample are
provided in Supplementary Tables 2.1 and 2.2. Ethnicity is not reported in the Chilean WAIS-IV. Data was
used with permission from the standardization team and approved by the Human Research Ethics Board
at the University of Victoria (Protocol Number 18-129).
Procedure
All descriptive statistics were calculated using SPSS Statistics Version 25 (IBM, 2017) and
confirmatory factor analysis was conducted in Mplus Version 8 (Muthén & Muthén, 1998-2017).
Standardized subtest scores were used for analysis. Data screening included examination of missing data
patterns, evaluation for univariate normal distribution for each variable (skewness and kurtosis), and
45
evaluation of multivariate normality (Mahalanobis’ distance). In Mplus, the default for missing data is
the maximum likelihood method of estimation (Muthén & Muthén, 1998-2017). In the event of outliers,
data would be excluded. A series of four- and five-factor models were determined a priori, based on the
most consistently tested and empirically supported WAIS-IV factor models (and their cross-loading
and/or correlated residuals). The correlation matrix (standardization sample ages 16-69 years, N=672) is
presented in Supplemental Table 2.3.
All models were tested in oblique, higher-order, and bifactor variants as depicted in Figures 2.1
and 2 and specified in Table 2.2. Four-factor models were based on the original Wechsler model and its
final cross-loading variant (four-factor Models A-E; see Table 2.2 and Figure 2.1; Wechsler, 2008c; Rosas
et al., 2013). Five-factor models were based on the two most commonly referenced five-factor model
variants from the literature. First, we evaluated a five-factor, CHC-model based on the configuration
reported by Benson et al. (2010) (five-factor A) and its cross-loading variant (five-factor B; Ward et al.,
2012). Second, we evaluated the five-factor model originally specified by Weiss et al. (2013b) (five-factor
C) and its cross-loading variant (five-factor D; Benson et al., 2010; Ward et al., 2012; Weiss et al., 2013b).
This model is unique in that it has an intermediate first order factor, called Quantitative Reasoning (RQ),
which is indicated by FW and AR subtests, then loaded on Gsm. Modification indices were examined
post-hoc to inform interpretation and discussion but were not implemented into any models.
Models were evaluated using chi-square (2) test, comparative fit index (CFI), Tucker-Lewis
index (TLI), Akaike information criterion (AIC), Bayesian information criterion (BIC), adjusted BIC (aBIC),
root mean square error of approximation (RMSEA), and standardized root mean square residual (SRMR).
The established conservative cutoff criteria for fit indexes (i.e., CFI/TLI = 0.90, RMSEA < 0.08) and
stringent cutoff criteria (i.e., CFI/TLI = 0.95, RMSEA < 0.05, incremental 2 and AIC/BIC/aBIC closer to
zero the better) were used for model comparison (Hu & Bentler, 1999; Jackson, Gillaspy, & Purc-
Stephenson, 2009; Marsh, Balla, & McDonald, 1988; Brone & Cudek, 1993 as cited in Schermelleh-Engel,
46
Moosbrugger, & Müller, 2003; Schreiber, Nora, Stage, Barlow, & King, 2006). The Schmid-Leiman
procedure was used to calculate the contribution of lower- and higher-order factors to the prediction of
observed measures (Schmid & Leiman, 1957) and make them comparable to bifactor loadings (Brown,
2015; Gignac, 2016).
Model-based reliabilities were estimated using omega (), an estimate that represents the of
true-score variance to total variance of indicators of a given factor (McDonald, 1999; Reise, 2012).
Omega-hierarchical (H) was used to estimate model-based reliability for FSIQ/g with the variability of
first order factors removed. Omega-hierarchical subscale (HS) was used to estimate group factor
reliability with all other group and general factors removed (Brunner, Nagy, & Wilhelm, 2012; Rodriquez,
Reis, & Haviland, 2016). While there are no empirically based and clinically applicable guidelines for
acceptable levels of omega coefficients, values of at least 0.50 (adequate) to 0.75 (preferred) are
suggested sufficient for interpretation of construct-based reliability for group or hierarchical factor
interpretation (Reise, 2012; Reise, Bonifay, & Haviland, 2013; Reise, Scheines, Widaman, & Haviland,
2013).
Results
Demographic and descriptive statistics for this sample are provided in Supplementary Tables 2.1
and 2.2. Data screening showed that the final Chilean WAIS-IV standardization sample had no missing
data, no outliers, and an approximate univariate normal distribution for each variable (skewness and
kurtosis within normal limits). Fit statistics for all models are presented in Table 2.3. All models
converged normally, except two models yielded non-positive definite covariance matrices (four-factor
bifactor Model B and four-factor bifactor Model C). All oblique models with an AR cross-loading on
VCI/Gc yielded a negative factor loading for that subtest (standardized loading ranging from -0.166 to -
0.313 for Model 4 = -0.313, Model 5 = -0.273, Model 7 = -0.166, and Model 9 = -0.261). Consequently, all
higher-order and bifactor models with this variant were subsequently excluded and fit statistics are not

47
reported. Overall, model fit improved with model complexity, as shown by progressively lower (less
inflated) 2 values, improved (lower) RMSEA and SRMR values, and larger CFI, TLI, AIC, BIC, and aBIC
values. Though oblique models demonstrated suboptimal fit-indices, higher-order and bifactor variants
demonstrated adequate to excellent model fit, consistent with the Wechsler intelligence scale literature.
Factor loadings for all best Wechsler and CHC models are summarized in Supplemental Table 2.4.
Four-factor (Wechsler) models
Four-factor Model C was the best fitting four-factor model for both higher-order and bifactor
variants (Models 12 and 21, respectively, Table 2.3). The higher-order variant demonstrated acceptable
fit ( = 219.72, df = 84, RMSEA = 0.049, SRMR = 0.290, CFI = 0.978, TLI = 0.972, AIC = 45301.89, BIC =
45531.91, aBIC = 45369.98). For this model, WMI and PRI were the most robust indicators of FSIQ ( =
.936), followed by VCI ( = .797), and PSI ( = .763, all p < 0.0005). All subtests were moderate to strong
indicators (mean = .722, highest = .872 for VC on VCI, lowest = .359 for FW on PRI, all p < 0.0005).
The bifactor variant demonstrated excellent fit but ultimately yield a non-positive definite covariance
matrix (2 = 105.45, df = 67, RMSEA =. 0.029, SRMR = 0.018, CFI = 0.994, TLI = 0.990, AIC = 45221.61, BIC
= 45528.61, aBIC = 45312.40).
Five-factor (CHC) models
Five-factor Model C was the best fitting five-factor model for both higher-order and bifactor
variants (Models 17 and 26, respectively, Table 2.3). The higher-order variant demonstrated acceptable
fit (2 = 181.89, df = 82, RMSEA = 0.043, SRMR = 0.027, CFI = 0.984, TLI = 0.979, AIC = 45268.05, BIC =
45507.10, aBIC = 45338.82, Figure 2.3). For this model, Gf was the most robust indicator of g ( = 1.00),
followed by Gv ( = .875) and Gc ( = .875), Gsm ( = .830), then Gs ( = .757; all p < 0.0005). All subtests
were strong indicators with the exception of FW on Gv ( = .144, p = 0.058), MR on Gv ( = .193, p =
0.005), and AR on Gsm ( = .261, p < 0.0005).

48
The bifactor variant demonstrated excellent fit (2 = 87.90, df = 62, RMSEA = 0.025, SRMR =
0.016, CFI = 0.996, TLI = 0.993, AIC = 45214.06, BIC = 45543.31, aBIC = 45311.53, Figure 2.4). All subtests
were moderate to strong indicators of g (mean = all p < 0.0005; highest = 868 for VC, lowest
= 0.379 for CA). After accounting for their contributions to g, indicators were observed to have a range
of contributions to broad factors from no significant contributions (i.e., p > 0.05 for all indicators of Gc,
MR and FW on Gv, FW on RQ, MR on Gf, and AR on Gsm) to moderate contributions (e.g., SS on Gs, =
.697, DS on Gsm, = .630, VP on Gv = .557, BD on Gv, = .554, and CD on Gs, = .531; all p < 0.0005).
Combined results
As hypothesized, the five-factor (CHC) models fit better than the four-factor Wechsler models
(average CFI=+0.014). Also, bifactor models fit better than traditional higher-order models (four-factor
CFI=+0.016 and five-factor CFI=+0.012). Overall, five-factor Model C was the best fitting higher-order
model (Table 2.3, Model 17; Figure 2.3) and bifactor model (Table 2.3, Model 26; Figure 2.4), with the
latter being the ultimate best-fitting model. The omega reliability estimates for g were robust (H =
0.92) and insufficient for all specific factors, except Gs: Hs (Gc) = 0.0001, Hs (Gv) = 0.20, Hs (Gf) = 0.24,
Hs (Gsm) = 0.32, Hs (Gs) = 0.56.
Given differences in parameter estimates in the higher-order and bifactor models making direct
comparison difficult, a Schmid-Leiman transformation of the best higher order model (five-factor Model
C; Table 2.3, Model 17) was used to better examine it in relation to its bifactor variant (Table 2.3, Model
26). The Schmid-Leiman transformation estimates of the higher-order model (Table 2.4) show the
effects of g across the subtests were the strongest (mean effect = 0.57), with lower mean effects for the
specific factors (Gc = 0.40, Gv = .29, Gf = 0.00, Gsm = 0.30, Gs = 0.35). These estimates were generally
slightly lower, but similar to, the mean effects for the bifactor model (g = 0.65, Gc = 0.02, Gv = 0.32, Gf =
0.57, Gsm = 0.44, Gs = 0.56).

49
Modification indices for each model were examined post-hoc to evaluate if any important model
variants were erroneously excluded from these analyses. None of the modification indices were found
to substantially differ from, or theoretically add to, any of the 27 models tested.
Comparison to United States WAIS-IV data
For the best-fitting higher-order model (five-factor Model C [Model 17] Figure 2.3, Table 2.3),
index factor loadings ranged from 1.0 (Gf) to 0.757 (Gs), and subtest loadings ranged from 0.871 (VC) to
0.144 (FW on RQ). The highest five loadings were VC (0.871), IN (0.832), CO (0.808), and SI and BD (both
0.802). Comparing this model with the same model fit to data from the United States WAIS-IV
standardization sample (Weiss et al., 2013), nearly all factor loadings have similar values and loadings
patterns. More specifically, index loadings in the United States data ranged from 0.99 (Gf) to 0.67 (Gs),
and subtest loadings ranged from 0.89 (VC) to 0.23 (AR), with the highest five loadings including VC
(0.89), 0.85 (DS), 0.83 (CO), 0.82 (SI), and 0.81 (BD). The mean difference between the Chilean and the
United States index loadings was 0.05 (range = 0.01 [Gf] to .09 [Gs]), and the mean difference between
subtest loadings was 0.08 (range = 0.01 to 0.47). The only subtest loadings to have a mean difference
greater than 0.10 were FW on Gv (mean difference = -0.47), LN on Gsm (-0.23), FW on RQ (+0.16), PC on
Gv (+0.15), and MR on Gf (+0.11).
For the best-fitting bifactor model (five-factor Model C Figures 2.4; Table 2.3 Model 21), direct
comparison to the identical model in the United States WAIS-IV or other data was not available, since to
our knowledge, findings regarding this model variant has not yet been reported in the literature (see
table 2.1). Overall, subtest factor loadings on g ranged from 0.77 (AR) to 0.41 (CA), with the five highest
loadings including AR (0.77), FW (0.74), and SI/VC/MR (all 0.71). These can roughly be compared to the
best reported model: the five-factor, bifactor model fit to United States WAIS-IV standardization data
(Gignac, 2014), which breaks DS into its three components (forwards, backwards, and sequencing). In

50
this model, subtest factor loadings ranged from 0.74 (MR and SI) to 0.42 (DS forward), with the five
highest loadings including MR and SI (0.74), 0.71 (AR), 0.69 (VC and BD).
Discussion
Rigorous examination of factor structure is critical to providing psychometric evidence for the
use of intelligence tests, as well as to aid with understanding consistencies and areas for improvement
in contemporary intelligence models and measures. In this study, we evaluated the factor structure of
the Chilean WAIS-IV in a manner specifically designed to contribute to three areas of ongoing Wechsler
intelligence scale research: 1) consistent evaluation of model configuration (four- versus five-factor
models), 2) consistent evaluation of factor structure (higher-order versus bifactor models), and 3)
evaluation of WAIS-IV data in an underexamined population. Specifically, this study used review of
extant research to establish a systematic, a priori set of models to comprehensively evaluate the factor
structure of the Chilean WAIS-IV.
Oblique versions of all models were tested first before adding model complexity with higher-
order and bifactor structures. This step was also important given that oblique models are part of
reporting in the Wechsler manuals (e.g., fit statistics for the final model are reported for both oblique
and higher-order variants; Wechsler, 2008c) and they relate substantially to how the Wechsler scales are
often used in clinical practice (analysis of performance on index scores and even subtest scores;
Staffaroni et al., 2018). While all oblique models converged normally and generally showed improved fit
indices with increasing model complexity, all arithmetic cross-loadings onto a verbal factor (VCI/Gc)
resulted in a negative factor loading. This finding was not fully anticipated since the AR cross-loading is
not only part of the final United States WAIS-IV reported model (Wechsler, 2008c, AR cross-loading =
0.08) but also reported in several other studies in North American and European studies (e.g., Weiss et
al., 2013b, AR cross-loading = 0.22; van Aken et al., 2017, AR cross-loading = 0.32). At least one other
study, however, showed a negative cross-loading of AR on Gc in a clinical population (Staffaroni et al.,
51
2018) and it is possible other studies encountered, but did not report, a similar finding. While this may
be a sample-based result (i.e., AR contributes to a verbal factor in some clinical or cultural samples but
not in others), it more likely suggests that an alternate factor structure may better describe the data
(e.g., an AR cross-loading on Gc is may be erroneous and inconsistent finding, or CHC model may better
describe the data than a Wechsler model; Staffaroni et al., 2018).
While most four- and five-factor models in our study demonstrated adequate convergence and
fit, the statistics for the five-factor models were notably stronger. Our findings support the alternative
CHC factor structure in the Chilean WAIS-IV and are consistent with other research applying the CHC
model in different WAIS-IV samples (Table 2.1). The best fit indices were observed with variants of five-
factor Model C (Figures 2.3 and 2.4; Table 2.3 Models 17 and 21), which feature the RQ factor based on
the model described by Weiss et al. (2013b) and others (Pezzuti et al., 2018, Staffaroni et al., 2018, van
Aken et al., 2017). A simpler five-factor CHC model (Model A; Table 2.3 Models 15 and 19), based on the
one outlined by Benson et al., (2010), however, also demonstrated excellent fit statistics that were only
slightly behind Model C’s indices. While five-factor Model C was presented as the best fitting model in
the results (based solely on the numbers alone), our findings ultimately provide no clear evidence in
favor of one five-factor model over the other. Similarly, the same argument could be applied to selecting
a four- or five-factor model based on our findings, the best of which all demonstrated adequate fit
statistics. Ultimately clinical selection of models should be based both on fit and theoretical rationale;
while an argument could be made for parsimony (less factors being more favorable due to a high risk of
over-factorization; Frazer & Youngstrom, 2007), CHC theory has substantially prevailed and numerous
arguments in favor of CHC models have been well presented throughout the literature (e.g., Benson et
al., 2010; Staffaroni et al., 2018; Weiss et al., 2013b).
Given the prevalence of well-supported arguments for the use of both four- and five-factor
models in the WAIS-IV, some guidance on model utilization may come from examination of research

52
from other CHC aligned intelligence tests, including the Wechsler Intelligence Scales for Children and the
Woodcock-Johnson Tests of Cognitive Abilities. The recent release of the WISC-V (Wechsler, 2014b)
incorporated significant changes, which continue the Wechsler intelligence scales development trend of
further alignment with the CHC model. Specifically, this edition moved from the well-established four-
factor model using a 15-subtest battery (i.e., VCI, PRI, WMI, and PSI as seen in the WISC-IV and the
WAIS-IV) to a 16-subtest battery with a five-factor structure (VCI, WMI, PSI, plus visual spatial index [VSI,
akin to Gv], and fluid reasoning index [FRI, akin to Gf]). While much WISC-IV research provided support
for this shift, demonstrating better fit of a five-factor model over a four-factor model (e.g., Golay,
Reverte, Rossier, Favez, & Lecerf, 2012; Keith, Fine, Taub, Reynolds, & Kranzler, 2006; Reverte, Golay,
Favez, Rossier, & Lecerf, 2015; Weiss Keith, Zhu, & Chen, 2013c), accumulating research evaluating the
WISC-V has somewhat reversed this momentum, indicating the WISC-V may over factor and now
providing support for the four-factor model over the five-factor model (e.g., Dombrowski, Canivez, &
Watkins, 2018; Dombrowski, Canivez, Watkins, & Beaujean, 2015; Canivez, Dombrowski, & Watkins,
2018; Fenollar-Cortés & Watkins, 2018; Lecerf & Canivez, 2017). In a similar vein, the current edition of
the Woodcock-Johnson Tests of Cognitive Abilities (WJ-IV; Schrank, McGrew, & Mather, 2014), a test
specifically developed from CHC theory, with 18 subtests yielding eight factors, has also been shown to
potentially over factor its data (Dombrowski, McGill, & Canivez, 2017; 2018a; 2018b). While alignment
with contemporary intelligence theory is a critical basis of intelligence assessment, these research
findings alert us to the potential of over fitting data using indicators that may be too few in number
(estimating factors with two indicators; March, Hau, Balla, & Grayson, 1998) or impure (subtests being
used to indicate multiple factors; Murray & Johnson, 2013, cf. Karr, Areshenkoff, Rast, Hofer, Iverson, &
Garcia-Barrera, 2018 in the executive functioning literature). As a revision of the WAIS-IV is expected to
be released soon and is anticipated to incorporate similar changes as the WISC-V to further align it with

53
the CHC model, more research will be needed to examine the theoretical, psychometric, and clinical
underpinnings of the Wechsler scales.
The issues of potential under identification and over-factorization also more broadly relate to
the debate surrounding the use of higher-order versus bifactor model structures in intelligence data
(Keith & Reynolds, 2018). In this study, bifactor variants of nearly all models appeared to fit better than
their higher-order counter parts (with the exception of the four-factor bifactor models with resulted in a
non-positive definite covariance matrix); however, given the differences in model specification, bifactor
models are inherently expected to fit better and additional considerations must be taken to examine the
presence of any meaningful differences (Gignac, 2016; Mansof & Reise, 2017; Murray, 2013; Reise,
2013; Rodriguez, 2016). The Schmid-Leiman (1957) was used to calculate the factor contributions within
the higher-order model to the subtest indicators and make them comparable to the loadings of the
bifactor model (Brown, 2015; Gignac, 2016; Schmid & Leiman, 1957). While the statistical utility of this
procedure has been debated (Mansof & Reis, 2017), and considerably more complex methods could be
used to make a more exact mathematical comparison (e.g., Yang, Caemmere, & Reynolds, 2016), the
approach was deemed acceptable for the purposes of this paper. Our results demonstrated high
similarity between the model variants, indicating no clear evidence in favor of the either bifactor or
high-order models.
Given our results in the context of increasingly popular bifactor models that lack clarity on their
theoretical and clinical distinctions from higher-order models, several issues warrant further discussion
and investigation. First, to what extent are factor structures simply driven by model complexity? As
demonstrated in our review of key papers examining WAIS-IV factor structure (Table 2.1), models tested
across papers vary widely, particularly in terms of factor structure, model configuration, and
modification indices. This makes it unclear if certain models (e.g., four-factor versus five-factor, higher-
order versus bifactor) were excluded on an empirical basis or due to researcher bias, and if model
54
modifications were theoretically driven or applied in an effort to essentially maximize the fit statistics of
a given model. In this study, we took precaution against these issues by establishing a consistent set of
models and variants based on the extant literature and reviewing modification indices post-hoc. While
we consider this a strength of the study, and modification indices suggested that we did not exclude any
important alternate models, the inclusion of additional models may have provided further psychometric
insight into the Chilean WAIS-IV.
A second issue has to do with the need for continued discussion and investigation regarding the
distinctions between the constructs of direct (bifactor) and indirect (higher-order) g, as well as other
broad factors (indices). The state of intelligence literature strongly conveys a sense of two “camps”, one
strongly in favor of higher-order models (e.g., Keith & Reynolds, 2018l; Weiss, Keith, Zhu, & Chen,
2013a; 2013b) and the other strongly in favor of bifactor models (e.g., Cucina & Byle, 2017; Frisby &
Beaujean, 2015; Gignac, 2008; Gignac & Watkins, 2013). While this study does not provide sufficient
evidence for one perspective over the other, we echo Straffaroni et al.’s (2018) call for continued
conversation, and we believe a series of systematic validation studies in samples ranging in age, clinical
presentation, and cultural origin could help to elucidate the theoretical underpinnings of general
intelligence and its broad factors. For example, an alternate form of the CHC model using ten subtests
has been demonstrated in older individuals, ages 70-90 years (Niileksela et al., 2013), and this model
could be examined in the Chilean and other versions of the WAIS-IV as well as other intelligence tests
(e.g., Kaufman, Johnson, & Liu, 2008). Until then, the findings from this study add to the literature calling
for caution when clinically interpreting index scores (Canivez & Kush, 2013; Gignac & Watkins, 2013;
Watkins, Dombrowski, & Canivez; 2018). Finally, future studies are needed to further examine
intelligence constructs and the CHC model in relation to other neuropsychological constructs, such as
executive functioning (Duggan & Garcia-Barrera, 2015; Floyd, Bergeron, Hamilton, & Parra, 2010;

55
Hoelzle, 2008; Jewsbury, Bowden, & Strauss, 2015; Ortiz, 2015; Schneider & McGrew, 2018; and van
Aken, Kessels, Wingbermühle, Wiltink, van der Heijden, & Egger, 2014).
Finally, this study contributes important findings to the under-researched area of cross-cultural
construct validity (Helms, 1992). The index with the highest factor loading was Gf, which suggests that
Gf may be over factored and is consistent with the literature demonstrating potential redundancies in Gf
and g (see Cavinez, Dombrowski, & Watkins, 2018). Subsequently lower factor loadings were found for
Gv/Gc, Gsm, and Gs. Comparing factor loadings of our best-fitting models to similar models fit with the
United States standardization data show that highest factor loadings across higher-order and bifactor
variants were found most consistently in Gc subtests for the Chilean WAIS-IV, and were more variable
(ranging across Gc, Gv, Gf) in United States Models (Gignac, 2014; also see Niikesla et al., 2013 and
Staffaroni et al., 2018). While few conclusive determinations about underlying construct validity
differences can be made from these comparisons, the results from this study contribute another (albeit
small) piece of information to the accumulating literature suggesting stronger cross-cultural differences
in nonverbal tests and dispelling the myth of intelligence test universalism (Brickman, Cabo, & Manly;,
2006; Cores et al., 2015; Daugherty, Puente, Fasfous, Hidalgo-Ruzzante, & Pérez-Garcia, 2017; Flores et
al., 2017; Gasquoine, 1999; O’Bryant, Edwards, Johnson, Hall, Gamboa, & O’jile, 2018; Olson & Jacobson,
2014; Rivera Mindt et al., 2019; Rivera Mindt, Byrd, Saez, & Manly, 2010; Rosselli & Ardila, 2003).
Future research dedicated to systematic evaluation of cross-cultural construct validity in intelligence and
other cognitive tests is vital.
Summary
This study in the Chilean WAIS-IV adds to the scarce literature investigating alternative WAIS-IV
factor models in cross-cultural contexts. It adds new information demonstrating that arithmetic is not
suitable for cross-loading on VCI/Gc in the Chilean WAIS-IV. These results are consistent with the
growing literature supporting a five-factor CHC model as a potentially more adequate description of

56
Chilean WAIS-IV data. With regards to factor structure, the fit statistics favored the bifactor models;
however, the implications for this finding are not yet clear. In particular, more research is needed
consistently applying transformations and more complex methods (e.g., Schmid-Leiman transformation;
Yang et al., 2017) to make higher-order and bifactor models directly comparable (Gignac, 2016). While
results have implications for the clinical interpretation of the Chilean WAIS-IV (e.g., conceptualizing full-
scale intelligence quotient as a breadth factor rather than a superordinate factor of index-level abilities),
further studies examining the clinical utility and cross-cultural replicability of WAIS-IV bifactor and CHC
models are needed.

57
Chapter 3. Developing Short Forms of the Chilean adaptation of the WAIS-IV for Intellectual Screening*
Emily C. Duggan1, 2, 3, Alfredo Ardila4, Scott M. Hofer1, Mauricio A. Garcia-Barrera1
1University of Victoria, Victoria, BC, Canada
2Medical University of South Carolina, Charleston, SC, USA
3Ralph H. Johnson Veteran Affairs Medical Center, Charleston, SC, USA
4Florida International University, Miami, Florida, USA
*Manuscript to be submitted to Psychological Assessment.
All work in this chapter was conceived of and carried out by me, with the exception of the critical feedback incorporated into the execution of some analyses and the writing of this manuscript by my other committee members.
58
Abstract
Objective: The recent publication of the Chilean adaptation of the WAIS-IV (Wechsler, 2013) has
contributed to ongoing efforts to provide more psychometric instruments culturally appropriate for
regions in South America. While not all assessment situations necessitate administration of the full WAIS
and calculation of a full-scale intelligence quotient (FSIQ), there is virtually no published research on
WAIS-IV short forms for estimating IQ in Spanish-speaking individuals. Additionally, IQ short forms in the
literature are often criticized for poor theoretical foundation and psychometric relationship to the
parent instrument. Thus, this study aimed to systematically derive the most psychometrically robust
short forms using two, three, four, and five subtests for the Chilean WAIS-IV. Method: The original
standardization data (N=887) was used to derived short forms based on a thorough set of criteria and
methods, adapted from those described by Smith et al. (2000), including evaluation of reliability,
validity, factor structure and construct consistency, and clinical correspondence. Results: We reduced
the 4,928 possible short form combinations down to the 28 best short forms (7 two-subtests versions, 7
three-subtest versions, 8 four-subtest versions, and 6 five-subtests versions) consistent with traditional
Wechsler and Cattell-Horn-Carroll models of intelligence. Tables for estimating IQs and their 95%
confidence intervals using these short forms were also produced using linear scaling (“Tellegen and
Briggs Procedure”, 1967). Discussion: This paper provides a psychometrically robust set of IQ estimation
tools using the Chilean WAIS-IV, an instrument widely used throughout Latin America. While further
research is needed to establish the external validity of these measures, and caution must be used when
implementing short forms, these screening tools help expand empirically supported instrument
selection in Latin America and contribute to the pressing call for the development of international
assessment tools and research.
59
Introduction
The Wechsler Adult Intelligence Scale-Fourth Edition (WAIS-IV; Wechsler, 2008b), a measure of
intelligence and global cognitive ability, is one of the most popular assessment instruments
internationally (Rabin, Paolillo, & Barr, 2016; Elbulok-Charcape, Rabin, Spadaccini, & Barr, 2014). The
WAIS-IV is made up of 10 core subtests and five supplementary tests, which yield the Full-Scale
Intelligence Quotient (FSIQ) and other index scores, including the Verbal Comprehension Index (VCI),
Perceptual Reasoning Index (PRI), Working Memory Index (WMI), and the Processing Speed Index (PSI).
According to the WAIS-IV administration manual, the estimated administration time to obtain the FSIQ
ranges from 65 to 90 minutes; yet that figure can increase notably when assessing clinical populations
(Ryan, Lopez, & Werth, 1998). Not all assessment scenarios, however, call for a precise IQ and the
detailed information generated by a comprehensive WAIS-IV administration. In fact, a shortened IQ
estimate based on fewer subtests often is all that is needed in many clinical and research scenarios, such
as global intelligence screening, re-evaluations, and monitoring (Christensen, Girard, & Bagby, 2007;
Sattler & Ryan, 2009). In assessments of individuals with sensory, motor, physical, and/or psychological
constraints, full assessment may simply not be feasible or ethical (Crawford, Allum, & Kinion, 2008;
Sattler & Ryan, 2009). Furthermore, there have been increasing demands on psychologist to provide
more efficient care within the broader healthcare system (Eisman et al., 2000; Sanchez & Turner, 2003).
In response to inherent demand, numerous WAIS short forms have been developed for the
current and prior versions of the WAIS. However, there is no simple procedure for deciding the content
of a short form given the enormous amount of potential subtest combinations, and a myriad of short
forms have ranged from one to nine subtests using methods including proration (Meyers, Zellinger,
Kockler, Wagner, & Miller, 2013), regression (Crawford & Howell, 1998; Denney, Ringe, & Lacritz, 2015),
and linear scaling (also known as linear equating, the deviation quotient method, or the “Tellegen &
Briggs procedure”, Tellegen & Briggs, 1967; Silverstein, 1990). WAIS short forms include those for the

60
WAIS-IV (Batchelor & Meyers, 2013; Bulzacka et al., 2016; Denney et al., 2015; Girard, Axelrod, Patel, &
Crawford, 2015; Meyers et al., 2013; Olivier et al., 2014; Ryan, Kreiner, Gontkovsky, & Glass Umfleet;
2015; Sattler & Ryan, 2009; Wechsler, 2008b, 2008c), the Wechsler Adult Intelligence Scale-Third Edition
(WAIS-III; Axelrod, Ryan, & Ward, 2001; Blyler, Gold, Iannone, & Buchanan, 2000; Christensen, Girard, &
Bagby, 2007; Clara, 2000; Crawford, Allum, & Kinion, 2008; Donnell, Pliskin, Holdnack, Axelrod, &
Randolph 2007; Fuentes-Durá, Romero-Peris, Dasí-Vivó, & Ruiz-Ruiz, 2010; Girard, Axelrod, & Wilkins,
2010; Pilgrim, Meyers, Bayless, & Whetstone, 1999; Reid-Arndt, Allen, & Schopp, 2011; Ringe, Saine,
Lacritz, Hynan, & Cullum, 2002; Schoenberg, Duff, Dorfman, & Adams, 2004; van Duijvenbode, Didden,
van den Hazel, & Engels, 2016; van Ool et al., 2017; Wagner, Pawlowski, Yates, Camey, & Trentini, 2010;
Wechsler, 1997), the Wechsler Adult Intelligence Scale-Revised Edition (WAIS-R; Kaufman, Ishikuma, &
Kaufman-Packer, 1991; McPherson, Buckwalter, Tingus, Betz, & Black, 2000; Mendella, McFadden,
Regan, & Medlock, 2000; Miller, Steiner, & Goldberg, 1996; Ryan & Ward, 1999; Satterfield, Martin, &
Leiker, 1994; Silverstein, 1982; Silverstein, 1985; Ward, 1990), and not strictly short forms, but related,
the first and second editions of the Wechsler Abbreviated Scale of Intelligence (WASI and WASI-II;
Wechsler, 1999; Wechsler, 2011).
Wechsler short forms remain the most frequently employed type of brief intelligence testing
(Thompson, LoBello, Atkinson, Chisholm, & Ryan, 2004) and research demonstrates their utility in non-
clinical (Meyers et al., 2013; Sattler & Ryan, 2009) and clinical samples (Bulzacka et al., 2016; Denney et
al., 2015; Girard et al., 2015; Oliver et al., 2014; Ryan et al., 2015). Their popularity has been attributed
to numerous factors, including the high cost of testing materials, familiarity with and preference for
Wechsler tests, and easy accessibility, implementation and flexibility to expand to full intelligence
assessment when needed (Girard et al., 2010; Thompson et al, 2004; Wright et al., 2017).
While the diversity, flexibility, and brevity of WAIS short forms make them appealing,
development of short forms creates many psychometric challenges. Essentially, with the elimination of

61
each subtest, the psychometric quality of the instrument, and thus the ability to accurately and reliably
estimate IQ decreases. Short forms have been highly criticized for not providing adequate psychometric
evidence and justification (e.g., statistical problems associated with validity coefficients when using
short form data acquired from full administration, acceptable cost versus benefit), and
recommendations have ranged from cautioned short form use to outright abandonment in favor of well-
supported abbreviated intelligence tests (Anderson, 2016; Axelrod, 2002; Kaufman & Kaufman, 2001;
Levy, 1968; Silverstein, 1990; Smith, McCarthy, & Anderson, 2000; Tellegen & Briggs, 1967; Wymer,
Rayls, & Wagner, 2003).
Noticeably absent from these criticisms of short forms, however, are broader conversations
surrounding the cultural psychology (Ardila, 1995; Brickman, Cabo, & Manly, 2006; Pedraza & Mungas,
2008) implications of calls to abandon short forms in favor of new instrument development (e.g.,
standalone abbreviated intelligence tests). In fact, lack of assessment tools and norms is a top barrier
affecting cultural neuropsychologists, especially in Latinx populations (Arango-Lasprilla, Stevens, Morlett
Paredes, Ardila, & Rivera, 2017; Fernandez, 2019; Fernandez, Ferreres, Morlett-Paredes, Rivera, &
Arango-Lasprilla, 2016; Fonseca-Aguilar et al., 2015; Olabarrieta-Landa et al., 2016; Echemendia &
Harris, 2004; Echemendia, Harris, Congett, Diaz, & Puente, 1997; Manly, 2008; Suchy, 2016). This is
highly problematic given the profession’s ethical obligation to provide services to culturally diverse
populations, and psychologists have been urged to stop waiting for ideals and to immediately produce
practical solutions that meet the significant demand (American Educational Research Association,
American Psychological Association [APA], & National Council on Measurement in Education, 2014; APA,
2003, 2017; Clauss-Ehlers, Chiriboga, Hunter, & Roysircar, 2019; Marsella, 1998; Morgan-Consoli, Inman,
Bullock, & Nolan, 2018; Suzuki & Ponterotto, 2008; Uzzell, Ponton, Ardila, 2007).
Even within the large body of WAIS short forms research there is surprisingly little cross-cultural
research available, with the vast majority of Wechsler short forms developed and researched in North
62
America. For Spanish-language assessment, no WAIS-IV short forms, to our knowledge have been
published, and the little research on WAIS-III short forms (e.g., Fuentes-Durá et al., 2010; Úbeda,
Fuentes, & Dasí, 2016) has been rendered obsolete by the lack of psychometric support and calls for
discontinued use of these versions of the WAIS (i.e., Escala de Inteligencia de Wechsler para Adultos-
Tercera Edición Spainish, Puerto Rican and Mexican versions; Thaler & Jones-Forrester, 2013; von
Thomsen, Gallup, Llorente, 2008). While there are some Spanish-language brief intelligence instruments
(e.g., Kaufman & Kaufman, 2004; Lange et al, 2012; Santamaría, Arribas, Pereña, & Seisdedos, 2005;
Santamaría & Fernández Pinto, 2009), they are not well known or studied and, in our experience,
psychologists working Latin American settings tend to favor the more-established WAIS-IV.
Pragmatically speaking, calls for new instrument development are idealistic, but unhelpful in meeting
the current needs of cultural psychologists working with limited resources. Thus, while psychologists
continue developing new culturally appropriate assessment tools, a strong argument can be made for
the use of short forms in countries beyond the United States since the WAIS-IV has been adapted into at
least 26 cultural and language versions (Pearson Clinical, 2019) and is one of the most widely used
instruments in the world (Rabin et al., 2016).
Rather than rejecting short forms in their entirety, Smith et al. (2000) produced a set of
guidelines addressing reliability and validity issues typically ignored by short form developers that, if
“followed, then researchers will be in a strong position to argue that their short form is a reliable, valid
alternative to a fuller, more comprehensive assessment (p. 110).” These guidelines include
recommendations on demonstrating reliability, validity, overlapping variance with the full instrument,
preserved classification rates, and factor structure consistency. In this paper, we adapted these
guidelines to expand the selection of Latinx, low-cost, easy-to-implement psychometric tools for
intelligence screening by developing short forms for the Chilean version of the WAIS-IV (Wechsler, 2013)
using the original standardization data. The main goal of this study was to rigorously and systematically

63
establish a set of the best two-, three-, four-, and five-subtest Chilean WAIS-IV short forms that
demonstrate reliability, validity, and consistency of factor structure, and consistent of clinical
classification with the full instrument using a linear scaling approach. Given the psychometric strength of
the Chilean WAIS-IV (Wechsler, 2013; Rosas et al., 2014; Duggan & Garcia-Barrera, 2019) and research
demonstrating the feasibility of robust WAIS short form development (as reviewed above), we
hypothesized that we would be able to develop the projected set of psychometrically supported and
clinically useful Chilean WAIS-IV short forms.
Methods
Measures
The Chilean version of the WAIS-IV (Wechsler, 2013; Rosas et al., 2014) is an adaptation of the
Spanish WAIS-IV (Wechsler, 2012a), which was the first Spanish-language test adapted from the original
United States WAIS-IV (Wechsler, 2008b, 2008c). The Chilean WAIS-IV includes the same subtests, items,
and score structure as the Spanish and United States WAIS-IV, with only minor cultural adaptations to
item content/scoring. Consequently, it has 10 core subtests (Similarities [SI], Vocabulary [VC],
Information [IN], Block Design [BD], Matrix Reasoning [MR], Visual Puzzles [VP], Digit Span [DS],
Arithmetic [AR], Symbol Search [SS], and Coding [CD]) and five supplemental subtests (Comprehension
[CO], Figure Weights [FW], Picture Completion [PC], Letter-Number Sequencing [LN], and Cancellation
[CA]), which yield four index scores (Verbal Comprehension Index [VCI], Perceptual Reasoning Index
[PRI], Working Memory Index [WMI], and Processing Speed Index [PSI]) and a Full-Scale Intelligence
Quotient (FSIQ). According to the Chilean WAIS-IV technical data, internal Pearson consistency reliability
for the test as whole (FSIQ) is 0.941, with mean index reliability coefficients of 0.951 for VCI, 0.874 for
PRI, 0.912 for WMI, and 0.854 for PSI, and subtest reliabilities ranging from 0.733 to 0.925. These
reliabilities are comparable to those reported in the United States WAIS-IV manual (mean reliability for
United States FSIQ = 0.98, VCI = 0.96, PRI = 0.95, WMI = 0.94, PSI = 0.90, and subtests ranging from 0.78

64
to 0.94). Additional technical information about the Chilean WAIS-IV is provided in the administration
manual (Wechsler, 2013) and accompanying technical information (Rosas et al., 2014; Duggan & Garcia-
Barrera, 2019).
Participants
This study used the original Chilean WAIS-IV standardization sample data, which comprises 887
Chilean, Spanish-speaking individuals ages 16:00 to 90:00 representative of the general Chilean
population (Mage=47.17, SDage=23.62, 52% women; Wechsler, 2013; Rosas et al., 2014). Since individuals
aged 70 years and older were only administered 12 of the 15 WAIS-IV subtests (FW, LN, and CA
omitted), only 672 individuals completed all 15 subtests (Mage=36.93, SDage=17.12, 50.45% women).
Analyses including FW, LN and CA were adjusted accordingly for this difference (Wechsler, 2013; Rosas
et al., 2014).
Procedure for Establishing Best Short Forms
Data was used with permission from the standardization team and approved by the Human
Research Ethics Board at the University of Victoria (Protocol Numbers 18-129). The guidelines outlined
by Smith et al. (2000) were adapted to establish the following rigorous and iterative approach for
determining the best two-, three-, four-, and five-subtest short forms of the full Chilean WAIS-IV. The
entire short form derivation process is depicted in Figure 3.1 and described step-by-step below.
Whenever possible, the most stringent criteria were applied in the short form development to ensure
psychometric strength. All statistics were calculated using Microsoft Excel and SPSS Statistics Version 25
(IBM, 2017) and confirmatory factor analysis was conducted in Mplus Version 8 (Muthén & Muthén,
1998-2017). Standardized subtest scores were used for analysis and the original correlation matrix for
the Chilean WAIS-IV standardization sample is reported by Rosas et al. (2014). All statistics pertaining to
the factor structure of the full WAIS-IV, as referred to below, were estimated in a separate study by
Duggan & Garcia-Barrera (2019) and are summarized in Supplemental Table 3.1.

65
Step 1: Evaluate reliability and validity of all short forms. First, reliability coefficients (rss) and
validity (r) coefficients (part-whole correlations) for all subtest combinations (105 two-subtest
combinations, 455 three-subtest combinations, 1365 four-subtest combinations, and 3003 five-subtest
combinations) were calculated per the methods outlined by Tellegen & Briggs (1967) and Sattler & Ryan
(2009, p. 284) as follows:
Since the estimation methods are prone to redundant error variance because the subtests are
embedded within the full-scale instrument, correlations for estimating validity coefficients were
corrected using Levy’s (1967) method, as shown in the equation above (Girard & Christensen, 2008).
Note that classification of subtests as core or supplemental is based on the psychometrics and tradition
of the United States WAIS-IV (Wechsler, 2008c) and research has demonstrated that subtests may not
have consistent properties across different cultural versions of the WAIS-IV (Duggan et al., 2018; Duggan
& Garcia-Barrera, 2019). Thus, all 15 Chilean WAIS-IV subtests were initially considered as candidates for
inclusion in short forms.
Reliability and validity coefficients of all possible short forms were used to evaluate baseline
estimates (Figure 3.1, Row 1). While coefficients above 0.70 are typically deemed as good (Hair, Black,

66
Babin, & Anderson, 2010; Kline, 2013; Smith et al., 2000, values considered acceptable for short for
selection are higher, with reliabilities above 0.90 and validity coefficients above 0.82 (Donders &.
Axelrod, 2002). As a result, any short form combination falling below these values (rss < 0.90 and r <
0.82) was eliminated (Figure 3.1, Row 2).
Steps 2-4: Reduce short form combinations through a theoretical and empirical basis. Next, we
reduced that number of potential short form combinations by using a series of steps, guided by the
principles outlined by Smith et al. (2000), to ensure theoretical and empirical alignment with
contemporary intelligence theory. As studies investigating WAIS-IV factor structure provide robust
support for a breadth factor (i.e., full-scale intelligence quotient [FSIQ]/general intelligence [g]), but less
consistent support for the clinical interpretation of index scores (Canivez & Kush, 2013; Duggan &
Garcia-Barrera, 2019; Gignac & Watkins, 2013; Watkins, Dombrowski, & Canivez; 2018), the focus of
short form development in this study was only to provide the best estimate of FSIQ as possible.
Step 2: Eliminate short forms with poor theoretical alignment that inadequately preserve and
prioritize content domains. As extensively discussed by Smith et al. (2000), Silverstein (1990) and others,
short forms must preserve the content domains represented by the subfactors of the full instrument.
For the WAIS-IV, substantial evidence has provided support for both a traditional Wechsler (four-factor)
model and a Cattell-Horn-Carroll (CHC, five-factor) model (Duggan & Garcia-Barrera, 2019). The
Wechsler model uses the WAIS-IV subtests as indicators of factors representing verbal abilities (Verbal
Comprehension Index [VCI] as indicated by SI, VC, IN, and CO), perceptual reasoning abilities (Perceptual
Reasoning Index [PRI], as indicated by BD, MR, VP, FW, and PC), working memory abilities (Working
Memory Index [WMI], as indicated by DS, AR, and LN), and speed of cognitive processing (Processing
Speed Index [PSI], as indicated by SS, CD, and CA), which are then combined to indicate overall
intellectual ability (FSIQ). The CHC model as applied to the WAIS-IV is similar to the Wechsler model, but
a fifth factor is created by separating PRI into two factors (Benson et al., 2010). Thus VCI is akin to

67
crystallized intelligence (Gc), WMI akin to short-term memory (Gsm), and PSI akin to processing speed
(Gs), and PRI is split into fluid intelligence (Gf, as indicated by MR, AR, and FW) and visual processing
(Gv, as indicated by BD, VP, and PC). As such, content domains in the Wechsler model comprise VCI, PRI,
WMI, and PSI, while content domains in the CHC model comprise Gc, Gf, Gv, Gsm, and Gs.
Without conclusive evidence in favor of one model over the other, both Wechsler and CHC
models were used to guide inclusion and exclusion of subtests in relation to content domains. While
many short forms not aligning well with intelligence theory should theoretically be eliminated in the first
derivation step (eliminating combinations with insufficient reliability and validity), an additional
screening step is needed to ensure surviving combinations adequately preserve and prioritize content
domains. Suitable combinations meeting this criterion vary greatly based on the number of the tests in
the short form. Here we employed the following guidelines. First, no short form should be comprised
entirely of subtests from the same content domain (e.g., the three-subtest combination SI, VC, and IN
consists of only VCI/Gc subtests and thus would not be suitable). Second, subtest combinations must
prioritize the most robust content domain indicators of FSIQ, as evidenced by factor analytic evidence.
In the Chilean WAIS-IV, Duggan & Garcia-Barrera (2019) found the most robust Wechsler indicator of
FSIQ was PRI, followed by VCI, WMI, and PSI. For CHC models, the most robust indicator of g was Gf,
followed by Gv, Gc, Gsm, and Gs.
Based on these principals, the following criteria were established. For two-subtest short forms:
(1) two content domains must be represented, (2) a test of PRI/Gf/Gv must be included, (3) no tests of
PSI/Gs, (3) AR (Gf) cannot be combined with DS or LN (WMI/Gsm). For three- and four-subtest short
forms: (1) two or three content domains must be represented (or in the CHC model Gv and Gf cannot be
solely represented), (2) WMI/Gsm and PSI/Gs cannot be the only two domains represented, (3) VCI/Gc
and PSI/Gs each cannot be represented twice, (4) WMI/Gsm cannot be represented twice, with the
exception of AR (which can also be considered a Gf subtest) as long as it is combined with tests of

68
PRI/Gv and VCI/Gc, (5) VCI/PRI cannot be represented 3 times. For five-subtest short forms: (1) at least
three content domains must be represented (2) a domain cannot be represented with all of its subtests
(or in the CHC model Gv and Gf cannot be solely represented), (3) WMI/Gsm and PSI/Gs combined can
only be represented by two subtests, with the exception of AR (if considered a Gf subtest). Short forms
candidates not aligning with the Wechsler or the CHC model based on these criteria were eliminated
from further consideration (Figure 3.1, Row 3).
Step 3: Eliminate non-robust indicators of FSIQ. Factor loadings for the Chilean WAIS-IV were
previously estimated in our study examining its alternative factor structures (Duggan & Garcia-Barrera,
2019). Since that study provided support for both Wechsler (four-factor) and CHC (five-factor) models,
as well as higher-order and bifactor model variants, here we aggregated information across all best
study models to inform short form development. Specifically, we averaged factor loadings for each
subtest indicator of FSIQ across best models (as computed in Duggan & Garcia-Barrera, 2019 and
including the Schmid-Leiman transformation; Schmid & Leiman, 1957) to make higher-order loadings
directly comparable to bifactor loadings). These calculations are summarized Supplemental Table 3.1.
The higher a factor loading is, the more it contributes to defining a factor’s dimensionality.
Standardized loadings of 0.30 to 0.40 are typically considered reasonably strong, loadings of .70 to .80
are commonly considered very strong, and values of 1.0 represent an optimal, but unlikely level in ‘real-
life’ data (Furr & Bacharach, 2014). Sample size and numbers of indicators, however, should also be
taken into consideration when interpreting factor loadings. For instance, factors with four or more
loading values of 0.60 or greater are deemed reliable, regardless of sample size (Guadagnoli & Velicer,
1988 as cited in Stevens, 2002). Given the variable number of indicators used per factor depending on
the models, the intermediate criterion of >.60 was selected as the cutoff in this study (Figure 3.1, Row
4).

69
Step 4: Eliminate short forms with inadequate factor structure consistency. For this step, each
set of short form combinations were ranked based on highest mean combined reliability and validity
coefficients. The top 25 candidates from each short form version were carried through to the next step,
examining factor structure consistency using confirmatory factor analysis (i.e., short forms as indicators
of estimates FSIQ; Figure 3.1, Row 5; Supplemental Table 3.2). Models were evaluated using chi-square
(2) test, comparative fit index (CFI), Tucker-Lewis index (TLI), and root mean square error of
approximation (RMSEA), The established cutoff criteria were used for model comparison (i.e., optimal
CFI/TLI > 0.95, adequate RMSEA < 0.08, 2 closer to zero the better; Hu & Bentler, 1999; Jackson,
Gillaspy, & Purc-Stephenson, 2009; Marsh, Balla, & McDonald, 1988; Brone & Cudek, 1993 as cited in
Schermelleh-Engel, Moosbrugger, & Müller, 2003; Schreiber, Nora, Stage, Barlow, & King, 2006). Factor
loadings of <0.6 were again deemed inadequate. Any models with one or more of these parameters
below the established cutoffs were excluded from further consideration (Figure 3.1, Row 6;
Supplemental Table 3.3). Note that two-subtest short form models have negative degrees of freedom
and three-subtest short form models have zero degrees of freedom. Thus, fit statistics for these short
forms cannot be estimated for this and a number of other statistical reasons and this method cannot be
used to reduce two-subtest and three-subtest short forms.
Step 5: Estimate IQ with linear scaling (the Tellegen & Briggs Procedure). Linear scaling takes
subtest score-combinations and rescales them using deviation quotients (Tellegen & Briggs, 1967). This
was the same method used in obtaining the original deviation quotients in the WAIS and was used here
to generate estimated IQ for the best remaining two-, three-, four-, and five-subtest short forms as
identified through the methods above. Specifically, composites of subtest scales scores are linearly
scaled into deviation quotients with mean of 100 and standard deviation of 15 per the following formula
(Tellegen & Briggs, 1967; Sattler & Ryan 2009, p. 283):

70
These IQ estimates were used to generate the norms tables for the final set of short forms. As part of
this process, we also calculated 95% confidence intervals (CIs) for all scores (Oosterhuis, van der Ark, &
Sijtsma, 2017) and well as the reliable and unusual ranges for the scaled scores (Sattler & Ryan, 2009).
Step 6: Eliminate short forms with inadequately preserved clinical content and classification.
To determine agreement between true and estimated IQs, we calculated their difference scores and
evaluated them based on the percentage of scores falling within ±2, ±5, and ±10 points of the FSIQ.
These values represent approximately one standard error of measurement (SEM), two standards of
measurement, and one standard deviation (SD) for two-subtest for forms. Note that for five-subtest
short forms, these values are approximately ±5 points (1 SEM), ±10 points (2 SEM), and ±14 points (1
SD). While these values vary from those for the full instrument (±3 points = 1 SEM, ±6 = 2 SEM, and ±15
points = 1 SD), the two-subtest values capture the most stringent parameters for evaluating clinical
classification. Therefore, for consistency sake, we evaluated all short forms using these values.
Further, an estimated IQ measure must accurately classify individuals in as close to the same
way as possible as would be obtained on the original WAIS-IV measure. Clinical classifications for FSIQ
range from: < 69 = very low, 70-79 = borderline, 80-89 = low average, 90-109 = average, 110-119 = high
average, 120-129 = very superior, to > 130 = very superior. Clinical classification accuracy was examined
using percentage of individuals falling within same classification levels, as well as rates and magnitudes
of classification errors among individuals (i.e., percentage of individuals falling within one-to-six clinical
classification levels lower or higher). Short forms that did not adequate demonstrate preserved clinical

71
classification, defined as producing fewer than 80% of estimated IQs within 1 SD of the true FSIQ and
producing any estimated IQ more than 2 clinical classifications different (with no more than 5% of scores
2 classifications different), were eliminated (Figure 3.1, Row 6).
Step 7: Eliminate any further short forms based on cost-benefit justification and pragmatic
considerations. Since the goal of a WAIS-IV short form is to provide the most accurate IQ estimation in
as little time as possible (Silverstein, 1990), final short form candidates were reviewed to ensure they
would yield total administration times that would justify the cost of lower reliability and validity than the
full instrument (Jeyakumar, Warriner, Raval, & Ahmad, 2004). Similarly, we reviewed the remaining
short forms for any combinations heavily reliant on rarely used subtests or clinical unusual
combinations. Any short forms not meeting these guidelines were considered for elimination or notated
as not ideal.
Results
Overall, all 4,928 combinations of two-, three-, four-, and five-subtests short forms of the full
Chilean WAIS-IV were reduced to the combinations with the best reliability, validity, content structure
preservation, and clinical classification preservation using the derivation process adapted from Smith et
al. (200), as depicted in Figure 3.1.
Short Form Derivation Process
All initial Pearson reliability and validity coefficients for all possible short-forms (N=4,928) fell
above the minimum criteria of 0.7 (two-subtest rss = 0.822 to 0.952, r = 0.762 to 0.856; three-subtest rss
= 0.879 to 0.958, r = 0.804 to 0.906; four-subtest rss = 0.911 to 0.964, r = 0.855 to 0.930; five-subtest rss =
0.894 to 0.950, r = 0.890 to 0.943). Results across all short form versions are reported here and depicted
in Figure 3.1, column 5. Ultimately, 455 combinations were eliminated due to having reliability or
validity coefficients below the acceptable cutoff (new n = 4,473). Next, remaining combinations were
examined for alignment with Wechsler and CHC model structure using the unique criteria developed

72
short form version. A total of 1,484 combinations did not adequately preserve content in alignment with
Wechsler and CHC theory, resulting in a total new n of 2,989 remaining short combinations. Next, the
short form derivation process calls for elimination of any subtests found to be poor indicators of FSIQ/g.
As comprehensive examination of best factor structures of the Chilean WAIS-IV was done in a separate
study (Duggan & Garcia-Barrera, 2019), we used those results that to guide selection of poor indicators
in this step. Thus, combinations containing subtests with loadings consistently falling below the
established cutoff criteria across all models (AR, FW, CD, and CA; Supplemental Table 3.1, new n = 676).
Remaining short form candidates were then ranked by highest mean combined reliability and validity
coefficients and the top 25 for each short form version were retained for further short form derivation
(new n = 90). CFA was then used to examine factor structure consistency of the remaining 90 short form
candidates. Since fit statistics for two-subtest and three-subtest models cannot be estimated (due to a
number of statistical issues, including not enough degrees of freedom), only factor loadings were
estimated for three-subtest models and full CFAs were conducted for four- and five-subtest short forms.
All models converged normally, and fit statistics were generally strong; therefore, the decision to use
the most stringent cutoff criteria across all fit statistics (as detailed above) was supported by the data
(i.e., we were not being overly stringent and eliminating too many short forms from consideration).
Overall, 32 combinations fell below the CFA cutoff criteria and were eliminated (new n = 58).
Linear scaling was used to produce tables estimating IQ with 95% CI intervals for the remaining
59 short form combinations. Thirty of these combinations did not meet the clinical classification criteria,
with more than 20% of the difference scores between estimated IQ and true FSIQ exceeding 10 points
and several combinations producing estimated IQs falling three-to-six clinical classification levels above
or below the true FSIQ. Qualitative analysis of these subtest combinations did not indicate any irregular
patterns (i.e., subtests or combinations of subtests systematically leading to inaccurate scores and mis-
classification). This yielded the 28 best short forms for the Chilean WAIS-IV, as described below. These

73
subtests are also presented in Tables 3.1-3.5 in approximate order of recommended use, based on a
combined reliability, validity, and clinical consistency factors.
Two-Subtest Short Forms
Through our iterative short form derivation process, we reduced the 105 possible two-subtest
combinations to seven best combinations (Figure 3.1, Column 1). Subtests either comprised those
aligned with Wechsler forms (consisting of a VCI/Gc and a PRI/Gf /Gv test, similar to Wechsler, 2008b,
2008c) or CHC forms (consisting of VCI/Gc or PRI/Gf/Gv and a WMI/Gsm test). These combinations most
commonly included IN, VC, MR, and DS. None of the combinations with SI or BD survived to be included
in the very best combinations. Overall, these two-subtest short forms were deemed clinically pragmatic
and efficient. Together they have a mean Pearson reliability coefficient of 0.930 and validity coefficient
of 0.857 (Table 3.1). These short forms on average produced estimated IQs that were within two points
(approximately 1 SEM) of the true FSIQ 25% of the time, within 5 points (approximately 2 SEM) 52% of
the time, and within 10 points (1 SD) 81% of the time. Additionally, on average, 57% of the estimated
IQs produced by these short forms fell within the same clinical classification as the true FSIQ and 36%
fell within one clinical classification above or below the true FSIQ. Only 3% of estimated IQs fell within 2
clinical classifications above or below the true FSIQ, and per the inclusion criteria, none of the estimated
IQs fell beyond 2 clinical classifications of the true mean. The information needed to calculate estimated
IQs and 95% CI intervals for these two-subtest short-forms is presented in Table 3.2.
Three-Subtest Short Forms
Overall, the 455 possible three-subtest short forms were reduced to the seven best
combinations (Figure 3.1, Column 2), six containing only core subtests (including SI, VC, IN, MR, VP, and
DS) and one containing a supplemental subtest (LN). Most of these short forms conceptually aligned
with the Wechsler model (one verbal, one perceptual reasoning, and one working memory subtest),
while only one combination conceptually aligned with the CHC model (one Gf, one Gv, and one Gc test)

74
met all the criteria to be retained through the derivation process. These short forms were deemed
clinically pragmatic and efficient; thus, no additional combinations were eliminated. The seven best
three-subtest short forms have a mean Pearson reliability coefficient of 0.943 and validity coefficient of
0.894. Looking at the average accuracy of the estimated IQs, 32% were within 2 points of the true FSIQ,
56% were within 5 points of the true FSIQ, and 92% were within 10 points of the true FSIQ. Clinical
classification of the estimated IQs fell within the same clinical classification of the true FSIQ 65% of the
time. 34% of the estimated IQs were one clinical classification above or below the true FSIQ and 1%
were 2 clinical classifications above or below the true FSIQ. The information needed to calculate
estimated IQs and 95% CI intervals for these three-subtest short-forms is presented in Table 3.3.
Four-Subtest Short Forms
Of the 1,365 possible combinations, a total of eight met all of the derivation criteria to be
retained as the best four-subtest short forms (Figure 3.1, Column 3). Five combinations used only core
subtests (including VC, IN, SI, MR, VP) and three combinations also used a supplemental subtest (LN).
Four of these combinations were aligned with the Wechsler model (two verbal subtests, one perceptual
reasoning subtest, and one working memory subtest), while four were more consistent with a CHC
model (one subtest each from Gf, Gv, Gc, and Gsm). While three of the final combinations contained a
supplemental subtest, they were retained given the findings supporting the robustness of these subtests
(as presented above and discussed further below). The mean Pearson reliability coefficient for these
short forms was .953 and the mean validity coefficient was 0.921. On average, four-subtest estimated
IQs were accurate within 2 points of the true FSIQ 42% of the time, within 5 points 75% of the time, and
within 10 points 96% of the time. Further, 72% of the four-subtests estimated IQs fell within the same
clinical classification, while 28% fell within one clinical classification above or below the true FSIQ and
0.70% fell within two clinical classifications above or below the true FSIQ. The information needed to
calculate estimated IQs and 95% CI intervals for these four-subtest short-forms is presented in Table 3.4.

75
Five-Subtest Short Forms
In total, only six of the 3,003 possible five-subtest combinations met all of the derivation criteria
to be retained as the best five-subtest short forms (Figure 3.1, Column 4). Two of these combinations
contained only core subtests (including SI, VC, IN, BD, MR, VP, DS, and SS) and four combinations also
included at least one supplemental subtest (PC, LN). The combinations containing only core subtests
were both aligned with the Wechsler model (two verbal subtests and one subtest each from perceptual
reasoning, working memory, and processing speed). The combinations including supplemental subtests
were all aligned with the CHC model (two Gc subtests and one subtest each from Gf, Gv, and Gsm).
Similar to the best four-subtest short forms, while many final combinations contained a supplemental
subtest, they were ultimately retained given the findings supporting the robustness of these subtests (as
presented above and discussed further below). These best five-subtest short forms have a mean
Pearson reliability coefficient of 0.936 and a mean validity coefficient of 0.936. Estimated IQs for these
short forms were, on average, within 2 points of the true FSIQ 42% of the time, within 5 points of the
true FSIQ 75% of the time, and within 10 points (1 SD) 96% of the time. In terms of clinical classification,
72% of the estimates IQs fell within the same classification level as the true FSIQ, with 28% falling within
one classification above or below the true FSIQ, and .7% falling within two classifications above or below
the true mean. The information needed to calculate estimated IQs and 95% CI intervals for these five-
subtest short-forms is presented in Table 3.5.
Discussion
Developing short forms for international adaptations of the WAIS-IV, one of the most widely
used assessment instruments in the world (Rabin, Paolillo, & Barr, 2016), is one solution to help provide
cultural psychologists much needed assessment tools (Fernandez, 2019; Manly, 2008; Suchy, 2016). In
this study, we rigorously derived a set of the most psychometrically robust estimated IQ short forms for
the Chilean WAIS-IV using two, three, four and five subtests. Overall, we found 28 short forms that met
76
our stringent set of criteria that were adapted from Smith el al. (2000) and expanded upon in this study
to further emphasize factor analytic approaches and more recent developments in contemporary
intelligence test theory within the WAIS-IV (Duggan & Garcia-Barrera, 2019). These best short forms
included four two-subtests versions, seven three-subtest versions, 10 four-subtest versions, and six five-
subtests versions. All final short forms had high internal consistency reliabilities (ranging from 0.893 to
.960) and validity (part-whole correlation) coefficients (ranging from 0.849 to 0.942). Further, the
majority of estimated IQs scores across all short forms had good consistency and clinical classification
correspondence with the true FSIQs, though short forms with more tests outperformed shorter versions
(e.g., five subtests versus two), and all of these findings were consistent with the other recent WAIS-IV
short forms research (Chan & Hua, 2019; Denney et al., 2015; Ryan et al., 2015; van Ool; 2017).
Through the derivation process, some subtests were consistently found as better candidates for
short form use than others. Of the verbal/Gc subtests, Vocabulary, Information, and Similarities were
the only ones used in the best short forms, with Vocabulary and Information being used almost three
times more often than Similarities. Several preliminary short forms contained the supplemental verbal
subtest Comprehension; however, they were all eliminated during the factor analysis stage due to being
part of models with poor fit. The perceptual reasoning subtests used in the best short forms included
Block Design, Visual Puzzles and Picture Completion (Gv subtests in the CHC model) and Matrix
Reasoning (a Gf subtest); with Matrix Reasoning being the most frequently used and Block Design most
rarely being used. Figure Weights (a perceptual reasoning/Gf subtest) was eliminated due to its
consistent poor performance, relative to other subtests, as an indicator of FSIQ/g (Duggan & Garcia-
Barrera, 2019). Similarly, Arithmetic (often split between perceptual reasoning and working memory in
the Wechsler model, and between Gf and Gsm in the CHC model) was also eliminated for consistently
underperforming as an indicator of FSIQ/g. While this may be surprising to many, considering the
longstanding use of Arithmetic in United States WAIS short forms, factor model evidence suggests that

77
Arithmetic appears to have different psychometric characteristics in the Chilean WAIS-IV (Duggan &
Garcia-Barrera, 2019). Additionally, Arithmetic and Figure Weights are often cross-loaded in numerous
and inconsistent ways across models, which may suggest that these tests have unusual properties and
would likely not best be short-form candidates in the first place (Benson et al., 2010; Duggan & Garcia-
Barrera, 2019; Weiss et al, 2013b). As a result, Digit Span and Letter-Number Sequencing were the only
working memory/Gsm subtests that were retained throughout the development of the best short forms.
Altogether, these findings suggest that Letter-Number Sequencing may be a particularly under-utilized
subtest of the Chilean WAIS-IV, given its classification as supplemental (in line with the traditional
Wechsler test structure; Wechsler, 2008c; Wechsler, 2013). Finally, the processing speed/Gs subtests
were the weakest indicators of FSIQ/g, consistent with the factor structure and short form literature,
and Symbol Search was the only test with psychometric properties exceeding the cutoff criteria (Chen &
Hua, 2019; Denney et al., 2015; Benson, Hulac, Kranzler, 2010; Weiss, Keith, Zhu, & Chen, 2013b).
Unique strengths of this study include its breadth and depth. For studies developing short forms
the United States WAIS, it makes sense to only consider inclusion of core subtests, as they were
designated as such for their relative psychometric strength. In the Chilean and other adaptations of the
WAIS-IV, however, core and supplemental tests have been designated to be consistent with the original
WAIS-IV. Given accumulating evidence of psychometric differences between some subtest across
different versions of the WAIS-IV (Duggan et al., 2018; Duggan & Garcia-Barrera, 2019), this study gave
all 15 subtests equal initial consideration for inclusion in short form combinations. Further, this research
design contributes a rich array of information that can ultimately be used to investigate psychometric
differences that may contribute to cognitive ability differences seen across different cultural groups
(Duggan et al., 2018; Frisby & Beaujean, 2015). The short form derivation process can easily be adapted
based on developments in Wechsler and CHC intelligence theory, as well as in response to varying
psychometric evidence across WAIS-IV (and other Wechsler intelligence test) adaptations. Despite this

78
comprehensive approach, two commonly used “short forms” were not included in this research study:
the General Ability Index (GAI) and the Cognitive Processing Index (CPI), which have not yet been
developed for the Chilean WAIS-IV. The GAI (derived only from verbal and perceptual reasoning
subtests) and the CPI (derived from working memory and processing speed subtests) are two optional
index scores developed for the United States and other versions of the WAIS-IV that provide clinical
information helpful for characterizing global abilities and understanding individual patterns of, and
discrepancies between cognitive strengths and weaknesses (Wechsler, 2008b, 2008c; Weiss, Saklofske,
Coalson, & Raiford, 2010). Given the demonstrated clinical utility of these scores and their newfound
mainstay in contemporary WAIS assessment (Drozdick, Holdnack, Salthouse, & Cullum, 2013; Harrison,
Glass, Bartles, & Ryan, 2009; Iverson, Holdnack, & Lange, 2013; Lange & Chelune 2006; Wechsler, 2008b,
2008c), it is important for future research to develop the GAI and the CPI for the Chilean and other
cultural adaptations of the WAIS-IV.
A second strength of this study was our incorporation of factor analytic evidence through
several stages of the derivation process. Past short forms have been criticized for neglecting this
important information (Smith et al., 2000), and to our knowledge, only one investigation of WAIS-IV
short forms has incorporated a similar factor analysis approach, albeit only in three-subtest short forms
of the Taiwanese WAIS-IV (Chen & Hua, 2019). Overall, this study presents a pragmatic set of short-
forms with their corresponding estimated IQ tables that are ready for use in future research. Next
studies of Chilean WAIS-IV short forms should aim to establish their external in clinical and non-clinical
samples, demonstrate their psychometric consistency as standalone instruments (i.e., not administered
as part of the whole WAIS-IV as is done in the standardization sample), and demonstrate invariance
across sex and age (Silverstein, 1990; Smith et al., 2000). Additional investigation may also evaluate
these linear scaling methods against regression methods also often used to develop short forms. Even if
provided empirical support of their external validity, in coordination with the reliability, validity, and

79
clinical consistency evidence presented here, we urge clinicians and researchers to use substantial
caution when using short forms. Short forms should never be used when a classification is needed for
clinical, psychoeducation, legal, or similarly consequential decisions. Additionally, IQs derived from short
forms must always be presented as “estimated” and they should not be used when the difference
between individual scaled scores exceed the unusual range (as presented in Tables 3.2-3.5).
Despite information always being lost when using a short form, having a strong set of tools to
efficiently produce reasonable IQs estimates for screening and research is ultimately expected to
provide great benefit to psychologists in Latin America, a region long calling for stronger local
articulation of and international integration with psychological science (Benito, 2012). Based on our
personal experiences, the Chilean WAIS-IV has become the most widely used intelligence assessment
instrument throughout all of Latin America, which is not surprising given that the WAIS-IV has only been
developed so far (to our knowledge) for Chile, Colombia, Argentina, and Mexico. Additionally,
standalone abbreviated intelligence assessment instruments developed for Latin American populations
are very scare and many researchers and clinicians simply do not have enough resources to essentially
“catch up” in developing the breadth and depth of test selection in the United States and other
countries.
The most important aspect of this paper is the presentation of a set of short forms that are
ready to use in research and clinical settings. To use the estimated IQ conversion tables, a practitioner
simply follows the following steps:
1. Chose the short form that best suits their research or clinical needs.
2. Administers those select short form tests.
3. Convert the raw tests scores into scaled scores.
4. Look up the sum of the scaled scores in the appropriate table (Table 3.2-3.5) to obtain
that individual’s estimated IQ and the 95% CI interval for that estimate.

80
While numerous short form options are presented in Tables 3.1-3.5, they are listed in approximate order
of recommended use, based on a combined reliability, validity, and clinical consistency factors.
Practitioners are encouraged to select short forms based on thoughtful consideration of their testing
situation (e.g., time, sample characteristics, intended use of the estimated IQ score, potential need for
“parallel forms” across multiple testing occasions, etc).
The use of these short forms is illustrated in the following two examples. First, take scores
(obtained from an anonymized research database) from a randomly selected 28-year-old woman who
was administered the full Chilean WAIS-IV and obtained a FSIQ of 124. Using the first two-subtest short
form listed in Table 3.2, we sum her Information and Matrix Reasoning scaled scores (14 and 13,
respectively) for a total of 27, which yield an estimated IQ of 120 (116-124 95% CI), a score that is highly
consistent with her FSIQ obtained with 10 subtests. As a second example, take a 50-year-old man (also
randomly selected from an anonymized research database), who obtained a FSIQ of 102 on the full
Chilean WAIS-IV. Using the first four-subtest short form listed in Table 3.4. Summing his Vocabulary,
Block Design, Matrix Reasoning, and Digit Span scaled scores (10, 9, 14, and 8, respectively) we get a
total of 41, which yields an estimated IQ of 102 (96-106 95% CI); again, highly correspondent with his
true FSIQ.
As shown though these examples, the short forms presented in this paper possess significant
utility throughout Latin America. For example, they can be used throughout a variety of clinical settings
requiring only rough estimation of IQ, such as screening individuals to determine if further testing is
warranted, or when testing an individual who cannot tolerate extended testing. In research, often only
an estimate IQ is needed to quickly screen for individuals for inclusion/exclusion, or to provide an IQ
estimate that will be used as a demographic variable. Ultimately, the rigorous methods used in this
paper have produced a set of 28 WAIS-IV short forms (using two-to-five subtests) that have good

81
psychometric strength and are ready for immediate use by psychologists throughout Latin America who
have been calling for the development of these much need assessment tools.

82
Epilogue
Entitled Diversifying Psychometric Tools for Intelligence Assessment and Screening in Latin
America, the three manuscripts comprising this dissertation shared the theme of producing small, but
pragmatic, contribution towards helping close what I refer to as the “cultural neuropsychology gap.”
While this dissertation particularly focuses on data collected in Colombia and Chile, the frameworks,
methods, and results across all three papers extend beyond a narrow population.
Chapter one demonstrated how cultural neuropsychologists can approach ambiguous cross-
cultural assessment scenarios in a thorough and empirically supported way. It showed how international
data statistics can be quickly referenced to better contextualize an assessment scenario, and it provided
useful national and test-level demographics tables, ready for clinicians to reference in their clinical
practice. While the paper focused most on the sociocultural effects of education, it briefly highlighted
issues surrounding SES, cohort effects, and limitations in ethnic representation. It also pointed to the
need for future work in better sample characterization and developing demographically corrected
norms for all nations with rich socio-historical diversity. The paper also conducted the largest
intelligence norms comparison paper to date, by looking at the interpretive effects of applying WAIS-IV
norms from six difference countries (Colombia, Chile, Mexico, Spain, United States, and Canada) in a
large sample of Colombian executives. This paper also demonstrated nearly identical concordance
between the Colombian and Chilean norms when applied to this sample and it pointed to non-intuitive
but critically important underlying index and subtest-level difference between these six versions of the
WAIS-IV.
Chapters two and three focused on the psychometrics of the Chilean WAIS-IV, the most widely
used intelligence test in Latin America. Chapter two systematically evaluated higher-order and bifactor
variants of four-factor (Wechsler) and five-factor (CHC) models in the Chilean-WAIS-IV. Results from this
study showed slight cross-loading inconsistencies between the Chilean and the United States WAIS-IV

83
and marginally favored bifactor and CHC models. The paper, however, ultimately provided strong
support of both model structures and variants and these results were used to inform chapter three,
which used a psychometrically rigorous approach to derive Wechsler and CHC-aligned short forms for
the Chilean WAIS-IV that are ready for immediate use by researchers and clinicians.
Together these papers provide easily implementable assessment frameworks and tools available
to clinicians and researchers in Latin America. They also outline adaptable methods that can help all
cultural neuropsychologists better contextualize their instruments and data in a field that is
disproportionately represented by research from the United States. More broadly, these papers subtly
raise the issue of potential inconsistencies in underlying construct validity across different adaptations
of the WAIS-IV and the myth of universalism, particularly with nonverbal tests. While acculturation is
undoubtedly one key element contributing to performance and psychometric differences across
populations on the WAIS-IV, the findings in this dissertation (particularly chapter two) provide evidence
of potential subtle construct differences between Latinx and North American (and other) populations.
While I believe these papers to be good first steps towards making a modest contribution to the field of
cultural neuropsychology, the need for more research and instrument development is great. I am
hopeful that approaches used in these papers can provide seeds that can be grown through the
continued work of cultural neuropsychologists in Latin America and throughout the world.

84
References Abdelhamid, G. S. M., Gómez-Benito, J., Abdeltawwab, A. T. M., Abu Bakr, M. H. S., & Kazem, A. M.
(2017). Hierarchical Structure of the Wechsler Adult Intelligence Scale–Fourth Edition with an
Egyptian Sample. Journal of Psychoeducational Assessment, online first, 1-10.
doi:10.1177/0734282917732857
Acevedo, A., Loewenstein, D. A., Agrón, J., & Duara, R. (2007). Influence of sociodemographic variables
on neuropsychological test performance in Spanish-speaking older adults. Journal of Clinical and
Experimental Neuropsychology, 29(5), 530-544.
Alfonso, V. C., Flanagan, D. P., & Radwan, S. (2005). The impact of the Cattell-Horn-Carroll theory on test
development and interpretation of cognitive and academic abilities. In D. P. Flanagan & P. L.
Harrison (Eds.), Contemporary intellectual assessment: Theories, tests, and issues (pp. 185-202).
New York, NY: Guilford Press.
American Educational Research Association, American Psychological Association (APA), & National
Council on Measurement in Education (2014). Standards for educational and psychological
testing. Washington, DC: American Educational Research Association.
American Psychological Association (APA). (2003). Guidelines on multicultural education, training,
research, practice and organizational change for psychologists. American Psychologist, 58, 377–
402. doi:10.1037/0003-066X.58.5.377
American Psychological Association (APA). (2017). Ethical principles of psychologists and code of
conduct. Retrieved from http://www.apa.org/ethics/code/ethics-code-2017.pdf
Anastasi, A. (1981). Differential psychology (4th ed.). New York: Macmillan.
Anderson, D. S. (2016). Short form or short changes? An example of the impact of brief assessments on
clinical decision-making in a neuropsychological case. Australian Psychologist, 51(5), 400-404.
doi:10.1111/ap.12241

85
Angoff, W. (1984). Scales, norms, and equivalent score. Princeton, NJ: Educational Testing Service.
Arango-Lasprilla, J. C., Stevens, L., Morlett Paredes, A., Ardilla, A., & Rivera, D. (2016). Profession of
neuropsychology in Latin America. Applied Neuropsychology: Adults, 24(4), 318-330.
doi:10.1080/23279095.2016.1185423
Ardila, A. (1995). Directions of research in cross-cultural neuropsychology. Journal of Clinical and
Experimental Neuropsychology, 17(1), 143-150. doi:10.1080/13803399508406589
Ardila, A. (1998). A note of caution: Normative neuropsychological test performance: Effects of age,
education, gender and ethnicity: A comment on Saykin et al. (1995). Applied Neuropsychology,
5, 51–53.
Ardila, A. (2005). Cultural values underlying psychometric cognitive testing. Neuropsychological Review,
15, 185–195.
Ardila, A., Ostrosky-Solis, F., Rosselli, M., & Gómez, C. (2000). Age-related cognitive decline during
normal aging: The complex effect of education. Archives of Clinical Neuropsychology, 12(6), 496-
513. doi:10.1016/S0887-6177(99)00040-2
Axelrod, B. N. (2002). Validity of the Wechsler Abbreviated Scale of Intelligence and other very short
forms of estimating intellectual functioning. Assessment, 9, 17-23.
doi:10.1177/1073191102009001003
Axelrod, B. N., Ryan, J. J., & Ward, L. C. (2001). Evaluation of seven-subtest short forms of the Wechsler
Adult Intelligence Scale-III in a referred sample. Archives of Clinical Neuropsychology, 16(1), 1-8.
Batchelor, E., & Meyers, J. (2013). Estimating WAIS-IV FSIQ using the Barona and Ward 7 short from.
Archives of Clinical Neuropsychology, 28, 547-548. doi:10.1093/arclin/act054.81
Bender, H. A., García, A. M., & Barr, W. B. (2010). An interdisciplinary approach to neuropsychological
test construction: Perspectives from translation studies. Journal of the International
Neuropsychological Society, 16(02), 227-232.

86
Benisz, M., Dumont, R., & Willis, J. O. (2015). From psychometric testing to clinical assessment:
Personalities, ideas, and events that shaped David Wechsler’s views of intelligence and its
assessment. In S. Goldstein, D. Princiotta, & J. A. Naglieri (Eds.), Handbook of Intelligence (pp.
163-179). New York, NY: Springer.
Benito, E. (2012). Psychological science around the world: Latin America. APS Observer, 25(4). Retrieved
April 1, 2019 from https://www.psychologicalscience.org/observer/psychological-science-
around-the-world-latin-america.
Benson, N. F., Beaujean, A. A., McGill, R. J., & Dombrowski, S. C. (2018). Revisiting Carroll's survey of
factor-analytic studies: Implications for the clinical assessment of intelligence. Psychological
Assessment, 30(8), 1028-1038. doi:10.1037/pas0000556
Benson, N., Hulac, D. M., & Kranzler, J. H. (2010). Independent examination of the Wechsler Adult
Intelligence Scale-Fourth Edition (WAIS-IV): What does the WAIS-IV measure? Psychological
Assessment, 22(1), 121-130. doi:10.1037/a0017767
Blyler, C. R., Gold, J. M., Iannon, V. N., & Buchanan, R. W. (2000). Short form of the WAIS-III for use with
patients with schizophrenia. Schizophrenia Research, 46, 209-215.
Boone, K. B., Victor, T. L., Wen, J., Razani, J., & Pontón, M. (2007). The association between
neuropsychological scores and ethnicity, language, and acculturation variables in a large patient
population. Archives of Clinical Neuropsychology, 22(3), 355-365.
Bouman, Z., Hendriks, M. P. H., Van Der Veld, W. M., Aldenkamp, A. P., & Kessels, R. P. C. (2016). Clinical
validation of three short forms of the Dutch Wechsler Memory Scale-Fourth Edition (WMS-IV-
NL) in a mixed clinical sample. Assessment, 23(3), 386-394. doi:10.1177/1073191115593629
Bowden, S. C., Lange, R. T., Weiss, L. G., & Saklofske, D. H. (2008). Invariance of the measurement model
underlying the Wechsler Adult Intelligence Scale-III in the United States and Canada. Educational
and Psychological Measurement, 68, 1024-1040.
87
Bowden, S. C., Saklofske, D. H., & Weiss, L. G. (2011). Invariance of the measurement model underlying
the Wechsler Adult Intelligence Scale-IV in the United States and Canada. Educational and
Psychological Measurement, 71(1), 186-199.
Brickman, A. M., Cabo, R., & Manly, J. J. (2006). Ethical issues in cross-cultural neuropsychology. Applied
Neuropsychology, 13(2), 91-100.
Brown, T. A. (2015). Confirmatory factor analysis for applied research (2nd ed.). New York, NY: The
Guilford Press.
Brunner, M., Nagy, G., & Wilhel, O. (2012). A tutorial on hierarchically structure constructs. Journal of
Personality, 80, 796-846. doi:10.1111/j.1467-6494.2011.00749.x
Buchmann, C., & Hannum, E. (2001). Education and stratification in developing countries: A review of
theories and research. Annual Review of Sociology, 27, 77-102.
Bulzacka, E., Meyers, J. E., Boyer, L., Le Gloahec, T., Fond, G., Szöke, A., ... & Schürhoff, F. (2016). WAIS-
IV seven-subtest short form: validity and clinical use in schizophrenia. Archives of Clinical
Neuropsychology, 31(8), 915-925.
Buré-Reyes, A., Hidalgo-Ruzzante, N., Vilar-López, R., Gontier, J., Sánchez, L., Pérez-García, M., & Puente,
A. E. (2013). Neuropsychological test performance of Spanish speakers: Is performance different
across different Spanish-speaking subgroups? Journal of clinical and experimental
neuropsychology, 35(4), 404-412.
Byrne, B. M., Oakland, T., Leong, F. T., van de Vijver, F. J., Hambleton, R. K., Cheung, F. M., & Bartram, D.
(2009). A critical analysis of cross-cultural research and testing practices: Implications for
improved education and training in psychology. Training and Education in Professional
Psychology, 3(2), 94.

88
Cadavid-Ruiz, N., del Río, P., Egido, J., & Gallindo, P. (2016). Age related changes in the executive
function of Colombian children. Universitas Psychologica, 15(5). doi:10.11144/Javeriana.upsy15-
5.arce
Cagigas, X. E., & Manly, J. J. (2014). Cultural neuropsychology: The new norm. In M. W. Parsons & T. A.
Hammeke (Eds.), Clinical Neuropsychology: A pocket handbook for assessment, Third Edition (pp.
132-156). Washington, DC: American Psychological Association.
Canivez, G. L., & Kush, J. C. (2013). WAIS-IV and WISC-IV structural validity: Alternative methods,
alternate results. Commentary on Weiss et al. (2013a) and Weiss et al. (2013b). Journal of
Psychoeducational Assessment, 31, 157–169. doi:10.1177/0734282913478036
Canivez, G. L., & Watkins, M. W. (2010a). Exploratory and higher-order factor analyses of the Wechsler
Adult Intelligence Scale-(WAIS-IV) adolescent subsample. School Psychology Quarterly, 25(4),
223.
Canivez, G. L., & Watkins, M. W. (2010b). Investigation of the factor structure of the Wechsler Adult
Intelligence Scale—Fourth Edition (WAIS–IV): Exploratory and higher order factor
analyses. Psychological Assessment, 22(4), 827.
Canivez, G. L., Dombrowski, S. C., & Watkins, M. W. (2018). Factor structure of the WISC‐V in four
standardization age groups: Exploratory and hierarchical factor analyses with the 16 primary and
secondary subtests. Psychology in the Schools, 55, 741-769. doi:10.1002/pits.22138
Carroll, J. B. (1993). Human cognitive abilities: A survey of factor-analytic studies. New York, NY:
Cambridge University Press.
Cavé, J. (2008). The effect of quality of education on neuropsychological test performance (Unpublished
doctoral dissertation). University of South Africa, Pretoria, South Africa.
Chen, H., & Hua, M.-S. (2019). Selecting tetradic short forms of the Waiwan Wechsler Adult Intelligence
Scale IV. Assessment, online first. doi:10.1177/1073191119831787

89
Christensen, B. K., Girard, T. A., & Bagby, R. M. (2007). Wechsler Adult Intelligence Scale-Third Edition
short form for index and IQ scores in a psychiatric population. Psychological Assessment, 19(2),
236-240.
Clara, I. (2000). A psychometric assessment of Wechsler short forms and the Shipley Institute of Living
Scale in the estimation of Wechsler Adult Intelligence Scale-III IQ scores with an aging sample
(Unpublished master's thesis). University of Manitoba, Manitoba, Winnipeg.
Clauss-Ehlers, C. S., Chiriboga, D. A., Hunter, S. J., & Roysircar, G. (2019). APA Multicultural guidelines: An
ecological approach to context, identity, and intersectionality. American Psychologist, 74(2),
232-244. doi:10.1037/amp0000382
Cohen, J. (1988). Statistical power analysis for the behavioural sciences (2nd ed.). New York: Academic
press.
Cores, E. V., Vanotti, S., Eizaguirre, B., Fiorentini, L., Garcea, O., Benedict, R. H., & Cáceres, F. (2015). The
effect of culture on two information-processing speed tests. Applied Neuropsychology:
Adult, 22(4), 241-245. doi:10.1080/23279090.2014.910214
Crawford, J. R., & Howell, D. C. (1998). Regression equations in clinical neuropsychology: An evaluation
of statistical methods for comparing predicted and obtained scores. Journal of Clinical and
Experimental Neuropsychology, 20(5), 755-762
Crawford, J. R., Allum, S., & Kinion, J. E. (2008). An index-based short form of the WAIS-III with
accompanying analysis of reliability and abnormality of differences. British Journal of Clinical
Psychology, 47, 215-237. doi:10.1348/0I4466507X258859
Cucina, J., & Byle, K. (2017). The bifactor model fits better than the higher-order model in more than
90% of comparisons for mental abilities test batteries. Journal of Intelligence, 5(3), 27.
Dana, R. H. (2005). Multicultural assessment: Principles, applications and examples. Mahwah,
NJ:Erlbaum.

90
DANE: Departamento administrativo nacional de estadística (2007). Dirección de censos y demografía:
Colombia una nación multicultural. Retrieved [May 2017] from
https://www.dane.gov.co/files/censo2005/etnia/sys/colombia_nacion.pdf.
Daugherty, J. C., Puente, A. E., Fasfous, A. F., Hidalgo-Ruzzante, N., & Pérez-Garcia, M. (2017). Diagnostic
mistakes of culturally diverse individuals when using North American neuropsychological
tests. Applied Neuropsychology: Adult, 24(1), 16-22. doi:10.1080/23279095.2015.1046992
Denney, D. A., Ringe, W. K., & Lacritz, L. H. (2015). Dyadic Short Forms of the Wechsler Adult Intelligence
Scale-IV. Archives of Clinical Neuropsychology, 30, 404-412. doi:10.1093/arclin/acv035
Dombrowski, S. C., Canivez, G. L., & Watkins, M. W. (2018). Factor structure of the 10 WISC-V primary
subtests across four standardization age groups. Contemporary School Psychology, 22(1), 90-
104. doi:10.1007/s40688-017-0125-2
Dombrowski, S. C., Canivez, G. L., Watkins, M. W., & Beaujean, A. A. (2015). Exploratory bifactor analysis
of the Wechsler Intelligence Scale for Children—Fifth Edition with the 16 primary and secondary
subtests. Intelligence, 53, 194-201. doi:10.1016/j.intell.2015.10.009
Dombrowski, S. C., McGill, R. J., & Canivez, G. L. (2017). Exploratory and hierarchical factor analysis of
the WJ-IV cognitive at school age. Psychological Assessment, 29(4), 394-407.
doi:10.1037/pas0000350
Dombrowski, S. C., McGill, R. J., & Canivez, G. L. (2018a). An alternative conceptualization of the
theoretical structure of the Woodcock-Johnson IV Tests of Cognitive Abilities at school age: A
confirmatory factor analytic investigation. Archives of Scientific Psychology, 6(1), 1-13.
doi:10.1037/arc0000039
Dombrowski, S. C., McGill, R. J., & Canivez, G. L. (2018b). Hierarchical exploratory factor analyses of the
Woodcock-Johnson IV full test battery: Implications for CHC application in school psychology.
School Psychology Quarterly, 33(2), 235-250. doi:10.1037/spq0000221

91
Donders, J., & Axelrod, B. N. (2002). Two-subtest estimates of WAIS-III factor index scores. Psychological
Assessment, 14, 260-264. doi:10.1037/1040-3590.14.3.360
Donders, J., Tulsky, D. S., & Zhu, J. (2001). Criterion validity of new WAIS-III subtest scores after
traumatic brain injury. Journal of the International Neuropsychological Society, 7, 892–898.
Donnell, A. J., Pliskin, N., Holdnack, J., Axelrod, B., & Randolph, C. (2007). Rapidly-administered short
forms of the Wechsler Adult Intelligence Scale–3rd edition. Archives of Clinical Neuropsychology,
22, 917-924. doi:10.1016/j.acn.2007.06.007
Drozdick, L. W., Holdnack, J. A., Salthouse, T., & Cullum, C. M. (2013). Assessing cognition in older adults
with the WAIS-IV, WMS-IV, and ACS. In J. A. Holdnak, L. W. Drozdick, L. G. Weiss, & G. L. Iverson
(Eds.), WAIS-IV, WMS-IV, and ACS: Advanced clinical interpretation (pp. 407–483). Boston, MA:
Elsevier.
Duggan, E. C., & Garcia-Barrera, M. A. (2015). Executive functioning and intelligence. In S. Goldstein, J. A.
Naglieri, & D. Princiotta (Eds.), Handbook of intelligence: Evolutionary theory, historical
perspective, and current concepts (pp. 435-458). New York: Springer. doi:10.1007/978-1-4939-
1562-0_27
Duggan, E. C., & Garcia-Barrera, M. A. (2019). Examining Bifactor and Hierarchical Intelligence Factor
Structures in the Chilean adaptation of the WAIS-IV. In preparation.
Duggan, E. C., Awakon, L. M., Loaiza, C. C., & Garcia-Barrera, M. A. (2018). Contributing towards a
cultural neuropsychology assessment decision-making framework: Comparison of WAIS-IV
norms from Colombia, Chile, Mexico, Spain, United States, and Canada. Archives of Clinical
Neuropsychology, online first. doi:10.1093/arclin/acy074
Dutton, E., & Lynn, R. (2014). The Canadian IQ calculated from the standardization of the WAIS IV. Open
Differential Psychology, August 20, 2014.

92
Echemendia, R. J., & Harris, J.G. (2004). Neuropsychological test use with Hispanic/Latino populations in
the United States: Part II of a national survey. Applied Neuropsychology, 11, 4–11.
Echemendia, R., Harris, J. G., Congett, S., Diaz, M. L., & Puente, A. E. (1997). Neuropsychological training
and practices with Hispanics: A national survey. The Clinical Neuropsychologist, 11, 29–243.
Edwards, L. M., Burkard, A. W., Adams, H. A., & Newcomb, S. A. (2017). A mixed-method study of
psychologists’ use of multicultural assessment. Professional Psychology: Research and Practice,
48(2), 131-138. doi:10.1037/pro0000095
Eisman, E. J., Dies, R. R., Finn, S. E., Eyde, L. D., Kay, G. G., Kubiszyn, T. W., … & Moreland, K. L. (2000).
Problems and limitations in using psychological assessment in the contemporary health care
delivery system. Professional Psychology: Research and Practice, 31(2), 131-140.
doi:10.1037/0735-7028.31.2.131
Elbulok-Charcape, M. M., Rabin, L. A., Spadaccini, A. T., & Barr, W. B. (2014). Trends in the
neuropsychological assessment of ethnic/racial minorities: A survey of clinical
neuropsychologists in the United States and Canada. Cultural Diversity and Ethnic Minority
Psychology, 20(3), 353.
Fenollar-Cortés, J., & Watkins, M. W. (2018). Construct validity of the Spanish Version of the Wechsler
Intelligence Scale for Children Fifth Edition (WISC-VSpain). International Journal of School &
Educational Psychology, 1-15. doi:10.1080/21683603.2017.1414006
Fernandez, A. L. (2019). Modern neuropsychological tests for a diversity of cultural contexts. The Clinical
Neuropsychologist, online first. doi:10.1080/13854046.2018.1560501
Fernandez, A. L., Ferreres, A., Morlett-Paredes, A., Rivera, D., & Arango-Lasprilla, J. C. (2016). Past,
present, and future of neuropsychology in Argentina. The Clinical Neuropsychologist, 30(8),
1154-1178.

93
Flanagan, D. P., & Harrison, P. L. (Eds.). (2012). Contemporary intellectual assessment: Theories, tests,
and issues (3rd ed.). New York, NY: The Guildford Press.
Flanagan, D. P., McGrew, K. S., & Ortiz, S. O. (2000). The Wechsler Intelligence Scales and Gf-Gc theory: A
contemporary approach to interpretation. Boston, MA: Allyn & Bacon.
Flores, I., Casaletto, K. B., Marquine, M. J., Umlauf, A., Moore, D. J., Mungas, D., ... & Heaton, R. K.
(2017). Performance of Hispanics and Non-Hispanic Whites on the NIH Toolbox Cognition
Battery: The roles of ethnicity and language backgrounds. The Clinical Neuropsychologist, 31(4),
783-797. doi:10.1080/13854046.2016.1276216
Floyd, R. G., Bergeron, R., Hamilton, G., & Parra, G. R. (2010). How do executive functions fit with the
Cattell–Horn–Carroll model? Some evidence from a joint factor analysis of the Delis–Kaplan
executive function system and the Woodcock–Johnson III tests of cognitive abilities. Psychology
in the Schools, 47(7), 721-738. doi:10.1002/pits.20500
Fonseca-Aguilar, P., Olabarrieta-Landa, L., Rivera, D., Aguayo Arelis, A., Ortiz Jiménez, X. A., Rabago
Barajas, B. V., ... & Arango-Lasprilla, J. C. (2015). Current state of professional
Neuropsychological practice in Mexico. Psicología desde el Caribe, 32(3), 344-364.
Frazier, T. W., & Youngstrom, E. A. (2007). Historical increase in the number of factors measured by
commercial tests of cognitive ability: Are we overfactoring? Intelligence, 35, 169 –182.
doi:10.1016/j.intell.2006.07.002
Frisby, C. L., & Beaujean, A. A. (2015). Testing Spearman's hypotheses using a bi-factor model with
WAIS-IV/WMS-IV standardization data. Intelligence, 51, 79-97. doi:10.1016/j.intell.2015.04.007
Fuentes-Durá, I., Romero-Peris, M., Dasí-Vivó, C., & Ruiz-Ruiz, J. C. (2010). Versión abreviada del WAIS-III
para su uso en la evaluación de pacientes don diagnóstico de esquizofrenia. Psicothema, 22,
202-207.
94
Fuica, P., Lira, J., Alvarado, K., Araneda, C., Lillo, G., Miranda, R., ... & Pérez-Salas, C. P. (2014).
Habilidades cognitivas, contexto rural y urbano: comparación de perfiles WAIS-IV en
jóvenes. Terapia psicológica, 32(2), 143-152.
Funes, C. M., Hernandez Rodriguez, J., & Lopez, S. R. (2016). Norm comparisons of the Spanish-language
and English-language WAIS-III: Implications for clinical assessment and test
adaptation. Psychological Assessment, 28(12), 1709.
Gasquoine, P. G. (2009). Race-norming of neuropsychological tests. Neuropsychology Review, 19(2), 250-
262. doi:10.1007/s11065-009-9090-5
Gignac, G. E. (2008). Higher-order models versus direct hierarchical models: g as superordinate or
breadth factor? Psychology Science Quarterly, 50(1), 21.
Gignac, G. E. (2014). Fluid intelligence shares closer to 60% of its variance with working memory capacity
and is a better indicator of general intelligence. Intelligence, 47, 122-133.
doi:10.1016/j.intell.2014.09.004
Gignac, G. E. (2016). The higher-order model imposes a proportionality constraint: That is why the
bifactor model tends to fit better. Intelligence, 55, 57-68. doi:10.1016/j.intell.2016.01.006
Gignac, G. E., & Watkins, M. W. (2013). Bifactor modeling and the estimation of model-based reliability
in the WAIS-IV. Multivariate Behavioral Research, 48(5), 639-662.
doi:10.1080/00273171.804398
Girard, T. A., & Christensen, B. K. (2008). Clarifying problems and offering solutions for correlated error
when assessing the validity of selected-subtest short forms. Psychological assessment, 20(1), 76.
Girard, T. A., Axelrod, B. N., & Wilkins, L. K. (2010). Comparison of WAIS-III short forms for measuring
index and full-scale scores. Assessment, 17(3), 400-405.
Girard, T. A., Axelrod, B. N., Patel, R., & Crawford, J. R. (2015). Wechsler Adult Intelligence Scale–IV
Dyads for Estimating Global Intelligence. Assessment, 22(4), 441-448.
95
Glass, L. A., Bartels, J. M., & Ryan, J. J. (2009). WAIS-III FSIQ and GAI in ability memory discrepancy
analysis. Applied Neuropsychology, 16, 19-22.
Golay, P., Reverte, I., Rossier, J., Favez, N., & Lecerf, T. (2013). Further insights on the French WISC–IV
factor structure through Bayesian structural equation modeling. Psychological assessment,
25(2), 496. doi:10.1037/a0030676
Grégoire, J. (2013). Measuring components of intelligence: Mission impossible? Journal of
Psychoeducational Assessment, 31(2), 138-147. doi:10.117/0734282913478034
Hair, J. F., Black, B., Babin, B., & Anderson, R. E. (2010). Multivariate data analysis. Upper Saddle River,
NJ: Pretice Hall.
Hambleton, R. K., Merenda, & P. F., Spielberger, C. D. (Eds.). (2005). Adapting educational and
psychological tests for cross-cultural assessment. Mahwah, New Jersey: Lawrence Erlbaum
Associates, Publishers.
Harrison, A. G., Armstrong, I. T., Harrison, L. E., Lange, R. T., & Iverson, G. L. (2014). Comparing Canadian
and American normative scores on the Wechsler Adult Intelligence Scale-Fourth Edition.
Archives of Clinical Neuropsychology, 29, 737-746.
Harrison, A. G., DeLisle, M. M. & Parker, K. C. H. (2008). An investigation of the General Abilities Index in
a group of diagnostically mixed patients. Journal of Psychoeducational Assessment, 26, 247-259.
doi:10.1177/0734282907304032.
Hays, P. A. (2016). Addressing cultural complexities in practice: Assessment, diagnosis, and therapy (3rd
ed.). Washington, DC: American Psychological Association.
Helms, J. E. (1992). Why is there no study of cultural equivalence in standardized cognitive ability
testing? American Psychologist, 47(9), 1083-1101. doi:10.1037/0003-066X.47.9.1083
Hoelzle, J. B. (2008). Neuropsychological assessment and the Cattell-Horn-Carroll (CHC) cognitive
abilities model (Dissertation), 1192. http://utdr.utoledo.edu/theses-dissertations/1192
96
Horn, J. L., & Cattell, R. B. (1966). Refinement and test of the theory of fluid and crystallized intelligence.
Journal of Educational Psychology, 57, 253-270. doi:10.1037/h00223816
Hu, L., & Bentler, P. M. (1999). Cutoff criteria for fit indexes in covariance structure analysis:
Conventional criteria versus new alternatives. Structural Equation Modeling, 6, 1-55.
doi:10.1080/10705519909540118
IBM Corp. (Released 2017). IBM SPSS Statistics for Mac, Version 25.0. Armonk, NY: IBM Corp.
INEGI: Instituto Nacional de Estadística y Geografía (2010). Censo de problación y vivienda 2010.
Retrieved [May 2017] from: http://www.beta.inegi.org.mx/proyectos/ccpv/2010/.
Instituto Cervantes (2016). El Español: Una lengua viva – Informe 2016. Departmento de Comunicacion
Digital del Instituto Cervantes. Reterived [May 2017] from:
www.cervantes.es/imagenes/File/prensa/EspanolLenguaViva16.pdf.
Iverson, G. L., Holdnack, J. A., & Lange, R. T. (2013). Using the WAIS–IV/WMS–IV/ACS Following
Moderate-Severe Traumatic Brain Injury. In WAIS-IV, WMS-IV, and ACS (pp. 485-544).
Iverson, G. L., Lange, R. T., & Viljoen, H. (2006). Comparing the Canadian and American WAIS-III
normative systems in inpatient neuropsychiatry and forensic psychiatry. Canadian Journal of
Behavioral Science, 38, 4, 348-353.
Jackson, D. L., Gillaspy, J. A., & Purc-Stephenson, R. (2009). Reporting practices in confirmatory factor
analysis: An overview and some recommendations. Psychological Methods, 14, 6-23.
doi:10.1037/a0014694
Jensen, A. (1998). The g factor: The science of mental ability. Westport, CT: Praeger.
Jewsbury, P. A., Bowden, S. C. & Duff, K. (2016). The Cattell-Horn-Carroll model of cognition for clinical
assessment. Journal of Psychoeducational Assessment, 35(6),547-567.
doi:10.1177/0734282916651360

97
Jewsbury, P. A., Bowden, S. C., & Strauss, M. E. (2015). Integrating the switching, inhibition, and
updating model of executive function with the Cattell-Horn-Carroll model. Journal of
Experimental Psychology: General, 145(2), 220-245. doi:10.1037/xge0000119
Jeyakumar, S. L. E., Warriner, E. M., Raval, V. V., & Ahmad, S. A. (2004). Balancing the need for reliability
and time efficiency: Short forms of the Wechsler Adult Intelligence Scale-III. Educational and
Psychological Measurement, 64, 71-87.
Judd, T., Capetillo, D., Carrión-Baralt, J., Mármol, L. M., San Miguel-Montes, L., Navarrete, M. G., ... & the
NAN Policy and Planning Committee. (2009). Professional considerations for improving the
neuropsychological evaluation of Hispanics: A National Academy of Neuropsychology education
paper. Archives of Clinical Neuropsychology, 24(2), 127-135.
Kan, K. J., Kievit, R. A., Dolan, C., & van der Maas, H. (2011). On the interpretation of the CHC factor Gc.
Intelligence, 39(5), 292-302. doi:10.1016/j.intell.2011.05.003
Karr, J. E., Areshenkoff, C. N., Rast, P., Hofer, S. M., Iverson, G. L., & Garcia-Barrera, M. A. (2018). The
unity and diversity of executive functions: A systematic review and re-analysis of latent variable
studies. Psychological bulletin, 144(11), 1147.
Kaufman, A. S., & Kaufman, N. L. (2004). Kaufman Brief Intelligence Test, Second Edition (KBIT-2). San
Antonio, TX: Pearson.
Kaufman, A. S., Ishikuma, T., & Kaufman-Packer, J. L. (1991). Amazingly short forms of the WAIS-R.
Journal of Psychoeducational Assessment, 9, 4-15.
Kaufman, A. S., Johnson, C. K., & Liu, X. (2008). A CHC theory-based analysis of age differences on
cognitive abilities and academic skills at ages 22 to 90 years. Journal of Psychoeducational
Assessment, 26(4), 350-381. doi:10.1177/0734282908314108
Kaufman, J. C., & Kaufman, A. S. (2001). Time for the changing of the guard: A farewell to short forms of
intelligence tests. Journal of Psychoeducational Assessment, 19, 245-267.

98
Keith, T. Z., & Reynolds, M. R. (2010). Cattell–Horn–Carroll abilities and cognitive tests: What we've
learned from 20 years of research. Psychology in the Schools, 47(7), 635-650.
doi:10.1002/pits.20496
Keith, T. Z., & Reynolds, M. R. (2018). Using confirmatory factor analysis to aid in understanding the
constructs measured by intelligence tests. In D. P. Flanagan & E. M. McDonough (Eds.),
Contemporary intellectual assessment: Theories, tests, and issues (5th ed., pp. 853-900). New
York, NY: The Guilford Press.
Keith, T. Z., Fine, J., Taub, G., Reynolds, M., & Kranzler, J. (2006). Higher order, multi-sample,
confirmatory factor analysis of the Wechsler Intelligence Scale for Children–Fourth Edition:
What does it measure? School Psychology Review, 35, 108-127.
Lange, M., Riveros, R., Figueroa, P., Benavente, C., Aparicio, A. y Rosas, R. (2012). FIX: Propuesta de
nueva herramienta de evaluación de Inteligencia Fluida en adultos. Centro de Desarrollo de
Tecnologías de Inclusión, CEDETi UC, Escuela de Psicología, Pontificia Universidad Católica de
Chile.
Lange, R. T., & Chelune, G. J. (2006). Application of new WAIS-III/WMS-III discrepancy scores for
evaluating memory functioning: Relationship between intellectual and memory ability. Journal
of Clinical and Experimental Neuropsychology, 28, 592-604.
LaRosa, M. J., & Mejía, G. R. (2017). Colombia: A concise contemporary history—Second edition. Lanham,
MD: Rowman & Littlefield.
LaRue, A., Romano, L. J., Ortiz, I. E., Liang, H. C., and Lindeman, R. D. (1999). Neuropsychological
performance of Hispanic and non-Hispanic older adults: An epidemiologic survey. Clinical
Neuropsychologist, 13, 474–486.

99
Lecerf, T., & Canivez, G. L. (2017). Complementary Exploratory and confirmatory factor analyses of the
French WISC-V: Analyses based on the standardization sample. Psychological Assessment, 30(6),
793-808. doi:10.1037/pas0000526
Lecerf, T., Golay, P., & Reverte, I. (2012) CHC composite scores for the WAIS-IV: French Norms. Pratiques
psychologiques, 18(4), 401-412. doi:10.1016/j.prps.201.03.001
Lecerf, T., Golay, P., Reverte, I., Senn, D., Favez, N., & Rossier, J. (2012). CHC composite scores for the
WISC-IV: French norms. Pratiques psychologiques, 18(1), 37-50. doi:10.1016/j.prps.2011.04.001
LeGrand, C. C. (2003). The Colombian crisis in historical perspective. Canadian Journal of Latin American
and Caribbean Studies, 28(55-56), 165-209. doi:10.1080/08263663.2003.10816840
Levy, P. (1967). The correction for spurious correlation in the evaluation of short form tests. Journal of
Clinical Psychology, 23, 84-86.
Levy, P. (1968). Short form tests: a methodological review. Psychological Bulletin, 69, 410-416.
Lezak, M. D., Howieson, D. B., Bigler, E. D., & Tranel, D. (2012). Neuropsychological assessment (5th ed.).
New York, NY: Oxford University Press.
Llorente, A. M. (Ed.). (2007). Principles of neuropsychological assessment with Hispanics: Theoretical
foundations and clinical practice. New York, NY: Springer Science & Business Media.
Llorente, A. M., Pontón, M. O., Taussig, I. M., and Satz, P. (1999). Patterns of American immigration and
their influence on the acquisition of neuropsychological norms for Hispanics. Archives of Clinical
Neuropsychology, 14, 603–614.
Lynn, R., Fuerst, J., & Kirkegaard, E. O. W. (2018) Regional differences in intelligence in 22 countries and
their economic, social and demographic correlates: A review. Intelligence, 69, 24-36.
doi:10.1016/j.intell.2018.04.004
Maldonado, C. Y, & Geisinger, K. F. (2005). Conversion of the Wechsler Adult Intelligence Scale into
Spanish: An early test adaptation effort of considerable consequence. In R. K. Hambleton, P. F.

100
Merenda, & C. D. Spielberger (Eds.) Adapting educational and psychological tests for cross-
cultural assessment (pp. 213-234). Mahwah, New Jersey: Lawrence Erlbaum Associates,
Publishers.
Mansolf, M., & Reise, S. P. (2017). When and why the second-order and bifactor models are
distinguishable. Intelligence, 61, 120-129. doi:10.1016/j.intell.2017.01.012
Many, J. J. (2008). Critical issues in cultural neuropsychology: Profit from diversity. Neuropsychological
Review, 18(3), 179-183.
Marsella, A. J. (1998). Toward a “global-community psychology”: Meeting the needs of a changing
world. American Psychologist, 53, 1282-1291. doi:10.1037/0003-066X.53.12.1282
Marsh, H. W., Balla, J. R., & McDonald, R. P. (1988). Goodness-of-fit indexes in confirmatory factor
analysis: The effect of sample size. Psychological Bulletin, 103, 391-410. doi:10.1037/0033-
2909.103.391
McDonald, R. P. (1999). Test theory: A unified approach. Mahwah, NJ: Erlbaum.
McPherson, S., Buckwalter, G. J., Tingus, K., Betz, B., & Back, C. (2000). The Satz-Mogel Short Form of the
Wechsler Adult Intelligence Scale Revised: Effects of Global Mental Status and Age on Test-
Retest Reliability. Journal of Clinical and Experimental Neuropsychology, 22(5), 545-553.
Mendella, P. D., McFadden, L., Regan, J., & Medlock, L. (2000). Short form prediction of WAIS-R scores in
a sample of individuals diagnosed with multiple sclerosis. Applied neuropsychology, 7(2), 102-
107.
Meyers, J. E., Zellinger, M. M., Kockler, T., Wagner, M., & Miller, R. M. (2013). A validated seven-subtest
short form for the WAIS-IV. Applied Neuropsychology: Adult, 20(4), 249-256.
Miller, H. R., Steiner, D. L., & Goldberg, J. O. (1996). Short, shorter, shortest: The efficacy of WAIS-R short
forms with mixed psychiatric patients. Assessment, 3, 1651-69.
101
Miyake, A., & Friedman, N. P. (2012). The nature and organization of individual differences in executive
functions four general conclusions. Current Directions in Psychological Science, 21(1), 8-14.
doi:10.1177/0963721411429458
Morgan-Consoli, M. L., Inman, A. G., Bullock, M., & Nolan, S. A. (2018). Framework for competencies for
U.S. psychologists engaging internationally. International Perspectives in Psychology: Research,
Practice, Consultation, 7(3), 174-188. doi:10.1037/ipp0000090
Murray, A. L., & Johnson, W. (2013). The limitations of model fit in comparing the bi-factor versus
higher-order models of human cognitive ability structure. Intelligence, 41(5), 407-422.
doi:10.1016/j.intell.2013.06.004
Muthén, L. K., & Muthén, B. O. (1998-2017). Mplus User’s Guide. Eighth Edition. Los Angeles, CA:
Muthén & Muthén.
Niileksela, C. R., Reynolds, M. R., & Kaufman, A. S. (2013). An alternative Cattell–Horn–Carroll (CHC)
factor structure of the WAIS-IV: Age invariance of an alternative model for ages 70–90.
Psychological Assessment, 25(2), 391. doi:10.1037/a0031175
O’Bryant, S. E., Edwards, M., Johnson, L., Hall, J., Gamboa, A., & O’jile, J. (2018). Texas Mexican American
adult normative studies: Normative data for commonly used clinical neuropsychological
measures for English-and Spanish-speakers. Developmental Neuropsychology, 43(1), 1-26.
doi:10.1080/87565641.2017.1401628
Olabarrieta-Landa, L., Caracuel, A., Pérez-García, M., Panyavin, I., Morlett-Paredes, A., & Arango-
Lasprilla, J. C. (2016). The profession of neuropsychology in Spain: Results of a national
survey. The Clinical Neuropsychologist, 30(8), 1335-1355.
Olivier, T. W., Golden, C. J., Acevedo, A., Sterk, V. I., Espinosa, K. M., & Spengler, K. M. (2014). WAIS-IV
Index and Full Scale Intelligence Quotient Score Differences between Standard and Prorated
Scoring Methods. Archives of Assessment Psychology, 3(1), 57-77.

102
Olson, K., & Jacobson, K. (2015). Cross-cultural considerations in pediatric neuropsychology: A review
and call to attention. Applied Neuropsychology: Child, 4(3), 166-177.
doi:10.1080/21622965.2013.830258
Oosterhuis, H. E., van der Ark, L. A., & Sijtsma, K. (2017). Standard errors and confidence intervals of
norm statistics for educational and psychological tests. Psychometrika, 1-30.
Ortiz, S. O. (2015). CHC theory of intelligence. In S. Goldstein, D. Princiotta, & J. A. Naglieri (Eds.),
Handbook of Intelligence (pp. 209-227). New York, NY: Springer. doi:10.1007/978-1-4939-1562-
0_15
Pearson Clinical (2019). Clinical Assessment: Content and Translations. Retrieved April 1, 2019 from
https://www.pearsonassessments.com/professional-assessments/featured-topics/pharma-
licensing/content---translations.html
Pedraza, O., & Mungas, D. (2008). Measurement in cross-cultural neuropsychology. Neuropsychology
Review, 18(3), 184-193. doi:10.1007/s11065-008-9067-9
Pezzuti, L., Lang, M., Rossetti, S., & Michelotti, C. (2018). CHC Model According to Weiss. Journal of
Individual Differences, 39(1), 53-59. doi:10.1027/1614-0001/a000249
Pilgrim, B. M., Meyers, J. E., Bayless, J., & Whetstone, M. M. (1999). Validity of the Ward seven-subtest
WAIS-III short form in a neuropsychological population. Applied Neuropsychology, 6, 243-246.
Pontón, M. O., & Ardila, A. (1999). The future of neuropsychology with Hispanic populations in the
United States. Archives of Clinical Neuropsychology, 14(7), 565-580.
Puente, A. E., Perez-Garcia, M., Vilar-Lopez, R., Hidalgo-Ruzzante, N., & Fasfous, A. F. (2013).
Neuropsychological assessment of culturally and educationally dissimilar individuals. In F. A.
Paniagua & A. Yamada (Eds.) Handbook of multicultural mental health: Assessment and
treatment of diverse populations (pp. 225-242). San Diego, CA: Academic Press.

103
Puente, A.E., & Ardila, A. (2000). Neuropsychological assessment of Hispanics. In E. Fletcher-Jonzen, T.
Stricklond & C.R. Reynolds (Eds.)., Handbook of cross-cultural neuropsychology (pp. 87–104).
New York: Kluwer Academic/Plenum Publishers.
Rabin, L. A., Paolillo, E., & Barr, W. B. (2016). Stability in test-usage practices of clinical
neuropsychologists in the United States and Canada over a 10-year period: A follow-up survey of
INS and NAN members. Archives of Clinical Neuropsychology, 31, 206-230.
doi:10.1093/arclin/acw007
Rabin, L. A., Paolillo, E., & Barr, W. B. (2016). Stability in test-usage practices of clinical
neuropsychologists in the United States and Canada over a 10-year period: A follow-up survey of
INS and NAN members. Archives of Clinical Neuropsychology, 31, 206-230.
doi:10.1093/arclin/acw007
Ready, R. E., & Barnett Veague, H. (2014). Training in psychological assessment: Current practices of
clinical psychology programs. Professional Psychology: Research and Practice, 45(4), 278.
Reid-Arndt, S. A., Allen, B. J., & Schopp, L. (2011). Validation of WAIS-III four-subtest short forms in
patients with traumatic brain injury. Applied Neuropsychology, 18, 291-297.
doi:10.1080/09084282.2011.595456
Reise, S. P. (2012). The rediscovery of bifactor measurement models. Multivariate Behavioral Research,
47, 667-696. doi:10.1080/00273171.2012.715555
Reise, S. P., Bonifay, W. E., & Haviland, M. G. (2013). Scoring and modeling psychological measures in
the presence of multidimensionality. Journal of Personality Assessment, 95, 129-140.
doi:10.1080/00223891.
Reise, S. P., Scheines, R., Widaman, K. F., & Haviland, M. G. (2013). Multidimensionality and structural
coefficient bias in structural equation modeling: A bifactor perspective. Educational and
Psychological Measurement, 73(1), 5-26. doi:10.1177/0013164412449831
104
Renteria, L., Li, S. T., & Pliskin, N. H. (2008). Reliability and validity of the Spanish Language Wechsler
Adult Intelligence Scale in a sample of American, urban, Spanish-speaking Hispanics. The Clinical
Neuropsychologist, 22(3), 455-470.
Reverte, I., Golay, P., Favez, N., Rossier, J., & Lecerf, T. (2015). Testing for multigroup invariance of the
WISC-IV structure across France and Switzerland: Standard and CHC models. Learning and
Individual Differences, 40, 127-133. doi:10.1016/j.lindif.2015.03.015
Ridley, C. R., Tracy, M. L., Pruitt-Stephens, L., Wimsatt, M. K., & Beard, J. (2008). Multicultural
assessment validity: The preeminent ethical issue in psychological assessment. In L. A. Suzuki &
J. G. Ponterotto (Eds.), Handbook of multicultural assessment: Clinical, psychological and
educational applications (3rd ed., pp. 22–33). San Francisco, CA: Wiley.
Ringe, W. K., Saine, K. C., Lacritz, L. H., Hynan, L. S., & Cullum, C. M. (2002). Dyadic short forms of the
Wechsler Adults Intelligence Scale-III. Assessment, 9, 254-260.
Rivera Mindt, M. Arentoft, A., Coulehan, K., Summers, A. C., Tureson, K., Aghvinian, M., & Byrd, D. A.
(2019). Neuropsychological evaluation of culturally/linguistically diverse older adults. In L. D.
Ravdin & H. L. Katzen (Eds.), Handbook on the Neuropsychology of Aging and Dementia (2nd ed.).
Switzerland: Springer Nature.
Rivera Mindt, M., Byrd, D., Saez, P., & Manly, J. (2010). Increasing culturally competent
neuropsychological services for ethnic minority populations: A call to action. The Clinical
Neuropsychologist, 24(3), 429-453.
Rodriquez, A. Reis, S. P. & Haviland, M. G. (2016). Evaluating bifactor models: Calculating and
interpreting statistical indices. Psychological Methods, 21(2), 137-150.
doi:10.1037/met00000045

105
Rosas, R., Tenorio, M., Pizarro, M., Cumsille, P., Bosch, A., Arancibia, S., ... & Zapata-Sepúlveda, P. (2014).
Estandarización de la Escala Wechsler de Inteligencia para Adultos: cuarta edición en
Chile. Psykhe (Santiago), 23(1), 1-18.
Rosselli, M., & Ardila, A. (2003). The impact of culture and education on non-verbal neuropsychological
measurements: A critical review. Brain and cognition, 52(3), 326-333. doi:10.1016/S0278-
2626(03)00170-2
Ryan, J. J., & Ward, L. C. (1999). Validity, reliability, and standard errors of measurement for two seven-
subtest short forms of the Wechsler Intelligence Scale-III. Psychological Assessment, 11(2), 207-
211. doi:10.1037/1040-3590.11.2.207
Ryan, J. J., Kreiner, D. S., Gontkovsky, S. T., & Glass Umfleet, L. (2015). Classification accuracy of
sequentially administered WAIS-IV short forms. Applied Neuropsychology: Adult, 22(6), 409-414.
Ryan, J. J., Lopez, S. J., & Werth, T. R. (1998). Administration time estimates for WAIS-III subtests, scales,
and short forms in a clinical sample. Journal of Psychoeducational Assessment, 16(4), 315-323.
Sanchez, L. M., & Turner, S. M. (2003). Practicing psychology in the era of managed care: Implications for
practice and training. American Psychologist, 58(2), 116-129. doi:10.1037/0003-066X.58.2.116
Santamaría, P., & Fernández Pinto, I. (2009). RIAS Escalas de Inteligencia de Reynolds y RIST Test de
Inteligencia Breve de Reynolds Manual. Adaptación española. Madrid, Spain: TEA Ediciones.
Santamaría, P., Arribas, D., Pereña, J., & Seisdedos, N. (2005). Evaluación Factorial de las Aptitudes
Intelectuales (EFAI). Adaptación española. Madrid, Spain: TEA Ediciones.
Satterfield, W. A., Martin, C. W., & Leiker, M. (1994). A comparison of four WAIS-R short forms in
patients referred for psychological/neuropsychological assessments. Journal of
Psychoeducational Assessment, 12, 364-371.
Sattler, J. M., & Ryan, J. J. (2009). Assessment with the WAIS-IV. San Antonio, TX: Psychological
Corporation.
106
Schermelleh-Engel, K., Moosbrugger, H., & Müller, H. (2003). Evaluating the fit of structural equation
models: Tests of significance and descriptive goodness-of-fit measures. Methods of
Psychological Research Online, 8, 23-74.
Schmid, J., & Leiman, J. M. (1957). The development of hierarchical factor solutions. Psychometrika,
22(1), 53-61. doi:10.1007/BF02289209
Schneider, W. J., & Flanagan, D. P. (2015). The relationship between theories of intelligence and
intelligence tests. In S. Goldstein, D. Princiotta, & J. A. Naglieri (Eds.), Handbook of
intelligence (pp. 317-340). New York, NY: Springer.
Schneider, W. J., & McGrew, K. S. (2018). The Cattell-Horn-Carroll theory of cognitive abilities. In D. P.
Flanagan & E. M. McDonough (Eds.), Contemporary intellectual assessment: Theories, tests, and
issues (5th ed., pp. 73-163). New York, NY: The Guilford Press.
Schoenberg, M. R., Duff, K., Dorfman, K., & Adams, R. L. (2004). Differential estimation of verbal
intelligence and performance intelligence scores from combined performance and demographic
variables: The OPIE-3 verbal and performance algorithms. Clinical Neuropsychology, 16, 266-
276. doi:10.1080/13854040490501501
Schrank, F. A., McGrew, K. S., & Mather, N. (2014). Woodcock-Johnson IV Tests of Cognitive Abilities.
Rolling Meadows, IL: Riverside.
Schreiber, J. B., Nora, A., Stage, F. K., Barlow, E. A., & King, K. (2006). Reporting structural equation
modeling and confirmatory factor analysis results: A review. Journal of Educational Research, 99,
323-338. doi:10.3200/JOER.99.6.323-338
Shuttleworth-Edwards, A. B. (2016). Generally representative is representative of none: Commentary on
the pitfalls of IQ test standardization in multicultural settings. The Clinical
Neuropsychologist, 30(7), 975-998.
107
Shuttleworth-Edwards, A. B. (2017). Countrywide norms declared obsolete: Best practice alert for IQ
testing in a multicultural context. South African Journal of Psychology, 41(1), 3-6.
Shuttleworth-Edwards, A. B., Gaylard, E. K., & Radloff, S. E. (2013). WAIS-III test performance in the
South African context: Refinement of an existing cross-cultural normative database. In K.
Cockcroft & S. Laher (Eds.), Psychological assessment in South Africa: Research and applications
(pp. 17-32). Johannesburg: Wits Press.
Shuttleworth-Edwards, A. B., Kemp, R. D., Rust, A. L., Muirhead, J. G., Hartman, N. P., & Radloff, S. E.
(2004). Cross-cultural effects on IQ test performance: A review and preliminary normative
indications on WAIS-III test performance. Journal of Clinical and Experimental
Neuropsychology, 26(7), 903-920.
Silverstein, A. B. (1982). Two- and four-subtest short forms of the Wechsler Adult Intelligence Scale-
Revised. Journal of Consulting and Clinical Psychology, 50, 415-418. doi:10.1037/0022-
006X.50.3.415
Silverstein, A. B. (1985). An appraisal of three criteria for evaluating the usefulness of WAIS-R short
forms. Journal of Clinical Psychology, 41, 676-680.
Silverstein, A. B. (1990). Short forms of individual intelligence tests. Psychological Assessment: A Journal
of Consulting and Clinical Psychology, 2(1), 3.
Smith, G. T., McCarthy, D. M., & Anderson, K. G. (2000). On the sins of short form
development. Psychological assessment, 12(1), 102.
Spearman, C. (1904). “General intelligence,” objectively determined and measured. American Journal of
Psychology, 15, 201-293. doi:10.2307/1412107
Staffaroni, A. M., Eng, M. E., Moses Jr, J. A., Zeiner, H. K., & Wickham, R. E. (2018). Four-and five-factor
models of the WAIS-IV in a clinical sample: Variations in indicator configuration and factor
correlational structure. Psychological Assessment, 5, 693-706. doi:10.1037/pas0000518
108
Suchy, Y. (2016). Population-based norms in crisis. Clinical Neuropsychologist, 30, 973-974.
Sunderaraman, P., Zahodne, L. B., & Manly, J. J. (2016). A commentary on ‘generally representative is
representative of none: Pitfalls of IQ test standardization in multicultural settings’ by AB
Shuttleworth-Edwards. The Clinical Neuropsychologist, 30(7), 999-1005.
Suzuki, L. A., & Ponterotto, J. G. (Eds.). (2008). Handbook of multicultural assessment: Clinical,
psychological, and educational applications (3rd ed.). San Francisco, CA: John Wiley & Sons, Inc.
Taylor, N. (2016). Generally representative is generally representative: Comment on Shuttleworth-
Edwards. The Clinical Neuropsychologist, 30(7), 1017-1022.
Tellegen, A., & Briggs, P. F. (1967). Old wine in new skins: grouping Wechsler subtests into new
scales. Journal of consulting psychology, 31(5), 499.
Thaler, N. S., & Jones-Forrester, S. (2013). IQ testing and the Hispanic client. In L. T. Benuto (Ed.), Guide
to psychological assessment with Hispanics (pp. 81-98). New York, NY: Springer.
Thompson, A. P., LoBello, S. G., Atkinson, L., Chisholm, V., & Ryan, J. J. (2004). Brief intelligence testing in
Australia, Canada, the United Kingdom, and the United States. Professional Psychology:
Research and Practice, 35, 286-290. doi:10.1037/0735-7028.35.3.286
Úbeda, R., Fuentes, I., & Dasí, C. (2016). Revisión de las formas abreviadas de la Escala de Inteligencia de
Wechsler para Adultos.
UNESCO Institute for Statistics (2012). International Standard Classification of Education: ISCED 2011.
Montreal: UNESCO Institute for Statistics.
UNESCO Institute for Statistics (2017). UNESCO Institute for Statistics: Country data. Retrieved [May
2017] from: http://uis.unesco.org/en/.
Uzzell, B. P., Ponton, M., & Ardila, A. (Eds.). (2007). International handbook of cross-cultural
neuropsychology. Mahwah, NJ: Lawrence Earlbaum Associates, Publishers.

109
van Aken, L., Kessels, R. P. C., Wingbermühle, E., Wiltink, M., van der Heijden, P. T., & Egger, J. I. M.
(2014) Exploring the incorporation of executive functions in intelligence testing: Factor analysis
of the WAIS-III and traditional tasks of executive functioning. International Journal of Applied
Psychology, 4(2), 73-80. doi:10.5923/j.ijap.20140402.05
van Aken, L., van der Heijden, P. T., van der Veld, W. M., Hermans, L., Kessels, R. P. C., & Egger, J. I. M.
(2017). Representation of the Cattell-Horn-Carroll theory of cognitive abilities in the factor
structure of the Dutch-language version of the WAIS-IV. Assessment, 24(4), 458-466.
doi:10.1177/1073191115607973
van Duijvenbode, N., Didden, R., van den Hazel, T., & Engels, R. C. (2016). Psychometric qualities of a
tetrad WAIS-III short form for use in individuals with mild to borderline intellectual disability.
Developmental neurorehabilitation, 19(1), 26-30.
van Ool, J. S., Hurks, P. P., Snoeijen-Schouwenaars, F. M., Tan, I. Y., Schelhaas, H. J., Klinkenberg, S., ... &
Hendriksen, J. G. (2017). Accuracy of WISC-III and WAIS-IV short forms in patients with
neurological disorders. Developmental Neurorehabilitation, 1-7.
von Thomsen, C., Gallup, L., & Llorente, A. M. (2008). Intellectual abilities: Theoretical and applied
assessment considerations. In A. M. Llorente, (Ed.) Principles of neuropsychological assessment
with Hispanics (pp. 57-77). New York, NY: Springer.
Wagner, F., Pawlowski, J., Yates, D. B., Camey, S. A., & Trentini, C. M. (2010). Viability of IQ estimates
based on Vocabulary and Block Design WAIS-III subtests. Psico-USF, 15(2), 215-224.
Ward, L. C. (1990). Prediction of verbal, performance, and full scale IQs from seven subtests of the WAIS-
R. Journal of Clinical Psychology, 46(4), 436-440. doi:10.1002/1097-4679(199007)46:4<436::AID-
JCLP2270460411>3.0.CO;2-M
Ward, L. C., Bergman, M. A., & Hebert, K. R. (2012). WAIS-IV subtest covariance structure: Conceptual
and statistical considerations. Psychological Assessment, 24(2), 328. doi:10.1037/a0025614

110
Warne, R. T., & Burningham, C. (2019). Spearman’s g Found in 31 Non-Western Nations: Strong Evidence
that g is a Universal Phenomenon. Psychological Bulletin, 145(3), 237-272.
doi:10.31234/osf.io/uv673
Watkins, M. W., Dombrowski, S. C., & Canivez, G. L. (2018). Reliability and factorial validity of the
Canadian Wechsler Intelligence Scale for Children-Fifth Edition. International Journal of School &
Educational Psychology, 6(4), 252-265. doi:10.1080/21683603.2017.1342580
Wechsler, D. (1997). The Wechsler Adult Intelligence Scale, Third Edition. San Antonio, TX: The
Psychological Corporation.
Wechsler, D. (1999). WASI (Wechsler Adult Scale-reduced). New York: The Psychological Corporation.
Wechsler, D. (2001). WAIS-III: Escala de Inteligencia Wechsler para Adultos-III. Madrid, Spain: T.E.A.
Ediciones.
Wechsler, D. (2003). Escala Wechsler de Inteligencia para Adultos-III. Mexico City, Mexico: Manual
Moderno.
Wechsler, D. (2008a). Escala de Inteligencia Wechsler para Adultos – Tercera Ediction (EIWA-III). San
Antonio, TX: Pearson.
Wechsler, D. (2008b). Wechsler Adult Intelligence Scale–Fourth Edition. San Antonio, TX: Pearson.
Wechsler, D. (2008c). Wechsler Adult Intelligence Scale–Fourth Edition: Technical and interpretive
manual. San Antonio, TX: Pearson.
Wechsler, D. (2008d). Wechsler Adult Intelligence Scale–Fourth Edition: Canadian (WAIS-IV CDN).
Toronto, Ontario: Pearson Canada.
Wechsler, D. (2008e). Wechsler Adult Intelligence Scale–Fourth Edition: Canadian Technical Manual.
Toronto, Ontario: Pearson Canada.
Wechsler, D. (2011). Wechsler Abbreviated Scale of Intelligence—Second Edition (WASI-II). San Antonio,
TX: Pearson.

111
Wechsler, D. (2012a). WAIS-IV. Escala de inteligencia de Wechsler para adultos-IV. Manual de aplicación
y corrección. Madrid: NCS Pearson, Inc. Edición original, 2008.
Wechsler, D. (2012b). WAIS-IV. Escala de inteligencia de Wechsler para adultos-IV. Manual tecnico y de
interpretación. Madrid: NCS Pearson, Inc. Edición original, 2008.
Wechsler, D. (2012c). Wechsler Preschool and Primary Scale of Intelligence—Fourth Edition (WPPSI-IV).
San Antonio, TX: Pearson.
Wechsler, D. (2013). WAIS-IV. Escala de inteligencia de Wechsler para adultos-IV. Manual de aplicación y
corrección- Versión chilena. Chile: NCS Pearson, Inc. Edición original, 2008. Traducción
castellana, 2012.
Wechsler, D. (2014a). WAIS-IV. Escala de inteligencia de Wechsler para adultos-IV. Manual de aplicación
y corrección- Versión méxicana. Traducción al español por Editorial El Manual Moderno, S. A. de
C. V. D. R. Traducido por M. C. Uribe Ferrari; coordinación de estandarización Facultad de
Psicologia, Universidad Nacional Autónoma de México; análisis estadistico J. Zhu, Y. Meng, I.
Martinez. J. L. Morales Saavedra & T. Uriza Gómez (Eds.). D. F., México: NCS Pearson, Inc.
Wechsler, D. (2014b). Wechsler Intelligence Scale for Children—Fifth Edition (WISC-V). San Antonio, TX:
Pearson.
Wechsler, D. (2016). Escala de inteligencia de Wechsler para adultos-cuarta edición (WAIS-IV). Manual
de administración y corrección, versión estandarizada en Colombia. Documento escrito para NCS
Pearson, Inc. por R. Rosas D., M. Tenorio D., & M. Pizarro M. La versión adaptada y
estandarizada para Colombia se ha escrito con apoyo de F. Lopera & S. Moreno. Chile: NCS
Pearson, Inc. Edición original, 2008. Traducción castellana, 2012.
Weiss, L. G., Keith, T. Z., Zhu, J., & Chen, H. (2013a). Technical and practical issues in the structure and
clinical invariance of the Wechsler Scales: A rejoinder to commentaries. Journal of
Psychoeducational Assessment, 31, 235-243. doi:10.1177/0734282913478050

112
Weiss, L. G., Keith, T. Z., Zhu, J., & Chen, H. (2013b). WAIS-IV and clinical validation of the four- and five-
factor interpretative approaches. Journal of Psychoeducational Assessment, 31, 94-113.
doi:10.1177/0734282913478030
Weiss, L. G., Keith, T. Z., Zhu, J., & Chen, H. (2013c). WISC-IV and clinical validation of the four and five-
factor interpretative approaches. Journal of Psychoeducational Assessment, 31, 114-131.
doi:10.1177/0734282913478032
Weiss, L. G., Saklofske, D. H., Coalson, D., & Raiford, S. E. (Eds.). (2010). WAIS-IV clinical use and
interpretation: Scientist-practitioner perspectives. San Diego, CA: Academic Press.
Whipple Drozdick, L., Wahlstrom, D., Zhu, J., & Weiss, L. G (2012). The Wechsler Adult Intelligence
Scale—Fourth Edition and the Wechsler Memory Scale—Fourth Edition. In D. P. Flanagan & P. L.
Harrison (Eds.), Contemporary intellectual assessment: Theories, tests, and issues (3rd ed., pp.
197-223). New York, NY: The Guilford Press.
Wicherts, J. M. (2016). The importance of measurement invariance in neurocognitive ability testing. The
Clinical Neuropsychologist, 30(7), 1006-1016.
Woodcock, R. W., Maricle, D. E., Miller, D. C., & McGill, R. J. (2018). Functional Cattell-Horn-Carroll
nomenclature for practical applications. In D. P. Flanagan & E. M. McDonough (Eds.),
Contemporary intellectual assessment: Theories, tests, and issues (5th ed., pp. 901-911). New
York, NY: The Guilford Press.
World Bank (2017). Colombia- Educational Attainment from the Barro-Lee Educational Attainment
Dataset (2010). Retrieved [April 2017] from: http://www.worldbank.org.
World Economic Forum (2017-2018). The global competitiveness report 2017-2018. Geneva: World
Economic Form. Retrieved [April 2018] from: http://reports.weforum.org/global-
competitiveness-index-2017-2018/.

113
Wright, C. V., Beattie, S. G., Galper, D. I., Church, A. S., Bufka, L. F., Brabender, V. M., & Smith, B. L.
(2017). Assessment practices of professional psychologists: Results of a national
survey. Professional Psychology: Research and Practice, 48(2), 73.
Wymer, J. H., Rayls, K., & Wagner, M. T. (2003). Utility of a clinically derived abbreviated form of the
WAIS-III. Archives of Clinical neuropsychology, 18(8), 917-927. doi:10.1016/S0887-
6177(02)00221-4
Yang, R., Spirtes, P., Scheines, R., Reise, S. P., & Mansoff, M. (2017). Finding Pure Submodels for
Improved Differentiation of Bifactor and Second-Order Models. Structural equation modeling: a
multidisciplinary journal, 24(3), 402-413.

Tables
Table 1.1 Demographics for current sample of Colombian executives

Table 1.2. Demographics of study-relevant countries

116
Table 1.3 Educational attainment of the adult population (aged 25 and older) for each country of interest

Table 1.4. Demographics of the Colombia, Chilean, Mexican, Spanish, American, and Canadian WAIS-IV normative samples1

118
Table 1.5. Select country norms systems descriptive statistics, mean differences, and percentage agreement with Colombian norms for FSIQ and Indices (N=305)

Table 1.6. Norm systems: Descriptive statistics, mean differences and percentage agreement with Colombian norms for WAIS-IV subtests (scaled scores; N=305)

120
Table 2.1. Summary of WAIS-IV factor analytic studies
First Author Year
Country/Test
Version Sample
Age
(years) Method
# WAIS-IV
Subtests
# of Models
Tested
Four-factor vs.
Five-factor Model
Higher-order vs.
BifactorFinal Model
Abdelhamid 2017 Egypt Community Sample 18 to 24 CFA 10 17four-factor
(though both acceptable)higher-order
Four-factor (VCI = SI, VC, IN; PRI = BD, MR, VP, AR; WMI = AR, DS;
PSI = SS, CD).
Benson 2010 USA Standardization Sample 16-69 CFA 15 11 five-factorhigher-order
(bifactor not tested)
Five-factors (Gc = SI, VC, IN, CO; Gv = BD, VP, PC; Gf = MR, FW,
AR; Gsm = DS, AR, LN; Gs = SS, CD, CN).
Canivez 2010a USA Standardization Sample 16-19 EFA 10 and 15 -- four-factorhigher-order
(bifactor not tested)General factor + limited support for 4 factors.
Canivez 2010b USA Standardization Sample 16-90 EFA15 (ages 16-69)
12 (ages 70-90)-- four-factor
higher-order
(bifactor not tested)General factor + limited support for 4 factors.
Frisby 2015 USAStandardization Sample
(white/black)16-90
EFA
CFA
15 WAIS-IV
10 WMS-IV14
four-factor
(five-factor not tested)
bifactor
(higher-order not tested)
Bifactor with four broad factors (verbal comprehension,
processing speed, visual processing, working memory, correlation
FW with AR).
Gignac 2013 USA Standardization Sample 16-69 CFA 15 4 four-factor bifactor
Bifactor four-factor Wechsler model with no cross-loadings (VCI =
SI, VC, IN, CO; PRI - BD, MR, VP, FW, PC; WMI = DS, AR, LN; PSI =
SS, CD, CA).
Gignac 2014 USA Standardization Sample 16-90 CFA
6 and 17
(DS broken into
DSF, DSB, DSS)
5two-factor and four-factor
(five-factor not tested)Bifactor
Gf and WMC share approx. 60% trude common variance; Gf
better predictor of g than WMC.
Niileksela 2013 USA Standardization Sample 70-90 CFA
14
(DS broken into
DSF, DSB, DSS)
10 five-factorboth higher-order
and bifactor
Five factor CHC model modified for older population (Gc= SI, VC,
IN, CO; Gv = BD, VP, PC; Gf = MR, AR; Gsm = DS forward,
backward, sequencing; Gs = CD, SS).
Pezzuti 2018 Italy Standardization Sample 16-90 CFA 15 1five-factor
(four-factor not tested)
higher-order
(bifactor not tested)
Weiss et al. 2013 five-factor model (Gc/VCI = SI, VC, IN, CO;
Gv/POI = BD, MR, VP, FW, PC; Gf/FRI = MR, RQ (= FW, AR);
Gsm/WMI = DS, AR, LN; Gs/PSI = SS, CD, CA).
Staffaroni 2018 USAClinical Sample
(Veterans)Adults CFA
12
(DS broken into
DSF, DSB, DSS)
7five-factor
(though both acceptable)
oblique
(favored over higher-order
and bifactor)
Five-factor (Gc/VCI = SI, VC, IN, CO; Gv/PRI = BD, PC, VP; Gf/FRI =
MR, AR; Gsm/WMI = DS forward, backward, sequencing; Gs/PSI
= SS, CD).
van Aken 2017 Netherlands Clinical Sample Adults CFA 15 21five-factor
(though both acceptable)
higher-order
(bifactor not tested)
Five-factor (Gc = SI, VC, IN, CO; Gv = BD, MR, VP, FW, PC; Gf =
MR, FW, AR; Gsm = DS, AR, LN; Gs = SS, CD, CA; corr. VC with IN,
FW with AR).
Ward 2012 USA Standardization Sample Adults CFA 15 5five-factor
(though both acceptable)
oblique
(higher-order and bifactor
not tested)
Five-factor (Gc = SI, VC, IN, CO, AR; Gv = BD, VP, FW, PC; Gf = MR,
FW, AR; Gsm = DS, AR, LN; Gs = SS, CD, CA).
Weiss 2013b USAStandardiization Sample &
WAIS-IV Clinical Sample16-69 CFA 15 21
five-factor
(though both acceptable)
higher-order
(bifactor not tested)
Five-factor (VCI/Gc = SI, VC, IN, CO; POI/Gv = BD, MR, VP, FW,
PC; FRI/Gf = MR, RQ (= FW, AR); WMI/Gsm = DS, AR, LN; PSI/Gs
= SS, CD, CA).

121
Table 2.2. Model specifications denoting which subtests were used to indicate each factor
Model SI VC IN CO BD MR VP FW PC DS AR LN SS CD CN RQ
Four-factor A VCI VCI VCI VCI PRI PRI PRI PRI PRI WMI WMI WMI PSI PSI PSI --
Four-factor B VCI VCI VCI VCI PRI PRI PRI PRI PRI WMI* WMI WMI* PSI PSI PSI --
Four-factor C VCI VCI VCI VCI PRI PRI PRI PRI, WMI
PRI WMI* WMI WMI* PSI PSI PSI --
Four-factor D VCI VCI VCI VCI PRI PRI PRI PRI PRI WMI* VCI, WMI WMI* PSI PSI PSI --
Four-factor E VCI VCI VCI VCI PRI PRI PRI PRI, WMI
PRI WMI* VCI, WMI WMI* PSI PSI PSI --
Five-factor A Gc Gc Gc Gc Gv Gf Gv Gf Gv Gsm Gf, Gsm Gsm Gs Gs Gs --
Five-factor B Gc Gc Gc Gc Gv Gf Gv Gf Gv Gsm Gf, Gc, Gsm
Gsm Gs Gs Gs --
Five-factor C Gc Gc Gc Gc Gv Gv, Gf Gv Gv, RQ Gv Gsm Gsm, RQ Gsm Gs Gs Gs Gf
Five-factor D Gc Gc Gc Gc Gv Gv, Gf Gv Gv, RQ Gv Gsm Gc, Gsm,
RQ Gsm Gs Gs Gs
Gf
Note. SI = Similarities, VC = Vocabulary, IN = Information, CO = Comprehension, BD = Block Design, MR = Matrix Reasoning, VP = Visual Puzzles, FW = Figure Weights, PC = Picture Completion, DS = Digit Span, AR = Arithmetic, LN = Letter-Number Sequencing, SS = Symbol Search, CD = Coding, CA = Cancellation, VCI = Verbal Comprehension Index, PRI = Performance Reasoning Index, WMI = Working Memory Index, PSI = Processing Speed Index, Gc = crystalized intelligence, Gf = fluid intelligence, Gv = visual processing, Gsm = short-term memory, Gs = processing speed, RQ = Quantitative Reasoning. * indicates the addition of correlation with other stared indicator.

122
Table 2.3. Fit statistics of all four- and five-factor models tested
Model WLMSV
2 (df) 2 p RMSEA RMSEA 90% CI CFI TLI SRMR AIC BIC aBIC
Oblique Models
1. Four-factor A 296.29 84 -- <0.0005 0.061 [0.054 - 0.069] 0.965 0.956 0.034 45378.45 45608.48 45446.55
2. Four-factor B 237.82 83 -58.47 <0.0005 0.053 [0.045 - 0.061] 0.974 0.968 0.030 45321.99 45556.52 45391.41
3. Four-factor C 219.72 82 -18.11 <0.0005 0.050 [0.042 - 0.058] 0.977 0.971 0.029 45305.88 45544.92 45376.64
4. Four-factor D1 232.15 82 12.43 <0.0005 0.052 [0.044 - 0.060] 0.975 0.968 0.030 45318.31 45557.35 45389.07
5. Four-factor E1 212.20 81 -19.94 <0.0005 0.049 [0.041 - 0.057] 0.978 0.972 0.029 45300.37 45543.92 45372.47
6. Five-factor A 168.79 79 -- <0.0005 0.041 [0.033 - 0.050] 0.985 0.980 0.026 45260.95 45513.53 45355.72
7. Five-factor B1 164.31 78 -4.48 <0.0005 0.041 [0.032 - 0.049] 0.986 0.981 0.025 45258.47 45515.56 45334.58
8. Five-factor C 160.84 77 -3.47 <0.0005 0.040 [0.031 - 0.049] 0.986 0.981 0.025 45257.00 45518.60 45334.44
9. Five-factor D1 159.48 76 -1.36 <0.0005 0.040 [0.032 - 0.049] 0.986 0.981 0.025 45257.64 45523.75 45336.42
Higher-Order Models
10. Four-factor A 296.94 86 -- <0.0005 0.060 [0.053 - 0.068] 0.965 0.957 0.034 45375.10 45596.11 45440.53
11. Four-factor B 238.24 85 -58.70 <0.0005 0.052 [0.044 - 0.060] 0.975 0.969 0.030 45318.41 45543.92 45385.17
12. Four-factor C 219.72 84 -18.52 <0.0005 0.049 [0.041 - 0.057] 0.978 0.972 0.029 45301.89 45531.91 45369.98
13. Four-factor D1 -- -- -- -- -- -- -- -- -- -- -- --
14. Four-factor E1 -- -- -- -- -- -- -- -- -- -- -- --
15. Five-factor A 193.70 84 -- <0.0005 0.044 [0.036 - 0.052] 0.982 0.977 0.028 45275.86 45505.89 45343.96
16. Five-factor B1 -- -- -- -- -- -- -- -- -- -- -- --
17. Five-factor C 181.89 82 -11.81 <.0005 0.043 [0.034 - 0.051] 0.984 0.979 0.027 45268.05 45507.10 45338.82
18. Five-factor D1 -- -- -- -- -- -- -- -- -- -- -- --
Bifactor Models
19. Four-factor A 120.03 69 -- 0.0001 0.033 [0.023 - 0.043] 0.992 0.987 0.019 45232.19 45529.87 45320.31
20. Four-factor B2 116.32 68 -3.71 0.0002 0.033 [0.022 - 0.042] 0.992 0.988 0.019 45230.48 45532.67 45319.94
21. Four-factor C2 105.45 67 -10.87 0.0019 0.029 [0.018 - 0.040] 0.994 0.990 0.018 45221.61 45528.31 45312.40
22. Four-factor D1 -- -- -- -- -- -- -- -- -- -- -- --
23. Four-factor E1 -- -- -- -- -- -- -- -- -- -- -- --
24. Five-factor A 92.10 64 -- 0.0123 0.026 [0.012 - 0.037] 0.995 0.992 0.016 45214.26 45534.49 45309.06

123
25. Five-factor B1 -- -- -- -- -- -- -- -- -- -- -- --
26. Five-factor C 87.90 62 -4.20 0.0169 0.025 [0.011 - 0.036] 0.996 0.993 0.016 45214.06 45543.31 45311.53
27. Five-factor D1 -- -- -- -- -- -- -- -- -- -- -- --
Note. 1 Cross-factor loading of arithmetic (AR) on Verbal Comprehension Index (VCI)/Crystalized intelligence (Gc) is negative; fit statistics are only reported for oblique version of models. 2 Covariance matrix not positive definite. CFI = comparative fit index; RMSEA = root mean square error of approximation; SRMR = standardized root mean square residual; AIC - Akaike information criterion; BIC = Bayesian information criterion; aBCI = adjusted Bayesian information criterion. Specific model structure is denoted in Table 2 and Figures 1 and 2. Best fitting four-factor models are highlighted in blue. Best fitting five-factor models are highlighted in green.

124
Table 2.4. Factor loadings of the best fitting higher-order and bifactor models (five-factor model C)
g Gc Gv Gf (RQ) Gsm Gs
Subtest SL
Trans. Bifactor Higher- Order
SL Trans. Bifactor
Higher- Order
SL Trans. Bifactor
Higher- Order
SL Trans. Bifactor
Higher- Order
SL Trans. Bifactor
Higher- Order
SL Trans. Bifactor
SI 0.702 0.801 0.802 0.388 0.063
VC 0.762 0.868 0.871 0.422 0.061
IN 0.728 0.840 0.832 0.403 -0.221
CO 0.707 0.820 0.808 0.391 0.178
BD 0.702 0.593 0.802 0.388 0.554
MR 0.586 0.681 0.193 -- 0.068 0.586 0.000 0.283
VP 0.671 0.555 0.767 0.371 0.557 (0.692) -- (0.365)
FW 0.126 0.671 0.144 0.070 0.080
PC 0.592 0.582 0.676 0.327 0.317
DS 0.725 0.629 0.874 0.487 0.630
AR 0.217 0.628 (0.566) -- (0.423) 0.261 0.146 0.131
LN 0.402 0.633 0.484 0.270 0.546
SS 0.662 0.490 0.874 0.571 0.697
CD 0.198 0.584 0.261 0.171 0.531
CN 0.366 0.379 0.484 0.316 0.438
(RQ) 0.931 -- 0.931 0.000 0.854
Avg. 0.567 0.650 0.828 0.401 0.020 0.516 0.289 0.315 0.759 0.000 0.569 0.540 0.301 0.436 0.540 0.353 0.555
Note. SL Trans. = Schmid-Leiman transformation (Schmid & Leiman, 1957; Brown, 2015). SI = Similarities, VC = Vocabulary, IN = Information, CO = Comprehension, BD = Block Design, MR = Matrix Reasoning, VP = Visual Puzzles, FW = Figure Weights, PC = Picture Completion, DS = Digit Span, AR = Arithmetic, LN = Letter-Number Sequencing, SS = Symbol Search, CD = Coding, CA = Cancellation, VCI = Verbal Comprehension Index, PRI = Performance Reasoning Index, WMI = Working Memory Index, PSI = Processing Speed Index, Gc = crystalized intelligence, Gf = fluid intelligence, Gv = visual processing, Gsm = short-term memory, Gs = processing speed, RQ = Quantitative Reasoning.

125
Table 3.1 Reliability, Validity, and Clinical Correspondence of Best 2-, 3-, 4-, and 5-Subtest Short Forms
T1 T2 T3 T4 T5 r ss r
% est. IQs
within
+ 2 pts
% est. IQs
within
+ 5 pts
% est. IQs
within
+ 10 pts
% within
same clinical
classifications
% within + 1
clinical
classification
% within + 2
clinical
classifications
Suppl.
Test?
Model
Align.
IN MR1 - - - 0.941 0.857 27.06 57.84 84.10 59.53 36.53 3.95 W
IN DS2 - - - 0.938 0.864 24.69 55.02 84.67 60.43 36.75 2.82 CHC
VC MR3 - - - 0.934 0.860 28.97 57.05 85.23 58.06 38.67 3.27 W
VC DS4 - - - 0.932 0.859 25.59 54.11 83.99 59.41 37.66 2.93 CHC
IN VP5 - - - 0.925 0.849 26.83 52.99 83.09 57.61 39.23 3.16 W
MR DS6 - - - 0.923 0.848 24.92 49.49 80.61 58.29 38.67 3.04 CHC
VC LN7 - - - 0.918 0.863 18.38 39.01 61.78 44.65 27.73 3.38 * CHC
Mean: 0.930 0.857 25.21 52.21 80.50 56.85 36.46 3.22
IN VP DS5 - - 0.945 0.880 33.82 67.19 93.12 66.97 32.13 0.90 W
IN MR DS6 - - 0.952 0.893 31.23 62.80 91.43 65.61 33.26 1.13 W
VC VP DS7 - - 0.941 0.883 31.79 66.40 92.45 66.85 32.47 0.68 W
VC MR DS8 - - 0.948 0.898 33.82 65.50 92.33 66.52 32.36 1.13 W
VC MR VP9 - - 0.940 0.902 31.68 60.20 90.53 64.15 34.84 1.01 CHC
SI MR DS10 - - 0.930 0.896 32.58 63.13 91.77 62.80 36.30 0.90 W
VC MR LN11 - - 0.941 0.903 29.76 61.61 89.73 61.16 37.50 1.34 * W
Mean: 0.943 0.894 32.10 63.83 91.62 64.87 34.12 1.01
VC BD MR DS12 - 0.946 0.923 41.38 77.68 97.52 74.18 25.59 0.23 CHC
VC IN VP DS13 - 0.958 0.924 41.38 72.49 95.72 72.83 26.72 0.45 W
SI IN BD DS14 - 0.951 0.924 38.22 73.28 97.18 72.04 27.62 0.34 W
IN MR VP DS15 - 0.956 0.918 40.47 70.12 95.60 70.12 29.43 0.45 CHC
SI MR VP DS16 - 0.952 0.921 37.09 72.83 95.60 70.01 29.76 0.23 CHC
VC MR PC DS17 - 0.949 0.921 34.05 66.18 92.90 69.67 29.20 1.13 * CHC
VC IN VP LN18 - 0.954 0.924 35.86 69.49 92.56 69.05 30.21 0.74 * W
SI IN MR LN19 - 0.960 0.915 35.57 67.11 91.52 64.58 34.08 1.34 * W
Mean: 0.953 0.921 38.00 71.15 94.82 70.31 29.08 0.61
VC IN VP DS SS22 0.931 0.942 51.97 85.34 99.10 79.14 20.86 W
VC IN MR DS SS23 0.937 0.939 47.01 81.51 98.87 75.76 24.13 0.11 W
VC IN BD MR LN24 0.937 0.935 41.22 75.15 95.83 69.94 29.61 0.45 * CHC
SI VC MR PC DS25 0.930 0.939 39.12 69.56 95.72 69.00 30.21 0.79 * CHC
VC IN MR PC DS26 0.944 0.933 34.50 69.90 95.49 68.43 31.12 0.45 * CHC
VC IN MR PC LN27 0.940 0.931 35.27 65.63 92.71 66.82 31.55 1.64 * CHC
Mean: 0.936 0.936 41.52 74.51 96.29 71.51 27.91 0.69
Note. T = subtest (T1-T5), r ss = Pearson reliability coefficient, r = validity coefficient, Vc SI = Similarities, VC = Vocabulary, IN = Information,
CO = Comprehension, BD = Block Design, MR = Matrix Reasoning, VP = Visual Puzzles, PC = Picture Completion, DS = Digit Span, LN = Letter-
Number Sequencing, SS = Symbol Search. * Contains a supplemental test which may not be ideal for some assessment situations. W =
Combinations most theoretically consistent with the Wechsler (4-factor) model. CHC = Combinations most theoretically consistent with
the Cattell-Horn Carroll (CHC 5-factor) model. 1-7two-subtest combinations C1, C2, C3, C4, C5, C7, and C8 respectively. 5-11three-subtest
combinations C9, C2, C10, C4, C8, and C3 respectively. 12-19four-fubtest combinations C23, C7, C19, C10, C16, C20, C12, and C5,
respectively. 22-27five-subtest combinations C24, C16, C18, C25, C6 and C12 respectively (see Supplemental Table 2 for a full list of
numbered combinations).
Five-subtests
Four-subtests
Three-subtests
Table 1. Reliability, Validity, and Clinical Correspondence of Best 2-, 3-, 4-, and 5-Subtest Short Forms
Two-subtests

126
T1 T2 T3 T4 T5 r ss r
% est. IQs
within
+ 2 pts
% est. IQs
within
+ 5 pts
% est. IQs
within
+ 10 pts
% within
same clinical
classifications
% within + 1
clinical
classification
% within + 2
clinical
classifications
Suppl.
Test?
Model
Align.
IN MR1 - - - 0.941 0.857 27.06 57.84 84.10 59.53 36.53 3.95 W
IN DS2 - - - 0.938 0.864 24.69 55.02 84.67 60.43 36.75 2.82 CHC
VC MR3 - - - 0.934 0.860 28.97 57.05 85.23 58.06 38.67 3.27 W
VC DS4 - - - 0.932 0.859 25.59 54.11 83.99 59.41 37.66 2.93 CHC
IN VP5 - - - 0.925 0.849 26.83 52.99 83.09 57.61 39.23 3.16 W
MR DS6 - - - 0.923 0.848 24.92 49.49 80.61 58.29 38.67 3.04 CHC
VC LN7 - - - 0.918 0.863 18.38 39.01 61.78 44.65 27.73 3.38 * CHC
Mean: 0.930 0.857 25.21 52.21 80.50 56.85 36.46 3.22
IN VP DS5 - - 0.945 0.880 33.82 67.19 93.12 66.97 32.13 0.90 W
IN MR DS6 - - 0.952 0.893 31.23 62.80 91.43 65.61 33.26 1.13 W
VC VP DS7 - - 0.941 0.883 31.79 66.40 92.45 66.85 32.47 0.68 W
VC MR DS8 - - 0.948 0.898 33.82 65.50 92.33 66.52 32.36 1.13 W
VC MR VP9 - - 0.940 0.902 31.68 60.20 90.53 64.15 34.84 1.01 CHC
SI MR DS10 - - 0.930 0.896 32.58 63.13 91.77 62.80 36.30 0.90 W
VC MR LN11 - - 0.941 0.903 29.76 61.61 89.73 61.16 37.50 1.34 * W
Mean: 0.943 0.894 32.10 63.83 91.62 64.87 34.12 1.01
VC BD MR DS12 - 0.946 0.923 41.38 77.68 97.52 74.18 25.59 0.23 CHC
VC IN VP DS13 - 0.958 0.924 41.38 72.49 95.72 72.83 26.72 0.45 W
SI IN BD DS14 - 0.951 0.924 38.22 73.28 97.18 72.04 27.62 0.34 W
IN MR VP DS15 - 0.956 0.918 40.47 70.12 95.60 70.12 29.43 0.45 CHC
SI MR VP DS16 - 0.952 0.921 37.09 72.83 95.60 70.01 29.76 0.23 CHC
VC MR PC DS17 - 0.949 0.921 34.05 66.18 92.90 69.67 29.20 1.13 * CHC
VC IN VP LN18 - 0.954 0.924 35.86 69.49 92.56 69.05 30.21 0.74 * W
SI IN MR LN19 - 0.960 0.915 35.57 67.11 91.52 64.58 34.08 1.34 * W
Mean: 0.953 0.921 38.00 71.15 94.82 70.31 29.08 0.61
VC IN VP DS SS22 0.931 0.942 51.97 85.34 99.10 79.14 20.86 W
VC IN MR DS SS23 0.937 0.939 47.01 81.51 98.87 75.76 24.13 0.11 W
VC IN BD MR LN24 0.937 0.935 41.22 75.15 95.83 69.94 29.61 0.45 * CHC
SI VC MR PC DS25 0.930 0.939 39.12 69.56 95.72 69.00 30.21 0.79 * CHC
VC IN MR PC DS26 0.944 0.933 34.50 69.90 95.49 68.43 31.12 0.45 * CHC
VC IN MR PC LN27 0.940 0.931 35.27 65.63 92.71 66.82 31.55 1.64 * CHC
Mean: 0.936 0.936 41.52 74.51 96.29 71.51 27.91 0.69
Note. T = subtest (T1-T5), r ss = Pearson reliability coefficient, r = validity coefficient, Vc SI = Similarities, VC = Vocabulary, IN = Information,
CO = Comprehension, BD = Block Design, MR = Matrix Reasoning, VP = Visual Puzzles, PC = Picture Completion, DS = Digit Span, LN = Letter-
Number Sequencing, SS = Symbol Search. * Contains a supplemental test which may not be ideal for some assessment situations. W =
Combinations most theoretically consistent with the Wechsler (4-factor) model. CHC = Combinations most theoretically consistent with
the Cattell-Horn Carroll (CHC 5-factor) model. 1-7two-subtest combinations C1, C2, C3, C4, C5, C7, and C8 respectively. 5-11three-subtest
combinations C9, C2, C10, C4, C8, and C3 respectively. 12-19four-fubtest combinations C23, C7, C19, C10, C16, C20, C12, and C5,
respectively. 22-27five-subtest combinations C24, C16, C18, C25, C6 and C12 respectively (see Supplemental Table 2 for a full list of
numbered combinations).
Five-subtests
Four-subtests
Three-subtests
Table 1. Reliability, Validity, and Clinical Correspondence of Best 2-, 3-, 4-, and 5-Subtest Short Forms
Two-subtests

Table 3.2. Estimated WAIS-IV Full Scale IQs and 95% confidence intervals for Sum of Scaled Scored for the Best 2-Subtest Short Forms
est.
IQ
95%
lower
95%
upper
est.
IQ
95%
lower
95%
upper
est.
IQ
95%
lower
95%
upper
est.
IQ
95%
lower
95%
upper
est.
IQ
95%
lower
95%
upper
est.
IQ
95%
lower
95%
upper
est.
IQ
95%
lower
95%
upper
2 50 46 54 50 46 54 50 46 54 50 46 54 48 44 52 48 44 52 48 44 52 2
3 52 48 56 52 48 56 52 48 56 52 48 56 51 47 55 51 47 55 51 47 55 3
4 55 51 59 55 51 59 55 51 59 55 51 59 54 50 58 54 50 58 54 50 58 4
5 58 54 62 58 54 62 58 54 62 58 54 62 57 53 60 57 53 60 57 53 60 5
6 61 57 65 61 57 65 61 57 65 61 57 65 59 55 63 59 55 63 59 55 63 6
7 64 60 68 64 60 68 64 60 68 64 60 68 62 58 66 62 58 66 62 58 66 7
8 66 62 70 66 62 70 66 62 70 66 62 70 65 61 69 65 61 69 65 61 69 8
9 69 65 73 69 65 73 69 65 73 69 65 73 68 64 72 68 64 72 68 64 72 9
10 72 68 76 72 68 76 72 68 76 72 68 76 71 67 75 71 67 75 71 67 75 10
11 75 71 79 75 71 79 75 71 79 75 71 79 74 70 78 74 70 78 74 70 78 11
12 78 74 82 78 74 82 78 74 82 78 74 82 77 73 81 77 73 81 77 73 81 12
13 80 76 84 80 76 84 80 76 84 80 76 84 80 76 84 80 76 84 80 76 84 13
14 83 79 87 83 79 87 83 79 87 83 79 87 83 79 87 83 79 87 83 79 87 14
15 86 82 90 86 82 90 86 82 90 86 82 90 86 82 89 86 82 89 86 82 89 15
16 89 85 93 89 85 93 89 85 93 89 85 93 88 84 92 88 84 92 88 84 92 16
17 92 88 96 92 88 96 92 88 96 92 88 96 91 87 95 91 87 95 91 87 95 17
18 94 90 98 94 90 98 94 90 98 94 90 98 94 90 98 94 90 98 94 90 98 18
19 97 93 101 97 93 101 97 93 101 97 93 101 97 93 101 97 93 101 97 93 101 19
20 100 96 104 100 96 104 100 96 104 100 96 104 100 96 104 100 96 104 100 96 104 20
21 103 99 107 103 99 107 103 99 107 103 99 107 103 99 107 103 99 107 103 99 107 21
22 106 102 110 106 102 110 106 102 110 106 102 110 106 102 110 106 102 110 106 102 110 22
23 108 104 112 108 104 112 108 104 112 108 104 112 109 105 113 109 105 113 109 105 113 23
24 111 107 115 111 107 115 111 107 115 111 107 115 112 108 116 112 108 116 112 108 116 24
25 114 110 118 114 110 118 114 110 118 114 110 118 115 111 118 115 111 118 115 111 118 25
26 117 113 121 117 113 121 117 113 121 117 113 121 117 113 121 117 113 121 117 113 121 26
27 120 116 124 120 116 124 120 116 124 120 116 124 120 116 124 120 116 124 120 116 124 27
28 122 118 126 122 118 126 122 118 126 122 118 126 123 119 127 123 119 127 123 119 127 28
29 125 121 129 125 121 129 125 121 129 125 121 129 126 122 130 126 122 130 126 122 130 29
30 128 124 132 128 124 132 128 124 132 128 124 132 129 125 133 129 125 133 129 125 133 30
31 131 127 135 131 127 135 131 127 135 131 127 135 132 128 136 132 128 136 132 128 136 31
32 134 130 138 134 130 138 134 130 138 134 130 138 135 131 139 135 131 139 135 131 139 32
33 136 132 140 136 132 140 136 132 140 136 132 140 138 134 142 138 134 142 138 134 142 33
34 139 135 143 139 135 143 139 135 143 139 135 143 141 137 145 141 137 145 141 137 145 34
35 142 138 146 142 138 146 142 138 146 142 138 146 144 140 147 144 140 147 144 140 147 35
36 145 141 149 145 141 149 145 141 149 145 141 149 146 142 150 146 142 150 146 142 150 36
37 148 144 152 148 144 152 148 144 152 148 144 152 149 145 153 149 145 153 149 145 153 37
38 150 146 154 150 146 154 150 146 154 150 146 154 152 148 156 152 148 156 152 148 156 38
sum of
scaled
scores
Note: IN = information, MR = Matrix reasoning, DS = Digit span, VC = MR, VC = Vocabulary, VP = Visual puzzles, LN = Letter-number sequencing; 1-7two-subtest
combination numbers C1, C2, C3, C4, C5, C7, and C8 in the derivation process, respectively (also numbered to correspond Supplemental Table 2).
VC + LN7
sum of
scaled
scores
Reliable range = 2 Reliable range = 2 Reliable range = 2 Reliable range = 2 Reliable range = 2 Reliable range = 2 Reliable range = 2
IN + MR1 IN + DS2 VC + MR3 VC + DS4 IN + VP5 MR + DS6

Table 3.3. Estimated WAIS-IV Full Scale IQs and 95% confidence intervals for Sum of Scaled Scored for the Best 3-Subtest Short Forms
Subtests:
est.
IQ
95% CI
lower
95% CI
upper
est.
IQ
95% CI
lower
95% CI
upper
est.
IQ
95% CI
lower
95% CI
upper
est.
IQ
95% CI
lower
95% CI
upper
est.
IQ
95% CI
lower
95% CI
upper
est.
IQ
95% CI
lower
95% CI
upper
est.
IQ
95% CI
lower
95% CI
upper
3 46 42 50 46 42 50 46 42 50 46 42 50 43 39 47 46 42 50 46 42 50 3
4 48 44 52 48 44 52 48 44 52 48 44 52 45 41 49 48 44 52 48 44 52 4
5 50 46 54 50 46 54 50 46 54 50 46 54 48 44 51 50 46 54 50 46 54 5
6 52 48 56 52 48 56 52 48 56 52 48 56 50 46 54 52 48 56 52 48 56 6
7 54 50 58 54 50 58 54 50 58 54 50 58 52 48 56 54 50 58 54 50 58 7
8 56 52 60 56 52 60 56 52 60 56 52 60 54 50 58 56 52 60 56 52 60 8
9 58 54 62 58 54 62 58 54 62 58 54 62 56 52 60 58 54 62 58 54 62 9
10 60 56 64 60 56 64 60 56 64 60 56 64 58 54 62 60 56 64 60 56 64 10
11 62 58 66 62 58 66 62 58 66 62 58 66 60 56 64 62 58 66 62 58 66 11
12 64 60 68 64 60 68 64 60 68 64 60 68 62 58 66 64 60 68 64 60 68 12
13 66 62 70 66 62 70 66 62 70 66 62 70 64 60 68 66 62 70 66 62 70 13
14 68 64 72 68 64 72 68 64 72 68 64 72 66 62 70 68 64 72 68 64 72 14
15 70 66 74 70 66 74 70 66 74 70 66 74 69 65 72 70 66 74 70 66 74 15
16 72 68 76 72 68 76 72 68 76 72 68 76 71 67 75 72 68 76 72 68 76 16
17 74 70 78 74 70 78 74 70 78 74 70 78 73 69 77 74 70 78 74 70 78 17
18 76 72 80 76 72 80 76 72 80 76 72 80 75 71 79 76 72 80 76 72 80 18
19 78 74 82 78 74 82 78 74 82 78 74 82 77 73 81 78 74 82 78 74 82 19
20 80 76 84 80 76 84 80 76 84 80 76 84 79 75 83 80 76 84 80 76 84 20
21 82 78 86 82 78 86 82 78 86 82 78 86 81 77 85 82 78 86 82 78 86 21
22 84 80 88 84 80 88 84 80 88 84 80 88 83 79 87 84 80 88 84 80 88 22
23 86 82 90 86 82 90 86 82 90 86 82 90 85 81 89 86 82 90 86 82 90 23
24 88 84 92 88 84 92 88 84 92 88 84 92 87 83 91 88 84 92 88 84 92 24
25 90 86 94 90 86 94 90 86 94 90 86 94 90 86 93 90 86 94 90 86 94 25
26 92 88 96 92 88 96 92 88 96 92 88 96 92 88 96 92 88 96 92 88 96 26
Reliable range = 2
Unusual range = 7
Reliable range = 2
Unusual range = 8 Sum of
scaled
scores
Sum of
scaled
scores
Reliable range = 2
Unusual range = 7
Reliable range = 2
Unusual range = 8
Reliable range = 2
Unusual range = 7
Reliable range = 2
Unusual range = 8
Reliable range = 2
Unusual range = 7
Table 3. Estimated WAIS-IV Full Scale IQs and 95% confidence intervals for Sum of Scaled Scored for the Best 3-Subtest Short Forms
IN + VP + DS1 IN + MR + DS2 VC + VP + DS3 VC + MR +DS4 VC + MR + VP5 SI + MR + DS6 VC + MR+ LN7
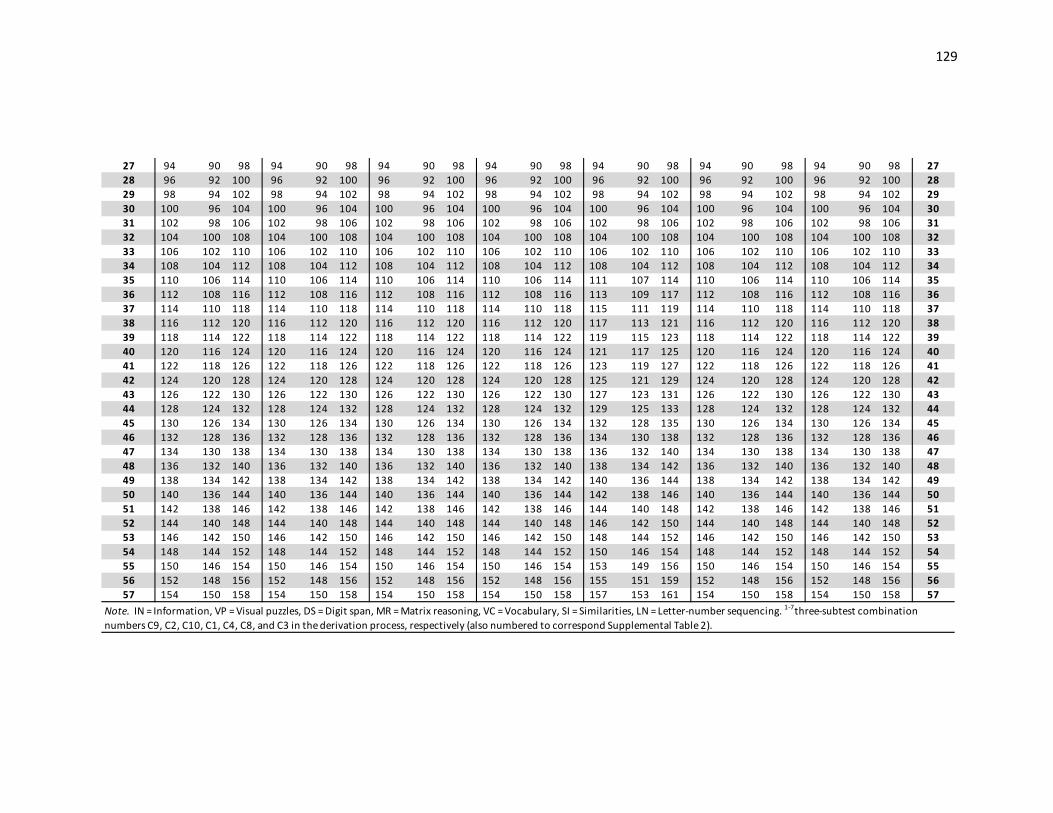
129
27 94 90 98 94 90 98 94 90 98 94 90 98 94 90 98 94 90 98 94 90 98 27
28 96 92 100 96 92 100 96 92 100 96 92 100 96 92 100 96 92 100 96 92 100 28
29 98 94 102 98 94 102 98 94 102 98 94 102 98 94 102 98 94 102 98 94 102 29
30 100 96 104 100 96 104 100 96 104 100 96 104 100 96 104 100 96 104 100 96 104 30
31 102 98 106 102 98 106 102 98 106 102 98 106 102 98 106 102 98 106 102 98 106 31
32 104 100 108 104 100 108 104 100 108 104 100 108 104 100 108 104 100 108 104 100 108 32
33 106 102 110 106 102 110 106 102 110 106 102 110 106 102 110 106 102 110 106 102 110 33
34 108 104 112 108 104 112 108 104 112 108 104 112 108 104 112 108 104 112 108 104 112 34
35 110 106 114 110 106 114 110 106 114 110 106 114 111 107 114 110 106 114 110 106 114 35
36 112 108 116 112 108 116 112 108 116 112 108 116 113 109 117 112 108 116 112 108 116 36
37 114 110 118 114 110 118 114 110 118 114 110 118 115 111 119 114 110 118 114 110 118 37
38 116 112 120 116 112 120 116 112 120 116 112 120 117 113 121 116 112 120 116 112 120 38
39 118 114 122 118 114 122 118 114 122 118 114 122 119 115 123 118 114 122 118 114 122 39
40 120 116 124 120 116 124 120 116 124 120 116 124 121 117 125 120 116 124 120 116 124 40
41 122 118 126 122 118 126 122 118 126 122 118 126 123 119 127 122 118 126 122 118 126 41
42 124 120 128 124 120 128 124 120 128 124 120 128 125 121 129 124 120 128 124 120 128 42
43 126 122 130 126 122 130 126 122 130 126 122 130 127 123 131 126 122 130 126 122 130 43
44 128 124 132 128 124 132 128 124 132 128 124 132 129 125 133 128 124 132 128 124 132 44
45 130 126 134 130 126 134 130 126 134 130 126 134 132 128 135 130 126 134 130 126 134 45
46 132 128 136 132 128 136 132 128 136 132 128 136 134 130 138 132 128 136 132 128 136 46
47 134 130 138 134 130 138 134 130 138 134 130 138 136 132 140 134 130 138 134 130 138 47
48 136 132 140 136 132 140 136 132 140 136 132 140 138 134 142 136 132 140 136 132 140 48
49 138 134 142 138 134 142 138 134 142 138 134 142 140 136 144 138 134 142 138 134 142 49
50 140 136 144 140 136 144 140 136 144 140 136 144 142 138 146 140 136 144 140 136 144 50
51 142 138 146 142 138 146 142 138 146 142 138 146 144 140 148 142 138 146 142 138 146 51
52 144 140 148 144 140 148 144 140 148 144 140 148 146 142 150 144 140 148 144 140 148 52
53 146 142 150 146 142 150 146 142 150 146 142 150 148 144 152 146 142 150 146 142 150 53
54 148 144 152 148 144 152 148 144 152 148 144 152 150 146 154 148 144 152 148 144 152 54
55 150 146 154 150 146 154 150 146 154 150 146 154 153 149 156 150 146 154 150 146 154 55
56 152 148 156 152 148 156 152 148 156 152 148 156 155 151 159 152 148 156 152 148 156 56
57 154 150 158 154 150 158 154 150 158 154 150 158 157 153 161 154 150 158 154 150 158 57
Note. IN = Information, VP = Visual puzzles, DS = Digit span, MR = Matrix reasoning, VC = Vocabulary, SI = Similarities, LN = Letter-number sequencing. 1-7three-subtest combination
numbers C9, C2, C10, C1, C4, C8, and C3 in the derivation process, respectively (also numbered to correspond Supplemental Table 2).
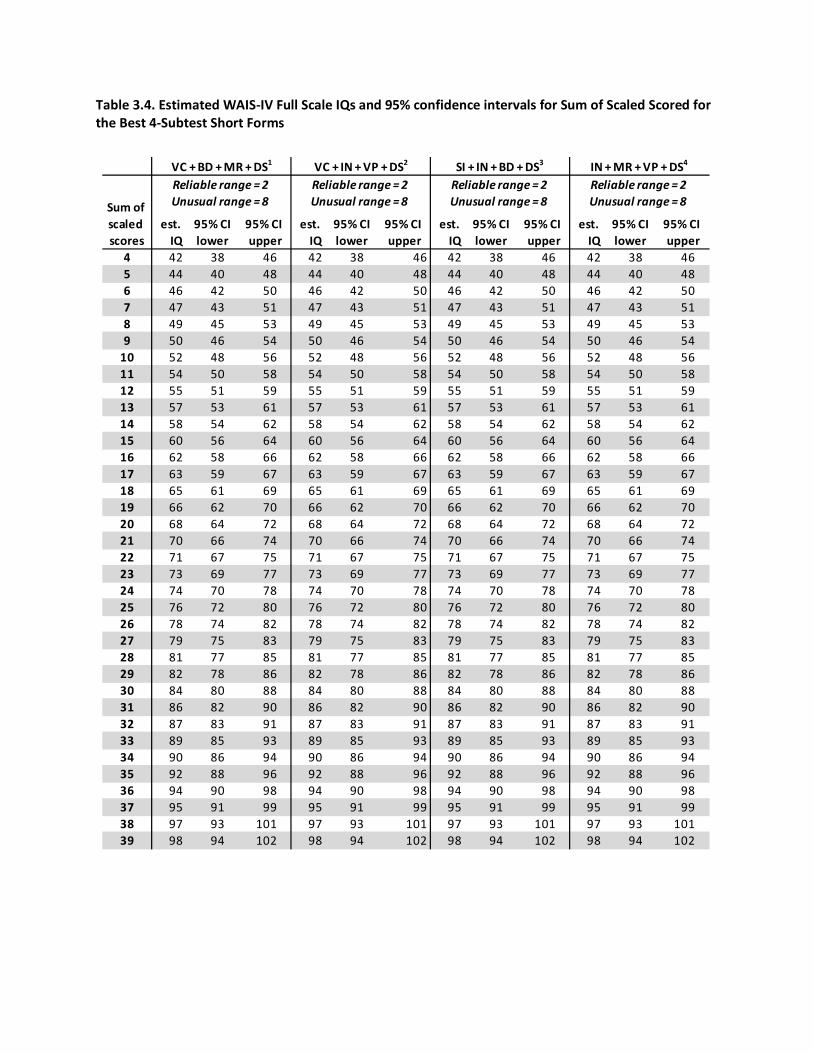
Table 3.4. Estimated WAIS-IV Full Scale IQs and 95% confidence intervals for Sum of Scaled Scored for the Best 4-Subtest Short Forms
est.
IQ
95% CI
lower
95% CI
upper
est.
IQ
95% CI
lower
95% CI
upper
est.
IQ
95% CI
lower
95% CI
upper
est.
IQ
95% CI
lower
95% CI
upper
4 42 38 46 42 38 46 42 38 46 42 38 46
5 44 40 48 44 40 48 44 40 48 44 40 48
6 46 42 50 46 42 50 46 42 50 46 42 50
7 47 43 51 47 43 51 47 43 51 47 43 51
8 49 45 53 49 45 53 49 45 53 49 45 53
9 50 46 54 50 46 54 50 46 54 50 46 54
10 52 48 56 52 48 56 52 48 56 52 48 56
11 54 50 58 54 50 58 54 50 58 54 50 58
12 55 51 59 55 51 59 55 51 59 55 51 59
13 57 53 61 57 53 61 57 53 61 57 53 61
14 58 54 62 58 54 62 58 54 62 58 54 62
15 60 56 64 60 56 64 60 56 64 60 56 64
16 62 58 66 62 58 66 62 58 66 62 58 66
17 63 59 67 63 59 67 63 59 67 63 59 67
18 65 61 69 65 61 69 65 61 69 65 61 69
19 66 62 70 66 62 70 66 62 70 66 62 70
20 68 64 72 68 64 72 68 64 72 68 64 72
21 70 66 74 70 66 74 70 66 74 70 66 74
22 71 67 75 71 67 75 71 67 75 71 67 75
23 73 69 77 73 69 77 73 69 77 73 69 77
24 74 70 78 74 70 78 74 70 78 74 70 78
25 76 72 80 76 72 80 76 72 80 76 72 80
26 78 74 82 78 74 82 78 74 82 78 74 82
27 79 75 83 79 75 83 79 75 83 79 75 83
28 81 77 85 81 77 85 81 77 85 81 77 85
29 82 78 86 82 78 86 82 78 86 82 78 86
30 84 80 88 84 80 88 84 80 88 84 80 88
31 86 82 90 86 82 90 86 82 90 86 82 90
32 87 83 91 87 83 91 87 83 91 87 83 91
33 89 85 93 89 85 93 89 85 93 89 85 93
34 90 86 94 90 86 94 90 86 94 90 86 94
35 92 88 96 92 88 96 92 88 96 92 88 96
36 94 90 98 94 90 98 94 90 98 94 90 98
37 95 91 99 95 91 99 95 91 99 95 91 99
38 97 93 101 97 93 101 97 93 101 97 93 101
39 98 94 102 98 94 102 98 94 102 98 94 102
Table 4. Estimated WAIS-IV Full Scale IQs and 95% confidence intervals for Sum of Scaled Scored for the Best 4-
Subtest Short Forms
Sum of
scaled
scores
Reliable range = 2
Unusual range = 8
Reliable range = 2
Unusual range = 8
Reliable range = 2
Unusual range = 8
Reliable range = 2
Unusual range = 8
VC + BD + MR + DS1 VC + IN + VP + DS2 SI + IN + BD + DS3 IN + MR + VP + DS4
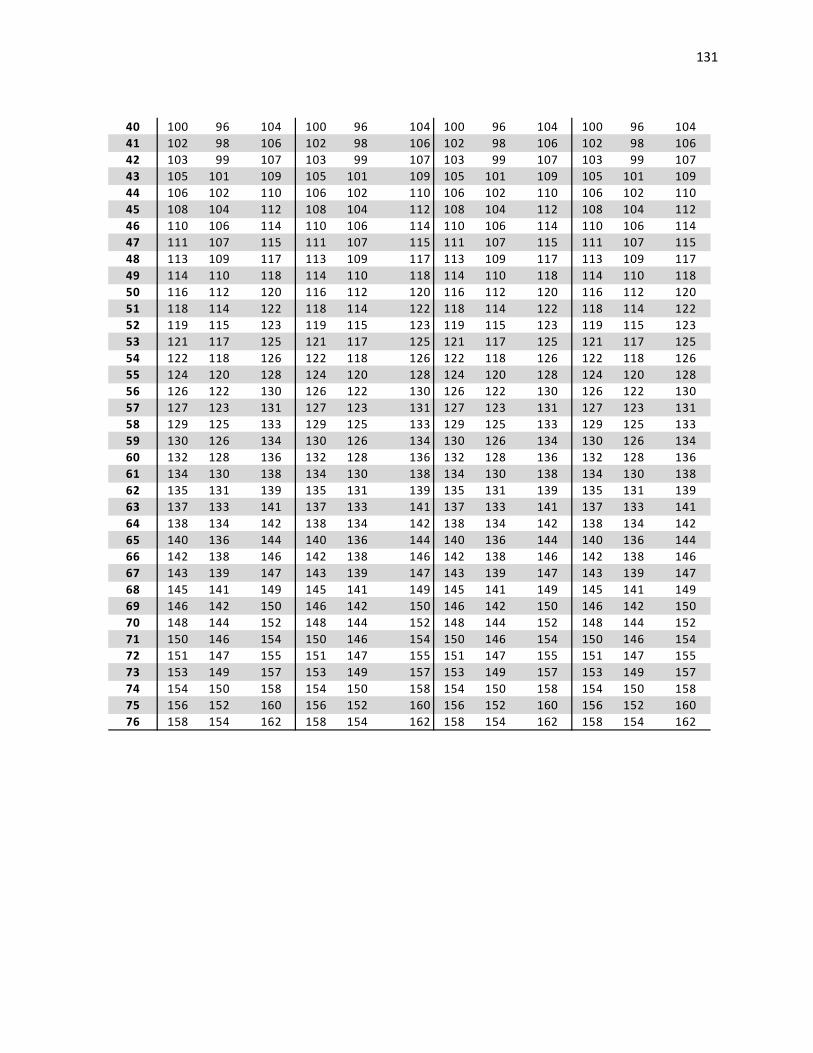
131
40 100 96 104 100 96 104 100 96 104 100 96 104
41 102 98 106 102 98 106 102 98 106 102 98 106
42 103 99 107 103 99 107 103 99 107 103 99 107
43 105 101 109 105 101 109 105 101 109 105 101 109
44 106 102 110 106 102 110 106 102 110 106 102 110
45 108 104 112 108 104 112 108 104 112 108 104 112
46 110 106 114 110 106 114 110 106 114 110 106 114
47 111 107 115 111 107 115 111 107 115 111 107 115
48 113 109 117 113 109 117 113 109 117 113 109 117
49 114 110 118 114 110 118 114 110 118 114 110 118
50 116 112 120 116 112 120 116 112 120 116 112 120
51 118 114 122 118 114 122 118 114 122 118 114 122
52 119 115 123 119 115 123 119 115 123 119 115 123
53 121 117 125 121 117 125 121 117 125 121 117 125
54 122 118 126 122 118 126 122 118 126 122 118 126
55 124 120 128 124 120 128 124 120 128 124 120 128
56 126 122 130 126 122 130 126 122 130 126 122 130
57 127 123 131 127 123 131 127 123 131 127 123 131
58 129 125 133 129 125 133 129 125 133 129 125 133
59 130 126 134 130 126 134 130 126 134 130 126 134
60 132 128 136 132 128 136 132 128 136 132 128 136
61 134 130 138 134 130 138 134 130 138 134 130 138
62 135 131 139 135 131 139 135 131 139 135 131 139
63 137 133 141 137 133 141 137 133 141 137 133 141
64 138 134 142 138 134 142 138 134 142 138 134 142
65 140 136 144 140 136 144 140 136 144 140 136 144
66 142 138 146 142 138 146 142 138 146 142 138 146
67 143 139 147 143 139 147 143 139 147 143 139 147
68 145 141 149 145 141 149 145 141 149 145 141 149
69 146 142 150 146 142 150 146 142 150 146 142 150
70 148 144 152 148 144 152 148 144 152 148 144 152
71 150 146 154 150 146 154 150 146 154 150 146 154
72 151 147 155 151 147 155 151 147 155 151 147 155
73 153 149 157 153 149 157 153 149 157 153 149 157
74 154 150 158 154 150 158 154 150 158 154 150 158
75 156 152 160 156 152 160 156 152 160 156 152 160
76 158 154 162 158 154 162 158 154 162 158 154 162
Note. VC = Vocabulary, BD = Block Design, MR = Matrix reasoning, DS = Digit span, IN = Information, VP = Visual
puzzles, PC = Picture completion, LN = Letter-number sequencing, 1-8four-subtest combination numbers C23,
C7, C19, C10, C16, C20, C12, and C5 in the derivation process, respectively (also numbered to correspond
Supplemental Table 2).

132
est.
IQ
95% CI
lower
95% CI
upper
est.
IQ
95% CI
lower
95% CI
upper
est.
IQ
95% CI
lower
95% CI
upper
est.
IQ
95% CI
lower
95% CI
upper
42 38 46 42 38 46 42 38 46 46 42 50 4
44 40 48 44 40 48 44 40 48 48 44 51 5
46 42 50 46 42 50 46 42 50 49 45 53 6
47 43 51 47 43 51 47 43 51 51 47 54 7
49 45 53 49 45 53 49 45 53 52 48 56 8
50 46 54 50 46 54 50 46 54 54 50 57 9
52 48 56 52 48 56 52 48 56 55 51 59 10
54 50 58 54 50 58 54 50 58 57 53 60 11
55 51 59 55 51 59 55 51 59 58 54 62 12
57 53 61 57 53 61 57 53 61 60 56 63 13
58 54 62 58 54 62 58 54 62 61 57 65 14
60 56 64 60 56 64 60 56 64 63 59 66 15
62 58 66 62 58 66 62 58 66 64 60 68 16
63 59 67 63 59 67 63 59 67 66 62 69 17
65 61 69 65 61 69 65 61 69 67 63 71 18
66 62 70 66 62 70 66 62 70 69 65 72 19
68 64 72 68 64 72 68 64 72 70 66 74 20
70 66 74 70 66 74 70 66 74 72 68 75 21
71 67 75 71 67 75 71 67 75 73 69 77 22
73 69 77 73 69 77 73 69 77 75 71 78 23
74 70 78 74 70 78 74 70 78 76 72 80 24
76 72 80 76 72 80 76 72 80 78 74 81 25
78 74 82 78 74 82 78 74 82 79 75 83 26
79 75 83 79 75 83 79 75 83 81 77 84 27
81 77 85 81 77 85 81 77 85 82 78 86 28
82 78 86 82 78 86 82 78 86 84 80 87 29
84 80 88 84 80 88 84 80 88 85 81 89 30
86 82 90 86 82 90 86 82 90 87 83 90 31
87 83 91 87 83 91 87 83 91 88 84 92 32
89 85 93 89 85 93 89 85 93 90 86 93 33
90 86 94 90 86 94 90 86 94 91 87 95 34
92 88 96 92 88 96 92 88 96 93 89 96 35
94 90 98 94 90 98 94 90 98 94 90 98 36
95 91 99 95 91 99 95 91 99 96 92 99 37
97 93 101 97 93 101 97 93 101 97 93 101 38
98 94 102 98 94 102 98 94 102 99 95 102 39
Table 4 cont. Estimated WAIS-IV Full Scale IQs and 95% confidence intervals for Sum of Scaled Scored for the
Best 4-Subtest Short Forms
Reliable range = 2
Unusual range = 8
Reliable range = 2
Unusual range = 8
Reliable range = 2
Unusual range = 8 Sum of
scaled
scores
VC + IN + VP + LN7 SI + IN + MR + LN8
Reliable range = 2
Unusual range = 8
SI + MR + VP + DS5 VC + MR + PC + DS6

133
100 96 104 100 96 104 100 95 105 100 95 105 40
102 98 106 102 98 106 102 98 106 102 98 105 41
103 99 107 103 99 107 103 99 107 103 99 107 42
105 101 109 105 101 109 105 101 109 105 101 108 43
106 102 110 106 102 110 106 102 110 106 102 110 44
108 104 112 108 104 112 108 104 112 108 104 111 45
110 106 114 110 106 114 110 106 114 109 105 113 46
111 107 115 111 107 115 111 107 115 111 107 114 47
113 109 117 113 109 117 113 109 117 112 108 116 48
114 110 118 114 110 118 114 110 118 114 110 117 49
116 112 120 116 112 120 116 112 120 115 111 119 50
118 114 122 118 114 122 118 114 122 117 113 120 51
119 115 123 119 115 123 119 115 123 118 114 122 52
121 117 125 121 117 125 121 117 125 120 116 123 53
122 118 126 122 118 126 122 118 126 121 117 125 54
124 120 128 124 120 128 124 120 128 123 119 126 55
126 122 130 126 122 130 126 122 130 124 120 128 56
127 123 131 127 123 131 127 123 131 126 122 129 57
129 125 133 129 125 133 129 125 133 127 123 131 58
130 126 134 130 126 134 130 126 134 129 125 132 59
132 128 136 132 128 136 132 128 136 130 126 134 60
134 130 138 134 130 138 134 130 138 132 128 135 61
135 131 139 135 131 139 135 131 139 133 129 137 62
137 133 141 137 133 141 137 133 141 135 131 138 63
138 134 142 138 134 142 138 134 142 136 132 140 64
140 136 144 140 136 144 140 136 144 138 134 141 65
142 138 146 142 138 146 142 138 146 139 135 143 66
143 139 147 143 139 147 143 139 147 141 137 144 67
145 141 149 145 141 149 145 141 149 142 138 146 68
146 142 150 146 142 150 146 142 150 144 140 147 69
148 144 152 148 144 152 148 144 152 145 141 149 70
150 146 154 150 146 154 150 146 154 147 143 150 71
151 147 155 151 147 155 151 147 155 148 144 152 72
153 149 157 153 149 157 153 149 157 150 146 153 73
154 150 158 154 150 158 154 150 158 151 147 155 74
156 152 160 156 152 160 156 152 160 153 149 156 75
158 154 162 158 154 162 158 154 162 154 150 158 76
Note. VC = Vocabulary, BD = Block Design, MR = Matrix reasoning, DS = Digit span, IN = Information, VP = Visual
puzzles, PC = Picture completion, LN = Letter-number sequencing, 1-8four-subtest combination numbers C23, C7,
C19, C10, C16, C20, C12, and C5 in the derivation process, respectively (also numbered to correspond
Supplemental Table 2).

134
Table 3.5. Estimated WAIS-IV Full Scale IQs and 95% confidence intervals for Sum of Scaled Scored for the Best 5-Subtest Short Forms
est.
IQ
95% CI
lower
95% CI
upper
est.
IQ
95% CI
lower
95% CI
upper
est.
IQ
95% CI
lower
95% CI
upper
5 42 38 45 42 38 45 42 38 45
6 43 39 47 43 39 47 43 39 47
7 44 40 48 44 40 48 44 40 48
8 45 41 49 45 41 49 45 41 49
9 47 43 51 47 43 51 47 43 51
10 48 44 52 48 44 52 48 44 52
11 49 45 53 49 45 53 49 45 53
12 51 47 55 51 47 55 51 47 55
13 52 48 56 52 48 56 52 48 56
14 53 49 57 53 49 57 53 49 57
15 55 51 58 55 51 58 55 51 58
16 56 52 60 56 52 60 56 52 60
17 57 53 61 57 53 61 57 53 61
18 58 54 62 58 54 62 58 54 62
19 60 56 64 60 56 64 60 56 64
20 61 57 65 61 57 65 61 57 65
21 62 58 66 62 58 66 62 58 66
22 64 60 68 64 60 68 64 60 68
23 65 61 69 65 61 69 65 61 69
24 66 62 70 66 62 70 66 62 70
25 68 64 71 68 64 71 68 64 71
26 69 65 73 69 65 73 69 65 73
27 70 66 74 70 66 74 70 66 74
28 71 67 75 71 67 75 71 67 75
29 73 69 77 73 69 77 73 69 77
30 74 70 78 74 70 78 74 70 78
31 75 71 79 75 71 79 75 71 79
32 77 73 81 77 73 81 77 73 81
33 78 74 82 78 74 82 78 74 82
34 79 75 83 79 75 83 79 75 83
35 81 77 84 81 77 84 81 77 84
36 82 78 86 82 78 86 82 78 86
37 83 79 87 83 79 87 83 79 87
38 84 80 88 84 80 88 84 80 88
39 86 82 90 86 82 90 86 82 90
40 87 83 91 87 83 91 87 83 91
41 88 84 92 88 84 92 88 84 92
42 90 86 94 90 86 94 90 86 94
43 91 87 95 91 87 95 91 87 95
44 92 88 96 92 88 96 92 88 96
45 94 90 97 94 90 97 94 90 97
46 95 91 99 95 91 99 95 91 99
47 96 92 100 96 92 100 96 92 100
48 97 93 101 97 93 101 97 93 101
49 99 95 103 99 95 103 99 95 103
50 100 96 104 100 96 104 100 96 104
51 101 97 105 101 97 105 101 97 105
52 103 99 107 103 99 107 103 99 107
Sum of
scaled
scores
Reliable range = 2
Unusual range = 8
Reliable range = 2
Unusual range = 9
Reliable range = 2
Unusual range = 9
VC + IN + VP + DS + SS1 VC + IN + MR + DS + SS2 VC + IN + BD + MR + LN3
Table 5. Estimated WAIS-IV Full Scale IQs and 95% confidence intervals for Sum of
Scaled Scored for the Best 5-Subtest Short Forms
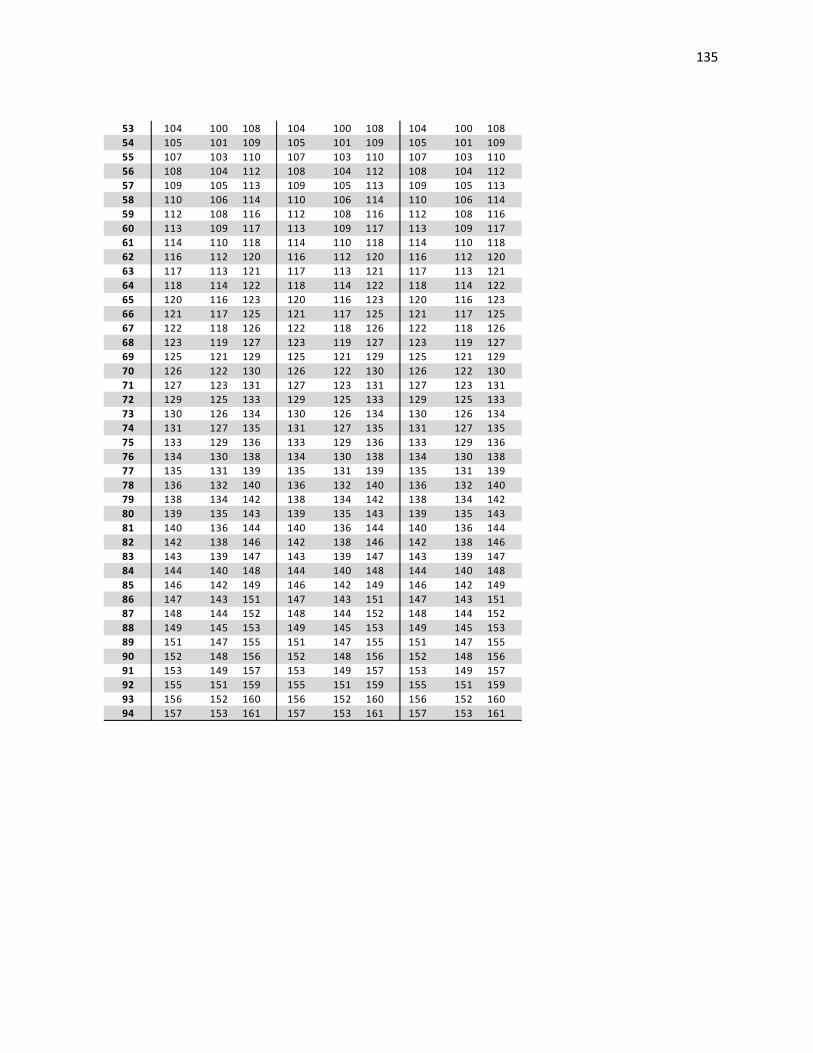
135
53 104 100 108 104 100 108 104 100 108
54 105 101 109 105 101 109 105 101 109
55 107 103 110 107 103 110 107 103 110
56 108 104 112 108 104 112 108 104 112
57 109 105 113 109 105 113 109 105 113
58 110 106 114 110 106 114 110 106 114
59 112 108 116 112 108 116 112 108 116
60 113 109 117 113 109 117 113 109 117
61 114 110 118 114 110 118 114 110 118
62 116 112 120 116 112 120 116 112 120
63 117 113 121 117 113 121 117 113 121
64 118 114 122 118 114 122 118 114 122
65 120 116 123 120 116 123 120 116 123
66 121 117 125 121 117 125 121 117 125
67 122 118 126 122 118 126 122 118 126
68 123 119 127 123 119 127 123 119 127
69 125 121 129 125 121 129 125 121 129
70 126 122 130 126 122 130 126 122 130
71 127 123 131 127 123 131 127 123 131
72 129 125 133 129 125 133 129 125 133
73 130 126 134 130 126 134 130 126 134
74 131 127 135 131 127 135 131 127 135
75 133 129 136 133 129 136 133 129 136
76 134 130 138 134 130 138 134 130 138
77 135 131 139 135 131 139 135 131 139
78 136 132 140 136 132 140 136 132 140
79 138 134 142 138 134 142 138 134 142
80 139 135 143 139 135 143 139 135 143
81 140 136 144 140 136 144 140 136 144
82 142 138 146 142 138 146 142 138 146
83 143 139 147 143 139 147 143 139 147
84 144 140 148 144 140 148 144 140 148
85 146 142 149 146 142 149 146 142 149
86 147 143 151 147 143 151 147 143 151
87 148 144 152 148 144 152 148 144 152
88 149 145 153 149 145 153 149 145 153
89 151 147 155 151 147 155 151 147 155
90 152 148 156 152 148 156 152 148 156
91 153 149 157 153 149 157 153 149 157
92 155 151 159 155 151 159 155 151 159
93 156 152 160 156 152 160 156 152 160
94 157 153 161 157 153 161 157 153 161
Note. VC = Vocabulary, BD = Block Design, MR = Matrix reasoning, DS = Digit span, IN =
Information, VP = Visual puzzles, PC = Picture completion, LN = Letter-number
sequencing, 1-6five-subtest combination numbers C21, C12, C14, C23, C4, and C8 in the
derivation process, respectively (also numbered to correspond Supplemental Table 2).

136
est.
IQ
95% CI
lower
95% CI
upper
est.
IQ
95% CI
lower
95% CI
upper
est.
IQ
95% CI
lower
95% CI
upper
42 38 45 42 38 45 42 38 45 5
43 39 47 43 39 47 43 39 47 6
44 40 48 44 40 48 44 40 48 7
45 41 49 45 41 49 45 41 49 8
47 43 51 47 43 51 47 43 51 9
48 44 52 48 44 52 48 44 52 10
49 45 53 49 45 53 49 45 53 11
51 47 55 51 47 55 51 47 55 12
52 48 56 52 48 56 52 48 56 13
53 49 57 53 49 57 53 49 57 14
55 51 58 55 51 58 55 51 58 15
56 52 60 56 52 60 56 52 60 16
57 53 61 57 53 61 57 53 61 17
58 54 62 58 54 62 58 54 62 18
60 56 64 60 56 64 60 56 64 19
61 57 65 61 57 65 61 57 65 20
62 58 66 62 58 66 62 58 66 21
64 60 68 64 60 68 64 60 68 22
65 61 69 65 61 69 65 61 69 23
66 62 70 66 62 70 66 62 70 24
68 64 71 68 64 71 68 64 71 25
69 65 73 69 65 73 69 65 73 26
70 66 74 70 66 74 70 66 74 27
71 67 75 71 67 75 71 67 75 28
73 69 77 73 69 77 73 69 77 29
74 70 78 74 70 78 74 70 78 30
75 71 79 75 71 79 75 71 79 31
77 73 81 77 73 81 77 73 81 32
78 74 82 78 74 82 78 74 82 33
79 75 83 79 75 83 79 75 83 34
81 77 84 81 77 84 81 77 84 35
82 78 86 82 78 86 82 78 86 36
83 79 87 83 79 87 83 79 87 37
84 80 88 84 80 88 84 80 88 38
86 82 90 86 82 90 86 82 90 39
87 83 91 87 83 91 87 83 91 40
88 84 92 88 84 92 88 84 92 41
90 86 94 90 86 94 90 86 94 42
91 87 95 91 87 95 91 87 95 43
92 88 96 92 88 96 92 88 96 44
94 90 97 94 90 97 94 90 97 45
95 91 99 95 91 99 95 91 99 46
96 92 100 96 92 100 96 92 100 47
97 93 101 97 93 101 97 93 101 48
99 95 103 99 95 103 99 95 103 49
100 96 104 100 96 104 100 96 104 50
101 97 105 101 97 105 101 97 105 51
103 99 107 103 99 107 103 99 107 52
Reliable range = 2
Unusual range = 8
Reliable range = 2
Unusual range = 9
Reliable range = 2
Unusual range = 9 Sum of
scaled
scores
SI + VC + MR + PC + DS4 VC + IN + MR + PC + DS5 VC + IN + MR + PC + LN6
Table 5 cont. Estimated WAIS-IV Full Scale IQs and 95% confidence intervals for Sum of
Scaled Scored for the Best 5-Subtest Short Forms

137
104 100 108 104 100 108 104 100 108 53
105 101 109 105 101 109 105 101 109 54
107 103 110 107 103 110 107 103 110 55
108 104 112 108 104 112 108 104 112 56
109 105 113 109 105 113 109 105 113 57
110 106 114 110 106 114 110 106 114 58
112 108 116 112 108 116 112 108 116 59
113 109 117 113 109 117 113 109 117 60
114 110 118 114 110 118 114 110 118 61
116 112 120 116 112 120 116 112 120 62
117 113 121 117 113 121 117 113 121 63
118 114 122 118 114 122 118 114 122 64
120 116 123 120 116 123 120 116 123 65
121 117 125 121 117 125 121 117 125 66
122 118 126 122 118 126 122 118 126 67
123 119 127 123 119 127 123 119 127 68
125 121 129 125 121 129 125 121 129 69
126 122 130 126 122 130 126 122 130 70
127 123 131 127 123 131 127 123 131 71
129 125 133 129 125 133 129 125 133 72
130 126 134 130 126 134 130 126 134 73
131 127 135 131 127 135 131 127 135 74
133 129 136 133 129 136 133 129 136 75
134 130 138 134 130 138 134 130 138 76
135 131 139 135 131 139 135 131 139 77
136 132 140 136 132 140 136 132 140 78
138 134 142 138 134 142 138 134 142 79
139 135 143 139 135 143 139 135 143 80
140 136 144 140 136 144 140 136 144 81
142 138 146 142 138 146 142 138 146 82
143 139 147 143 139 147 143 139 147 83
144 140 148 144 140 148 144 140 148 84
146 142 149 146 142 149 146 142 149 85
147 143 151 147 143 151 147 143 151 86
148 144 152 148 144 152 148 144 152 87
149 145 153 149 145 153 149 145 153 88
151 147 155 151 147 155 151 147 155 89
152 148 156 152 148 156 152 148 156 90
153 149 157 153 149 157 153 149 157 91
155 151 159 155 151 159 155 151 159 92
156 152 160 156 152 160 156 152 160 93
157 153 161 157 153 161 157 153 161 94
Note. VC = Vocabulary, BD = Block Design, MR = Matrix reasoning, DS = Digit span, IN =
Information, VP = Visual puzzles, PC = Picture completion, LN = Letter-number
sequencing, 1-6five-subtest combination numbers C21, C12, C14, C23, C4, and C8 in the
derivation process, respectively (also numbered to correspond Supplemental Table 2).

138
Figures
Figure 1.1. Mean WAIS-IV Full Scale Intelligence Quotient and Index scores when scored with each of the selected six country norms
Note. Data available in Table 5 and Supplemental Table 2. Error bars indicated standard error. Differences at the p
<.05 level. Filled bars indicate patterns of scores that do not differ from one another. Full Scale Intelligence Quotient
(FSIQ): all comparisons different except Mexico versus Spain. Verbal Comprehension Index (VCI): all comparisons
different. Performance Reasoning Index (PRI): all comparisons different except Spain versus Canada. Working Memory Index (WMI): All comparisons different except Colombia versus Chile. Processing Speed Index (PSI): All
comparisons different.

Figure 1.2. Mean WAIS-IV subtest scaled scores when scored with each of the selected six country norms
Note. Data available in Table 5 and Supplemental Table 2. Error bars indicated standard error. Differences at the p <.05 level. Filled bars indicate patterns of
scores that do not differ from one another. Similarities: all comparisons different except Colombia versus Chile. Vocabulary: all comparisons different except
Colombia versus Chile versus Mexico. Information: all comparisons different except Colombia versus Chile and Mexico versus United States. Comprehension:
all comparisons different except Colombia versus Chile and Mexico versus Spain. Block Design: all comparisons different except Colombia versus Chile. Matrix
Reasoning: all comparisons different except Colombia versus Chile and Mexico versus United States. Visual Puzzles: all comparisons different except Colombia
versus Chile. Figure Weights: all comparisons different except Colombia versus Chile, Mexico versus United States, and Spain versus Canada. Picture
Completion: all comparisons different except Colombia versus Chile. Digit Span: all comparisons different except Colombia versus Chile. Arithmetic: all
comparisons different except Colombia versus Chile. Letter-Number Sequencing: all comparisons different except Colombia versus Chile. Symbol Search: all
comparisons different except Colombia versus Chile. Coding: all comparisons different except Colombia versus Chile. Cancellation: no differences between
Colombia, Chile, United States, and Canada, and no differences between Mexico and Spain.
0
2
4
6
8
10
12
14
16
Colombia Chile Mexico Spain USA Canada
Similarities
Colombia Chile Mexico Spain USA Canada
Vocabulary
Colombia Chile Mexico Spain USA Canada
Information
Colombia Chile Mexico Spain USA Canada
Comprehension
Colombia Chile Mexico Spain USA Canada
Block Design
0
2
4
6
8
10
12
14
16
Colombia Chile Mexico Spain USA Canada
Matrix Reasoning
Colombia Chile Mexico Spain USA Canada
Visual Puzzles
Colombia Chile Mexico Spain USA Canada
Figure Weights
Colombia Chile Mexico Spain USA Canada
Picture Completion
Colombia Chile Mexico Spain USA Canada
Digit Span
0
2
4
6
8
10
12
14
16
Colombia Chile Mexico Spain USA Canada
Arithmetic
Colombia Chile Mexico Spain USA Canada
Letter-Number Sequencing
Colombia Chile Mexico Spain USA Canada
Symbol Search
Colombia Chile Mexico Spain USA Canada
Coding
Colombia Chile Mexico Spain USA Canada
Cancellation

Figure 1.3. Percentage of individuals within each clinical classification for the Full-Scale Intelligence Quotient (FSIQ) when scored with each of the selected six country norms
0%
10%
20%
30%
40%
50%
60%
< 69Very Low
70-79Borderline
80-89Low Average
90-109Average
110-119High Average
120-129Superior
> 130Very Superior
FULL SCALE INTELLIGENCE QUOTIENT (FSIQ)
Colombia Chile Mexico Spain USA Canada
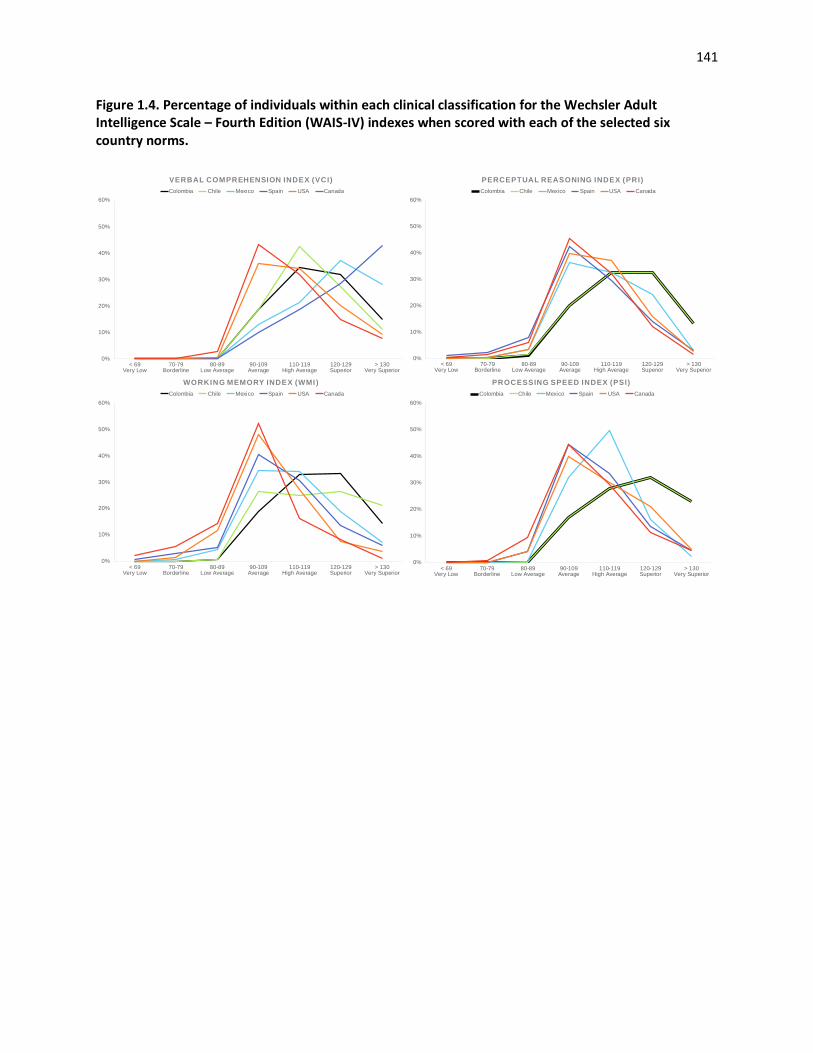
141
Figure 1.4. Percentage of individuals within each clinical classification for the Wechsler Adult Intelligence Scale – Fourth Edition (WAIS-IV) indexes when scored with each of the selected six country norms.
0%
10%
20%
30%
40%
50%
60%
< 69Very Low
70-79Borderline
80-89Low Average
90-109Average
110-119High Average
120-129Superior
> 130Very Superior
VERBAL COMPREHENSION INDEX (VCI)
Colombia Chile Mexico Spain USA Canada
0%
10%
20%
30%
40%
50%
60%
< 69Very Low
70-79Borderline
80-89Low Average
90-109Average
110-119High Average
120-129Superior
> 130Very Superior
PERCEPTUAL REASONING INDEX (PRI)
Colombia Chile Mexico Spain USA Canada
0%
10%
20%
30%
40%
50%
60%
< 69Very Low
70-79Borderline
80-89Low Average
90-109Average
110-119High Average
120-129Superior
> 130Very Superior
WORKING MEMORY INDEX (WMI)
Colombia Chile Mexico Spain USA Canada
0%
10%
20%
30%
40%
50%
60%
< 69Very Low
70-79Borderline
80-89Low Average
90-109Average
110-119High Average
120-129Superior
> 130Very Superior
PROCESSING SPEED INDEX (PSI)
Colombia Chile Mexico Spain USA Canada

142
Figure 2.1. Four-factor (Wechsler) models and their variants
Note. Four-factor models tested in their oblique (panel 1) higher-order (panel 2) and bifactor (panel 3) variants.
Black lines show the base model (Model A). Colored lines show model variants as specified in Table 2 (red lines =
Models B and C, blue + red lines = Model D and E). Due to negative factor loading of AR on VCI (blue line panel
1), these variants are not reported in higher-order and bifactor models. SI = Similarities, VC = Vocabulary, IN =
Information, CO = Comprehension, BD = Block Design, MR = Matrix Reasoning, VP = Visual Puzzles, FW =
Figure Weights, PC = Picture Completion, DS = Digit Span, AR = Arithmetic, LN = Letter-Number Sequencing, SS
= Symbol Search, CD = Coding, CA = Cancellation, VCI = Verbal Comprehension Index, PRI = Performance
Reasoning Index, WMI = Working Memory Index, PSI = Processing Speed Index, FSIQ = Full-Scale Intelligence
Quotient.
VCI
PRI
WMI
PSI
g
SI
VC
IN
CO
BD
MR
VP
FW
PC
DS
AR
LN
SS
CD
CN
FSIQ
VCI
PRI
WMI
PSI
SI
VC
IN
CO
BD
MR
VP
FW
PC
DS
AR
LN
SS
CD
CN
VCI
PRI
WMI
PSI
SI
VC
IN
CO
BD
MR
VP
FW
PC
DS
AR
LN
SS
CD
CN
Panel 1. Oblique Models
Panel 2. Higher-Order Models
Panel 3. Bifactor Models

143
Figure 2.2. Five-factor (CHC) models and their variants
Note. Five-factor models tested in their oblique (panel 1) higher-order (panel 2) and bifactor (panel 3) variants. Oblique models are detailed in Table 2. Black lines show Model A with its variant Model B (addition of blue line).
Black + red lines show Model C with its variant Model D (addition of blue line). Due to negative factor loading of
AR on VCI (blue line), these variants are not reported in higher-order and bifactor models. SI = Similarities, VC =
Vocabulary, IN = Information, CO = Comprehension, BD = Block Design, MR = Matrix Reasoning, VP = Visual
Puzzles, FW = Figure Weights, PC = Picture Completion, DS = Digit Span, AR = Arithmetic, LN = Letter-Number
Sequencing, SS = Symbol Search, CD = Coding, CA = Cancellation, Gc = crystalized intelligence, Gf = fluid
intelligence, Gv = visual processing, Gsm = short-term memory, Gs = processing speed, RQ = Quantitative
Reasoning.
Gc
Gv
Gf
Gsm
g
Gs
SI
VC
IN
CO
BD
MR
VP
FW
PC
DS
AR
LN
SS
CD
CN
RQ
g
Gc
Gv
Gf
Gsm
Gs
SI
VC
IN
CO
BD
MR
VP
FW
PC
DS
AR
LN
SS
CD
CN
RQ
Gc
Gv
Gf
Gsm
Gs
SI
VC
IN
CO
BD
MR
VP
FW
PC
DS
AR
LN
SS
CD
CN
RQ
Panel 1. Oblique Models
Panel 2. Higher-Order Models
Panel 3. Bifactor Models

144
Figure 2.3. Best fitting higher-order model
Note. Standardized estimates and fit statistics for best fitting higher-order model (five-factor model C, Table 3,
Model 17): 2 = 181.89, df = 82, root mean square error of approximation = 0.043, standardized root mean square
residual = 0.027, comparative fit index = 0.984, Tucker-Lewis index = 0.979, Akaike information criterion =
45268.05, Bayesian information criterion = 45507.10, adjusted Bayesian information criterion = 45338.82. SI =
Similarities, VC = Vocabulary, IN = Information, CO = Comprehension, BD = Block Design, MR = Matrix
Reasoning, VP = Visual Puzzles, FW = Figure Weights, PC = Picture Completion, DS = Digit Span, AR =
Arithmetic, LN = Letter-Number Sequencing, SS = Symbol Search, CD = Coding, CA = Cancellation, Gc =
crystalized intelligence, Gf = fluid intelligence, Gv = visual processing, Gsm = short-term memory, Gs = processing
speed, RQ = Quantitative Reasoning.
Gc
Gv
Gf
Gsm
g
Gs
SI
VC
IN
CO
BD
MR
VP
FW
PC
DS
AR
LN
SS
CD
CN
RQ
.875
.875
1.00
.830
.757
.802
.871
.832
.808
.802
.193
.767
.144
.676
.586
.931 .692
.566
.874.261
.574
.797
.824
.574

145
Figure 2.4. Best fitting bifactor model
Note. Standardized estimates and fit statistics for best fitting bifactor model (five-factor model C, Table 3, Model
26): 2= 87.90, df = 62, root mean square error of approximation = 0.025, standardized root mean square residual =
0.016, comparative fit index = 0.996, Tucker-Lewis index = 0.993, Akaike information criterion = 45214.06,
Bayesian information criterion = 45543.31, adjusted Bayesian information criterion = 45311.53. SI = Similarities,
VC = Vocabulary, IN = Information, CO = Comprehension, BD = Block Design, MR = Matrix Reasoning, VP =
Visual Puzzles, FW = Figure Weights, PC = Picture Completion, DS = Digit Span, AR = Arithmetic, LN = Letter-
Number Sequencing, SS = Symbol Search, CD = Coding, CA = Cancellation, Gc = crystalized intelligence, Gf =
fluid intelligence, Gv = visual processing, Gsm = short-term memory, Gs = processing speed, RQ = Quantitative
Reasoning.
Gc
Gv
Gf
Gsm
Gs
SI
VC
IN
CO
BD
MR
VP
FW
PC
DS
AR
LN
SS
CD
CN
RQ
.063
.061
-.221
.178
.554
.068
.557
.080
.317
.283
.854
.365
.423.630
.131
.546
.697
.531
.438
g
.379
.584
.490
.633
.628
.629
.582
.671
.868
.801
.840
.820
.593
.681
.555

Figure 3.1. Flow Chart of the Chilean WAIS-IV Derivation Process
3-Subtest Short Forms
(455 combinations)Mean rss = 0.916Mean r = 0.874
2-Subtest Short Forms
(105 combinations)Mean rss = 0.888Mean r = 0.819
4-Subtest Short Forms
(1,365 combinations)Mean rss = 0.935Mean r = 0.902
5-Subtest Short Forms
(,3003 combinations)Mean rss = 0.917Mean r = 0.921
Narrow to combinations
with best reliability and validity coefficients
New n = 15
Eliminate combinations
with non-robust indicators of FSIQ/g
New n = 15
Eliminate combinations
with non-robust indicators of FSIQ/g
New n = 89
Eliminate combinations
with non-robust indicators of FSIQ/g
New n = 256
Eliminate combinations
with non-robust indicators of FSIQ/g
New n = 316
Narrow to combinations
with best reliability and validity coefficients
New n = 25
Narrow to combinations
with best reliability and validity coefficients
New n = 25
Narrow to combinations
with best reliability and validity coefficients
New n = 25
Eliminate combinations
poorly preserving contentNew n = 26
Eliminate combinations
poorly preserving contentNew n = 264
Eliminate combinations
poorly preserving contentNew n = 1,039
Eliminate combinations
poorly preserving contentNew n = 1,660
Factor structure not testable
n = 15
Factor structure not testable
New n = 24
Eliminate combinations without factor structure consistency
New n = 13
Eliminate combinations without factor structure consistency
New n = 6
Eliminate combinations
poorly preserving clinical classification
Final n = 6
Eliminate combinations
poorly preserving clinical classification
Final n = 8
Eliminate combinations
poorly preserving clinical classification
Final n = 7
Eliminate combinations
poorly preserving clinical classification
Final n = 7
Eliminate combinations with poor reliability (rss)
or validity (r)New n = 35
Eliminate combinations with poor reliability (rss)
or validity (r)New n = 365
Eliminate combinations with poor reliability (rss)
or validity (r)New n = 1,362
Eliminate combinations with poor reliability (rss)
or validity (r)New n = ,2711
AllShort Forms
(4,928 combinations)Mean rss = 0.922Mean r = 0.909
Eliminate combinations
with non-robust indicators of FSIQ/g
New n = 676
Narrow to combinations
with best reliability and validity coefficients
New n = 90
Eliminate combinations
poorly preserving contentNew n = 2,989
Eliminate combinations
poorly preserving clinical classificationFinal n = 28
Eliminate combinations with poor reliability (rss)
or validity (r)New n = 4,473
Eliminate combinations without factor structure consistency
New n = 58

147
Supplementary Materials
Supplemental Table 1.1. Omnibus testing for differences when applying Colombian, Chilean, Mexican, Spanish, American, or Canadian WAIS-IV norms to the present sample of 305 Colombian executives
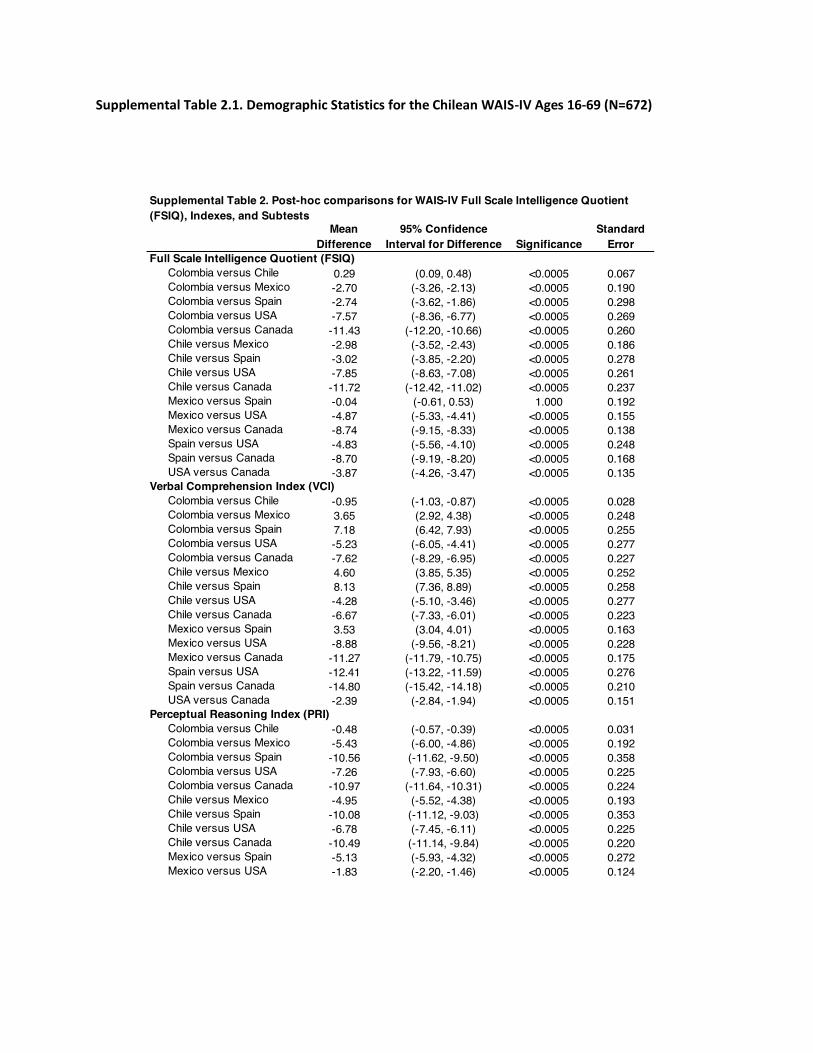
Supplemental Table 2.1. Demographic Statistics for the Chilean WAIS-IV Ages 16-69 (N=672)
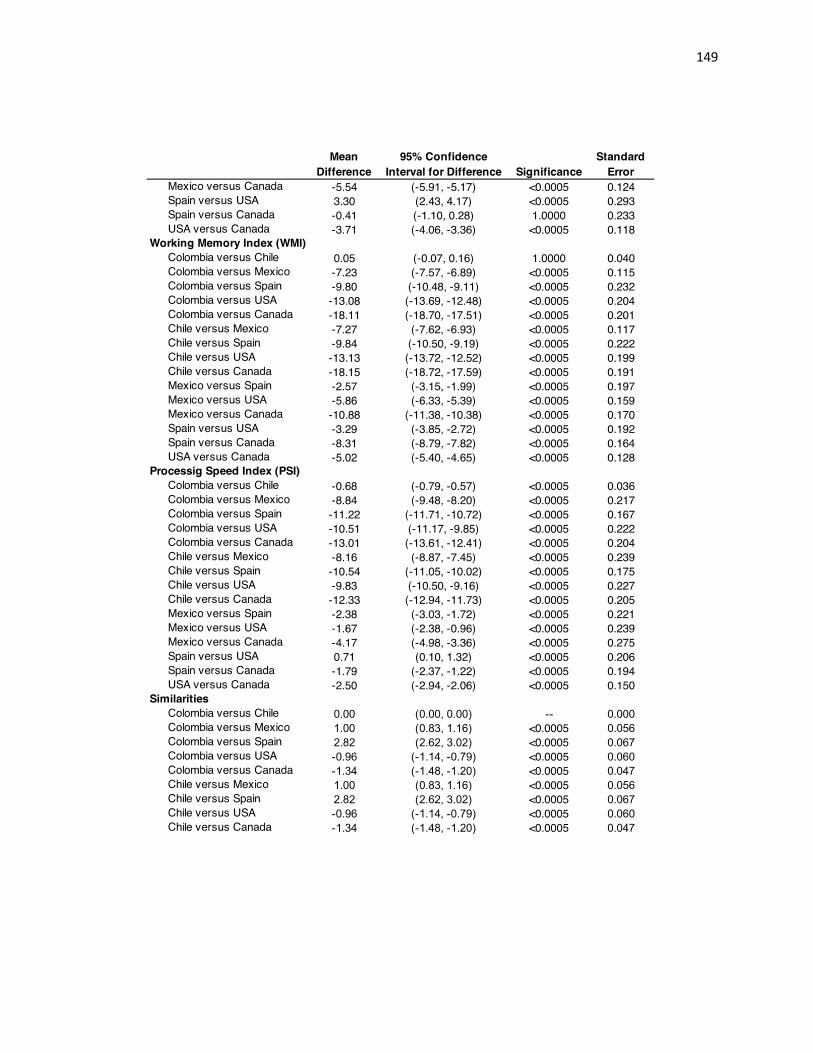
149
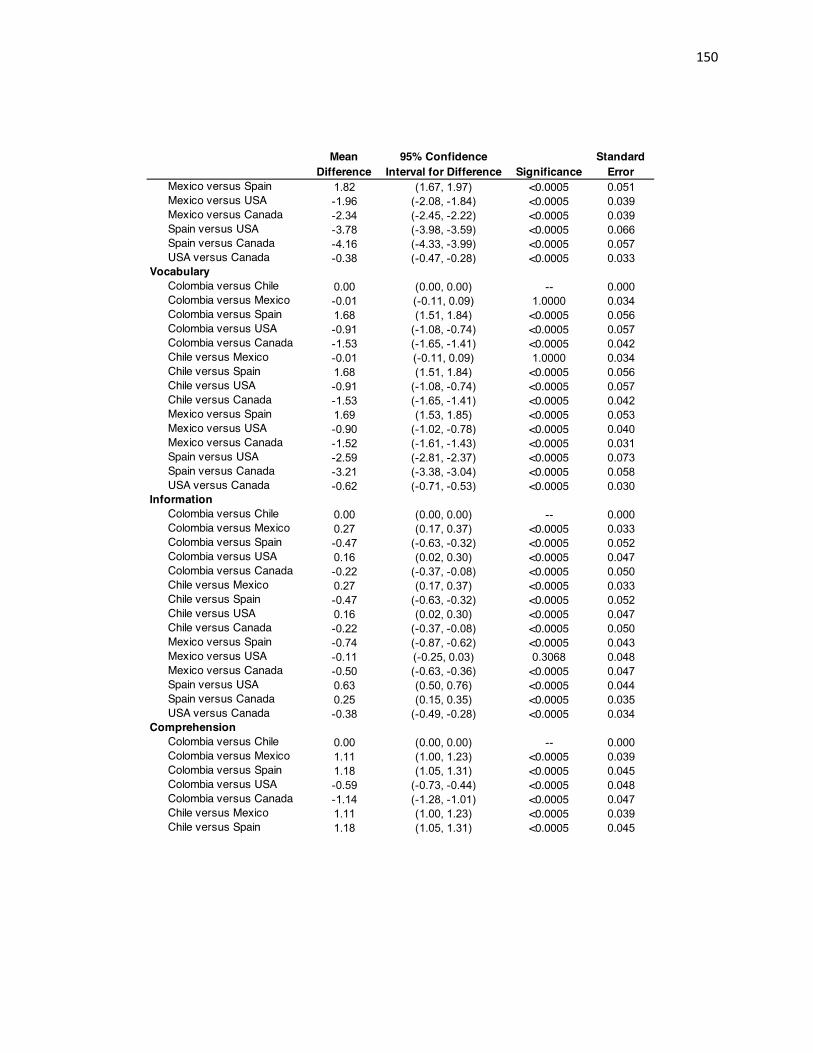
150

151

152

153

154

155
Supplemental Table 2.1. Demographic Statistics for the Chilean WAIS-IV Ages 16-69 (N=672)
M SD
Age 36.93 17.12
Age Band N %
16-17 76 11.3
18-19 75 11.2
20-24 78 11.6
25-29 71 10.6
30-34 78 11.6
35-44 74 11.0
45-54 73 10.9
55-64 81 12.1
65-69 66 9.8
Sex
Men 333 49.6
Women 339 50.4
Education Level
Level 1 215 32.0
Level 2 239 35.6
Level 3 218 32.4
Region
Santiago 301 44.8
Arica 56 8.3
Iquique 52 7.7
Antofagasta 51 7.6
Concepción 103 15.3
Temuco 52 7.7
Punta Arenas 57 7.8
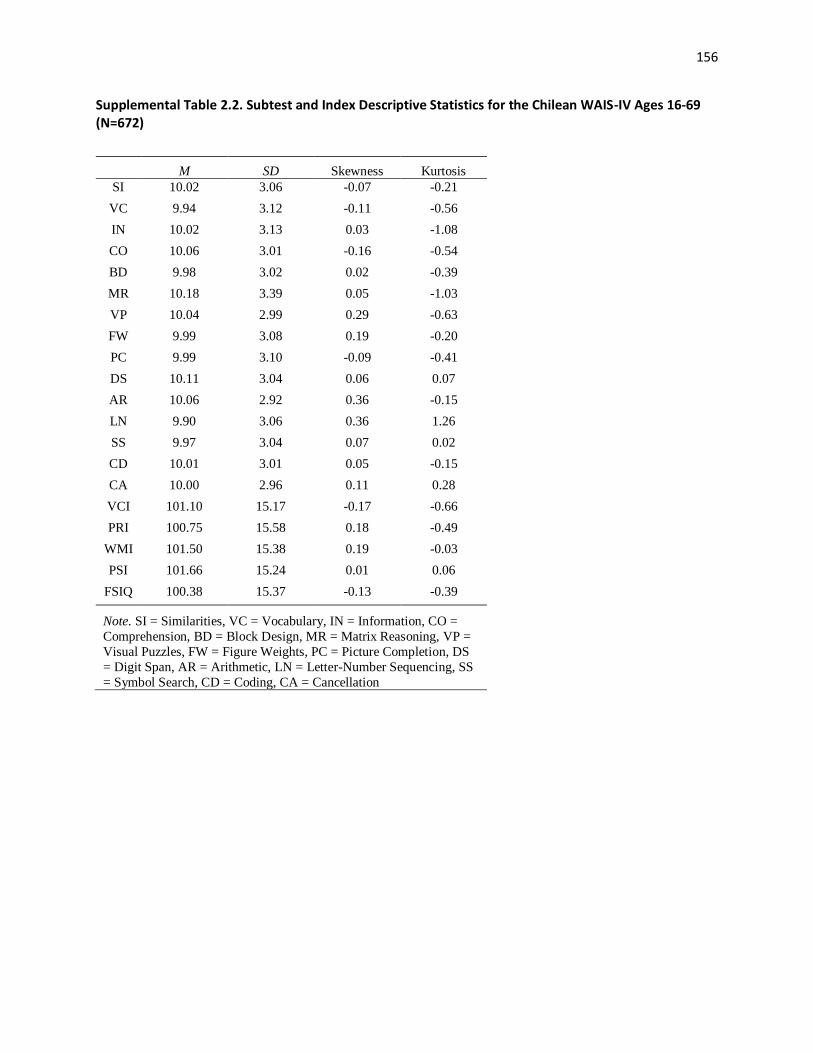
156
Supplemental Table 2.2. Subtest and Index Descriptive Statistics for the Chilean WAIS-IV Ages 16-69 (N=672)
M SD Skewness Kurtosis
SI 10.02 3.06 -0.07 -0.21
VC 9.94 3.12 -0.11 -0.56
IN 10.02 3.13 0.03 -1.08
CO 10.06 3.01 -0.16 -0.54
BD 9.98 3.02 0.02 -0.39
MR 10.18 3.39 0.05 -1.03
VP 10.04 2.99 0.29 -0.63
FW 9.99 3.08 0.19 -0.20
PC 9.99 3.10 -0.09 -0.41
DS 10.11 3.04 0.06 0.07
AR 10.06 2.92 0.36 -0.15
LN 9.90 3.06 0.36 1.26
SS 9.97 3.04 0.07 0.02
CD 10.01 3.01 0.05 -0.15
CA 10.00 2.96 0.11 0.28
VCI 101.10 15.17 -0.17 -0.66
PRI 100.75 15.58 0.18 -0.49
WMI 101.50 15.38 0.19 -0.03
PSI 101.66 15.24 0.01 0.06
FSIQ 100.38 15.37 -0.13 -0.39
Note. SI = Similarities, VC = Vocabulary, IN = Information, CO =
Comprehension, BD = Block Design, MR = Matrix Reasoning, VP =
Visual Puzzles, FW = Figure Weights, PC = Picture Completion, DS
= Digit Span, AR = Arithmetic, LN = Letter-Number Sequencing, SS
= Symbol Search, CD = Coding, CA = Cancellation
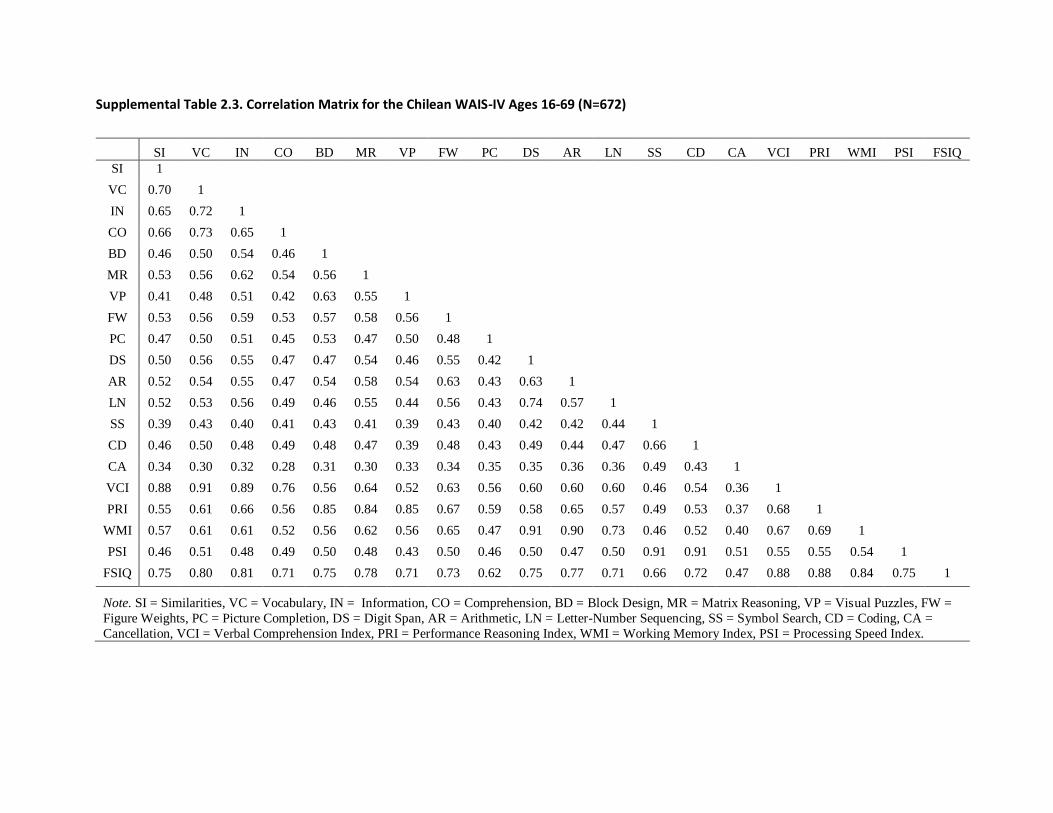
Supplemental Table 2.3. Correlation Matrix for the Chilean WAIS-IV Ages 16-69 (N=672)
SI VC IN CO BD MR VP FW PC DS AR LN SS CD CA VCI PRI WMI PSI FSIQ
SI 1
VC 0.70 1
IN 0.65 0.72 1
CO 0.66 0.73 0.65 1
BD 0.46 0.50 0.54 0.46 1
MR 0.53 0.56 0.62 0.54 0.56 1
VP 0.41 0.48 0.51 0.42 0.63 0.55 1
FW 0.53 0.56 0.59 0.53 0.57 0.58 0.56 1
PC 0.47 0.50 0.51 0.45 0.53 0.47 0.50 0.48 1
DS 0.50 0.56 0.55 0.47 0.47 0.54 0.46 0.55 0.42 1
AR 0.52 0.54 0.55 0.47 0.54 0.58 0.54 0.63 0.43 0.63 1
LN 0.52 0.53 0.56 0.49 0.46 0.55 0.44 0.56 0.43 0.74 0.57 1
SS 0.39 0.43 0.40 0.41 0.43 0.41 0.39 0.43 0.40 0.42 0.42 0.44 1
CD 0.46 0.50 0.48 0.49 0.48 0.47 0.39 0.48 0.43 0.49 0.44 0.47 0.66 1
CA 0.34 0.30 0.32 0.28 0.31 0.30 0.33 0.34 0.35 0.35 0.36 0.36 0.49 0.43 1
VCI 0.88 0.91 0.89 0.76 0.56 0.64 0.52 0.63 0.56 0.60 0.60 0.60 0.46 0.54 0.36 1
PRI 0.55 0.61 0.66 0.56 0.85 0.84 0.85 0.67 0.59 0.58 0.65 0.57 0.49 0.53 0.37 0.68 1
WMI 0.57 0.61 0.61 0.52 0.56 0.62 0.56 0.65 0.47 0.91 0.90 0.73 0.46 0.52 0.40 0.67 0.69 1
PSI 0.46 0.51 0.48 0.49 0.50 0.48 0.43 0.50 0.46 0.50 0.47 0.50 0.91 0.91 0.51 0.55 0.55 0.54 1
FSIQ 0.75 0.80 0.81 0.71 0.75 0.78 0.71 0.73 0.62 0.75 0.77 0.71 0.66 0.72 0.47 0.88 0.88 0.84 0.75 1
Note. SI = Similarities, VC = Vocabulary, IN = Information, CO = Comprehension, BD = Block Design, MR = Matrix Reasoning, VP = Visual Puzzles, FW =
Figure Weights, PC = Picture Completion, DS = Digit Span, AR = Arithmetic, LN = Letter-Number Sequencing, SS = Symbol Search, CD = Coding, CA =
Cancellation, VCI = Verbal Comprehension Index, PRI = Performance Reasoning Index, WMI = Working Memory Index, PSI = Processing Speed Index.

158
Supplemental Table 2.4. Factor loadings for indicators of FSIQ/g across all best Wechsler and CHC factor models
4-Factor
Higher-Order
4-Factor Higher-
Order (SL Trans.)
4-Factor
Bifactor
Benson
5-Factor
Higher-Order
Benson
5-Factor
Higher-Order
(SL Trans.)
Benson
5-Factor
Bifactor
Weiss
5-Factor
Higher-Order
Weiss 5-Factor
Higher-Order (SL
Trans.)
Weiss 5-Factor
Bifactor
Mean (4 & 5-
Factor Models)
Mean (5-
Factor Models
Only)
SI 0.802 0.701 0.725 0.802 0.695 0.795 0.802 0.702 0.801 0.762 0.766 VCI Gc
VC 0.872 0.762 0.767 0.871 0.754 0.862 0.871 0.762 0.868 0.828 0.831 VCI Gc
IN 0.831 0.726 0.797 0.832 0.721 0.853 0.832 0.728 0.840 0.795 0.801 VCI Gc
CO 0.808 0.706 0.710 0.808 0.700 0.807 0.808 0.707 0.820 0.770 0.775 VCI GC
BD 0.769 0.720 0.659 0.802 0.716 0.604 0.802 0.702 0.593 0.713 0.703 PRI Gv
MR 0.766 0.717 0.750 0.768 0.764 0.689 0.586 0.586 0.681 0.695 0.679 PRI Gf
VP 0.739 0.692 0.617 0.766 0.684 0.567 0.767 0.671 0.555 0.680 0.668 PRI Gv
FW 0.403 0.377 0.741 0.786 0.782 0.678 0.144 0.126 0.671 0.496 0.531 PRI/WMI Gf
PC 0.665 0.622 0.620 0.677 0.665 0.588 0.676 0.592 0.582 0.633 0.630 PRI Gv
DS 0.761 0.712 0.706 0.874 0.719 0.636 0.874 0.725 0.629 0.741 0.743 WMI Gsm
AR 0.800 0.749 0.699 0.400 0.363 0.636 0.261 0.217 0.628 0.507 0.417 WMI Gf/Gsm
LN 0.739 0.692 0.714 0.849 0.699 0.640 0.484 0.402 0.633 0.642 0.618 WMI Gsm
SS 0.797 0.608 0.552 0.798 0.599 0.487 0.874 0.662 0.490 0.664 0.652 PSI Gs
CD 0.823 0.628 0.636 0.823 0.618 0.582 0.261 0.198 0.584 0.565 0.511 PSI Gs
CA 0.576 0.439 0.440 0.575 0.432 0.380 0.484 0.366 0.379 0.454 0.436 PSI Gs
First Order/ Index
Level Factor
Note. SL Trans. = Schmid-Leiman transformation (Schmid-Leiman, 1957; Brown, 2015). SI = Similarities, VC = Vocabulary, IN = Information, CO = Comprehension, BD = Block Design, MR = Matrix Reasoning, VP =
Visual Puzzles, FW = Figure Weights, PC = Picture Completion, DS = Digit Span, AR = Arithmetic, LN = Letter-Number Sequencing, SS = Symbol Search, CD = Coding, CA = Cancellation, VCI = Verbal Comprehension
Index, PRI = Performance Reasoning Index, WMI = Working Memory Index, PSI = Processing Speed Index, Gc = crystalized intelligence, Gf = fluid intelligence, Gv = visual processing, Gsm = short-term memory, Gs
= processing speed. Benson = Benson et al., 2010; Weiss = Weiss et al., 2013. Factor loadings below 0.600. are bolded in red. Factor loading calculations from Duggan (Dissertation Paper 2).
Supplemental Table 1. Factor loadings for indicators of FSIQ/g across best Wechsler and CHC factor models

Supplemental Table 3.1. Mean factor loadings for indicators of FSIQ/g across best Wechsler and CHC factor models
Subtest
Mean Factor
Loading
4-Factor
Index Subtest
Mean Factor
Loading
5-Factor
Index
VC* 0.828 VCI VC* 0.828 Gc
IN* 0.795 VCI IN* 0.795 Gc
CO 0.770 VCI CO 0.770 Gc
SI 0.762 VCI SI 0.762 Gc
BD* 0.713 PRI BD* 0.713 Gv
MR* 0.695 PRI VP* 0.680 Gv
VP* 0.680 PRI PC 0.633 Gv
PC 0.633 PRI MR* 0.695 Gf
FW 0.496 PRI/WMI AR^ 0.507 Gf/Gsm
DS* 0.741 WMI FW 0.496 Gf
LN* 0.642 WMI DS* 0.741 Gsm
AR 0.507 WMI LN* 0.642 Gsm
SS* 0.664 PSI SS* 0.664 Gs
CD^ 0.565 PSI CD^ 0.565 Gs
CA 0.454 PSI CA 0.454 Gs
Note. FSIQ = Full-scale Intelligence Quotient. SI = Similarities, VC = Vocabulary, IN
= Information, CO = Comprehension, BD = Block Design, MR = Matrix Reasoning,
VP = Visual Puzzles, FW = Figure Weights, PC = Picture Completion, DS = Digit
Span, AR = Arithmetic, LN = Letter-Number Sequencing, SS = Symbol Search, CD =
Coding, CA = Cancellation, VCI = Verbal Comprehension Index, PRI = Performance
Reasoning Index, WMI = Working Memory Index, PSI = Processing Speed Index, Gc
= crystalized intelligence, Gf = fluid intelligence, Gv = visual processing, Gsm = short-
term memory, Gs = processing speed. Factor loadings below 0.600. are bolded in red.
Mean factor loading calculations from Duggan & Garcia-Barrera, 2019) and
Supplemental Table 1.

Supplemental Table 3.2. Two-, three-, four-, and five-subtest Chilean WAIS-IV short forms with the highest mean reliability and validity coefficients
Comb. r ss r r ss r r ss r r ss r Comb.
C1 IN MR 0.941 0.857 VC MR DS 0.948 0.898 VC IN MR DS 0.964 0.918 VC IN MR DS LN 0.949 0.924 C1
C2 IN DS 0.938 0.864 IN MR DS 0.952 0.893 SI IN MR DS 0.963 0.918 VC IN MR VP DS 0.947 0.936 C2
C3 VC MR 0.934 0.860 VC MR LN 0.941 0.903 VC IN MR LN 0.960 0.917 VC IN MR VP LN 0.944 0.934 C3
C4 VC DS 0.932 0.859 VC MR VP 0.940 0.902 VC IN MR VP 0.960 0.913 VC IN MR PC DS 0.944 0.933 C4
C5 IN VP 0.925 0.849 IN MR LN 0.946 0.894 SI IN MR LN 0.960 0.915 VC IN VP DS LN 0.943 0.930 C5
C6 IN LN 0.925 0.865 IN MR VP 0.945 0.892 SI IN MR VP 0.959 0.913 IN CO MR VP DS 0.941 0.934 C6
C7 MR DS 0.923 0.848 CO MR DS 0.930 0.900 VC IN VP DS 0.958 0.924 VC IN BD MR DS 0.941 0.935 C7
C8 VC LN 0.918 0.863 SI MR DS 0.930 0.896 IN CO MR DS 0.957 0.916 VC IN MR PC LN 0.940 0.931 C8
C9 VC VP 0.918 0.848 IN VP DS 0.945 0.880 SI IN VP DS 0.957 0.927 VC CO MR VP DS 0.939 0.932 C9
C10 CO MR 0.915 0.836 VC VP DS 0.941 0.883 IN MR VP DS 0.956 0.918 VC IN VP PC DS 0.939 0.933 C10
C11 IN PC 0.914 0.832 VC BD MR 0.930 0.893 VC IN PC DS 0.955 0.914 IN CO MR VP LN 0.937 0.931 C11
C12 MR LN 0.912 0.838 CO MR LN 0.925 0.896 VC IN VP LN 0.954 0.924 VC IN MR DS SS 0.937 0.939 C12
C13 VP DS 0.907 0.829 VC MR PC 0.935 0.887 SI IN PC DS 0.954 0.915 IN CO MR PC DS 0.937 0.932 C13
C14 VC PC 0.906 0.830 VC VP LN 0.934 0.888 SI IN VP LN 0.953 0.924 VC IN BD MR LN 0.937 0.935 C14
C15 SI MR 0.901 0.842 VC BD DS 0.929 0.892 VC MR VP DS 0.953 0.922 SI IN MR VP DS 0.937 0.935 C15
C16 IN BD DS 0.933 0.887 SI MR VP DS 0.952 0.921 VC IN BD VP DS 0.936 0.933 C16
C17 IN DS SS 0.925 0.895 VC IN BD DS 0.952 0.922 SI VC MR VP DS 0.935 0.934 C17
C18 IN VP LN 0.938 0.881 IN CO VP DS 0.951 0.924 IN CO BD MR DS 0.934 0.933 C18
C19 SI MR VP 0.920 0.899 SI IN BD DS 0.951 0.924 VC IN MR LN SS 0.933 0.936 C19
C20 IN MR SS 0.927 0.891 VC MR PC DS 0.949 0.921 VC IN MR VP SS 0.933 0.935 C20
C21 VC BD LN 0.921 0.896 IN CO VP LN 0.947 0.921 VC IN VP DS SS 0.931 0.942 C21
C22 IN MR PC 0.940 0.877 SI IN DS SS 0.947 0.922 IN CO MR DS SS 0.930 0.937 C22
C23 IN BD MR 0.936 0.880 VC BD MR DS 0.946 0.923 SI VC MR PC DS 0.930 0.939 C23
C24 SI MR LN 0.925 0.890 IN MR DS SS 0.944 0.924 IN MR VP DS SS 0.929 0.938 C24
C25 IN BD LN 0.927 0.888 CO MR PC DS 0.940 0.930 VC IN VP LN SS 0.927 0.940 C25
Note. SI = Similarities, VC = Vocabulary, IN = Information, CO = Comprehension, BD = Block Design, MR = Matrix Reasoning, VP = Visual Puzzles, FW = Figure Weights, PC =
Picture Completion, DS = Digit Span, AR = Arithmetic, LN = Letter-Number Sequencing, SS = Symbol Search, CD = Coding, CA = Cancellation. Comb. = combination
number.
Supplemental Table 2. Two-, three-, four-, and five-subtest Chilean WAIS-IV short forms with the highest mean reliability and validity coefficients
Two subtests Three subtests Four subtests Five subtests
Short form Short form Short form Short form

Supplemental Table 3.3. Model Fit and Factor Loadings of Select Two-, Three-, Four-, and Five-Subtest Short Forms
Comb. T1 T2 T3 T4 T5 c2
df CFI TLI RMSEA lT1 lT2 lT3 lT4 lT5 mean l exclude?
C1 IN MR - - - - * - - - - - - - - - -
C2 IN DS - - - - * - - - - - - - - - -
C3 VC MR - - - - * - - - - - - - - - -
C4 VC DS - - - - * - - - - - - - - - -
C5 IN VP - - - - * - - - - - - - - - -
C6 IN LN - - - - * - - - - - - - - - -
C7 MR DS - - - - * - - - - - - - - - -
C8 VC LN - - - - * - - - - - - - - - -
C9 VC VP - - - - * - - - - - - - - - -
C10 CO MR - - - - * - - - - - - - - - -
C11 IN PC - - - - * - - - - - - - - - -
C12 MR LN - - - - * - - - - - - - - - -
C13 VP DS - - - - * - - - - - - - - - -
C14 VC PC - - - - * - - - - - - - - - -
C15 SI MR - - - - * - - - - - - - - - -
C1 VC MR DS - - - * - - - 0.761 0.741 0.732 - - 0.745
C2 IN MR DS - - - * - - - 0.789 0.782 0.693 - - 0.755
C3 VC MR LN - - - * - - - 0.736 0.766 0.718 - - 0.740
C4 VC MR VP - - - * - - - 0.705 0.800 0.685 - - 0.730
C5 IN MR LN - - - * - - - 0.792 0.780 0.706 - - 0.759
C6 IN MR VP - - - * - - - 0.759 0.813 0.673 - - 0.748
C7 CO MR DS - - - * - - - 0.789 0.782 0.693 - - 0.755
C8 SI MR DS - - - * - - - 0.704 0.758 0.715 - - 0.726
C9 IN VP DS - - - * - - - 0.779 0.656 0.701 - - 0.712
C10 VC VP DS - - - * - - - 0.765 0.631 0.729 - - 0.708
C11 VC BD MR - - - * - - - 0.709 0.700 0.796 - - 0.735
C12 CO MR LN - - - * - - - 0.792 0.780 0.706 - - 0.759
C13 VC MR PC - - - * - - - 0.772 0.730 0.644 - - 0.715
C14 VC VP LN - - - * - - - 0.765 0.631 0.729 - - 0.708
C15 VC BD DS - - - * - - - 0.763 0.650 0.730 - - 0.714
C16 IN BD DS - - - * - - - 0.791 0.687 0.691 - - 0.723
C17 IN DS SS - - - * - - - 0.722 0.757 0.557 - - 0.679
C18 IN VP LN - - - * - - - 0.805 0.635 0.695 - - 0.712
C19 SI MR VP - - - * - - - 0.629 0.848 0.645 - - 0.707
C20 IN MR SS - - - * - - - 0.777 0.794 0.517 - - 0.696 Y
C21 VC BD LN - - - * - - - 0.759 0.653 0.696 - - 0.703
C22 IN MR PC - - - * - - - 0.818 0.754 0.623 - - 0.732
C23 IN BD MR - - - * - - - 0.776 0.700 0.795 - - 0.757
C24 SI MR LN - - - * - - - 0.713 0.749 0.735 - - 0.732
C25 IN BD LN - - - * - - - 0.817 0.665 0.684 - - 0.722
C1 VC IN MR DS - 17.8 2 0.987 0.960 0.108 0.824 0.855 0.720 0.673 - 0.768 Y
C2 SI IN MR DS - 10.9 2 0.992 0.975 0.081 0.757 0.840 0.738 0.675 - 0.753 Y
C3 VC IN MR LN - 17.9 2 0.986 0.959 0.109 0.812 0.865 0.722 0.669 - 0.767 Y
C4 VC IN MR VP - 30.2 2 0.975 0.925 0.145 0.810 0.963 0.728 0.624 - 0.781 Y
C5 SI IN MR LN - 10.5 2 0.992 0.976 0.079 0.760 0.838 0.738 0.693 - 0.757
C6 SI IN MR VP - 30.2 2 0.972 0.917 0.145 0.738 0.847 0.749 0.623 - 0.739 Y
C7 VC IN VP DS - 10.1 2 0.992 0.976 0.078 0.838 0.847 0.604 0.666 - 0.739
C8 IN CO MR DS - 11.3 2 0.991 0.973 0.083 0.842 0.750 0.746 0.664 - 0.751 Y
C9 SI IN VP DS - 14.9 2 0.986 0.957 0.098 0.753 0.851 0.599 0.666 - 0.717
C10 IN MR VP DS - 1.4 2 1.000 1.002 0.000 0.775 0.798 0.672 0.690 - 0.734
Supplemental Table 3. Model Fit and Factor Loadings of Select Two-, Three-, Four-, and Five-Subtest Short Forms
Two-subtests
Three-subtests
Four-subtests

162
C11 VC IN PC DS - 1.7 2 1.000 1.001 0.000 0.846 0.845 0.601 0.657 - 0.737
C12 VC IN VP LN - 5.7 2 0.996 0.989 0.053 0.822 0.865 0.600 0.654 - 0.735
C13 SI IN PC DS - 1.7 2 1.000 1.001 0.000 0.846 0.845 0.601 0.657 - 0.737
C14 SI IN VP LN - 0.6 2 1.000 1.005 0.000 0.777 0.837 0.614 0.655 - 0.721
C15 VC MR VP DS - 6.8 2 0.995 0.984 0.060 0.742 0.775 0.671 0.714 - 0.726
C16 SI MR VP DS - 8.1 2 0.992 0.977 0.067 0.671 0.798 0.659 0.702 - 0.708
C17 VC IN BD DS - 12.0 2 0.991 0.972 0.086 0.831 0.854 0.631 0.666 - 0.746 Y
C18 IN CO VP DS - 11.7 2 0.989 0.967 0.085 0.857 0.744 0.606 0.653 - 0.715 Y
C19 SI IN BD DS - 9.1 2 0.992 0.977 0.073 0.758 0.847 0.642 0.665 - 0.728
C20 VC MR PC DS - 3.6 2 0.998 0.994 0.035 0.775 0.744 0.623 0.713 - 0.714
C21 IN CO VP LN - 6.3 2 0.995 0.986 0.056 0.861 0.745 0.599 0.660 - 0.716
C22 SI IN DS SS - 13.3 2 0.986 0.959 0.092 0.777 0.825 0.671 0.516 - 0.697 Y
C23 VC BD MR DS - 6.1 2 0.995 0.986 0.055 0.742 0.687 0.773 0.715 - 0.729 Y
C24 IN MR DS SS - 4.7 2 0.997 0.990 0.045 0.778 0.779 0.709 0.540 - 0.702 Y
C25 CO MR PC DS - 1.4 2 1.000 1.002 0.000 0.704 0.778 0.616 0.685 - 0.696 Y
C1 VC IN MR DS LN 188.6 5 0.897 0.794 0.234 0.775 0.798 0.731 0.774 0.772 0.770 Y
C2 VC IN MR VP DS 41.0 5 0.976 0.952 0.104 0.811 0.842 0.744 0.637 0.684 0.744 Y
C3 VC IN MR VP LN 39.6 5 0.977 0.953 0.101 0.803 0.850 0.747 0.633 0.678 0.742 Y
C4 VC IN MR PC DS 20.1 5 0.990 0.979 0.067 0.822 0.850 0.727 0.611 0.676 0.737
C5 VC IN VP DS LN 28.2 5 0.981 0.962 0.083 0.837 0.833 0.616 0.680 0.530 0.699 Y
C6 IN CO MR VP DS 11.9 5 0.995 0.989 0.045 0.839 0.748 0.750 0.613 0.667 0.723
C7 VC IN BD MR DS 38.6 5 0.978 0.956 0.100 0.808 0.846 0.661 0.743 0.684 0.748 Y
C8 VC IN MR PC LN 21.2 5 0.989 0.978 0.069 0.812 0.857 0.730 0.615 0.675 0.738
C9 VC CO MR VP DS 89.0 5 0.941 0.882 0.158 0.850 0.793 0.716 0.608 0.667 0.727 Y
C10 VC IN VP PC DS 34.6 5 0.978 0.955 0.094 0.829 0.841 0.629 0.626 0.669 0.719 Y
C11 IN CO MR VP LN 28.3 5 0.983 0.966 0.083 0.828 0.735 0.771 0.637 0.685 0.731 Y
C12 VC IN MR DS SS 31.7 5 0.981 0.961 0.089 0.825 0.841 0.727 0.686 0.526 0.721 Y
C13 IN CO MR PC DS 11.9 5 0.995 0.989 0.045 0.839 0.748 0.750 0.613 0.667 0.723
C14 VC IN BD MR LN 36.5 5 0.979 0.958 0.097 0.801 0.853 0.657 0.746 0.677 0.747 Y
C15 SI IN MR VP DS 35.6 5 0.977 0.955 0.095 0.735 0.827 0.765 0.637 0.686 0.730 Y
C16 VC IN BD VP DS 114.2 5 0.926 0.852 0.180 0.805 0.831 0.690 0.667 0.678 0.734 Y
C17 SI VC MR VP DS 72.4 5 0.951 0.902 0.142 0.777 0.834 0.723 0.612 0.688 0.727 Y
C18 IN CO BD MR DS 23.2 5 0.987 0.973 0.074 0.828 0.735 0.674 0.767 0.675 0.736
C19 VC IN MR LN SS 38.6 5 0.976 0.951 0.100 0.813 0.848 0.731 0.685 0.529 0.721 Y
C20 VC IN MR VP SS 43.1 5 0.971 0.942 0.107 0.813 0.847 0.737 0.627 0.522 0.709 Y
C21 VC IN VP DS SS 31.7 5 0.981 0.961 0.089 0.825 0.841 0.727 0.686 0.526 0.721 Y
C22 IN CO MR DS SS 24.0 5 0.985 0.969 0.075 0.825 0.752 0.753 0.679 0.534 0.709 Y
C23 SI VC MR PC DS 31.1 5 0.981 0.961 0.088 0.798 0.844 0.700 0.608 0.673 0.725 Y
C24 IN MR VP DS SS 7.6 5 0.998 0.995 0.028 0.770 0.790 0.678 0.701 0.546 0.697 Y
C25 VC IN VP LN SS 33.2 5 0.977 0.954 0.092 0.825 0.845 0.614 0.671 0.533 0.698 Y
Note. Comb. = combination number (as referred to in Table X), T = subtest (T1-T5), c2 = chi-square test, df = degrees of freedom CFI = comparative fit
index, TLI = Tucker-Lewis index, RMSEA= root mean square error of approximation, l = factor loading for subtest (T1-T5). SI = Similarities, VC =
Vocabulary, IN = Information, CO = Comprehension, BD = Block Design, MR = Matrix Reasoning, VP = Visual Puzzles, PC = Picture Completion, DS = Digit
Span, LN = Letter-Number Sequencing, SS = Symbol Search. Combinations highlighted in blue are most theoretically consistent with the Wechsler (4-
factor) model. * two-subtest short form models have negative degrees of freedom and three-subtest short form models have zero degrees of freedom;
thus, fit statistics cannot be estimated. Y = one or more model parameters below established cutoffs, indicating "yes", exclude from further consideration.
Five-subtests