diversity and community assembly structure in canopy
TRANSCRIPT

Diversity and community assembly structure in canopy jumping spiders (Araneae: Salticidae) across a land use
gradient in Jambi, Sumatra
Master’s Thesis for achievement of the academic degree
"Master of Science" (M.Sc.)
in the study program
"Biodiversity, Ecology and Evolution"
at the Georg-August Universität Göttingen
prepared at the
Department of Animal Ecology (Scheu)
submitted by
B.Sc., Junggebauer, André
born in
Herford
Göttingen, March 2020
ZENTRUM FÜR BIODIVERSITÄT UND NACHHALTIGE LANDNUTZUNG
− CENTRE OF B IODIVERSITY AND SUSTAINABLE LAND USE −

First reviewer: Prof. Dr. Stefan Scheu
Second reviewer: Prof. Dr. Mark Maraun
Day of announcement of the Master’s Thesis: 01.10.2019
Day of delivery of the Master’s Thesis: 24.03.2020

Acknowledgments
First, I would like to pay my regards to Prof. Dr. Stefan Scheu and Prof. Dr. Mark Maraun for
granting me the opportunity to develop my master’s thesis with these fascinating samples. I
also want to express my deepest gratitude to my practical supervisor Dr. Jochen Drescher for
his invaluable support throughout the formation of this thesis. Further, I must emphasize the
efforts of Dr. Ina Schaefer and Dr. Tamara Hartke as their enthusiasm and expertise
fundamentally contributed to this study. Additionally, I am grateful for the contributions of
Daniel Ramos, Ting-Wen Chen and Garvin Schulz to this study. Lastly, I am taking this
opportunity to perpetuate my gratitude to my parents, thank you for making all of this
possible.

Contents Abstract ...................................................................................................................................... 1
Introduction ................................................................................................................................ 2
Hypotheses ................................................................................................................................. 5
Methods ...................................................................................................................................... 6
Study area ............................................................................................................................... 6
Spider sampling ...................................................................................................................... 7
Morphospecies identification ................................................................................................. 8
Environmental and ecological variables................................................................................. 8
Diversity analysis ................................................................................................................... 9
DNA extraction .................................................................................................................... 10
Sequence analysis ................................................................................................................. 11
Automatic Barcode Gap Discovery (ABGD) ....................................................................... 12
Phylogenetic trees and community structure ....................................................................... 12
Results ...................................................................................................................................... 14
Diversity and community composition ................................................................................ 14
Community phylogenetics .................................................................................................... 21
Discussion ................................................................................................................................ 23
Diversity of arboreal jumping spiders .................................................................................. 23
Community phylogenetics of arboreal jumping spiders ...................................................... 25
Conclusion ................................................................................................................................ 26
Statement of Authorship ........................................................................................................... 27
References ................................................................................................................................ 28
Appendix .................................................................................................................................. 39
1
Abstract
This study investigates the effects of rainforest transformation to monoculture plantations on
the diversity and community assembly structure of arboreal jumping spiders (Araneae:
Salticidae) across a land use gradient in Jambi, Sumatra. Spiders were collected via canopy
fogging in a nested, replicated design of 32 plots in four land use systems in two landscapes
(Bukit Duabelas, Harapan). The four land use systems were: primary degraded lowland
rainforest, jungle rubber (extensive rubber agroforestry) monocultures of oil palm (Elaeis
guineensis) and rubber (Hevea brasiliensis). From a total of 912 collected spiders, 677 were
identified to 70 different morphospecies.
Roughly 40% of all morphospecies were found exclusively in jungle rubber and/or forest,
whereas only half of that were exclusively found in rubber and oil palm combined. Salticid
spider abundance did not differ among the land use systems. Salticid species richness was
highest in jungle rubber, and lowest in rubber and oil palm, with forest having intermediate
species richness, which in turn was not different from any of the other land use systems.
Simpson’s inverse diversity was significantly higher in forest and jungle rubber, compared with
rubber, but was not different from oil palm. Community composition of salticid spiders in forest
and jungle rubber was similar, but different from rubber and oil palm, which in turn differed
from each other. I also tested the influence of ambient temperature and ambient humidity, mean
canopy openness, aboveground plant biomass AGB, stand structural complexity SSCI and the
land use intensity index LUI on salticid spider community composition. Among those variables,
canopy openness, AGB and LUI had a significant effect on canopy salticids community
composition. The three variables only explained 7% of the data variance, strongly suggesting
that there are other, possibly more influential environmental factors influencing canopy
composition of canopy salticids spiders.
I extracted DNA from legs of up to three individuals from 69 of the 70 identified
morphospecies. Two gene regions were sequenced, i.e. the nuclear-encoded large subunit (28S)
ribosomal repeat (~750bp) and the ~1 kb mitochondrial encoded cytochrome oxidase I (COI),
using the Sanger method. To verify morphology based identification, I used Automatic
Barcode Gap Discovery (ABGD). I then calculated phylogenetic diversity PD, Net Relatedness
Index NRI and Nearest Taxon Index NTI with single sequences for 55 candidate
morphospecies. NRI and NTI are two commonly used metrics in community phylogenetics to
determine phylogenetic clustering (indicative of habitat filtering) versus phylogenetic
overdispersion (indicative of competitive exclusion) as community assembly mechanisms.
2
Despite contrasting data in jungle rubber and rubber with respect to NTI and NRI, results
indicated that the community assembly in forest is not different from random assembly, while
community assembly in oil palms seemed to be strongly influenced by habitat filtering. I discuss
the relevance of these findings with regard to the limitations of the used indices.
Overall, my thesis demonstrates that conversion of rainforest and jungle rubber to monocultures
of rubber and oil palm (a) had no effect on the abundance on canopy salticids, (b) caused
reduction of species richness and Inverse Simpson diversity and (c) entailed shifts in
community composition. I found three environmental variables that had a significant effect on
community composition and detected differences in the potential community assembly
mechanisms between forest and oil palm. Overall, this thesis offers a comprehensive
community level analysis of canopy salticids spiders thus far not reported from Southeast Asia.
Introduction
Tropical ecosystems are exceptionally species rich, contain much of the world’s biodiversity
and are one of the biggest carbon sinks in the world (Sodhi et al., 2004). However, forest
conversion to agricultural land use systems is one of the major reasons for worldwide
biodiversity loss and proceeds fastest in the tropics (Sodhi et al., 2004; Sala, 2000). Especially
in Southeast Asia, deforestation rates are highest among all tropical regions. First major
deforestation started around 1800 to expand agricultural areas for rice (Oryza sativa) cultivation
(Sodhi et al., 2004). Since 1950, commercial timber extraction as well as cultivation of rubber
(Hevea brasiliensis) and oil palm (Elaeis guineensis) were the main drivers of deforestation in
Southeast Asia until today (Flint, 1994). By 2010, roughly 70% of the original lowland forest
of Sundaland, comprising Malay Peninsula, Borneo, Sumatra and Java were lost by
deforestation (Wilcove et al., 2013). The still ongoing forest conversion is feared to result in a
loss of 40% of the regions biodiversity by 2100 (Sodhi et al., 2004).
Logging native tree species immediately simplifies the complex canopy structure of tropical
rainforests (Okuda et al., 2002). The negative impacts of selective logging on critical
parameters like canopy complexity and canopy height are still detected after > 40 years of
recovery (Okuda et al., 2002). Tree canopies form an aboveground habitat that is highly
threatened and contains a large proportion of the forest’s insect and arthropod diversity (Erwin,
1982; Zheng, 2015; Stork & Grimbacher, 2006). Canopy arthropods provide crucial ecosystem
functions as they serve as important predators and pollinators (Floren et al., 2011). Furthermore,
they constitute the majority of biomass and biodiversity in tropical ecosystems (Fittkau &

3
Klinge, 1973; Samways, 2005). Studies by Davis & Phillips (2005) and Pfeiffer et al. (2008)
revealed a significant decrease in species diversity of beetles and ants in oil palm plantations
compared to primary forest. However, most studies regarding the effect of forest transformation
focused on birds or mammals (Turner & Foster, 2008, Meijaard et al., 2005).
While assessing species richness and abundance of target taxa holds relevant information with
regard to community composition, these data are but a snapshot, limited to one point in time. It
is often important to understand the processes that lead to the observed community composition.
The underlying mechanism is termed community assembly, which is the structuring mechanism
behind community succession, leading to a climax community of a given habitat. The two major
components of community assembly are competitive exclusion of species and environmental /
habitat filtering (MacArthur & Levins, 1964, Diamond, 1975). Community assembly can be
measured by molecular biological means, often referred to as community phylogenetics.
Community phylogenetics aims to reveal the effects of competitive exclusion and
environmental / habitat filtering, based on the phylogenetic relationship that co-occurring
species share within a community (Webb et al., 2002, Vamosi et al., 2009). The underlying
assumption is, that ecological traits show a phylogenetic signal, i.e. closely related species are
assumed to be ecologically more similar than distantly related species. Community assemblages
dominantly structured by competitive exclusion consist of distantly related species, resulting in
overdispersal on the phylogenetic tree. In contrast, communities structured by environmental /
habitat filtering are associated with phylogenetic and phenotypic clustering, as the environment
functions as a filter that selects for species of similar traits (Webb et al., 2002). The two most
commonly used metrics based on the mean phylogenetic distance of taxa in a community are
the Net Relatedness Index (NRI) and the Nearest Taxon Index (NTI). NRI measures the mean
pairwise phylogenetic distance of species in a sample in relation to the phylogeny of the local
community. NTI measures the phylogenetic distance for every taxon to its closest relative
(Webb et al., 2002). Both metrics are below zero with phylogenetic overdispersal (≈
competitive exclusion), above zero with phylogenetic clustering (≈ environmental / habitat
filtering) and are zero in randomly assembled communities.
Spiders are very diverse and abundant in rainforest canopies and are among the top predators
in arthropod foodwebs (Zheng et al., 2015). Their distribution and assemblage structure are
sensitive towards habitat disturbances and alterations in the vegetation structure (Hsieh et al.,
2003; Wise, 1993), thus they are useful organisms for biodiversity studies across changing
environments. Among the spiders as a whole, the jumping spiders (Araneae: Salticidae) are the

4
family containing the most species (currently 6,188 (World spider catalog, 2020)). Their most
remarkable feature are two large anterior median eyes with a spatial acuity much higher than
that of other animals of similar size (Land & Nilsson, 2012). This level of visual abilities allows
salticids spiders to stalk and catch moving prey with a precise jump that may exceed 20 times
their body length (Dalton, 2008). These optical and physical capabilities grant salticids spiders
to be some of the most agile arthropod predators in tropical forest canopies. This may also be
the reason why salticids spiders and ants seem to compete for similar niche space in Southeast
Asian rainforest canopies (Katayama et al., 2015). One of the most species rich genera of the
Salticidae is Myrmarachne, which mimics the morphology of ants from the same region
(Yamasaki & Edwards, 2013; Yamasaki & Hahmad 2013, Yamasaki et al., 2018). Overall, the
Indonesian fauna of jumping spiders comprises 657 described species from 161 genera,
constituting >10% of the worldwide species richness of salticids (Ramos 2020; World spider
Catalog, 2020). To date, only few studies have addressed the impact of rainforest transformation
in Southeast Asia on spider communities in general (Floren & Deeleman-Reinhold, 2005;
Floren et al., 2011; Zheng et al., 2015) and investigations on community assembly seems to be
limited to Hawaiian and European communities (Gillespie, 2004; Mazzia et al., 2015). The
general consensus is that anthropogenic disturbance leads to decreased diversity and altered
community compositions of arboreal spider communities, including salticid spiders, in
Southeast Asia (Floren et al., 2011, Floren & Deeleman-Reinhold, 2005). To the best of my
knowledge, detailed studies on the role of habitat transformation on communities of salticid
spiders in Southeast Asia are however, lacking, in particular with regards to community
assembly.
Hence, the aim of this thesis is to investigate the effect of rainforest conversion to monocultures
on the abundance, diversity and community composition of arboreal jumping spiders
(Salticidae). Additionally, I aim to explore the role of environmental factors on community
composition and shed light on potential differences of community assembly processes, both in
rainforests and in monocultures. To do this, I studied the above in a collection of canopy
salticids spiders from Jambi Province, Sumatra, Indonesia. The samples were collected along a
land use gradient from primary degraded lowland rainforest forest via jungle rubber (a rubber
agroforest, with planted rubber trees in a previously logged rainforest) to monocultures of
rubber and oil palm. I used the available collection to test two overarching hypotheses (see
below).

5
Hypotheses
(1) Species richness and diversity of canopy jumping spiders decrease across the land use
gradient, with highest values in lowland rainforest, intermediate in jungle rubber and lowest in
rubber and oil palm monocultures, as a response to changing microclimate and habitat
simplification.
(2) Transformation of rainforest to agricultural landscapes strengthens the effect of habitat
filtering, resulting in phylogenetic clustering in the community assembly of jumping spiders in
oil palm and rubber monocultures.

6
Methods
Study area
Jumping spiders were collected in 2017 within the frame of the Collaborative Research Centre
CRC990 / EFForTS (“Ecological and Socio-economic Functions of Tropical Lowland
Rainforest Transformation Systems”). EFForTS investigates the socioeconomic and ecological
consequences of rainforest transformation to cash crop dominated landscapes in Jambi province
of Indonesia. In this project, scientists from the University of Göttingen (Germany) and the
Indonesian universities UNTAD (Tadulako University, Palu), UNJA (Jambi University), IPB
(Bogor Agricultural University) cooperate in research and are funded by the German Research
Foundation (DFG). Jambi Province covers an area of 50160 km² and faced rapid rainforest
transformations to crop land during the last decades. Due to land use policies, focused on
economic growth and transmigration programs that resettled about 400000 people from
overcrowded regions of Indonesia to Jambi, now primarily occupied in cash-crop production,
55% of Jambi’s rainforest was transformed to agricultural land by 2013 (Drescher et al., 2016).
In 2014, rubber cultivations spread over more than 650000 ha and oil palm plantations covered
about 590000 ha in Jambi Province (Badan Pusat Statistik, 2014). The EFForTS study sites are
located in and around the Bukit Duabelas National Park and the Harapan Rainforest forest
reserve in Jambi province in Sumatra (Fig.1).
Figure 1 Sampling sites in Jambi Province, Sumatra, Indonesia with two landscapes Bukit Duabelas (B) and
Harapan (H) studied. Plot ID’s used first letters for landscape (B, H) and land use (F, J, R, O) and the plot number
e.g. BJ5 = Bukit Duabelas jungle rubber plot 5. Nature conservation areas ‘Bukit Duabelas National Park’ and
‘Harapan Rainforest Concession’ are coloured in brown. From: Berkelmann et al., 2018.

7
Both landscapes, termed ‘Bukit Duabelas’ (B) and ‘Harapan’ (H) have a nested, replicated
mirrored design of core plots across four different land use systems. Each form of land use has
four plots of 50 x 50 m in size, resulting in 4 x 4 x 2= 32 plots. Core plots of rubber (Hevea
brasiliensis) and oil palm (Elaeis guineensis) are located in smallholder monoculture
plantations. Rubber plantations were established 12 to 21 years before sampling in 2017 and oil
palm plantations varied in ages of 13 to 20 years (Drescher et al., 2016). Forest core plots
resemble a primary forest, partly degraded by logging activities, according to the definition of
Margono et al., 2014. Core plots in jungle rubber were established in smallholder agroforest
systems with planted trees of rubber in a previously logged rainforest (Fig.2).
Spider sampling
Salticid spiders were collected via canopy fogging of three locations in each of the 32 core plots
during dry season in June to August of 2017. Canopies were fogged with DECIS 25
(BayerCropScience) insecticide dissolved in petroleum white oil in a 1:9 ratio. Dead arthropods
of the target canopies were collected in 8 funnels of 1 m² per target canopy. Funnels led to a
bottle with EtOH (96%) at the bottom. All specimens were cleaned after sampling and
preserved in EtOH at -20°C (Drescher et al., 2016).
Figure 2. Investigated primary forest (A), jungle rubber agroforest (B), rubber monocultures (C) and oil palm
monocultures (D) in Jambi, Sumatra, Indonesia. From Breidenbach et al., 2018.

8
Morphospecies identification
From a total amount of 912 jumping spiders (Araneae: Salticidae), 677 individuals were
identified to morphospecies with a Stemi 2000-Zeiss binocular microscope. Morphological
identification was supported by ‘A Guide to the Spiders of Jambi (Sumatra, Indonesia) -
Identification Key to Common Families and Images of the EFForTS collection (Z02)’ (Ramos
et al., 2019), containing detailed photography of all jumping spider morphospecies from canopy
fogging in the study site in 2013 and comparison to the original morphotypes. 235 juveniles,
many newly hatched, were excluded from the analysis as morphological characters for
determination were not developed.
Environmental and ecological variables
Environmental and ecological data originate from various EFForTS subprojects which
conducted research on the exact same core plots. Temperature (°C) (Meijide et al., 2018),
relative humidity (%) (Meijide et al., 2018), aboveground biomass (AGB) (Mg/ha) (Guillaume,
2019), Stand Structural complexity (SSCI) (Ehbrecht 2017), canopy openness (%) (Drescher et
al., 2016) and land use intensity index (LUI) (Brinkmann et al., 2019) were tested on their
possible influence on jumping spider richness and diversity.
Below-canopy Temperature (°C) and relative humidity (%) were measured for every core plot
with a Thermohygrometer (Galltec Mela, Bondorf, Germany), installed at 2m height, from
April 2013 to March 2016 (Meijide et al., 2018). Analyses will be executed with mean values
for both parameters. Canopy openness (%) of the core plots was measured with a spherical
densitometer. Four readings, according to the cardinal directions, were performed in 16
locations in each of the 32 plots. Average values for the four cardinal direction readings were
calculated and used as one measurement (Drescher et al., 2016). Aboveground biomass (AGB)
(Mg/ha) was calculated with allometric equations, using tree diameter, height and wood specific
gravity as parameters. Parameters were measured between August and September 2012, in each
core plot for trees and oil palms with a DBH (diameter at breast height) at 1,3m of at least 10cm.
(Guillaume, 2019). To quantify the canopy structure, a FARO Focus terrestrial laser scanner
(Faro Technologies Inc., Lake Mary, USA) placed on a tripod, at 1.3 m height, (above
underwood) centered in each plot, scanned 3D structures of woody components and foliage to
provide data for calculations on the stand structural complexity (SSCI). Calculation of the SSCI
used the method proposed by Ehbrecht et al. (2017). The Land use index (LUI) hints to the
extent of land management and was calculated with the method of Blüthgen et al. (2012), for
core plots of oil palm, rubber and jungle rubber. The LUI comprises information on the

9
quantities of fertilizer (industrial and cow dung), herbicide treatment, liming with CaCO3 and
the number of planted trees per hectare (Brinkmann et al., 2019). LUI is zero for forest plots.
Diversity analysis
Analysis of species diversity was conducted in R v3.6.2 (R Core Team 2019), using the working
packages vegan, multcomp, GGally and limma (Oksanen et al., 2019; Hothorn et al., 2008;
Schloerke, 2018, Ritchie et al., 2015). Mean abundance including undetermined juveniles
(individuals per m²), species richness (S), and the inverse Simpson Index (1/D) (Hill, 1973)
were calculated for each plot. One-way analyses of variance (ANOVA) was followed by
multiple comparisons with Tukey’s HSD using Holm’s adjustment (Holm, 1973) to infer
significant differences among the four land use types for each index. Data inspection using the
Shapiro-Wilk test (Wilk, 1973) indicated that species richness and the inverse Simpson Index
meet the requirement of linear models, while abundance required log transformation. Rank
abundance curves (Whittaker, 1965; implemented in RankAbund, Hartke 2019) were generated
for each land use type to display relative species abundances. Venn’s Diagrams were produced
to illustrate species overlap between land use systems and landscapes.
Detrended Correspondence Analysis (DCA) indicated no definite linear or unimodal species
response (first axis length 3.4). However, abundance data with many zeroes are often best
analyzed with unimodal methods (Zheng et al., 2015), so Non-metric Multidimensional scaling
(NMDS) and Canonical Correspondence Analysis (CCA) were selected. NMDS ran with five
dimensions, 0.098 stress, abundance data and Bray-Curtis dissimilarity, selected by the highest
value using the function rankindex implemented in ‘vegan’, to create a two-dimensional
representation of ecological distances among species in the four land use types. Multivariate
analysis of variance (MANOVA) was used to test whether land use significantly predicts the
species pattern in the NMDS. MANOVA also calculated Wilk’s Lambda, which describes the
percentage of variance that cannot be explained by a given factor, i.e. land use. CCA was
conducted to describe the distribution of jumping spiders constrained to the environmental data.
Prior to analysis, linear relationships between environmental variables were tested with
standardized data using the function decostand implemented in vegan. Pairwise Pearson
Correlations (r) were significant between all environmental variables (Appendix, Figure A1).
Based on the almost perfectly linear correlation (r = 0.94) between relative humidity and mean
temperature, relative humidity was excluded from the environmental constraints used in CCA.
A global model containing all explanatory variables was significant under one-way ANOVA,
so forward selection was used to rank environmental variables according to their importance

10
(Blanchet et al., 2008). Forward selection used the alpha significance level and the adjusted
coefficient of multiple determination (R²a), calculated in the global model, as stopping criteria
(Blanchet et al., 2008) and ran for 999 permutations. The variance inflation factor for each
constraint indicated intermediate linear dependencies and no redundancy with a maximum
value of 3.9 for the forward selection model (Akinwande et al., 2015).
DNA extraction
DNA extraction was carried out for 152 jumping spider individuals from 69 out of 70 identified
morphospecies. One morphospecies represented by a single individual was excluded from the
genetic analysis as tissue removal would have obstructed future morphological work. For
morphospecies represented by at least four individuals, three individuals were used for
molecular analysis. Less abundant morphospecies are represented by two replicates or a single
individual in the genetic analysis. For DNA extraction, I used both legs of the third leg pair and
kept the remaining body as voucher individuals, which are deposited in the collections of the
J.F Blumenbach Institute of Zoology and Anthropology, University of Göttingen, Germany, for
further examination. DNA extraction of leg tissue was performed with the Agencourt
DNAdvance Kit (Beckman Coulter, Krefeld, Germany), following the manufacturers protocol.
Legs were individually transferred into 94 µl lysis buffer and manually ruptured with a sterile
plastic pestle. Afterwards, 2µl of Chitinase (1mg/ml Sigma-Aldrich, Taufkirchen, Germany)
was added and lysate was incubated for 10 minutes on a shaking thermo-block at 37°C.
Thereafter, 5µl of Proteinase K (20µg/µl, Genaxxon, Ulm, Germany) was added and samples
were incubated for 5 hours on shaking thermo-block at 55°C. The lysed material was transferred
without any tissue remains to an AB-1127 plate (ThermoFisher Scientific, Dreieich, Germany)
and processed on the automated robot system Biomek 3000 (Beckman Coulter, Krefeld,
Germany) using the standard protocol and an elution volume of 100 µl. Two gene regions were
amplified and sequenced, i.e. the nuclear-encoded large subunit (28S) ribosomal repeat
(~750bp) and the ~1100 bp mitochondrially-encoded cytochrome oxidase I (COI). The
Polymerase Chain Reaction (PCR) reaction mix of 25 µl volume contained 2 µl of template
DNA, 12.5 µl of SuperHot PCR mastermix (Genaxxon, Ulm, Germany), 1 µl of magnesium
chloride (25mM) and 1 µl of each primer (10 pmol/µl; see Table 1 for primer details).
11
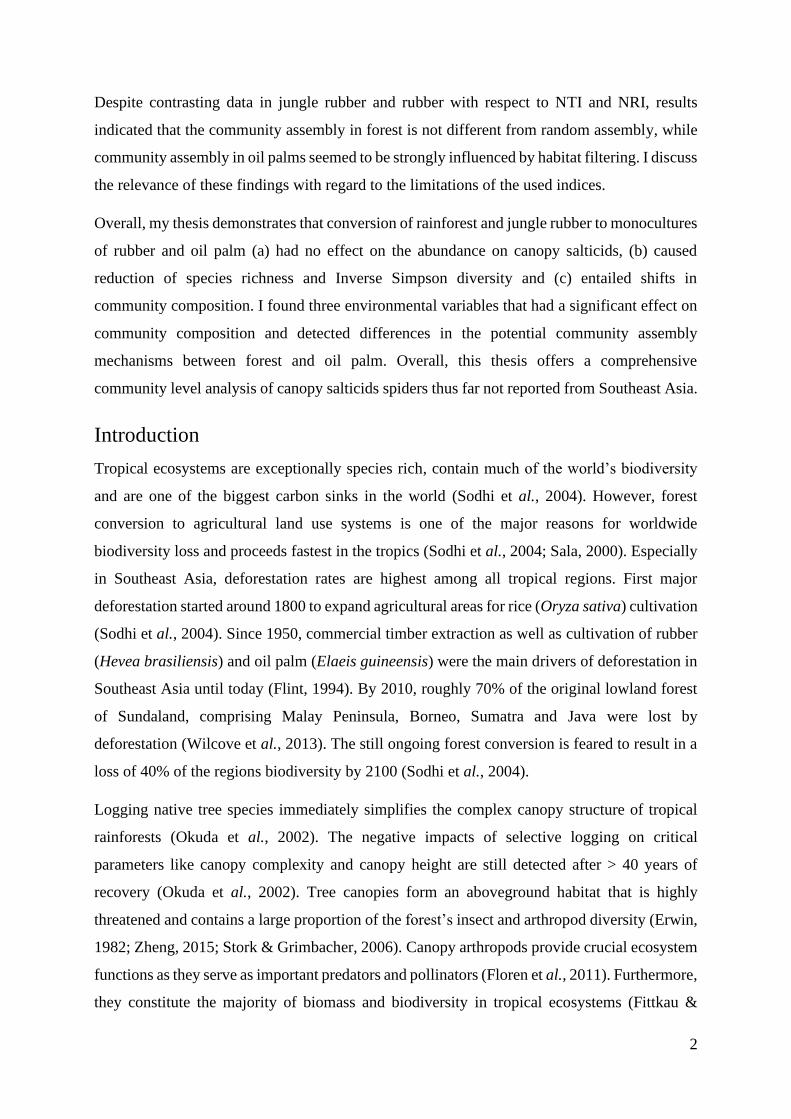
Table 1. Overview of primers used for amplification of the 28S and COI gene regions.
Gene
region
Primer name Primer sequence (5’- 3’) Source
COI COI_C1-J-1718
“SPID” forward”
GGAGGATTTGGAAATTGATTAGTT
CC
Simon et al., 1994
COI COI_C1-N-
2776_reverse
GGATAATCAGAATATCGTCGAGG Hedin and
Maddison, 2001
COI LCO1490 GGTCAACAAATCATAAAGATATT
GG
Folmer et al.,
1994
COI HCO2198 TAAACTTCAGGGTGACCAAAAAA
TCA
Folmer et al.,
1994
28S 28S “O” forward GAAACTGCTCAAAGGTAAACGG Hedin and
Maddison, 2001
28S 28S “C” reverse GGTTCGATTAGTCTTTCGCC Hedin and
Maddison, 2001
An alternative PCR reaction mix for samples that failed to amplify were again processed using
primers and 12.5 µl KAPA HiFi HotStart ReadyMix (KAPA BIOSYSTEMS, Cape Town,
South Africa), 2µl template DNA and 0.75µl for each primer. For COI, both PCR reactions
were first performed with the primer pair suggested by Maddison & Simon and repeated with
the primer pair proposed by Folmer et al. (Tab. 1) for samples that could not be amplified. The
PCR cycling conditions had an initial activation step at 95°C for 15 minutes, 35 amplification
cycles (denaturation at 95°C for 45 s, annealing at 55°C for 45 s for the ribosomal repeat (28S)
and 52°C for 45 s for cytochrome oxidase I (COI), elongation at 72°C for 45 s) and a final
elongation step at 72°C for 60 s. PCR products were send for purification and sequencing in
forward and reverse direction to SeqLab (Microsynth, Göttingen, Germany).
Sequence analysis
Quality check of sequences was conducted in Geneious Prime 2019 (http://www.geneious.com)
and ambiguous positions were corrected using the electropherograms. For the COI gene region,
a total of 142 consensus sequences, representing 64 of the 69 morphospecies used in DNA-
extraction, were gathered and analyzed. Consensus sequences for the ribosomal repeat region
28S counted 125 sequences and 59 morphospecies in the analysis (See Appendix, Table A3 for
an overview of all acquired sequences in this study). Multiple sequence alignment for the
nuclear ribosomal 28S consensus sequences was performed with default settings using the
‘Clustal Omega’ tool in Geneious Prime 2019. Consensus sequences for the coding,
mitochondrial cytochrome oxidase I (COI) region were loaded into BioEdit (Hall, T.A., 1999),
set into the appropriate protein reading frame, translated and aligned using the ClustalW

12
multiple sequence alignment parameters of 15 for gap opening and 6 for gap extension
(Thompson et al., 1994).
Automatic Barcode Gap Discovery (ABGD)
The Automatic Barcode Gap Discovery (ABGD) is a procedure that aims to significantly infer
the gap between intraspecific- and interspecific diversity, called ‘barcode gap’. Accordingly,
genetic pairwise differences are partitioned into hypothetical species, using a range of prior
intraspecific divergence to infer a model-based, one-sided confidence limit for the intraspecific
and interspecific divergence from sequence data (Puillandre et al., 2011). This barcoding
approach was used to check whether the determined morphospecies were congruent with
molecular entities. Here, I used the ABGD web version available at
(https://bioinfo.mnhn.fr/abi/public/abgd/abgdweb.html) and the single gene alignments and
limited the range of intraspecific variation from Pmin = 0.001 (a single-nucleotide difference)
to Pmax = 0.1. Minimum gap width (X) was set to 1.0, the Kimura two parameters model was
set to compute the distance matrix and the remaining parameters were set to default. Species
grouping for the 28S and COI gene regions were checked for similarities and further compared
with the results of morphological identification.
Phylogenetic trees and community structure
Tree reconstruction was done for a set of 55 candidate species determined by the combined
results of morphology based identification and ABGD (Appendix, Table A4). Candidate
species were represented by one sequence with highest quality per morphospecies, and the new
28S and COI datasets were again aligned using ClustalW in Geneious Prime and BioEdit with
the same parameters as mentioned above.
Sequence alignments were loaded in R v3.6.2 (R Core Team 2019) as FASTA files and the best
fitting model of sequence evolution was evaluated by the Akaike Information Criterion (AIC)
using the modelTest function provided in the R package phangorn (Schliep, 2010). Best model
fit for 28S and COI was the Generalised Time-Reversible Model (GTR+I+G) (Tavaré, 1986).
Phylogenetic trees were calculated with Baysesian inference in MrBayes 3.2.7 (Huelsenbeck
and Ronquist, 2001) using 2 independent runs of 4 chains each, the GTR+I+G model of
sequence evolution with nst = 6 and rates = invgamma, MCMC = 2500000 generations and a
relative burnin of 25%. Additionally, Maximum Likelihood trees were calculated for
comparison with the ‘phangorn' package in R using the same model of sequence evolution as
for Bayesian inference and bootstrapping with 5000 replicates. Trees were visualized in FigTree
v.1.4.4 (http://tree.bio.ed.ac.uk/software/figtree/).

13
Phylogenetic trees for COI produced no resolved phylogeny with the Bayesian inference. Also,
Maximum Likelihood trees showed bootstrap values of high uncertainty around 0 at several
internal nodes, so 28S phylogenetics were used for further analysis. Investigation of the
community assembly structure was done using the packages picante and multcomp (Kembel et
al., 2010; Hothorn et al., 2008). Phylogenetic diversity (PD) (Faith, 1992), Net Relatedness
Index (NRI) and Nearest Taxon Index (NTI) (Webb et al., 2002) was calculated for all 32 plots
using the community matrix of species abundances and the Bayesian inference phylogenetic
tree of the 28S gene region only (Appendix, Figure A2).
Phylogenetic diversity (PD) equals the sum of the lengths of all branches on the phylogenetic
tree that span the members of a species set (Faith, 1992), i.e. each plot in this study and was
calculated with the ‘pd’ function. Additionally, PD gives insight on the evolutionary history of
species assemblages and is argued to comprise information on phenotypic variations of species
e.g. traits (Faith, 1992; Cadotte, 2008). To investigate phylogenetic clustering and
overdispersion of jumping spider communities, NRI and NTI were calculated as standardized
effect sizes of the mean pairwise phylogenetic distance (MPD) and of mean nearest taxon
distances (MNTD), respectively for each plot. Both metrics were tested against the null model
‘independent swap’, which randomizes the community data with the independent swap
algorithm (Gotelli, 2000), while maintaining species occurrence frequency and species
richness. Standardised effect sizes of MPD and MNTD were calculated with the functions
‘ses.mpd’ for NRI and ‘ses.mntd’ for NTI using 999 runs and 1000 iterations, respectively. As
MPD and MNTD are equivalent to -NRI and NTI, both distances were multiplied by -1. To
test if phylogenetic clustering and overdispersion were significant in each of the four land use
types, NRI and NTI values for core plots of forest, jungle rubber, rubber and oil palm were
combined and t-tests were conducted for each land use type and metric against a null hypothesis
of random assembly (mean variance 0). Significant deviances from 0 represent phylogenetic
clustering for positive mean values and phylogenetic overdispersion for negative mean values.
One-way ANOVAs followed by Holms corrected Tukey’s HSD tests were run to test for
significant differences in values of NRI and NTI among the four land use systems.

14
Results
Diversity and community composition
Morphology based identification of 677 individuals (235 juveniles excluded) resulted in 70
different morphospecies. The majority of morphospecies was present in both investigated
landscapes with 41 shared morphospecies. The Bukit Duabelas landscape contained 18 unique
morphospecies while the Harapan landscape had 11 exclusive morphospecies (Fig. 3a). Many
of these morphospecies found in exclusively one landscape were single findings, i.e. single
individuals were found for 11 exclusive morphospecies in the Bukit Duabelas landscape and 5
in the Harapan landscape. With regard to land use systems, 28 morphospecies were found
exclusively in jungle rubber and/or forest whereas monocultures of rubber and/or oil palm
comprised roughly half of that with 15 species (Fig. 3b). Only six species were present in all of
the investigated land use systems.
Figure 3 a, b. Venn diagrams showing numbers of arboreal jumping spider morphospecies for the two
landscapes Bukit Duableas (yellow) and Harapan (purple) and the four land use systems forest (green), jungle
rubber (blue), rubber (yellow) and oil palm (red) in both landscapes in Jambi, Indonesia.
a b
15
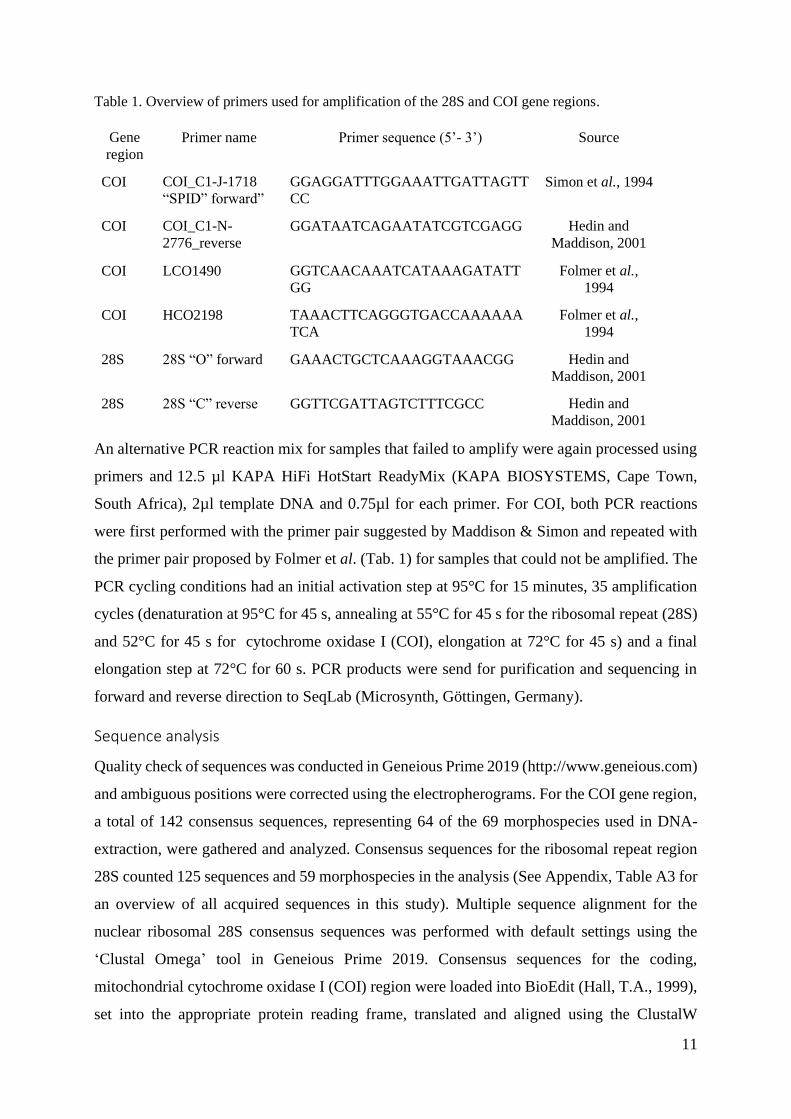
Ranked species abundances of canopy spiders indicated differences among communities from
the different the land use systems (Fig. 4). This was confirmed by ANOVA, which revealed
significant differences in the shape of rank abundance curves (F[3] = 17.21, p <0.001). As per
the Akaike Information Criterion AIC, ranked abundances in forest and jungle rubber fitted best
to the Mandelbrot model, while the preemption model fit best for rubber, and the Zipf model
fitted best for oil palm. Ranked abundance slopes for jungle rubber were significantly different
from slopes for rubber and oil palm (both p < 0.001), while slopes for forest were only different
from rubber (p < 0.05, all p values from pairwise Tukey HSD tests after Holm’s correction).
Slopes from jungle rubber and forest were not different, as were the slopes in oil palm and
rubber.
Figure 4. Rank abundance curves of arboreal jumping spiders for four land use systems forest (green),
jungle rubber (blue), rubber (yellow) and oil palm (red) in Jambi, Sumatra.

16
Abundance (N/m²) of arboreal jumping spiders was not affected by land use (F[3,28] = 1.89, p >
0.05) or landscape (F[1,27] = 3.77, p > 0.05) (Fig. 5). Jungle Rubber had the highest abundance
of jumping spiders with an average of NJ/m² = 0.99 ± 0.34 individuals per m², compared to the
lowest abundance in rubber plantations (NR/m² = 0.64 ± 0.28, mean ± s.d., respectively). Forest
and oil palm had very similar abundances with NF/m² = 0.75 ± 0.27 individuals/m² and NO/m²
= 0.77 ± 0.35 individuals/m² each.
Figure 5. Abundance (individuals/m²) of arboreal jumping spider communities (Salticidae) across four
land use systems in Jambi, Sumatra (F = forest, J = jungle rubber, R = rubber, O = oil palm). Boxplots
show mean (horizontal line), 95% confidence interval (box), density distribution (grey lines) and raw
data (dots). Different letters above boxplots indicate significant differences after multiple comparisons
(Holms corrected Tukey HSD, p<0.05).

17
Species richness (S) of canopy jumping spiders significantly changed with land use (F[3,28] =
12.551,pr(>chi) = 0.0015) but did not significantly differ between landscapes (F[1,27] =
12.523,pr(>chi) = 0.867) (Fig. 3). Overall, species richness per plot ranged from five species in
BO3 (Bukit Duabelas oil palm plot 3) to the 18 species in BJ4. (Fig.6). On average, species
richness was highest in jungle rubber (SJ = 13 ± 2.5, mean ± s.d.), which was significantly
higher than in rubber (SR = 7 ± 1.41) and oil palm (SO = 9 ± 2.51). Species richness in forest
was intermediate (SF = 10 ± 1.92) and not significantly different from any of the other land use
systems.
Figure 6. Species richness of arboreal jumping spider communities (Salticidae) across four land use
systems in Jambi, Sumatra (F = forest, J = jungle rubber, R = rubber, O = oil palm). Boxplots show mean
(horizontal line), 95% confidence interval (box), density distribution (grey lines) and raw data (dots)
Different letters above boxplots indicate significant differences after multiple comparisons (Holms
corrected Tukey HSD, p<0.05).

18
Inverse Simpson diversity 1/D was significantly affected by land use (F[3,28] = 6.90, p = 0.0013)
but not by landscape (F[1,27] = 0.43, p = 0.51). Forest and jungle rubber had the highest Inverse
Simpson diversity (1/DF = 7.7 ± 1.5 and 1/DJ = 8.2 ± 2.4, respectively, mean ± s.d.) which was
significantly higher than Inverse Simpson diversity in rubber (1/DR = 4.6 ± 1.2). Inverse
Simpson diversity in oil palm (1/DO = 6.2 ± 1.4) was intermediate and not significantly different
from Inverse Simpson diversity in any of the other land use systems (Fig. 7).
Figure 7. Inverse Simpson’s Index of arboreal jumping spider communities (Salticidae) across four land
use systems in Jambi, Sumatra (F = forest, J = jungle rubber, R = rubber, O = oil palm). Boxplots show
mean (horizontal line), 95% confidence interval (box), density distribution (grey lines) and raw data
(dots). Different letters above boxplots indicate significant differences after multiple comparisons
(Holms corrected Tukey HSD, p<0.05).

19
Community compositions of arboreal jumping spiders significantly differed between land use
systems (F[3,15] = 13.97, p<0.001) with an unexplained variation of 1.8 % (Wilks’ Lambda =
0.018) but not between landscapes (F[1,5] = 2.21, p>0.05 , Wilks’ Lambda = 0.674) (Fig. 8).
Jumping spider communities of the land use systems separated into three distinct groups with
overlapping communities of jungle rubber and forest. Jumping spider communities in oil palm
and rubber clearly differ from each other and to communities of forest and jungle rubber.
However, communities in rubber, forest and jungle rubber overlap to some extent, which is
indicated by six species located in between the cluster of these land use systems (Fig. 3, 8).
Common jumping spiders from oil palm plantations are rare in the other land use systems.
Jungle rubber and forest contained most of the sampled arboreal jumping spiders with high
overlap in species occurrences as already indicated by the Venn’s Diagram (Fig. 4).
Figure 8. Non-Metric Multi-Dimensional Scaling (NMDS) of arboreal jumping spiders (+) in plots (∆)
of forest (green), jungle rubber (blue), oil palm (red) and rubber (yellow) based on Bray-Curtis
dissimilarity (stress = 0.098, k = 5). Ellipses represent 75% confidence intervals for each land use system.

20
Canonical correspondence analysis (CCA) used environmental constraints to visualize arboreal
jumping spider communities in the investigated land use systems on two significant axes. The
first axis of the CCA accounted for 3.4% of the variance and separated land use systems across
a gradient of land use intensity and canopy openness. The second axis explained 2.1% of
variance and used the gradient of aboveground biomass (Fig. 9) to separate land use systems.
Results of forward selection analysis indicated that the Land Use Intensity index (LUI,
Brinkmann et al., 2019) (F = 2.39, p<0.001, R2a = 0.0433 ~ 4,3%), aboveground biomass
(Guillaume, 2019) (F = 1.53, p<0.01, R2a = 0.0157 ~ 1.57%) and canopy openness (Drescher
et al., 2016) (F = 1.46, p < 0.05, R2a = 0.0157~ 1.57%) significantly influenced the assemblages
of arboreal jumping spiders with a combined explained variance of ~ 7.4%. Temperature and
SSCI did not significantly improve the model.
Figure 9. Canonical correspondence analysis (CCA) biplot of relationships between arboreal jumping
spider assemblages and environmental constraints in plots of forest (F), jungle rubber (J), rubber (R), oil
palm (O) within the two landscapes Bukit Duabelas (circle) and Harapan (triangle). Environmental
variables with significant influence on canopy jumping spiders under ANOVA are shown as arrows.
Explained variation in % is the adjusted coefficient of multiple determination (R²a)

21
Plots of oil palm, with the highest degree of land use intensity and canopy openness among the
land use systems are located on the right half of the CCA. In contrast, forest plots with low
disturbance, dense canopies and high aboveground biomass locate to the lower left of the CCA
biplot. Rubber locates to the upper middle of the ordination as it shows the lowest values for
aboveground biomass but is not thoroughly structured by land use intensity and high canopy
openness like oil palm. Jungle rubber is intermediate for all three environmental variables and
is in the upper left corner of the CCA. However, aboveground biomass, canopy openness and
land use intensity solely are not suitable to explain the differences in arboreal jumping spider
assemblages with only 7.4% variance explained.
Community phylogenetics
Phylogenetic diversity in arboreal jumping spiders was significantly affected by land use (F[3,28]
= 11.17, p<0.001) but not by landscape (F[1,27] = 2.32, p>0.1). Highest phylogenetic diversity
was found in jungle rubber (PDJ = 1.8 ± 0.26, mean ± s.d.), followed by forest (PDF = 1.45 ±
0.28) in rubber (PDR = 1.14 ± 0.21) and oil palm (PDO = 1.07 ± 0.36) (Fig. 10). Phylogenetic
diversity patterns differed from morphological diversity in that oil palm was the land use system
with the lowest diversity (Fig. 10) instead of rubber (Fig. 7).
Figure 10. Faith’s
Phylogenetic Diversity
(PD) of arboreal jumping
spider communities
(Salticidae) among four
land use systems in
Jambi, Sumatra (F =
forest, J = jungle rubber,
R = rubber, O = oil
palm). Boxplots show
mean (horizontal line),
95% confidence interval
(box), density
distribution (grey lines)
and raw data (dots).
Different letters above
boxplots indicate
significant differences
after multiple
comparisons (Holms
corrected Tukey HSD,
p<0.05)

22
Net relatedness NRI was marginally significantly affected by land use (F[3,28] = 20.462, p =
0.059) under ANOVA. Pairwise comparisons, i.e. Tukeys HSD test followed by holms
correction indicated a significant difference (p<0.05) between NRI values in rubber (NRIR = -
0.48 ± 0.58, mean ± s.d.) and oil palm (NRIO = 0.71 ± 1) (Fig. 11). Mean NRI values for forest
(0.04 ± 0.88) and jungle rubber (-0.16 ± 0.89) did not differ significantly from the other land
use systems. One sided t-tests against 0, suggesting random assembly, were not significant in
any of the land use systems. However, average NRI in rubber was found to be marginally
significantly below zero, while average NRI in oil palm was marginally significantly above
zero (Fig. 11). The nearest taxon index (NTI) showed an overall pattern similar to NRI but
revealed significant phylogenetic clustering of arboreal jumping spiders in oil palm (one sided
t-test; NTIO = 0.85 ± 1; t = 2.36, df = 7, p < 0.05). NTI was also significantly higher in oil palm
than in the other land use systems. In contrast, jumping spider communities in jungle rubber
were overdispersed (NTIR = -0.78 ± 0.89; t = -2.47; df = 7, p < 0.05). Rubber and forest showed
no significant deviance from random expectations. Results for NTI in oil palm and jungle
rubber synergize well with the observed pattern of phylogenetic diversity (Fig. 10).
Figure 11. Net Relatedness Index (NRI, left) and Nearest Taxon Index (NTI, right) of arboreal jumping
spider communities between land use systems in Jambi, Sumatra (F = forest, J = jungle rubber, R =
rubber, O = oil palm). Boxplots show mean (horizontal line), 95% confidence interval (box), density
distribution (grey lines) and raw data (dots). Different letters above boxplots indicate significant
differences after multiple comparisons (Holms corrected Tukey HSD, p<0.05). One sided t-test results
against 0 (random assembly) are shown under each box. Values of NRI and NTI become positive for
phylogenetic clustering, negative for phylogenetic overdispersion and 0 in random assemblies.

23
Discussion
Diversity of arboreal jumping spiders
The results of this study show that the abundance of arboreal jumping spiders is independent of
land use (Fig. 5). High frequencies in both monocultures result from a few dominating species,
which is confirmed by the steep slopes in the rank abundance curves of rubber and oil palm
(Fig. 4). This is in concert with findings by Zheng et al. (2015) who found a few very abundant
species in rubber plantations of China but no overall decline in spider abundance compared to
tropical seasonal rainforests. Additionally, Shochat et al. (2004) revealed that human land use
alterations lead to increased abundances of one or a few adaptable spider species.
In contrast to my first hypothesis, species richness in forest was not significantly higher than in
the monocultures. Instead, jungle rubber showed the highest species richness, which was not
different from forest, but significantly higher than oil palm and almost twice that of rubber
plantations. This pattern is reminiscent of the intermediate disturbance hypothesis (IDH), which
predicts the highest species diversity under intermediate levels of disturbances (Conell, 1978).
Jungle rubber plots are characterized by past and current logging activities while preserving an
overall forest-like structure and form a heterogeneous transition system between forest and
monocultures (Gouyon, 1993; Kotowska et al., 2015). Secondary succession promoted by
logging might explain the species rich communities of jumping spiders that can be found in
these dynamic habitats. Studies in tropical forests of East Asia revealed a similar effect of
intermediate disturbance levels on the diversity of spiders (Tsai et al., 2006; Chen & Tso, 2004).
However, IDH did not fit to the patterns of Inverse Simpson Index, as Inverse Simpson is less
sensitive to rare species (Hill, 1973). Also, IDH does not explain diversity patterns if all spider
families of the same sampling were included (Ramos, in prep.), suggesting that this may be a
pattern unique to the salticids.
I could also confirm that forest conversion to monocultures entails shifts in the community
composition of jumping spiders (Fig 8.). Differences in habitat complexity are known to be a
determinant factor for the structure and diversity of spider communities with the general
consensus that complex and diverse habitats promote greater spider diversity (Floren &
Reinhold, 2005; Pinkus-Rendon et al., 2006). Canopies of oil palm and rubber form
monotonous entities of low complexity (Zheng et al., 2015; Zemp et al., 2019) compared to the
canopies of forest or jungle rubber. As a consequence, jumping spider communities in
monocultures are fundamentally different in their compositions and comprise less species
overall. One important parameter of canopy complexity is described by canopy openness, which

24
significantly impacted jumping spider assemblages in the correspondence analysis (Fig. 9), as
expected. Investigated plots of rubber and oil palm showed a significant decrease in canopy
cover and contrast the dense canopies with multiple layers in forest and jungle rubber (Drescher
et al., 2016). Furthermore, the results show that aboveground biomass, which increases with
tree age and height, was significant for the community compositions of salticid spiders. A study
conducted in European spruce forests also confirmed the importance of tree age on spider
assemblages (Purchart et al., 2013). This synergizes with the results of this study and the
investigation of Floren et al. (2011), which revealed tree age as an important factor for canopy
spiders in Southeast Asian rainforests. Lastly, the land use intensity index LUI, derived from
frequencies of fertilization, herbicide spraying and planted oil palms/rubber trees (Brinkmann
et al., 2019) was significant for the investigated assemblages of arboreal jumping spiders.
However, the statistical effect is biased by the fact that LUI for all forest plots was set to 0 by
Brinkmann et al. (2019) (Appendix, Table A1), which leaves no variation among forest plots
and increases the LUI gradient of the other land use systems relative to forest. Moreover, LUI
is not an independent environmental variable per se, as land use change is part of the index as
the number of planted palms/trees. A significant correlation with my data is therefore not
surprising. However, I decided to keep LUI as an explanatory variable in the light of
comparability, as communities of many non-canopy taxa investigated in the ‘EFForTS’ project
respond to it (Drescher, pers. comm).
Overall, I assumed a negative effect of habitat simplification and changing temperatures on the
diversity of salticid spider communities. Even though the presented results hint to the
importance of habitat structure, the low explanatory power averts clear dependencies between
the analyzed environmental variables and the diversity of jumping spider communities.
Additionally, the expected effect of temperature on salticid spiders could not be proven. This
clearly demonstrates the complexity of the investigated systems and moreover that there are
more unrevealed environmental factors that lead to the observed changes in community
compositions between monocultures and more natural systems.

25
Community phylogenetics of arboreal jumping spiders
In my second hypothesis I expected that lowland rainforest transformation to monocultures
would result in habitat filtering as the main mechanism in the community assembly of canopy
salticids.
Low phylogenetic diversity observed in oil palm and rubber (Fig. 10) suggests that jumping
spider communities may have lower phenotypic diversity in monocultures. This is congruent
with effects of land use on the phylogenetic diversity in bee and plant communities (Grab et al.,
2019; Turley et al., 2016). Conversely, forest and in particular jungle rubber had higher
phylogenetic diversity which might hint to less overlap in functional traits and a potential
increase in the contribution of species to ecosystem functions via niche complementarity
(Srivastava et al., 2012). Results for the nearest taxon index (NTI) revealed phylogenetically
clustered communities in oil palm and suggest environmental filtering as the predominant
process that structures communities (Fig. 11). The rapidly altered environment in oil palm
plantations might function as a filter through which only closely related species can pass
(Srivastava et al., 2012). Interestingly, this effect was not observed in rubber plantations and
suggests the peculiarity of oil palm plantations which is supported by the clearly different
species compositions in oil palm compared to the other land use systems (Fig. 8). On the other
hand, NTI for jumping spider communities in jungle rubber suggested phylogenetic
overdispersion and therefore competition as the main factor influencing community assembly
of salticid spiders. This contradicts the general assumption that frequent disturbances of
moderate intensity are associated with low levels of interspecific competition, as proposed in
the intermediate disturbance hypothesis IDH (e.g. Connel, 1978; Catford et al., 2012).
Communities in forest showed random assemblies based on both NTI and NRI. According to
NRI, assemblages in rubber were marginally significant towards phylogenetic overdispersion
which hints to competition as the structuring mechanism of community assembly. This
contrasts with the findings of habitat filtering in the community assembly of oil palm and my
assumption of phylogenetically clustered communities in monoculture plantations. The
contradicting results for rubber and jungle rubber demonstrate the difficulty to draw meaningful
conclusions on the community assembly based on NRI and NTI. In fact, recent literature shows
that both metrics are far from undisputed as measures of community assembly. Narwani et al.
(2011) criticized the categorical nature of assumptions underlying NRI and NTI. The
assumptions that environmental filtering infers phylogenetic and phenotypic clustering while
competition infers phylogenetic and phenotypic (over-)dispersion, may be unwarranted, as
habitat filtering and competition can interact with each other by additive or opposing effects

26
(Gerhold et al., 2015; Mayfield & Levine, 2010). Thus, my second hypothesis has to be
rejected. Mainly the inexplicable results in rubber accompanied by the recent criticism of NRI
and NTI give cause to question the validity of the used indices to answer my research questions,
despite the fact that I observed evidence for phylogenetically clustered communities in oil palm
plantations.
Conclusion
This thesis reveals how rainforest transformation to monocultures is affiliated with reduced
Salticid spider richness and diversity, altered community composition but unchanged
abundance. Interestingly, the data indicated a positive effect of intermediate disturbance along
the lines of the intermediate disturbance hypothesis. However, as jungle rubber is continuously
transformed to land uses of higher revenue, it is unlikely that this type of agroforestry will
constitute a conservation refuge for canopy jumping spiders in Jambi Province or elsewhere.
Habitat simplification showed an overall minor impact on the observed shifts in salticid spider
communities between monocultures and more natural systems and deviations in temperature
had no impact at all. Community assembly patterns could not be revealed beyond reasonable
doubt. A variety of studies within the EfforTS project have targeted the importance of primary
forest and jungle rubber to preserve diversity of various taxa and ecosystem functions in the
tropical landscapes of Jambi (Paoletti, 2018, Drescher et al., 2016, Grass et al., 2020). My thesis
adds to the previous work in EFForTS by showing the impact of forest transformation on the
diversity and community assembly on the most diverse spider family worldwide.

27
Statement of Authorship
I confirm that the work presented in this thesis titled “Diversity and community assembly
structure of canopy jumping spiders (Araneae: Salticidae) across a land use gradient in Jambi,
Sumatra”, has been performed and interpreted solely by myself.
Except where specific references are made in the main text of the thesis, this thesis contains no
material extracted in whole or part from a thesis, dissertation or research paper presented by me
for another degree or diploma. No other person’s work (published or unpublished) has been
used without due acknowledgement in the main text of this thesis. This thesis has not been
submitted for the award of any other degree or diploma in any other tertiary institution.
I confirm that the printed copies are identical to the electronic ones.
Göttingen, March 24, 2020
André Junggebauer

28
References
Achard, F. Determination of deforestation rates of the world’s humid tropical forests.
Science 297, 999–1002 (2002).
Akinwande, M. O., Dikko, H. G. & Samson, A. Variance Inflation Factor: As a condition
for the Inclusion of Suppressor Variable(s) in Regression Analysis. OJS 05, 754–767
(2015).
Badan Pusat Statistik. 2014 Jambi Dalam Angka 2014. Jambi, Indonesia. See
http://jambiprov.go.id.
Barret Schloerke, Jason Crowley, Di Cook, Francois Briatte, Moritz Marbach, Edwin Tho
en, Amos Elberg and Joseph Larmarange. GGally: Extension to 'ggplot2'. R package versi
on 1.4.0.https://CRAN.R-project.org/package=GGally (2018).
Berkelmann, Dirk & Schneider, Dominik & Engelhaupt, Martin & Heinemann, Melanie &
Christel, Stephan & Wijayanti, Marini & Meryandini, Anja & Daniel, Rolf. How rainforest
conversion to agricultural systems in Sumatra (Indonesia) affects active soil bacterial
communities. Frontiers in Microbiology. 9. 2381 (2018). 10.3389/fmicb.2018.02381.
Blanchet, F. G., Legendre, P. & Borcard, D. Forward selection of explanatory variables.
Ecology 89, 2623–2632 (2008).
Blüthgen, Nico & Dormann, Carsten & Prati, Daniel & Klaus, Valentin & Kleinebecker,
Till & Hölzel, Norbert & Alt, Fabian & Boch, Steffen & Gockel, Sonja & Andreas, Hemp
& Müller, Jörg & Nieschulze, J. & Renner, Swen & Schöning, Ingo & Schumacher, Uta &
Socher, Stephanie & Wells, Konstans & Birkhofer, Klaus & Buscot, Francois & Weisser,
Wolfgang. A quantitative index of land-use intensity in grasslands: Integrating mowing,
grazing and fertilization. Basic and Applied Ecology. 13. 207-220 (2012).
10.1016/j.baae.2012.04.001.

29
Breidenbach, Natalie & Rahayu, Sri & Siregar, Iskandar & Siregar, Ulfah & Hamzah, &
Finkeldey, Reiner. Genetic diversity of dominant plant species in tropical land-use systems
in Sumatra, Indonesia. Tropical Conservation Science. 11, (2018). doi:194008291881390.
10.1177/1940082918813908.
Brinkmann, Nicole & Schneider, Dominik & Sahner, Josephine & Ballauff, Johannes &
Edy, Nur & Barus, Henry & Irawan, Bambang & Budi, Sri Wilarso & Qaim, Matin &
Daniel, Rolf & Polle, Andrea. Intensive tropical land use massively shifts soil fungal
communities. Scientific Reports. 9 (2019). 10.1038/s41598-019-39829-4.
Cadotte, M. W., Cardinale, B. J. & Oakley, T. H. Evolutionary history and the effect of
biodiversity on plant productivity. Proceedings of the National Academy of Sciences 105,
17012–17017 (2008).
Catford, Jane & Daehler, Curtis & Murphy, Helen & Sheppard, Andy & Hardesty, Britta
& Westcott, David & Rejmanek, Marcel & Bellingham, Peter & Pergl, Jan & Horvitz, Carol
& Hulme, Philip. The intermediate disturbance hypothesis and plant invasions:
Implications for species richness and management. Perspectives in Plant Ecology,
Evolution and Systematics. 14 (2012). 231-241. 10.1016/j.ppees.2011.12.002.
Chen, K.-C. & Tso, I.-M. Spider diversity on Orchid island, Taiwan: A comparison between
habitats receiving different degrees of human disturbance. Zoological Studies 14 (2004).
Clough, Yann & Krishna, Vijesh & Corre, Marife & Darras, Kevin & Denmead, Lisa &
Meijide, Ana & Moser, Stefan & Musshoff, Oliver & Steinebach, Stefanie & Veldkamp,
Edzo & Allen, Kara & Barnes, Andrew & Breidenbach, Natalie & Brose, Ulrich & Buchori,
Damayanti & Daniel, Rolf & Finkeldey, Reiner & Harahap, Idham & Hertel, Dietrich &
Scheu, S. Land-use choices follow profitability at the expense of ecological functions in
Indonesian smallholder landscapes. Nature Communications. 28 (2016).
10.1038/ncomms13137.

30
Connell, J. H. Diversity in tropical rain forests and coral reefs. Science 199, 1302–1310
(1978).
Dalton, S. Spiders: the ultimate predators. Firefly Books. 1-208 (2008).
Davis, A. L. V. & Philips, T. K. Effect of Deforestation on a Southwest Ghana dung beetle
assemblage (Coleoptera: Scarabaeidae) at the periphery of Ankasa Conservation Area.
Environmental Entomology 34, 8 (2005).
Diamond, J.M. Assembly of species communities. In: Diamond, J.M. and Cody, M.L., Eds.,
Ecology and Evolution of Communities, Harvard University Press, Boston, 342-344
(1975).
Drescher, Jochen & Rembold, Katja & Allen, Kara & Beckschäfer, Philip & Buchori,
Damayanti & Clough, Yann & Faust, Heiko & Fauzi, Anas & Gunawan, Dodo & Hertel,
Dietrich & Irawan, Bambang & Jaya, I Nengah & Klarner, Bernhard & Kleinn, Christoph
& Knohl, Alexander & Kotowska, Martyna & Krashevska, Valentyna & Krishna, Vijesh &
Leuschner, Christoph & Scheu, S.. Ecological and socio-economic functions across tropical
land use systems after rainforest conversion. Philosophical Transactions of the Royal
Society B: Biological Sciences. 371 (2016). 20150275. 10.1098/rstb.2015.0275.
Ehbrecht, M., Schall, P., Ammer, C. & Seidel, D. Quantifying stand structural complexity
and its relationship with forest management, tree species diversity and microclimate.
Agricultural and Forest Meteorology 242, 1–9 (2017).
Erwin, T. L. Tropical Forests: Their richness in Coleoptera and other arthropod species.
The Coleopterists Bulletin 36, 74–75 (1982).
Faith, D. P. Conservation evaluation and phylogenetic diversity. Biological Conservation
61, 1–10 (1992).
Fittkau, E. J. & Klinge, H. On biomass and trophic structure of the Central Amazonian Rain
Forest ecosystem. Biotropica 5, 2 (1973).

31
Flint, E. P. Changes in land use in South and Southeast Asia from 1880 to 1980: A data
base prepared as part of a coordinated research program on carbon fluxes in the tropics.
Chemosphere 29, 1015–1062 (1994).
Floren, A. & Deeleman-Reinhold, C. Diversity of arboreal spiders in primary and disturbed
tropical forest. Journal of Arachnology 33, 323–333 (2005).
Floren, Andreas & Müller, Tobias & Deeleman-Reinhold, Christa & Linsenmair, K.
Eduard. Effects of forest fragmentation on canopy spider communities in SE-Asian rain
forests. Ecotropica. 17. 15-26 (2011).
Folmer O, Black M, Hoeh W, Lutz R, Vrijenhoek R (1994) DNA primers for
amplification of mitochondrial cytochrome c oxidase subunit I from diverse metazoan
invertebrates. Molecular Marine Biology and Biotechnology, 3, 294–299 2
Gerhold, P., Cahill, J. F., Winter, M., Bartish, I. V. & Prinzing, A. Phylogenetic patterns
are not proxies of community assembly mechanisms (they are far better). Funct Ecol 29,
600–614 (2015).
Gillespie, R. Community assembly through adaptive radiation in Hawaiian spiders. Science
303, 356–359 (2004).
Gotelli, N. J. & Entsminger, G. L. Swap and fill algorithms in null model analysis:
rethinking the knight’s tour. Oecologia 129, 281–291 (2001).
Gouyon, A., de Foresta, H. & Levang, P. Does ‘jungle rubber’ deserve its name? An
analysis of rubber agroforestry systems in southeast Sumatra. Agroforest Syst 22, 181–206
(1993).
Grab, Heather & Branstetter, Michael & Amon, Nolan & Urban-Mead, Katherine & Park,
Mia & Gibbs, Jason & Blitzer, Eleanor & Poveda, Katja & Loeb, Gregory & Danforth,
Bryan. Agriculturally dominated landscapes reduce bee phylogenetic diversity and
pollination services. Science. 363. 282-284 (2019). 10.1126/science.aat6016.

32
Grass, Ingo & Kubitza, Christoph & Krishna, Vijesh & Corre, Marife & Musshoff, Oliver
& Pütz, Peter & Drescher, Jochen & Rembold, Katja & Ariyanti, Eka & Barnes, Andrew
& Brinkmann, Nicole & Brose, Ulrich & Brümmer, Bernhard & Buchori, Damayanti &
Daniel, Rolf & Darras, Kevin & Faust, Heiko & Fehrmann, Lutz & Hein, Jonas & Wollni,
Meike.. Trade-offs between multifunctionality and profit in tropical smallholder
landscapes. Nature Communications. 11 (2020). 1186. 10.1038/s41467-020-15013-5.
Halaj, J., Ross, D. W. & Moldenke, A. R. Importance of habitat structure to the arthropod
food-web in Douglas-fir canopies. Oikos 90, 139–152 (2000).
Hall, T.A. BioEdit: a user-friendly biological sequence alignment editor and analysis
program for Windows 95/98/NT. Nucl. Acids. Symp. Ser. 41:95-98 (1999).
Hedin, M. C. & Maddison, W. P. A Combined Molecular Approach to Phylogeny of the
Jumping Spider Subfamily Dendryphantinae (Araneae: Salticidae). Molecular
Phylogenetics and Evolution 18, 386–403 (2001).
Hill, M. O. Diversity and Evenness: A Unifying Notation and Its Consequences. Ecology
54, 427–432 (1973).
Hothorn, T., Bretz, F. & Westfall, P. Simultaneous Inference in General Parametric Models.
Biom. J. 50, 346–363 (2008).
Hsieh, Y.-L., Lin, Y.-S. & Tso, I.-M. Ground spider diversity in the Kenting uplifted coral
reef forest, Taiwan: a comparison between habitats receiving various disturbances.
Biodiversity and Conservation 12, 2173–2194 (2003).
Huelsenbeck, J. P. & Ronquist, F. MRBAYES: Bayesian inference of phylogenetic trees.
Bioinformatics 17, 754–755 (2001).
Jari Oksanen, F. Guillaume Blanchet, Michael Friendly, Roeland Kindt, Pierre Legendre,
Dan McGlinn, Peter R. Minchin, R. B. O'Hara, Gavin L. Simpson, Peter Solymos, M. Henry
H. Stevens, Eduard Szoecs and Helene Wagner (2019). vegan: Community Ecology
Package. R package version 2.5-6. https://CRAN.R-project.org/package=vegan

33
Katayama, Motoki & Kishimoto, Keiko & Tanaka, Hiroshi & Endo, Tomoji & Hashimoto,
Yoshiaki & Yamane, Seiki & Itioka, Takao. Negative correlation between ant and spider
abundances in the canopy of a Bornean Tropical Rain Forest. Biotropica. 47 (2015).
10.1111/btp.12208.
Kembel, Steven & Cowan, Peter & Helmus, Matthew & Cornwell, William & Morlon,
Helene & Ackerly, David & Blomberg, Simone & Webb, Campbell. Picante: R tools for
integrating phylogenies and ecology. Bioinformatics (Oxford, England). 26. 1463-4 (2010).
10.1093/bioinformatics/btq166.
Kotowska, M. M., Leuschner, C., Triadiati, T., Meriem, S. & Hertel, D. Quantifying above-
and belowground biomass carbon loss with forest conversion in tropical lowlands of
Sumatra (Indonesia). Glob Change Biol 21, 3620–3634 (2015).
Land, M. F. & Nilsson, D.-E. Animal eyes. (Oxford University Press, 2012).
Macarthur, R. & Levins, R. The limiting similarity, convergence, and divergence of
Coexisting Species. The American Naturalist 101, 377–385 (1967).
Margono, Belinda & Potapov, Peter & Turubanova, Svetlana & Stolle, Fred & Hansen,
Matthew. Primary forest cover loss in Indonesia over 2000–2012. Nature Climate Change.
4 (2014). 730-735. 10.1038/nclimate2277.
Mayfield, M. M. & Levine, J. M. Opposing effects of competitive exclusion on the
phylogenetic structure of communities: Phylogeny and coexistence. Ecology Letters 13,
1085–1093 (2010).
Mazzia, C., Pasquet, A., Caro, G., Thénard, J., Cornic, JF., Hedde, M., Capowiez, Y. The
impact of management strategies in apple orchards on the structural and functional diversity
of epigeal spiders. Ecotoxicology 24, 616–625 (2015).

34
Meijaard, Erik & Sheil, Douglas & Nasi, Robert & Augeri, D. & Rosenbaum, Barry &
Iskandar, Djoko T & Setyawati, Titiek & Lammertink, Martjan & Rachmatika, Ike &
Wong, Anna & Soehartono, Tonny & Stanley, Scott & O'Brien, Timothy. Life after
logging: Reconciling wildlife conservation and production forestry in Indonesian Borneo
(2005).
Meijide, Ana & Badu, Chandra & Moyano, Fernando & Tiralla, Nina & Gunawan, Dodo
& Knohl, Alexander. Impact of forest conversion to oil palm and rubber plantations on
microclimate and the role of the 2015 ENSO event. Agricultural and Forest Meteorology.
252 (2018). 208-219. 10.1016/j.agrformet.2018.01.013.
Meineke, E. K., Holmquist, A. J., Wimp, G. M. & Frank, S. D. Changes in spider
community composition are associated with urban temperature, not herbivore abundance.
J Urban Ecol 3, juw010 (2017).
Narwani, A., Matthews, B., Fox, J. & Venail, P. Using phylogenetics in community
assembly and ecosystem functioning research. Funct Ecol 29, 589–591 (2015).
Okuda, Toshinori & Suzuki, Mariko & Adachi, Naoki & Quah, Eng & Hussein, Nor &
Manokaran, N. Effect of selective logging on canopy and stand structure and tree species
composition in a lowland dipterocarp forest in peninsular Malaysia. Forest Ecology and
Management. 175 (2003). 297-320. 10.1016/S0378-1127(02)00137-8.
Paoletti, Alessio & Darras, Kevin & Jayanto, Herdhanu & Grass, Ingo & Kusrini, Mirza &
Tscharntke, Teja. Amphibian and reptile communities of upland and riparian sites across
Indonesian oil palm, rubber and forest. Global Ecology and Conservation. 16:e00492
(2018). doi: 10.1016/j.gecco.2018.e00492.
Pfeiffer, M., Cheng Tuck, H. & Chong Lay, T. Exploring arboreal ant community
composition and co-occurrence patterns in plantations of oil palm Elaeis guineensis in
Borneo and Peninsular Malaysia. Ecography 31, 21–32 (2008).

35
Pinkus, Miguel & León-Cortés, J.L. & Ibarra-Núñez, Guillermo. Erratum: Spider diversity
in a tropical habitat gradient in Chiapas, Mexico (Diversity and Distributions (2006) 12
(61-69)). 12. 10.1111/j.1366-9516.2006.00246.x.
Puillandre, N., Lambert, A., Brouillet, S. & Achaz, G. ABGD, Automatic Barcode Gap
Discovery for primary species delimitation: ABGD, Automatic Barcode Gap Discovery.
Molecular Ecology 21, 1864–77 (2011).
Purchart, L., Tuf, I. H., Hula, V. & Suchomel, J. Arthropod assemblages in Norway spruce
monocultures during a forest cycle – A multi-taxa approach. Forest Ecology and
Management 306, 42–51 (2013).
Ramos, D. Checklist of Spiders (Arachnida: Araneae) of Indonesia and New Guinea (2020).
Available at: https://www.uni-goettingen.de/de/handbooks+and+guides/605977.html.
Ramos, D., M. Lia, S. Scheu, and J. Drescher. A guide to the spiders of Jambi (Sumatra,
Indonesia) - Identification key to common families and images of the EFForTS collection
(2020). Version 1.0, June 2019 Available at: https://www.uni-
goettingen.de/de/handbooks+and+guides/605977.html.
Ritchie, M.E., Phipson, B., Wu, D., Hu, Y., Law, C.W., Shi, W., and Smyth, G.K. Limma
powers differential expression analyses for RNA-sequencing and microarray studies.
Nucleic Acids Research 43(7) (2015).
Sala, O. E. Global Biodiversity Scenarios for the Year 2100 Science 287, 1770–
1774 (2000).
Samways, M. J. Insect diversity conservation. Cambridge University Press (2005).
Schliep, K. P. phangorn: phylogenetic analysis in R. Bioinformatics 27, 592–593 (2011).
Shapiro, S. S. & Wilk, M. B. An analysis of variance test for normality (complete samples).
Biometrika 52, 591–611 (1965).

36
Shochat, Eyal & Stefanov, William & Whitehouse, M. & Faeth, Stanley. Urbanization and
Spider Diversity: Influences of human modification of habitat structure and productivity.
Ecological Applications. 14, 268-280 (2004). 10.1890/02-5341.
Simon, C., Francesco, F., Beckenbach, A., Crespi, B., Liu, H., Flook P. Evolution,
weighting, and phylogenetic utility of mitochondrial gene sequences and a compilation of
conserved Polymerase Chain Reaction primers. Annals of the Entomological Society of
America 87, 651–701 (1994).
Smyth, G. K. Linear models and empirical Bayes methods for assessing differential
expression in microarray experiments. Statistical Applications in Genetics and Molecular
Biology 3, 1–25 (2004).
Sodhi, Navjot & Koh, Lian & Brook, Barry & Ng, Peter. Southeast Asian biodiversity: An
impending disaster. Trends in Ecology and Evolution. 19, 654-660 (2004).
10.1016/j.tree.2004.09.006.
Srivastava, D. S., Cadotte, M. W., MacDonald, A. A. M., Marushia, R. G. & Mirotchnick,
N. Phylogenetic diversity and the functioning of ecosystems. Ecology Letters 15, 637–648
(2012).
Stork NE, Grimbacher PS, Beetle assemblages from an Australian tropical rainforest show
that the canopy and the ground strata contribute equally to biodiversity. Proc R Soc B 273,
1969–75 (2006)
Tavaré S. Some probabilistic and statistical problems in the Analysis of DNA sequences.
Lectures on Mathematics in the Life Sciences. 17, 57–86 (1986).
Tsai, Z.-I., Huang, P.-S. & Tso, I.-M. Habitat management by aboriginals promotes high
spider diversity on an Asian tropical island. Ecography 29, 84–94 (2006).

37
Thompson, J. D., Higgins, D. G., & Gibson, T. J. Clustal W: improving the sensitivity of
progressive multiple sequence alignment through sequence weighting, position-specific
gap penalties and weight matrix choice. Nucleic acids research, 22, 4673–4680 (1994).
https://doi.org/10.1093/nar/22.22.4673
Tukey, J. W. Comparing individual means in the analysis of variance. Biometrics 5, 99
(1949).
Turley, N. E. & Brudvig, L. A. Agricultural land-use history causes persistent loss of plant
phylogenetic diversity. Ecology 97, 2240–2247 (2016).
Turner, E. C. & Foster, W. A. The impact of forest conversion to oil palm on arthropod
abundance and biomass in Sabah, Malaysia. J. Trop. Ecol. 25, 23–30 (2009).
Vamosi, S. M., Heard, S. B., Vamosi, J. C. & Webb, C. O. Emerging patterns in the
comparative analysis of phylogenetic community structure. Molecular Ecology 18, 572–
592 (2009).
Webb, C. O., Ackerly, D. D., McPeek, M. A. & Donoghue, M. J. Phylogenies and
community Ecology. Annu. Rev. Ecol. Syst. 33, 475–505 (2002).
Whittaker, R. H. Dominance and diversity in land plant communities. Science, New Series
147, 250–260 (1965).
Wilcove, D. S., Giam, X., Edwards, D. P., Fisher, B. & Koh, L. P. Navjot’s nightmare
revisited: logging, agriculture, and biodiversity in Southeast Asia. Trends in Ecology &
Evolution 28, 531–540 (2013).
Wise, D. H. Spiders in ecological webs. (Cambridge University Press, 1993).
doi:10.1017/CBO9780511623431.
World Spider Catalog (2020). World Spider Catalog. Version 21.0 Natural History Museum
Bern, online at http://wsc.nmbe.ch, accessed on {01.03.2020}. doi: 10.24436/2

38
Yamasaki, Takeshi & Hashimoto, Yoshiaki & Endo, Tomoji & Hyodo, Fujio & Itioka,
Takao & Meleng, Paulus. New species of the ant-mimicking jumping spiders, the genus
Myrmarachne MacLeay, 1839 (Araneae: Salticidae) from Sarawak, Borneo. Zootaxa. 4521.
335–356 (2018). 10.11646/zootaxa.4521.3.2.
Yamasaki, Takeshi & Ahmad, Abdul. Taxonomic study of the genus Myrmarachne of
Borneo (Araneae: Salticidae). Zootaxa. 3710. 501-56 (2013). 10.11646/zootaxa.3710.6.1.
Yamasaki, Takeshi & Edwards, G. (2013). The genus Myrmarachne (Araneae, Salticidae)
in Flores, Indonesia. ZooKeys. 299. 1-20. 10.3897/zookeys.299.4970.
Zemp, Delphine & Ehbrecht, Martin & Seidel, Dominik & Ammer, Christian & Craven,
Dylan & Erkelenz, Joshua & Irawan, Bambang & Sundawati, Leti & Hölscher, Dirk &
Kreft, Holger. Mixed-species tree plantings enhance structural complexity in oil palm
plantations. Agriculture Ecosystems & Environment. 283 (2019).
10.1016/j.agee.2019.06.003.
Zheng, G., Li, S. & Yang, X. Spider diversity in canopies of Xishuangbanna rainforest
(China) indicates an alarming juggernaut effect of rubber plantations. Forest Ecology and
Management 338, 200–207 (2015).
39
Appendix
Table A1: Environmental variables for mean temperature (°C), relative humidity (%), Canopy
openness (%), SSCI, land use intensity and aboveground biomass (Mg/ha) measured in various
EFForTS subprojects for the investigated core plots.
Table A2: Community matrix with counts for all 70 identified morphospecies of jumping
spiders (Araneae: Salticidae) in the 32 investigated plots.
Table A3: Overview of (non-)successfully amplified sequences of 152 jumping spider
individuals for the 28S and COI gene regions and species / genus identity for each sequence
according to the nucleotide database provided by the National Center for Biotechnology
Information (NCBI) using the online version of the Basic Local Alignment Search Tool
(BLAST).
Table A4: Automatic Barcode Gap Discovery (ABGD) grouping results and the resulting set
of 55 jumping spider candidate species used for Bayesian inference tree.
Figure A1: Pearson correlations between all pairs of environmental variables used in the
canonical correspondence analysis (CCA) given as values and scatter plots.
Figure A2: Bayesian inference tree for the alignment of the 28S gene region used for calculation
of Phylogenetic Diversity (PD), Net Relatedness Index (NRI) and Nearest Taxon Index (NTI).

40
Table A1. Set of environmental variables measured in various EFForTS subprojects for the investigated core plots among the four land use systems
forest (F), jungle rubber (J), oil palm (O) and rubber (R) including temperature (°C) (Meijide et al., 2018), relative humidity (%) (Meijide et al., 2018),
canopy openness (%) (Drescher 2016), Stand Structural complexity (SSCI) (unpublished, courtesy of C.D Zemp), land use intensity index (LUI)
(Brinkmann et al., 2019) and aboveground biomass (AGB) (Mg/ha) (Guillaume, 2019). Core plots abbreviations read as e.g. Bukit Duabelas (B) forest
(F) Core plot 1 (1) = BF1.
Core Plot System Mean Temperature [°C]
Mean Humidity [%]
Canopy Openness [%]
SSCI Land Use Intensity
Aboveground Biomass [Mg/ha]
BF1 F 24,5 97,25 2,36 7,96658636 0 230,71
BF2 F 24,48 98,62 3,35 7,2410152 0 262,05
BF3 F 24,42 96,01 2,04 5,98302119 0 305,66
BF4 F 24,85 94,57 2,22 4,69665408 0 370,78
BJ3 J 25,42 91,38 6,39 5,82578912 1,29 129,67
BJ4 J 24,92 94,56 5 7,27426503 1,29 127,73
BJ5 J 25,25 93,32 5,85 7,08820258 1,32 137,9
BJ6 J 25,2 93,09 4,69 8,16455361 1,27 125,63
BO2 O 25,95 88,76 23,41 3,53404987 4,14 72
BO3 O 25,12 92,92 13,29 3,93442672 4,38 98,47
BO4 O 25,45 91,42 12,97 4,23240605 4,95 90,51
BO5 O 25,67 90,86 20,61 3,46767654 2,79 82,35
BR1 R 25,45 91,29 14,49 6,14565827 4,22 77,62
BR2 R 25,53 89,46 12,68 3,91653378 1,67 39,36
BR3 R 25,78 86,9 10,9 3,40427784 4,38 36,19
BR4 R 25,64 89,76 19,43 3,79920161 3,88 46,65
HF1 F 24,88 96,39 2,37 6,01422436 0 364,58
HF2 F 24,91 95,11 2,56 7,20489073 0 320,21

41
HF3 F 24,67 98,1 2,22 7,44659678 0 362,28
HF4 F 24,92 95,47 3,19 7,89024268 0 430,07
HJ1 J 25,37 91,91 11,39 5,98806891 1,4 100,01
HJ2 J 25,06 93,75 6,85 6,60144309 1,12 103,56
HJ3 J 25,13 91,5 6,76 6,80363883 1,1 116,97
HJ4 J 25,13 93,61 7,48 7,27208404 0,95 103,92
HO1 O 25,35 91,12 15,2 3,6413133 4,23 126,23
HO2 O 25,49 91,28 11,8 2,72193373 3,39 124,91
HO3 O 25,18 91,24 11,95 3,02293422 7,87 104,82
HO4 O 25,39 90,94 15,91 3,46611829 6,04 88,27
HR1 R 25,37 92,25 8,18 5,39099789 3 77,14
HR2 R 25,62 90,01 14,76 6,35352644 1,65 48,2
HR3 R 25,4 91,16 15,72 3,99904595 5,12 69,48
HR4 R 25,59 90,4 11,52 5,14686619 2,51 83,86

42
Figure A1: Pearson correlation coefficients between all pairs of environmental variables used in the canonical correspondence analysis (CCA) given
as values and scatter plots. A perfectly linear relationship between two variables is described by a coefficient of 1.
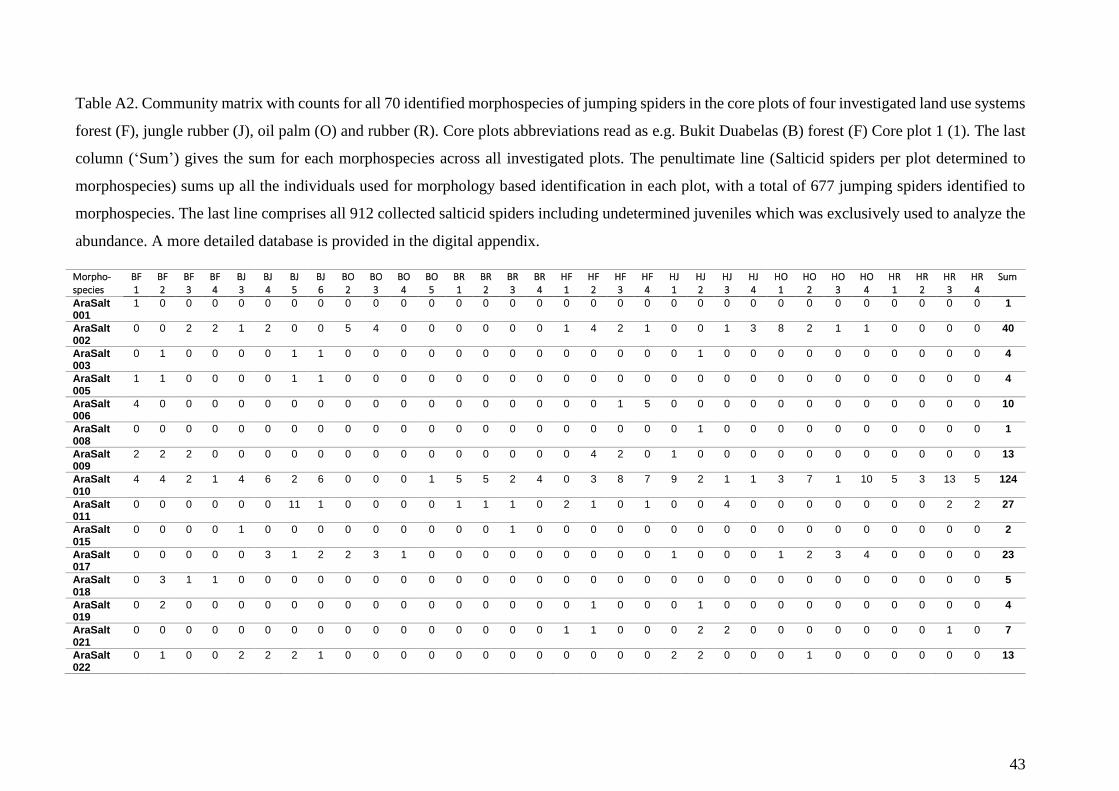
43
Table A2. Community matrix with counts for all 70 identified morphospecies of jumping spiders in the core plots of four investigated land use systems
forest (F), jungle rubber (J), oil palm (O) and rubber (R). Core plots abbreviations read as e.g. Bukit Duabelas (B) forest (F) Core plot 1 (1). The last
column (‘Sum’) gives the sum for each morphospecies across all investigated plots. The penultimate line (Salticid spiders per plot determined to
morphospecies) sums up all the individuals used for morphology based identification in each plot, with a total of 677 jumping spiders identified to
morphospecies. The last line comprises all 912 collected salticid spiders including undetermined juveniles which was exclusively used to analyze the
abundance. A more detailed database is provided in the digital appendix.
Morpho-species
BF1
BF2
BF3
BF4
BJ 3
BJ 4
BJ 5
BJ 6
BO2
BO3
BO4
BO5
BR1
BR2
BR3
BR4
HF1
HF2
HF3
HF4
HJ 1
HJ 2
HJ 3
HJ 4
HO1
HO2
HO3
HO4
HR1
HR2
HR3
HR4
Summ
AraSalt001
1 0 0 0 0 0 0 0 0 0 0 0 0 0 0 0 0 0 0 0 0 0 0 0 0 0 0 0 0 0 0 0 1
AraSalt002
0 0 2 2 1 2 0 0 5 4 0 0 0 0 0 0 1 4 2 1 0 0 1 3 8 2 1 1 0 0 0 0 40
AraSalt003
0 1 0 0 0 0 1 1 0 0 0 0 0 0 0 0 0 0 0 0 0 1 0 0 0 0 0 0 0 0 0 0 4
AraSalt005
1 1 0 0 0 0 1 1 0 0 0 0 0 0 0 0 0 0 0 0 0 0 0 0 0 0 0 0 0 0 0 0 4
AraSalt006
4 0 0 0 0 0 0 0 0 0 0 0 0 0 0 0 0 0 1 5 0 0 0 0 0 0 0 0 0 0 0 0 10
AraSalt008
0 0 0 0 0 0 0 0 0 0 0 0 0 0 0 0 0 0 0 0 0 1 0 0 0 0 0 0 0 0 0 0 1
AraSalt009
2 2 2 0 0 0 0 0 0 0 0 0 0 0 0 0 0 4 2 0 1 0 0 0 0 0 0 0 0 0 0 0 13
AraSalt010
4 4 2 1 4 6 2 6 0 0 0 1 5 5 2 4 0 3 8 7 9 2 1 1 3 7 1 10 5 3 13 5 124
AraSalt011
0 0 0 0 0 0 11 1 0 0 0 0 1 1 1 0 2 1 0 1 0 0 4 0 0 0 0 0 0 0 2 2 27
AraSalt015
0 0 0 0 1 0 0 0 0 0 0 0 0 0 1 0 0 0 0 0 0 0 0 0 0 0 0 0 0 0 0 0 2
AraSalt017
0 0 0 0 0 3 1 2 2 3 1 0 0 0 0 0 0 0 0 0 1 0 0 0 1 2 3 4 0 0 0 0 23
AraSalt018
0 3 1 1 0 0 0 0 0 0 0 0 0 0 0 0 0 0 0 0 0 0 0 0 0 0 0 0 0 0 0 0 5
AraSalt019
0 2 0 0 0 0 0 0 0 0 0 0 0 0 0 0 0 1 0 0 0 1 0 0 0 0 0 0 0 0 0 0 4
AraSalt021
0 0 0 0 0 0 0 0 0 0 0 0 0 0 0 0 1 1 0 0 0 2 2 0 0 0 0 0 0 0 1 0 7
AraSalt022
0 1 0 0 2 2 2 1 0 0 0 0 0 0 0 0 0 0 0 0 2 2 0 0 0 1 0 0 0 0 0 0 13
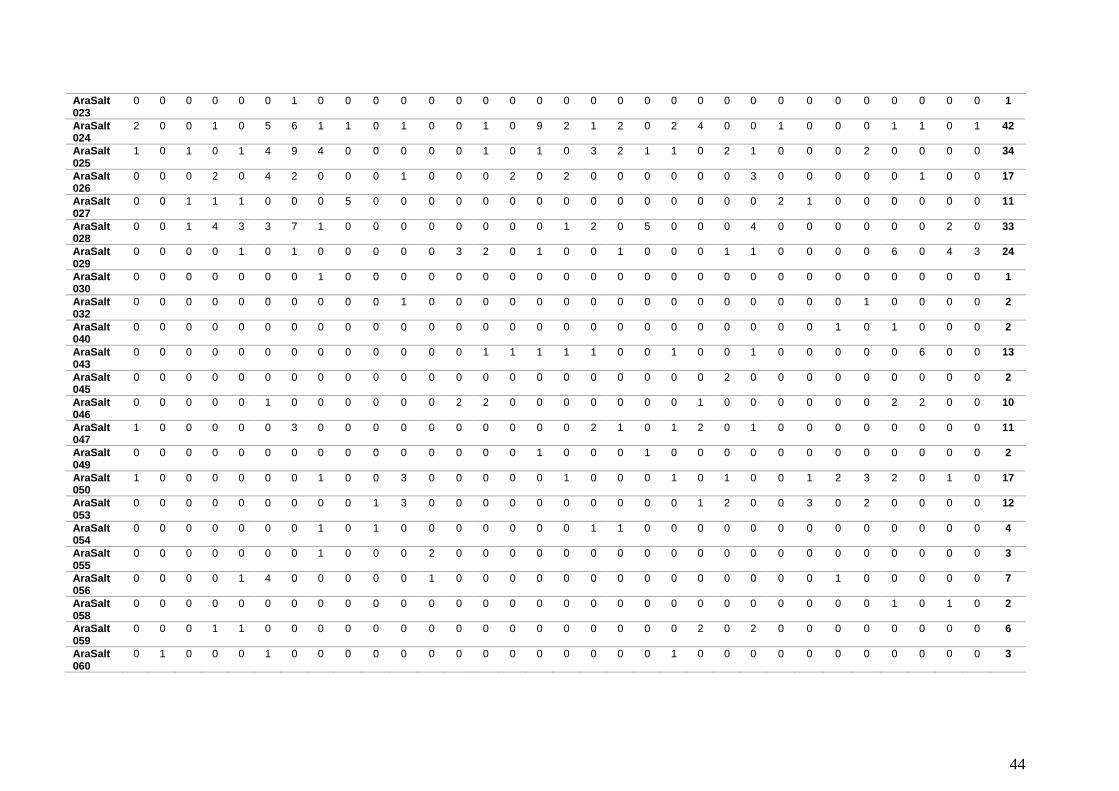
44
AraSalt023
0 0 0 0 0 0 1 0 0 0 0 0 0 0 0 0 0 0 0 0 0 0 0 0 0 0 0 0 0 0 0 0 1
AraSalt024
2 0 0 1 0 5 6 1 1 0 1 0 0 1 0 9 2 1 2 0 2 4 0 0 1 0 0 0 1 1 0 1 42
AraSalt025
1 0 1 0 1 4 9 4 0 0 0 0 0 1 0 1 0 3 2 1 1 0 2 1 0 0 0 2 0 0 0 0 34
AraSalt026
0 0 0 2 0 4 2 0 0 0 1 0 0 0 2 0 2 0 0 0 0 0 0 3 0 0 0 0 0 1 0 0 17
AraSalt027
0 0 1 1 1 0 0 0 5 0 0 0 0 0 0 0 0 0 0 0 0 0 0 0 2 1 0 0 0 0 0 0 11
AraSalt028
0 0 1 4 3 3 7 1 0 0 0 0 0 0 0 0 1 2 0 5 0 0 0 4 0 0 0 0 0 0 2 0 33
AraSalt029
0 0 0 0 1 0 1 0 0 0 0 0 3 2 0 1 0 0 1 0 0 0 1 1 0 0 0 0 6 0 4 3 24
AraSalt030
0 0 0 0 0 0 0 1 0 0 0 0 0 0 0 0 0 0 0 0 0 0 0 0 0 0 0 0 0 0 0 0 1
AraSalt032
0 0 0 0 0 0 0 0 0 0 1 0 0 0 0 0 0 0 0 0 0 0 0 0 0 0 0 1 0 0 0 0 2
AraSalt040
0 0 0 0 0 0 0 0 0 0 0 0 0 0 0 0 0 0 0 0 0 0 0 0 0 0 1 0 1 0 0 0 2
AraSalt043
0 0 0 0 0 0 0 0 0 0 0 0 0 1 1 1 1 1 0 0 1 0 0 1 0 0 0 0 0 6 0 0 13
AraSalt045
0 0 0 0 0 0 0 0 0 0 0 0 0 0 0 0 0 0 0 0 0 0 2 0 0 0 0 0 0 0 0 0 2
AraSalt046
0 0 0 0 0 1 0 0 0 0 0 0 2 2 0 0 0 0 0 0 0 1 0 0 0 0 0 0 2 2 0 0 10
AraSalt047
1 0 0 0 0 0 3 0 0 0 0 0 0 0 0 0 0 2 1 0 1 2 0 1 0 0 0 0 0 0 0 0 11
AraSalt049
0 0 0 0 0 0 0 0 0 0 0 0 0 0 0 1 0 0 0 1 0 0 0 0 0 0 0 0 0 0 0 0 2
AraSalt050
1 0 0 0 0 0 0 1 0 0 3 0 0 0 0 0 1 0 0 0 1 0 1 0 0 1 2 3 2 0 1 0 17
AraSalt053
0 0 0 0 0 0 0 0 0 1 3 0 0 0 0 0 0 0 0 0 0 1 2 0 0 3 0 2 0 0 0 0 12
AraSalt054
0 0 0 0 0 0 0 1 0 1 0 0 0 0 0 0 0 1 1 0 0 0 0 0 0 0 0 0 0 0 0 0 4
AraSalt055
0 0 0 0 0 0 0 1 0 0 0 2 0 0 0 0 0 0 0 0 0 0 0 0 0 0 0 0 0 0 0 0 3
AraSalt056
0 0 0 0 1 4 0 0 0 0 0 1 0 0 0 0 0 0 0 0 0 0 0 0 0 0 1 0 0 0 0 0 7
AraSalt058
0 0 0 0 0 0 0 0 0 0 0 0 0 0 0 0 0 0 0 0 0 0 0 0 0 0 0 0 1 0 1 0 2
AraSalt059
0 0 0 1 1 0 0 0 0 0 0 0 0 0 0 0 0 0 0 0 0 2 0 2 0 0 0 0 0 0 0 0 6
AraSalt060
0 1 0 0 0 1 0 0 0 0 0 0 0 0 0 0 0 0 0 0 1 0 0 0 0 0 0 0 0 0 0 0 3

45
AraSalt061
0 0 0 0 0 0 0 0 0 0 0 0 0 0 0 0 0 0 0 0 0 0 1 0 0 0 0 0 0 0 1 0 2
AraSalt063
0 0 0 1 0 0 0 0 0 0 0 0 0 0 2 0 0 0 0 0 0 0 0 0 0 0 0 0 2 1 0 0 6
AraSalt065
0 0 0 0 0 0 0 0 1 0 1 2 0 0 0 0 0 0 0 0 0 0 0 0 6 4 0 0 0 0 0 0 14
AraSalt066
0 0 0 0 0 0 0 0 0 0 0 0 1 0 1 1 0 0 0 0 0 0 0 0 0 0 0 0 3 1 0 0 7
AraSalt067
0 0 0 0 0 0 0 0 0 0 0 0 0 0 0 0 0 0 0 0 0 0 0 0 0 0 1 0 0 0 0 0 1
AraSalt069
0 0 0 0 0 1 0 2 0 0 0 0 0 0 0 0 0 0 0 0 0 13 2 1 0 0 0 0 0 0 0 0 19
AraSalt073
0 0 0 0 0 0 0 0 0 0 0 0 0 0 0 0 0 0 0 0 1 0 0 0 0 0 0 0 0 0 0 0 1
AraSalt074
0 0 0 0 0 0 0 0 1 0 0 0 0 0 0 0 0 0 0 0 0 0 0 0 0 0 0 0 0 0 0 0 1
AraSalt077
0 0 0 0 0 0 0 0 0 0 0 0 0 0 0 0 0 0 1 0 0 0 0 0 0 0 0 0 0 0 0 0 1
AraSalt078
0 0 0 2 0 0 0 0 0 0 0 0 0 0 0 0 1 0 0 0 0 0 0 0 0 0 0 0 0 0 0 0 3
AraSalt080
0 0 0 0 1 0 1 0 0 2 6 0 0 0 0 0 0 0 1 0 0 0 0 2 6 3 0 2 0 0 0 1 25
AraSalt081
0 0 0 0 0 0 0 0 0 0 1 0 0 0 0 0 0 0 0 0 0 0 0 0 0 0 0 0 0 0 0 0 1
AraSalt082
0 0 0 0 0 0 0 0 0 0 1 0 0 0 0 0 0 0 0 0 0 0 0 0 0 1 0 1 0 0 0 0 3
AraSalt083
0 0 0 0 0 0 0 0 0 0 2 1 0 0 0 0 0 0 0 0 0 0 0 0 0 0 0 3 0 0 0 0 6
AraSalt084
0 0 0 0 0 0 0 0 2 0 0 0 0 0 0 0 0 0 0 0 0 0 0 0 0 0 1 0 0 0 0 0 3
AraSalt086
0 0 0 0 0 0 0 0 1 0 1 1 0 0 0 0 0 0 0 0 0 0 0 0 1 0 1 5 0 0 0 0 10
AraSalt087
0 0 0 0 0 3 0 0 0 0 0 0 0 0 0 0 1 0 1 1 0 0 0 0 0 0 0 0 0 0 0 0 6
AraSalt090
0 0 0 0 0 1 0 0 0 0 0 0 0 0 0 0 0 0 0 0 0 1 0 0 0 0 0 0 0 0 0 0 2
AraSalt091
0 0 0 0 0 0 0 0 0 0 0 0 0 0 0 0 0 0 0 0 0 0 0 0 0 0 1 0 0 0 0 0 1
AraSalt092
0 0 0 1 0 0 0 1 0 0 0 0 0 0 0 0 1 0 3 2 0 0 0 0 0 0 0 0 1 0 0 0 9
AraSalt095
0 0 0 1 0 0 0 0 0 0 0 0 0 0 0 0 0 0 0 0 0 0 0 0 0 0 0 0 0 0 0 1 2
AraSalt098
0 0 0 0 1 0 0 0 0 0 0 0 0 0 0 0 0 0 0 0 0 0 0 0 0 0 0 0 0 0 0 0 1
AraSalt099
0 0 0 0 0 1 0 0 0 0 0 0 0 0 0 0 0 0 0 0 0 0 0 0 0 0 0 0 0 0 0 0 1

46
AraSalt100
0 1 0 0 0 1 0 0 0 0 0 0 0 0 0 0 0 0 0 0 0 0 0 0 0 0 0 0 0 0 0 0 2
AraSalt102
0 0 0 0 0 0 0 0 0 0 0 0 0 0 0 0 0 0 0 0 2 0 0 0 0 0 0 0 0 0 0 0 2
AraSalt104
0 0 0 0 0 1 0 0 0 0 0 0 0 0 0 0 0 0 0 0 0 0 0 0 0 0 0 0 0 0 1 0 2
AraSalt106
0 1 0 0 0 0 0 1 0 0 0 0 0 0 0 0 0 0 0 0 0 0 0 0 0 0 0 0 0 0 0 0 2
AraSalt107
0 1 0 0 0 0 0 0 0 0 0 0 0 0 0 0 0 0 0 0 0 0 0 0 0 0 0 0 0 0 0 0 1
AraSalt108
1 0 0 0 0 0 0 0 0 0 0 0 0 0 0 0 0 0 0 0 0 0 0 0 0 0 0 0 0 0 0 0 1
AraSalt109
0 0 0 0 0 0 0 0 0 0 0 1 2 0 0 0 0 0 0 0 0 0 0 0 0 0 0 0 0 0 0 0 3
AraSalt110
0 0 0 0 0 0 0 0 0 0 1 0 0 0 0 0 0 0 0 0 0 0 0 0 0 0 0 0 0 0 0 0 1
AraSalt111
0 0 0 0 0 1 0 0 0 0 0 0 0 0 0 0 0 0 0 0 0 0 0 0 0 0 0 0 0 0 0 0 1
Salticid spiders per plot determined to morpho-species
18 18 10 18 18 44 48 26 18 11 23 9 14 13 10 18 14 24 26 24 23 33 19 20 28 25 13 34 24 15 26 13 677
Abundance of all Salticid spiders collected (including juveniles)
21 25 15 20 199
500
566
344
20 14 34 9 17 15 13 22 23 31 45 36 333
399
277
288
39 41 23 42 26 28 46 21 912

47
Table A3: Sequencing results for 152 jumping spider individuals for the 28S and COI gene regions. Abbreviations in Voucher-ID read as e.g. Bukit
Duabelas (B), forest (F), core plot (2), fogging location (3), fogging year (2017), Araneae (Ara), Salticidae (Salt), morphospecies 005 (005), replicate
number a particular morphospecies (3) = BF2.3.2017AraSalt005.3. Successful amplifications are shown by the length of the amplicons in base pairs
(bp) for both gene regions COI and 28S, respectively. Each sequence was compared with the nucleotide database provided by the National Center for
Biotechnology Information (NCBI) using the online version of the Basic Local Alignment Search Tool (BLAST) available at
https://blast.ncbi.nlm.nih.gov/Blast.cgi.
family Morphospecies Genus
(BLAST)
Voucher-ID COI [bp]
BLAST hit
[species]
BLAST hit
[Acc.no.]
BLAST hit %
identity
28S [bp]
BLAST hit [species]
BLAST hit
[Acc.no.]
BLAST hit %
identity
region
Salticidae AraSalt005 --- BF2.3A.2017AraSalt005.3 --- --- --- --- --- --- --- --- Bukit Duabelas
Salticidae AraSalt069 --- HJ2.1A.2017AraSalt069.2 --- --- --- --- 805 Simaetha sp. JX145746.1
92.83 Harapan
Salticidae AraSalt102 --- HJ1.3A.2017AraSalt102.2 --- --- --- --- --- --- --- --- Harapan
Salticidae AraSalt106 --- BF2.3A.2017AraSalt106.1 --- --- --- --- --- --- --- --- Bukit Duabelas
Salticidae AraSalt107 --- BF2.3A.2017AraSalt107.1 --- --- --- --- --- --- --- --- Bukit Duabelas
Salticidae AraSalt108 --- BF1.3A.2017AraSalt108.1 --- --- --- --- --- --- --- --- Bukit Duabelas
Salticidae AraSalt110 --- BO4.1A.2017AraSalt110.1
--- --- --- --- --- --- --- --- Bukit Duabelas
Salticidae AraSalt009 Anarrhotus (Plexippinae)
HJ1.2A.2017AraSalt009.3 1070 Anarrhotus fossulatus EU815605.1 96 766 Anarrhotus fossulatus
EU815492.1
99.87 Harapan

48
Salticidae AraSalt010 Anarrhotus (Plexippinae)
HJ1.1A.2017AraSalt010.1 910 Anarrhotus fossulatus EU815605.1 95.82 ---
Harapan
Salticidae AraSalt017 Anarrhotus (Plexippinae)
HO4.2A.2017AraSalt017.1
1076 Anarrhotus fossulatus EU815605.1 95.79 714 Anarrhotus fossulatus
EU815492.1
99.87 Harapan
Salticidae AraSalt017 Anarrhotus (Plexippinae)
HO2.1A.2017AraSalt017.2
1060 Anarrhotus fossulatus EU815605.1 95.79 714 Anarrhotus fossulatus
EU815492.1
99.86 Harapan
Salticidae AraSalt017 Anarrhotus (Plexippinae)
HO2.3A.2017AraSalt017.3
1092 Anarrhotus fossulatus EU815605.1 95.89 714 Anarrhotus fossulatus
EU815492.1
99.86 Harapan
Salticidae AraSalt003 Bathippus (Euphoyrina)
BJ5.3.2017AraSalt003.2 678 Zora spinimana KY270091.1 87.42 826 Bathippus pahang
KC615401
99.63 Bukit Duabelas
Salticidae AraSalt002 Bavia (Hisponinae)
BJ4.1.2017AraSalt002.1 710 Bavia cf. aericeps EU815603 94.12 802 Bavia cf. aericeps EU815490
96.40 Bukit Duabelas
Salticidae AraSalt002 Bavia (Hisponinae)
BF4.2A.2017AraSalt002.2 1113 Bavia cf. aericeps EU815603 92,29 824 Bavia cf. aericeps EU815490
96,66 Bukit Duabelas
Salticidae AraSalt002 Bavia (Hisponinae)
BF4.2A.2017AraSalt002.3 976 Bavia cf. aericeps EU815603 92.34 818 Bavia cf. aericeps EU815490
96.66 Bukit Duabelas
Salticidae AraSalt090 Carrhotus (Heliophaninae)
BJ4.1.2017AraSalt090.1 1102 Carrhotus sp. AY297408.1 90.33 814 Carrhotus xanthogramma
JN817037.1
98.49 Bukit Duabelas
Salticidae AraSalt090 Carrhotus (Heliophaninae)
HJ2.3A.2017AraSalt090.2 1091 Carrhotus sp. AY297408.1 90.26 799 Carrhotus xanthogramma
JN817037.1
98.98 Harapan
Salticidae AraSalt043 Cytaea (Euphorinae)
HR2.2A.2017AraSalt043.2 1044 Cytaea oreophila KC615665.1 99.08 760 Cytaea oreophila KC615422.1
98.68 Harapan
Salticidae AraSalt043 Cytaea (Euphorinae)
HR2.3A.2017AraSalt043.3 685 Selenops sp. HM575969.1 87.79 759 Cytaea oreophila KC615422.1
98.39 Harapan
Salticidae AraSalt043 Emathis (Euophryinae)
HF2.1A.2017AraSalt043.1 699 Evarcha arcuata KY269941.1 88.91 814 Emathis gombak KC615424.1
98.87 Harapan

49
Salticidae AraSalt010 Epeus (Plexippinae)
HJ1.3A.2017AraSalt010.2 694 Epeus alboguttatus NC_042829.1 91.03 696 Epeus sp. AY297248.1
98.56 Harapan
Salticidae AraSalt010 Epeus (Plexippinae)
HJ1.3A.2017AraSalt010.3 922 Epeus alboguttatus NC_042829.1 90.63 --- --- --- --- Harapan
Salticidae AraSalt015 Epeus (Plexippinae)
BR3.3A.2017AraSalt015.1 1101 Epeus sp. AY297378.1 93.78 818 Epeus sp. AY297248.1
100 Bukit Duabelas
Salticidae AraSalt015 Epeus (Plexippinae)
BJ3.2.2017AraSalt015.2 1106 Epeus sp. AY297378.1 94.09 796 Epeus sp. AY297248.1
99.73 Bukit Duabelas
Salticidae AraSalt003 equivocal (likely new sequence)
BJ6.2.2017AraSalt003.1 1113 Myrmarachne japonica JN817283 87,01 827 Bathippus pahang
KC615401
99.25 Bukit Duabelas
Salticidae AraSalt005 equivocal (likely new sequence)
BJ6.2.2017AraSalt005.1 1089 Noegus aff. Rufus AY297372.1 87.30 768 Heratemita alboplagiata
AF327934
91.25 Bukit Duabelas
Salticidae AraSalt005 equivocal (likely new sequence)
BF1.1A.2017AraSalt005.2 1022 Myrmarachne endoi LC193964.1 87.31 --- --- --- --- Bukit Duabelas
Salticidae AraSalt006 equivocal (likely new sequence)
HF4.2A.2017AraSalt006.1 684 Cocalus sp. KU893267.1 88.73 794 Gelotia cf. bimaculata
KM033158.1
94.71 Harapan
Salticidae AraSalt008 equivocal (likely new sequence)
HJ2.3A.2017AraSalt008.1 1097 Cf. Thorelliola sp. AY297393.1 89.76 753 Hakka himeshimensis
JN817058.1
95.64 Harapan
Salticidae AraSalt009 equivocal (likely new sequence)
BF3.3A.2017AraSalt009.1 714 Myrmarachne spissa KY587560.1 89.02 788 Pancorius sp. JX145780.1
98.26 Bukit Duabelas
Salticidae AraSalt009 equivocal (likely new sequence)
BF3.3A.2017AraSalt009.2 683 Myrmarachne robusta MK154679.1 89.93 759 Pancorius sp. JX145780.1
99.85 Bukit Duabelas
Salticidae AraSalt011 equivocal (likely new sequence)
BJ5.1.2017AraSalt011.2 723 Sitticus floricola KY269335.1 90.87 707 Heratemita alboplagiata
AF327934
89.92 Bukit Duabelas
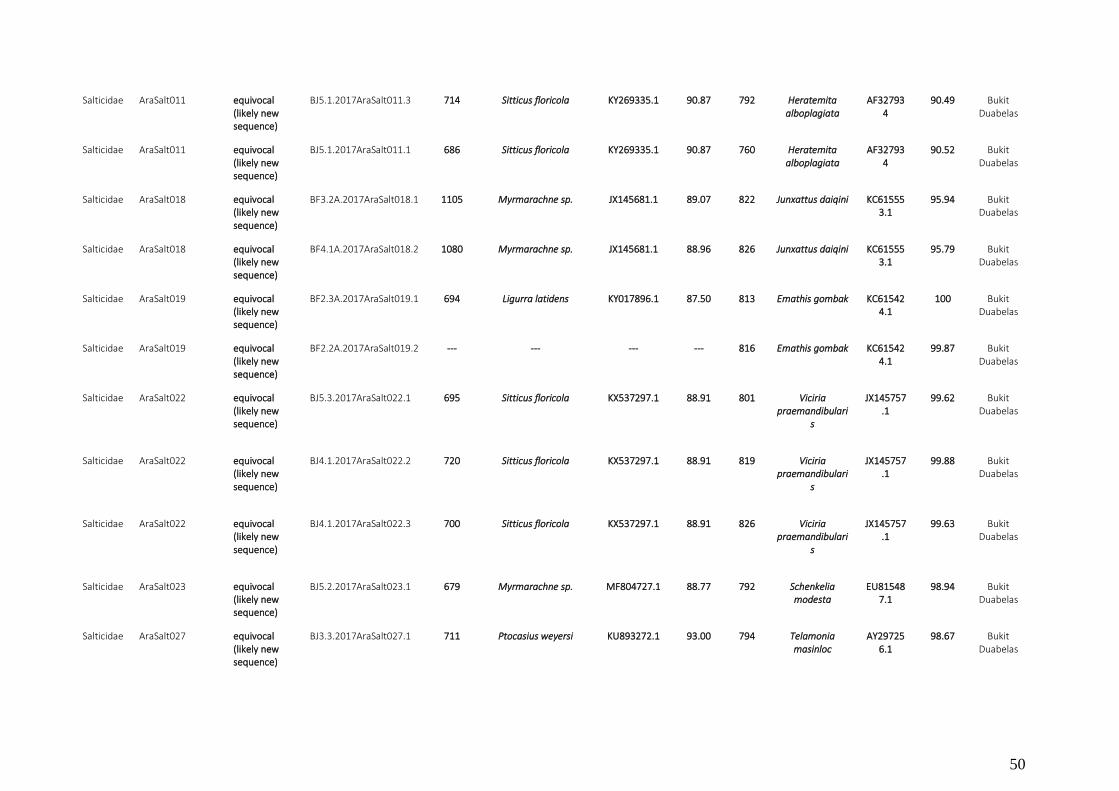
50
Salticidae AraSalt011 equivocal (likely new sequence)
BJ5.1.2017AraSalt011.3 714 Sitticus floricola KY269335.1 90.87 792 Heratemita alboplagiata
AF327934
90.49 Bukit Duabelas
Salticidae AraSalt011 equivocal (likely new sequence)
BJ5.1.2017AraSalt011.1 686 Sitticus floricola KY269335.1 90.87 760 Heratemita alboplagiata
AF327934
90.52 Bukit Duabelas
Salticidae AraSalt018 equivocal (likely new sequence)
BF3.2A.2017AraSalt018.1 1105 Myrmarachne sp. JX145681.1 89.07 822 Junxattus daiqini KC615553.1
95.94 Bukit Duabelas
Salticidae AraSalt018 equivocal (likely new sequence)
BF4.1A.2017AraSalt018.2 1080 Myrmarachne sp. JX145681.1 88.96 826 Junxattus daiqini KC615553.1
95.79 Bukit Duabelas
Salticidae AraSalt019 equivocal (likely new sequence)
BF2.3A.2017AraSalt019.1 694 Ligurra latidens KY017896.1 87.50 813 Emathis gombak KC615424.1
100 Bukit Duabelas
Salticidae AraSalt019 equivocal (likely new sequence)
BF2.2A.2017AraSalt019.2 --- --- --- --- 816 Emathis gombak KC615424.1
99.87 Bukit Duabelas
Salticidae AraSalt022 equivocal (likely new sequence)
BJ5.3.2017AraSalt022.1 695 Sitticus floricola KX537297.1 88.91 801 Viciria praemandibulari
s
JX145757.1
99.62 Bukit Duabelas
Salticidae AraSalt022 equivocal (likely new sequence)
BJ4.1.2017AraSalt022.2 720 Sitticus floricola KX537297.1 88.91 819 Viciria praemandibulari
s
JX145757.1
99.88 Bukit Duabelas
Salticidae AraSalt022 equivocal (likely new sequence)
BJ4.1.2017AraSalt022.3 700 Sitticus floricola KX537297.1 88.91 826 Viciria praemandibulari
s
JX145757.1
99.63 Bukit Duabelas
Salticidae AraSalt023 equivocal (likely new sequence)
BJ5.2.2017AraSalt023.1 679 Myrmarachne sp. MF804727.1 88.77 792 Schenkelia modesta
EU815487.1
98.94 Bukit Duabelas
Salticidae AraSalt027 equivocal (likely new sequence)
BJ3.3.2017AraSalt027.1 711 Ptocasius weyersi KU893272.1 93.00 794 Telamonia masinloc
AY297256.1
98.67 Bukit Duabelas

51
Salticidae AraSalt027 equivocal (likely new sequence)
BF3.3A.2017AraSalt027.2 712 Ptocasius weyersi KU893272.1 93.00 806 Anarrhotus fossulatus
EU815492.1
98.93 Bukit Duabelas
Salticidae AraSalt027 equivocal (likely new sequence)
HO2.3A.2017AraSalt027.3
712 Ptocasius weyersi KU893272.1 92.98 801 Anarrhotus fossulatus
EU815492.1
98.67 Harapan
Salticidae AraSalt028 equivocal (likely new sequence)
BJ5.3.2017AraSalt028.1 1057 Soesilarishius ruizi KC615713.1 88.17 788 Plexippinae sp. JX145803.1
98.91 Bukit Duabelas
Salticidae AraSalt028 equivocal (likely new sequence)
BJ5.3.2017AraSalt028.2 1061 Soesilarishius ruizi KC615713.1 88.18 785 Plexippinae sp. JX145803.1
98.78 Bukit Duabelas
Salticidae AraSalt032 equivocal (likely new sequence)
BO4.3A.2017AraSalt032.1
1091 Telamonia masinloc AY297385.1 90.42 807 Siler sp. KY888734.1
99.71 Bukit Duabelas
Salticidae AraSalt032 equivocal (likely new sequence)
HO4.1A.2017AraSalt032.2
1091 Telamonia masinloc AY297385.1 90.42 798 Siler sp. KY888734.1
99.71 Harapan
Salticidae AraSalt045 equivocal (likely new sequence)
HJ3.2A.2017AraSalt045.1 1091 Evaracha hoyi AY297379.1 89.73 770 Hakka himeshimensis
JN817058.1
95.40 Harapan
Salticidae AraSalt045 equivocal (likely new sequence)
HJ3.2A.2017AraSalt045.2 1077 Evaracha hoyi AY297379.1 89.73 813 Hakka himeshimensis
JN817058.1
95.77 Harapan
Salticidae AraSalt046 equivocal (likely new sequence)
HR2.2A.2017AraSalt046.1 1062 Mantisatta longicauda AY297399.1 87.46 772 Plexippinae sp. JX145803.1
98.87 Harapan
Salticidae AraSalt047 equivocal (likely new sequence)
BJ5.2.2017AraSalt047.1 714 Myrmarachne cf. melanocephala
KY587558.1 89.30 765 Ballus chalybeius EF514398.1
89.40 Bukit Duabelas

52
Salticidae AraSalt047 equivocal (likely new sequence)
HF2.1A.2017AraSalt047.2 662 Myrmarachne cf. melanocephala
KY587558.1 88.89 --- --- --- --- Harapan
Salticidae AraSalt049 equivocal (likely new sequence)
BR4.1A.2017AraSalt049.1 1096 Myrmarachne endoi LC193957.1 90.64 785 Anarrhotus fossulatus
EU815492.1
98.40 Bukit Duabelas
Salticidae AraSalt049 equivocal (likely new sequence)
HF4.1A.2017AraSalt049.2 1078 Hyllus tuberculatus EU815622.1 90.49 801 Schenkelia modesta
EU815487.1
98.54 Harapan
Salticidae AraSalt054 equivocal (likely new sequence)
HF3.3A.2017AraSalt054.1 689 Ligurra latidens KY017896.1 91.17 810 Heratemita alboplagiata
AF327934.1
92.42 Harapan
Salticidae AraSalt054 equivocal (likely new sequence)
HF2.2A.2017AraSalt054.2 710 Ligurra latidens KY017896.1 91.07 813 Heratemita alboplagiata
AF327934.1
92.42 Harapan
Salticidae AraSalt055 equivocal (likely new sequence)
BO5.1A.2017AraSalt055.1
687 Ptocasius weyersi KU893272.1 93.00 791 Anarrhotus fossulatus
EU815492.1
98.92 Bukit Duabelas
Salticidae AraSalt055 equivocal (likely new sequence)
BJ6.2.2017AraSalt055.2 664 Ptocasius weyersi KU893272.1 93.28 801 Anarrhotus fossulatus
EU815492.1
98.67 Bukit Duabelas
Salticidae AraSalt061 equivocal (likely new sequence)
HJ3.2A.2017AraSalt061.1 1104 Eris militaris AF328000.1 89.23 801 Folibiatus sp. Malaysia
KC615575.1
95.00 Harapan
Salticidae AraSalt061 equivocal (likely new sequence)
HR3.2A.2017AraSalt061.2 1077 Eris militaris AF328000.1 89.23 794 Folibiatus sp. Malaysia
KC615575.1
95.26 Harapan
Salticidae AraSalt063 equivocal (likely new sequence)
HR1.3A.2017AraSalt063.1 1075 Myrmarachne assimilis AY297412.1 88.43 820 Cocalus murinus EF419019.1
89.93 Harapan
Salticidae AraSalt063 equivocal (likely new sequence)
BR3.3A.2017AraSalt063.2 1068 Myrmarachne assimilis AY297412.1 88.33 800 Cocalus murinus EF419019.1
89.93 Bukit Duabelas
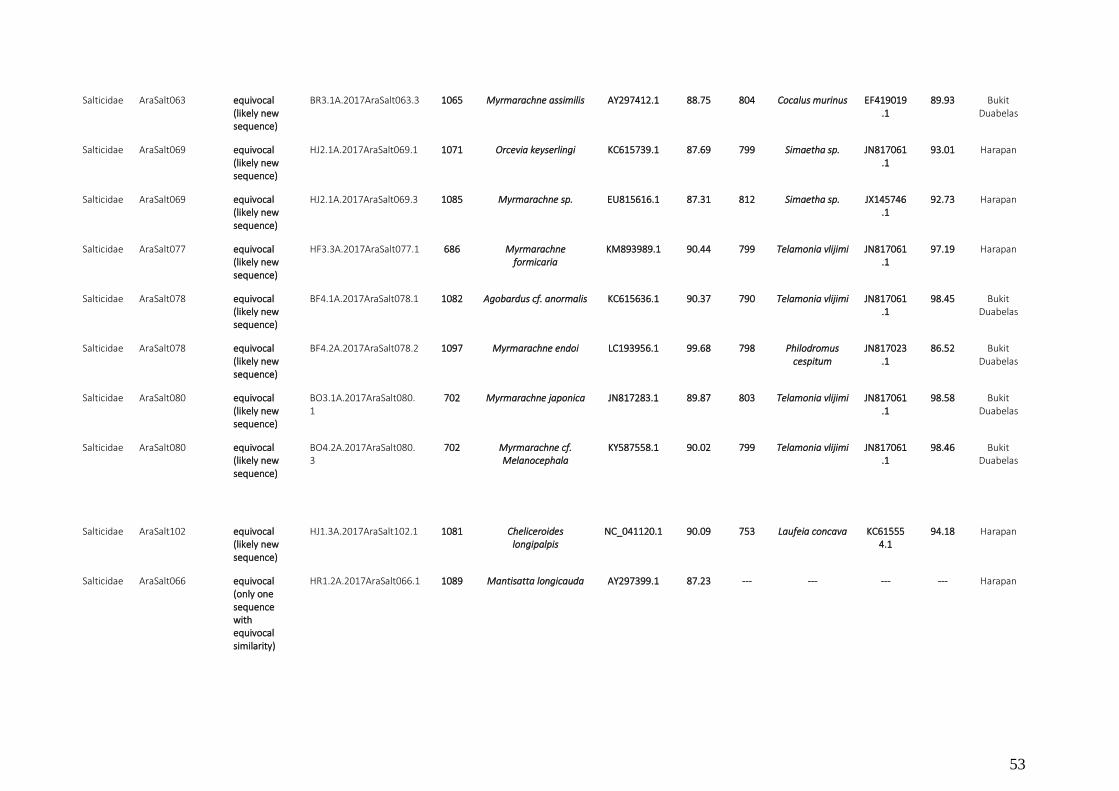
53
Salticidae AraSalt063 equivocal (likely new sequence)
BR3.1A.2017AraSalt063.3 1065 Myrmarachne assimilis AY297412.1 88.75 804 Cocalus murinus EF419019.1
89.93 Bukit Duabelas
Salticidae AraSalt069 equivocal (likely new sequence)
HJ2.1A.2017AraSalt069.1 1071 Orcevia keyserlingi KC615739.1 87.69 799 Simaetha sp. JN817061.1
93.01 Harapan
Salticidae AraSalt069 equivocal (likely new sequence)
HJ2.1A.2017AraSalt069.3 1085 Myrmarachne sp. EU815616.1 87.31 812 Simaetha sp. JX145746.1
92.73 Harapan
Salticidae AraSalt077 equivocal (likely new sequence)
HF3.3A.2017AraSalt077.1 686 Myrmarachne formicaria
KM893989.1 90.44 799 Telamonia vlijimi JN817061.1
97.19 Harapan
Salticidae AraSalt078 equivocal (likely new sequence)
BF4.1A.2017AraSalt078.1 1082 Agobardus cf. anormalis KC615636.1 90.37 790 Telamonia vlijimi JN817061.1
98.45 Bukit Duabelas
Salticidae AraSalt078 equivocal (likely new sequence)
BF4.2A.2017AraSalt078.2 1097 Myrmarachne endoi LC193956.1 99.68 798 Philodromus cespitum
JN817023.1
86.52 Bukit Duabelas
Salticidae AraSalt080 equivocal (likely new sequence)
BO3.1A.2017AraSalt080.1
702 Myrmarachne japonica JN817283.1 89.87 803 Telamonia vlijimi JN817061.1
98.58 Bukit Duabelas
Salticidae AraSalt080 equivocal (likely new sequence)
BO4.2A.2017AraSalt080.3
702 Myrmarachne cf. Melanocephala
KY587558.1 90.02 799 Telamonia vlijimi JN817061.1
98.46 Bukit Duabelas
Salticidae AraSalt102 equivocal (likely new sequence)
HJ1.3A.2017AraSalt102.1 1081 Cheliceroides longipalpis
NC_041120.1 90.09 753 Laufeia concava KC615554.1
94.18 Harapan
Salticidae AraSalt066 equivocal (only one sequence with equivocal similarity)
HR1.2A.2017AraSalt066.1 1089 Mantisatta longicauda AY297399.1 87.23 --- --- --- --- Harapan

54
Salticidae AraSalt066 equivocal (only one sequence with equivocal similarity)
HR1.2A.2017AraSalt066.2 1075 Mantisatta longicauda AY297399.1 87.34 --- --- --- --- Harapan
Salticidae AraSalt066 equivocal (only one sequence with equivocal similarity)
HR1.2A.2017AraSalt066.3 1108 Mantisatta longicauda AY297399.1 87.05 --- --- --- --- Harapan
Salticidae AraSalt073 equivocal (only one sequence with equivocal similarity)
HJ1.2A.2017AraSalt073.1 1098 Cosmophasis micarioides
EU815580.1 90.02 --- --- --- --- Harapan
Salticidae AraSalt080 equivocal (only one sequence with equivocal similarity)
BO4.2A.2017AraSalt080.2
706 Myrmarachne cf. Melanocephala
KY587558.1 90.24 --- --- --- --- Bukit Duabelas
Salticidae AraSalt098 equivocal (only one sequence with equivocal similarity)
BJ3.3.2017AraSalt098.1 1112 Agorius sp. LC431809.1 94.11 --- --- --- --- Bukit Duabelas
Salticidae AraSalt099 equivocal (only one sequence with equivocal similarity)
BJ4.1.2017AraSalt099.1 714 Mogrus cognatus MK154720.1 90.27 --- --- --- --- Bukit Duabelas

55
Salticidae AraSalt100 equivocal (only one sequence with equivocal similarity)
BJ4.2.2017AraSalt100.1 1123 Myrmarachne endoi LC193956.1 87.13 --- --- --- --- Bukit Duabelas
Salticidae AraSalt028 equivocal (only one sequence with equivocal similarity)
BJ4.2.2017AraSalt028.3 1062 Soesilarishius ruizi KC615713.1 88.50 --- --- --- --- Bukit Duabelas
Salticidae AraSalt046 equivocal (only one sequence with equivocal similarity)
HR2.2A.2017AraSalt046.2 1062 Mantisatta longicauda AY297399.1 87.40 --- --- --- --- Harapan
Salticidae AraSalt046 equivocal (only one sequence with equivocal similarity
HR1.2A.2017AraSalt046.3 1065 Mantisatta longicauda AY297399.1 87.38 --- --- --- --- Harapan
Salticidae AraSalt047 equivocal (only one sequence with equivocal similarity)
HF3.3A.2017AraSalt047.3 ---
826 Ballus chalybeius EF514398.1
89.26 Harapan
Salticidae AraSalt050 equivocal (only one sequence with equivocal similarity)
BO4.2A.2017AraSalt050.3
1067 Myrmarachne foenisex JX145679.1 94.80 --- --- --- --- Bukit Duabelas

56
Salticidae AraSalt053 equivocal (only one sequence with equivocal similarity)
HO4.2A.2017AraSalt053.1
1084 Phintella aequipeiformis LC105669.1 91.28 --- --- --- --- Harapan
Salticidae AraSalt001 equivocal (only one sequence)
BF1.3A.2017AraSalt001.1 ---
781 Plexippinae sp. JX145803.1
99.32 Bukit Duabelas
Salticidae AraSalt084 equivocal (only one sequence)
HO3.2A.2017AraSalt084.1
1104 Myrmarachne endoi LC193956.1 99.78 --- --- --- --- Harapan
Salticidae AraSalt095 equivocal (only one sequence)
BF4.2A.2017AraSalt095.1 1083 Agobardus cf. anormalis KC615636.1 90.31 --- --- --- --- Bukit Duabelas
Salticidae AraSalt095 equivocal (only one sequence)
HR4.3A.2017AraSalt095.2 1073 Agobardus cf. anormalis KC615636.1 90.31 --- --- --- --- Harapan
Salticidae AraSalt083 Heratemita (Marpissinae)
HO4.2A.2017AraSalt083.1
699 Cheliceroides longipalpis
NC_0441120.1
88.55 810 Heratemita alboplagiata
AF327934.1
99.33 Harapan
Salticidae AraSalt083 Heratemita (Marpissinae)
BO4.2A.2017AraSalt083.2
686 Cheliceroides longipalpis
NC_0441120.1
88.36 815 Heratemita alboplagiata
AF327934.1
99.33 Bukit Duabelas
Salticidae AraSalt083 Heratemita (Marpissinae)
BO4.2A.2017AraSalt083.3
689 Cheliceroides longipalpis
NC_0441120.1
88.28 822 Heratemita alboplagiata
AF327934.1
99.33 Bukit Duabelas
Salticidae AraSalt092 Heratemita (Marpissinae)
BJ6.1.2017AraSalt092.1 1067 Heratemita alboplagiata
AF327991.1 89.20 791 Heratemita alboplagiata
AF327934.1
97.99 Bukit Duabelas
Salticidae AraSalt092 Heratemita (Marpissinae)
BF4.2A.2017AraSalt092.2 1067 Heratemita alboplagiata
AF327991.1 89.20 791 Heratemita alboplagiata
AF327934.1
97.99 Bukit Duabelas
Salticidae AraSalt059 Maleius (Euophryinae)
HJ2.2A.2017AraSalt059.1 1086 Maileus cf. fuscus KC615743.1 97.40 814 Maileus cf. fuscus
KC615560.1
99.60 Harapan
Salticidae AraSalt059 Maleius (Euophryinae)
BJ3.1.2017AraSalt059.2 1089 Maileus cf. fuscus KC615743.1 97.30 807 Maileus cf. fuscus
KC615560.1
99.73 Bukit Duabelas

57
Salticidae AraSalt059 Maleius (Euophryinae)
HJ2.3A.2017AraSalt059.3 709 Sitticus rupicola MG047861.1 90.88 812 Maileus cf. fuscus
KC615560.1
99.73 Harapan
Salticidae AraSalt006 Mintonia (Spartaeinae)
HF4.2A.2017AraSalt006.2 1081 Spartaeinae sp. AY297363.1 87.62 818 Mintonia cf. melinauensis
KM033160
99.86 Harapan
Salticidae AraSalt006 Mintonia (Spartaeinae)
HF4.2A.2017AraSalt006.3 1081 Spartaeinae sp. AY297363.1 87.46 818 Mintonia cf. melinauensis
KM033160
99.46 Harapan
Salticidae AraSalt056 Myrmarachne (Myrmarachnidae)
BJ4.1.2017AraSalt056.1 1064 Myrmarachne wanlessi LC193969.1 95.79 779 Jessica osoriana KR558908.1
84.88 Bukit Duabelas
Salticidae AraSalt056 Myrmarachne (Myrmarachnidae)
BJ4.1.2017AraSalt056.2 1066 Myrmarachne wanlessi LC193969.1 95.79 727 Jessica osoriana KR558908.1
84.94 Bukit Duabelas
Salticidae AraSalt056 Myrmarachne (Myrmarachnidae)
BJ4.1.2017AraSalt056.3 1074 Myrmarachne wanlessi LC193969.1 95.79 787 Jessica osoriana KR558908.1
84.77 Bukit Duabelas
Salticidae AraSalt021 Myrmarachne (Myrmarachnidae)
HF2.1A.2017AraSalt021.1 1047 Myrmarachne wanlessi LC193969.1 93.20 789 Opisthoncus kochi
EU815468.1
87.05 Harapan
Salticidae AraSalt021 Myrmarachne (Myrmarachnidae)
HJ2.2A.2017AraSalt021.2 1063 Myrmarachne wanlessi LC193969.1 93.20 ---
Harapan
Salticidae AraSalt021 Myrmarachne (Myrmarachnidae)
HJ3.2A.2017AraSalt021.3 1058 Myrmarachne wanlessi LC193969.1 93.20 749 Opisthoncus kochi
EU815468.1
86.65 Harapan
Salticidae AraSalt024 Myrmarachne (Myrmarachnidae)
BJ4.1.2017AraSalt024.1 1065 Myrmarachne cornuta LC193952.1 99.13 803 Mymrarachne cornuta
MK716316.1
98.00 Bukit Duabelas
Salticidae AraSalt024 Myrmarachne (Myrmarachnidae)
BJ4.1.2017AraSalt024.2 1055 Myrmarachne cornuta LC193952.1 98.92 795 Mymrarachne cornuta
MK716316.1
97.98 Bukit Duabelas

58
Salticidae AraSalt024 Myrmarachne (Myrmarachnidae)
BJ4.1.2017AraSalt024.3 1074 Myrmarachne cornuta LC193952.1 99.03 733 Mymrarachne cornuta
MK716316.1
97.40 Bukit Duabelas
Salticidae AraSalt025 Myrmarachne (Myrmarachnidae)
BJ5.2.2017AraSalt025.1 699 Myrmarachne formicaria
MG045726.1 91.86 789 Myrmarachne japonica
JN817063.1
91.38 Bukit Duabelas
Salticidae AraSalt025 Myrmarachne (Myrmarachnidae)
BJ5.2.2017AraSalt025.2 723 Myrmarachne formicaria
MG045726.1 91.86 760 Myrmarachne japonica
JN817063.1
91.57 Bukit Duabelas
Salticidae AraSalt025 Myrmarachne (Myrmarachnidae)
BJ5.2.2017AraSalt025.3 715 Myrmarachne formicaria
MG045726.1 91.86 772 Myrmarachne japonica
JN817063.1
91.14 Bukit Duabelas
Salticidae AraSalt040 Myrmarachne (Myrmarachnidae)
HO3.2A.2017AraSalt040.1
1021 Myrmarachne sp. JX145681.1 92.43 798 Myrmarachne japonica
JN817063.1
95.22 Harapan
Salticidae AraSalt040 Myrmarachne (Myrmarachnidae)
HR1.2A.2017AraSalt040.2 720 Myrmarachne japonica JN817283.1 93.02 757 Myrmarachne japonica
JN817063.1
95.90 Harapan
Salticidae AraSalt050 Myrmarachne (Myrmarachnidae)
HO3.2A.2017AraSalt050.1
1060 Myrmarachne cornuta LC193953.1 98.79 778 Myrmarachne cornuta
MK716316.1
97.97 Harapan
Salticidae AraSalt050 Myrmarachne (Myrmarachnidae)
BJ6.1.2017AraSalt050.2 1059 Myrmarachne cornuta LC193953.1 98.57 771 Myrmarachne cornuta
MK716316.1
97.72 Bukit Duabelas
Salticidae AraSalt058 Myrmarachne (Myrmarachnidae)
HR1.2A.2017AraSalt058.1 686 Myrmarachne sp. KP978606.1 91.68 788 Myrmarachne japonica
JN817063.1
93.77 Harapan
Salticidae AraSalt058 Myrmarachne (Myrmarachnidae)
HR3.1A.2017AraSalt058.2 1035 Myrmarachne sp. JX145681.1 93.90 800 Myrmarachne sp.
JX145755.1
98.36 Harapan
Salticidae AraSalt067 Myrmarachne (Myrmarachnidae)
HO3.2A.2017AraSalt067.1
1102 Myrmarachne assimilis LC193951.1 93.31 723 Myrmarachne japonica
JN817063.1
97.32 Harapan
Salticidae AraSalt074 Myrmarachne (Myrmarachnidae)
BO2.2A.2017AraSalt074.1
1099 Myrmarachne foenisex JX145679.1 95.01 687 Myrmarachne evidens
JX145752.1
98.40 Bukit Duabelas

59
Salticidae AraSalt081 Myrmarachne (Myrmarachnidae)
BO4.3A.2017AraSalt081.1
1106 Myrmarachne wanlessi LC193969.1 95.79 807 Opisthoncus kochi
EU815468.1
85.25 Bukit Duabelas
Salticidae AraSalt086 Myrmarachne (Myrmarachnidae)
HO4.1A.2017AraSalt086.1
1061 Myrmarachne foenisex JX145679.1 94.90 732 Myrmarachne foenisex
JX145753.1
97.95 Harapan
Salticidae AraSalt086 Myrmarachne (Myrmarachnidae)
HO4.2A.2017AraSalt086.2
1063 Myrmarachne foenisex JX145679.1 94.90 752 Myrmarachne foenisex
JX145753.1
97.99 Harapan
Salticidae AraSalt086 Myrmarachne (Myrmarachnidae)
BO4.1A.2017AraSalt086.3
1053 Myrmarachne foenisex JX145679.1 94.77 735 Myrmarachne foenisex
JX145753.1
97.94 Bukit Duabelas
Salticidae AraSalt091 Myrmarachne (Myrmarachnidae)
HO3.1A.2017AraSalt091.1
1113 Myrmarachne endoi LC193956.1 99.68 771 Philodromus cespitum
JN817023.1
86.67 Harapan
Salticidae AraSalt104 Myrmarachne (Myrmarachnidae)
HR3.1A.2017AraSalt104.1 1078 Agobardus cf. anormalis KC615636.1 90.37 790 Telamonia vlijimi AY297256.1
98.27 Harapan
Salticidae AraSalt104 Myrmarachne (Myrmarachnidae)
BJ4.1.2017AraSalt104.2 1106 Myrmarachne assimilis LC193951.1 93.42 803 Myrmarachne japonica
JN817063.1
97.11 Bukit Duabelas
Salticidae AraSalt060 Omoedus (Euophryinae)
BJ4.1.2017AraSalt060.1 1094 Omoedus ephippigerus KC615765.1 99.70 823 Omodeus ephippigerus
KC615587.1
99.50 Bukit Duabelas
Salticidae AraSalt060 Omoedus (Euophryinae)
HJ1.3A.2017AraSalt060.2 1080 Omoedus ephippigerus KC615765.1 96.46 823 Omodeus ephippigerus
KC615587.1
96.15 Harapan
Salticidae AraSalt060 Omoedus (Euophryinae)
BF2.1A.2017AraSalt060.3 1115 Omoedus ephippigerus KC615765.1 95.75 821 Omodeus ephippigerus
KC615587.1
99.75 Bukit Duabelas
Salticidae AraSalt100 Orcevia (Euophyrinae)
BF2.1A.2017AraSalt100.2 1085 Orcevia keyserlingi KC615739.1 89.86 777 Orcevia keyserlingi
KC615555.1
94.78 Bukit Duabelas
Salticidae AraSalt029 Phaeacius (Spartaeinae)
BR1.2A.2017AraSalt029.1 1053 Phaeacius cf. fimbriatus DQ665759.1 91.16 815 Phaeacius sp. KM033167.1
99.73 Bukit Duabelas
Salticidae AraSalt029 Phaeacius (Spartaeinae)
BR1.3A.2017AraSalt029.2 1049 Phaeacius cf. fimbriatus DQ665759.1 91.37 813 Phaeacius sp. KM033167.1
99.73 Bukit Duabelas

60
Salticidae AraSalt029 Phaeacius (Spartaeinae)
BR1.3A.2017AraSalt029.3 1063 Phaeacius cf. fimbriatus DQ665759.1 91.26 799 Phaeacius sp. KM033167.1
99.86 Bukit Duabelas
Salticidae AraSalt087 Phintella (Heliophaninae)
HF4.1A.2017AraSalt087.1 1058 Phintella sp. AY297397.1 90.42 791 Phintella sp. AY297268.1
91.03 Harapan
Salticidae AraSalt053 Phintella (Heliophaninae)
HJ3.2A.2017AraSalt053.2 696 Phintella arenicolor JN817285.1 91.62 743 Phintella sp. KY888722.1
91.32 Harapan
Salticidae AraSalt053 Phintella (Heliophaninae)
HJ3.3A.2017AraSalt053.3 1059 Phintella aequipeiformis LC105669.1 91.40 788 Phintella sp. KY888722.1
93.26 Harapan
Salticidae AraSalt087 Phintella (Heliophaninae)
HF1.2A.2017AraSalt087.2 1059 Phintella sp. AY297397.1 90.60 787 Phintella sp. AY297268.1
91.02 Harapan
Salticidae AraSalt087 Phintella (Heliophaninae)
BJ4.1.2017AraSalt087.3 1059 Phintella sp. AY297397.1 90.39 799 Phintella sp. AY297268.1
90.90 Bukit Duabelas
Salticidae AraSalt109 Phintella (Heliophaninae)
BR1.3A.2017AraSalt109.1 699 Phintella vittata MK392822.1 99.83 798 Phintella vittata KY888722.1
99.87 Bukit Duabelas
Salticidae AraSalt030 Portia (Spartaeinae)
BJ6.1.2017AraSalt030.1 1080 Portia taiwanica KM033214.1 89.74 797 Portia labiata EF419041.1
99.86 Bukit Duabelas
Salticidae AraSalt026 Telamonia (Plexippinae)
BJ4.3.2017AraSalt026.1 1063 Telamonia dimidiata JX145703.1 96.38 787 Telamonia masinloc
AY297256.1
99.20 Bukit Duabelas
Salticidae AraSalt026 Telamonia (Plexippinae)
BF4.2A.2017AraSalt026.2 1044 Telamonia dimidiata JX145703.1 98.97 787 Telamonia dimidiata
JX145788.1
99.62 Bukit Duabelas
Salticidae AraSalt026 Telamonia (Plexippinae)
BF4.1A.2017AraSalt026.3 1057 Telamonia dimidiata JX145703.1 98.97 789 Telamonia dimidiata
JX145788.1
99.62 Bukit Duabelas
Salticidae AraSalt065 Telamonia (Plexippinae)
HO2.1A.2017AraSalt065.1
1057 Telamonia cf. festiva JX145701.1 99.38 788 Telamonia vlijimi EF419019.1
99.48 Harapan

61
Salticidae AraSalt065 Telamonia (Plexippinae)
HO2.1A.2017AraSalt065.2
1051 Telamonia cf. festiva JX145701.1 99.54 766 Telamonia vlijimi JN817061.1
99.74 Harapan
Salticidae AraSalt065 Telamonia (Plexippinae)
HO2.1A.2017AraSalt065.3
698 Telamonia dimidiata MK154812.1 91.48 803 Telamonia vlijimi JN817061.1
99.36 Harapan
Salticidae AraSalt082 Thiania (Euophyrina)
BO4.2A.2017AraSalt082.1
700 Thiania bhamoensis MK392826.1 100 791 Thiania bhamoensis
EF419049.1
100 Bukit Duabelas
Salticidae AraSalt082 Thiania (Euophyrina)
HO2.1A.2017AraSalt082.2
706 Thiania bhamoensis MK392826.1 82 810 Thiania cf. Suboppressa
KC615599.1
96.94 Harapan
Salticidae AraSalt082 Thiania (Euophyrina)
HO4.2A.2017AraSalt082.3
697 Thiania bhamoensis MK392826.1 100 795 Thiania bhamoensis
EF419049.1
100 Harapan

62
Table A4: Grouping results of ABGD for COI and 28S with merged morphospecies and the resulting set of unique candidate species used in the
calculation for the Bayesian inference tree for 28S (Appendix, Figure A2). ABGD grouped eight morphospecies considered as different in morphology
based identification, into four unique morphospecies by the inferred barcode gap for 28S and COI (yellow). New candidate species after ABGD
grouping results (024, 027, 056, 086) are shown underlined in the table. Full Voucher-ID's e.g. (BF1.3A.2017AraSalt001.1) (see Appendix, Table
A3) are abbreviated to the morphospecies number for clarity.
Morphospecies grouping for 28S
(Initial Partition with prior maximal distance P=2.78e-03)
Morphospecies grouping for COI (Initial Partition with prior maximal distance P=1.67e-03)
Morphological morphospecies merged to a single candidate species
Candidate species used for Bayesian
inference tree
Group[ 1 ] n: 1 ;id: 001.1 Group[ 1 ] n: 1 ;id: 002.1 024 + 050 = 024 001
Group[ 2 ] n: 3 ;id: 002.1 002.2 002.3 Group[ 2 ] n: 2 ;id: 002.2 002.3 27 + 55 = 027 002
Group[ 3 ] n: 2 ;id: 003.1 003.2 Group[ 3 ] n: 2 ;id: 003.1 003.2 056 + 081 = 056 003
Group[ 4 ] n: 1 ;id: 005.1 Group[ 4 ] n: 2 ;id: 005.1 005.2 074 + 086 = 086 005
Group[ 5 ] n: 1 ;id: 006.1 Group[ 5 ] n: 1 ;id: 006.1
006
Group[ 6 ] n: 2 ;id: 006.2 006.3 Group[ 6 ] n: 1 ;id: 006.2
008
Group[ 7 ] n: 3 ;id: 008.1 045.1 045.2 Group[ 7 ] n: 1 ;id: 006.3
009
Group[ 8 ] n: 3 ;id: 011.1 011.2 011.3 Group[ 8 ] n: 1 ;id: 008.1
010
Group[ 9 ] n: 2 ;id: 018.1 018.2 Group[ 9 ] n: 1 ;id: 009.1
011
Group[ 10 ] n: 3 ;id: 019.1 019.2 043.1 Group[ 10 ] n: 1 ;id: 009.2
015
Group[ 11 ] n: 2 ;id: 021.1 021.3 Group[ 11 ] n: 5 ;id: 009.3 010.1 017.1 017.2 017.3
017
Group[ 12 ] n: 3 ;id: 022.1 022.2 022.3 Group[ 12 ] n: 2 ;id: 010.2 010.3
018
Group[ 13 ] n: 5 ;id: 024.1 024.2 024.3 050.1 050.2 Group[ 13 ] n: 3 ;id: 011.1 011.2 011.3
019
Group[ 14 ] n: 3 ;id: 025.1 025.2 025.3 Group[ 14 ] n: 2 ;id: 015.1 015.2
021
Group[ 15 ] n: 3 ;id: 029.1 029.2 029.3 Group[ 15 ] n: 2 ;id: 018.1 018.2
022
Group[ 16 ] n: 1 ;id: 030.1 Group[ 16 ] n: 1 ;id: 019.1
023

63
Group[ 17 ] n: 2 ;id: 032.1 032.2 Group[ 17 ] n: 3 ;id: 021.1 021.2 021.3
024
Group[ 18 ] n: 2 ;id: 043.2 043.3 Group[ 18 ] n: 3 ;id: 022.1 022.2 022.3
025
Group[ 19 ] n: 2 ;id: 047.1 047.3 Group[ 19 ] n: 1 ;id: 023.1
026
Group[ 20 ] n: 2 ;id: 053.2 053.3 Group[ 20 ] n: 5 ;id: 024.1 024.2 024.3 050.1 050.2
027
Group[ 21 ] n: 2 ;id: 054.1 054.2 Group[ 21 ] n: 3 ;id: 025.1 025.2 025.3
028
Group[ 22 ] n: 4 ;id: 056.1 056.2 056.3 081.1 Group[ 22 ] n: 1 ;id: 026.1
029
Group[ 23 ] n: 1 ;id: 058.1 Group[ 23 ] n: 2 ;id: 026.2 026.3
030
Group[ 24 ] n: 3 ;id: 059.1 059.2 059.3 Group[ 24 ] n: 4 ;id: 027.1 027.2 027.3 055.1
032
Group[ 25 ] n: 3 ;id: 060.1 060.2 060.3 Group[ 25 ] n: 3 ;id: 028.1 028.2 028.3
040
Group[ 26 ] n: 2 ;id: 061.1 061.2 Group[ 26 ] n: 4 ;id: 029.1 029.2 029.3 043.3
043
Group[ 27 ] n: 3 ;id: 063.1 063.2 063.3 Group[ 27 ] n: 1 ;id: 030.1
045
Group[ 28 ] n: 3 ;id: 069.1 069.2 069.3 Group[ 28 ] n: 1 ;id: 032.1
046
Group[ 29 ] n: 2 ;id: 078.2 091.1 Group[ 29 ] n: 1 ;id: 032.2
047
Group[ 30 ] n: 3 ;id: 082.1 082.2 082.3 Group[ 30 ] n: 1 ;id: 040.1
049
Group[ 31 ] n: 3 ;id: 083.1 083.2 083.3 Group[ 31 ] n: 1 ;id: 040.2
053
Group[ 32 ] n: 3 ;id: 087.1 087.2 087.3 Group[ 32 ] n: 1 ;id: 043.1
054
Group[ 33 ] n: 2 ;id: 090.1 090.2 Group[ 33 ] n: 1 ;id: 043.2
056
Group[ 34 ] n: 1 ;id: 100.2 Group[ 34 ] n: 2 ;id: 045.1 045.2
058
Group[ 35 ] n: 1 ;id: 102.1 Group[ 35 ] n: 2 ;id: 046.2 046.3
059
Group[ 36 ] n: 1 ;id: 109.1 Group[ 36 ] n: 2 ;id: 047.1 047.2
060
Group[ 37 ] n: 1 ;id: 009.1 Group[ 37 ] n: 2 ;id: 049.1 049.2
061

64
Group[ 38 ] n: 1 ;id: 009.2 Group[ 38 ] n: 5 ;id: 050.3 074.1 086.1 086.2 086.3
063
Group[ 39 ] n: 4 ;id: 009.3 017.1 017.2 017.3 Group[ 39 ] n: 1 ;id: 053.1
065
Group[ 40 ] n: 1 ;id: 010.2 Group[ 40 ] n: 1 ;id: 053.2
067
Group[ 41 ] n: 2 ;id: 015.1 015.2 Group[ 41 ] n: 1 ;id: 053.3
069
Group[ 42 ] n: 1 ;id: 023.1 Group[ 42 ] n: 2 ;id: 054.1 054.2
077
Group[ 43 ] n: 1 ;id: 026.1 Group[ 43 ] n: 4 ;id: 056.1 056.2 056.3 081.1
078
Group[ 44 ] n: 2 ;id: 026.2 026.3 Group[ 44 ] n: 1 ;id: 058.1
080
Group[ 45 ] n: 5 ;id: 027.1 027.2 027.3 055.1 055.2 Group[ 45 ] n: 1 ;id: 058.2
082
Group[ 46 ] n: 3 ;id: 028.1 028.2 046.1 Group[ 46 ] n: 3 ;id: 059.1 059.2 059.3
083
Group[ 47 ] n: 2 ;id: 049.1 049.2 Group[ 47 ] n: 1 ;id: 060.1
086
Group[ 48 ] n: 3 ;id: 065.1 065.2 065.3 Group[ 48 ] n: 1 ;id: 060.2
087
Group[ 49 ] n: 1 ;id: 077.1 Group[ 49 ] n: 1 ;id: 060.3
090
Group[ 50 ] n: 2 ;id: 078.1 104.1 Group[ 50 ] n: 2 ;id: 061.1 061.2
091
Group[ 51 ] n: 2 ;id: 080.1 080.3 Group[ 51 ] n: 3 ;id: 063.1 063.2 063.3
092
Group[ 52 ] n: 1 ;id: 040.1 Group[ 52 ] n: 3 ;id: 065.1 065.2 065.3
100
Group[ 53 ] n: 1 ;id: 040.2 Group[ 53 ] n: 2 ;id: 067.1 104.2
102
Group[ 54 ] n: 1 ;id: 058.2 Group[ 54 ] n: 3 ;id: 069.1 069.2 069.3
104
Group[ 55 ] n: 2 ;id: 067.1 104.2 Group[ 55 ] n: 1 ;id: 077.1
109
Group[ 56 ] n: 2 ;id: 074.1 086.2 Group[ 56 ] n: 2 ;id: 078.1 104.1
Group[ 57 ] n: 2 ;id: 086.1 086.3 Group[ 57 ] n: 2 ;id: 078.2 091.1
Group[ 58 ] n: 2 ;id: 092.1 092.2 Group[ 58 ] n: 3 ;id: 080.1 080.2 080.3
Group[ 59 ] n: 2 ;id: 082.1 082.3

65
Group[ 60 ] n: 1 ;id: 082.2
Group[ 61 ] n: 3 ;id: 083.1 083.2 083.3
Group[ 62 ] n: 3 ;id: 087.1 087.2 087.3
Group[ 63 ] n: 1 ;id: 090.1
Group[ 64 ] n: 1 ;id: 090.2
Group[ 65 ] n: 2 ;id: 092.1 092.2
Group[ 66 ] n: 1 ;id: 100.2
Group[ 67 ] n: 1 ;id: 102.1
Group[ 68 ] n: 1 ;id: 109.1

66
Figure A2: Bayesian inference tree for the 28S alignment of 55 candidate species of jumping spiders (aligned tip labels) with Bayesian posterior
probabilities given for each node. Full Voucher-ID's e.g. (BF1.3A.2017AraSalt001.1) (see Appendix. Table A3.) are abbreviated to the morphospecies
number (e.g. 001) for clarity. Morphospecies of ant-mimicking salticid spiders (Myrmarachne) (see Appendix Table A3) are highlighted (yellow) on
the tree.
Myrmarachne