diversity and distribution of the deep-sea ichthyofauna of
TRANSCRIPT
Regis UniversityePublications at Regis University
All Regis University Theses
Spring 2013
Diversity and Distribution of the Deep-SeaIchthyofauna of the Gulf of Mexico with OutlooksOn ConservationAshley MarranzinoRegis University
Follow this and additional works at: https://epublications.regis.edu/theses
This Thesis - Open Access is brought to you for free and open access by ePublications at Regis University. It has been accepted for inclusion in All RegisUniversity Theses by an authorized administrator of ePublications at Regis University. For more information, please contact [email protected].
Recommended CitationMarranzino, Ashley, "Diversity and Distribution of the Deep-Sea Ichthyofauna of the Gulf of Mexico with Outlooks On Conservation"(2013). All Regis University Theses. 588.https://epublications.regis.edu/theses/588

Regis UniversityRegis College
Honors Theses
DisclaimerUse of the materials available in the Regis University Thesis Collection (“Collection”) is limited and restricted to those users who agree to comply with the following terms of use. Regis University reserves the right to deny access to the Collection to any person who violates these terms of use or who seeks to or does alter, avoid or supersede the functional conditions, restrictions and limitations of the Collection.
The site may be used only for lawful purposes. The user is solely responsible for knowing and adhering to any and all applicable laws, rules, and regulations relating or pertaining to use of the Collection.
All content in this Collection is owned by and subject to the exclusive control of Regis University and the authors of the materials. It is available only for research purposes and may not be used in violation of copyright laws or for unlawful purposes. The materials may not be downloaded in whole or in part without permission of the copyright holder or as otherwise authorized in the “fair use” standards of the U.S. copyright laws and regulations.


DIVERSITY AND DISTRIBUTION OF THE DEEP-SEA ICHTHYOFAUNA OF THE GULF OF MEXICO WITH OUTLOOKS ON CONSERVATION
A thesis submitted to Regis College
The Honors Program in partial fulfillment of the requirements
for Graduation with Honors
by
Ashley M arranzino
May 2013
11

iv

TABLE OF CONTENTS
LISTS OF FIGURES v
LISTS OF TABLES viii
ACKNOWLEDGEMENTS ix
ABSTRACT x
CHAPTER I: DIVERSITY AND DISTRIBUTION OF DEEP- SEA ICHTHYOFAUNA OF THE GULF OF MEXICO
INTRODUCTION 1MATERIALS AND METHODS 13RESULTS 18DISCUSSION 21REFERENCES 49
CHAPTER II: CONSERVATION OF THE DEEP SEA: A LOOK AT DEEP-SEA CHONDRICHTHYANS AND THREATS POSED TO THEM IN THE GULF OF MEXICO
INTRODUCTION 52MATERIALS AND METHODS 67RESULTS 68DISCUSSION 71CONCLUSION 81REFERENCES 105
APPENDIX I 108
v

LIST OF FIGURES
CHAPTER I
Figure 1-1: Vertical Zones of the Ocean 27
Figure 1-2: Map of the Gulf of Mexico 28
Figure 1-3: Data for Species Richness and RegressionalAnalysis 29
Figure 1-4: Data for Maximum Depths Species Occupy 30
Figure 1-5: Species Richness and Taxonomic Diversity Datafor 200 m intervals 31
Figure 1-6: Taxonomic Diversity for 200 m intervals 32
Figure 1-7: Changes in Clade Composition with Depth 33
Figure 1-8: Species Richness and Taxonomic Diversity Datafor Pequegnat’s Intervals 34
Figure 1-9: Species Richness and Taxonomic Diversity Datafor Traditional Oceanic Zones 35
Figure 1-10: Percomorpha and Stomiiformes Species RichnessData 36
Figure 1-11: Myctophiformes and Stomiiformes SpeciesRichness Data 37
Figure 1-12: Ophidiiformes and Osmeriformes SpeciesRichness Data 38
Figure 1-13: Chondrichthyan Species Richness Data 39
vi

CHAPTER II
Figure 2-1: Occurrence of Trash in the Gulf of Mexico 85
Figure 2-2: Chondrichthyan Species Richness in 100 mIntervals 86
Figure 2-3: Bathymetric Map of the Gulf of Mexico 87
Figure 2-4: Maximum Depth comparisons between ArcGisMapping and Documented Species Data 88
Figure 2-5: Distribution of Rajella fuliginea 89
Figure 2-6: Distribution of Anacanthobatis folirostris 90
Figure 2-7: Distribution of Dipturus oregoni 91
Figure 2-8: Distribution map of Raja texana 92
Figure 2-9: Distribution of Dipturus olseni 93
Figure 2-10: Distribution of Fenestraja plutonia 94
Figure 2-11: Distribution of Leucoraja lentiginosa 95
Figure 2-12: Distribution of Rajella purpuriventralis 96
Figure 2-12: Distribution of Squalus cubensis 97
Figure 2-14: Distribution of Deania profundorum 98
Figure 2-15: Distribution of Etmopterus gracilispinis 99
Figure 2-16: Locations of Documented Oil and Gas Platforms 100
Figure 2-17: Locations of Active Drilling Leases 101
Figure 2-18: Forecasted Dispersal of the Deep Sea Horizon OilSpill 102
vii

LIST OF TABLES
CHAPTER I
Table 1-1: Depth Intervals Used in Study 40
Table 1-2: Cladistic Breakdown of Ichthyofauna Used in Study 41
Table 1-3: Data for Species Richness at 200 m Depth Intervals 43
Table 1-4: Data for Taxonomic Diversity at 200 m DepthIntervals 44
Table 1-5: Data for Species Richness for Pequegnat’s DepthIntervals 45
Table 1-6: Data for Taxonomic Diversity for Peqegnat’s DepthIntervals 46
Table 1-7: Data for Species Richness for Traditional OceanicZones 47
Table 1-8: Data for Taxonomic Diversity for TraditionalOceanic Zones 48
CHAPTER II
Table 2-1: Data for Chondrichthyan Depth Ranges ComparedBetween Documented Sources and Data from Study 103
viii

ACKNOWLEDGEMENTS
I would like to extend my deepest gratitude to everyone who helped with this
thesis. Dr. Michael Ghedotti, my advisor, was instrumental in the process and there
would not even be a research topic without his incredible guidance. Thank you for the
endless support you have given me and the mentoring you have done over the course of
this project. Dr. John Sakulich, went above and beyond the call of a thesis reader. Thank
you for all of the help with statistics, mapping, graph making, and editing. This thesis
would be far less impressive without your guidance. Thank you to Dr. Matt Davis, a
former Regis alumnus, for his guidance on the research and advice for my project and
education following graduation. I would also like to thank Dr. Thomas Bowie not only
for the support he has given at every turn for this thesis, but also for the incredible
mentoring over the past four years. He has broadened my horizons and forced me to
question and find my values. I would not be as passionate about conservation and the
marine world without the discussions fostered in the honors program Dr. Bowie has
molded.
Of course this thesis would not have been completed without the efforts of many
other people as well. Thank you to Martin Garnar for his help with formatting and
publication. Thank you to all of my friends and everyone else who has in some way
helped in this process. Of course, a final thank you to my parents who have supported me
in everything I have done since day one. Thank you for everything you do for me and
especially for putting up with my stress and temper during this process.
ix

ABSTRACT
The ichthyofauna of the Gulf of Mexico has been fairly well documented as a
consequence of the extensive fisheries activities and hydrocarbon exploration in these
waters. However, the diversity and distribution of the deep-sea species remain poorly
understood. This study examines the vertical distribution of fish species in the Gulf of
Mexico as well as the changes in taxonomic diversity with depth. Species richness was
found to decrease exponentially with depth while maximum depths species occupy
closely correlates with traditional oceanic zone boundaries. The clade Percomorpha was
found to account for the majority of the taxonomic diversity in the Epipelagic, below
which the species richness of this clade decreases, as other taxonomic groups account for
proportionally more of the diversity in the deep-sea. Conservation threats posed to deep-
sea species also were investigated by examining the vertical and geographic distribution
of benthic and demersal Rajiformes (skates) and Squaliformes (dogfishes) in the Gulf of
Mexico. Using geographical coordinates of specimen capture and ArcGIS mapping,
ranges of 33 Chondrichthyan species were examined and used to determine potential
threats associated with oil and gas drilling. The results demonstrate the need for a better
understanding of the biology of deep-sea species in order to accurately assess threats
posed to poorly known deep-sea inhabitants.
x

Chapter 1: Diversity and distribution of the deep-sea ichthyofauna of the Gulf of Mexico
Introduction:
The word “ocean” brings various images to mind: waves of aquamarine water
gently lapping against white sand beaches while children laugh and play happily in the
calm shallow waters; or surfers swimming into the open ocean, waiting to ride the large
cresting waves that come crashing and foaming onto the beach as the scent of brine floats
in the sea breeze. Immediate images of bright rainbow colored, charismatic reef fish
swimming around their home of colorful anemones, sponges, and corals rush to the mind
of any snorkeler, scuba diver, or Finding Nemo watcher. For others, the word brings a
more fearful image to mind: ice blue water, stretching undisturbed as far as the eye can
see - an endless blue abyss. Monsters from sailors’ stories lurk unseen beneath the
surface. An unmistakable grey triangle shatters the calm, desolate, glass-like surface. It
undoubtedly belongs to a man eater, Jaws, waiting patiently for his next meal to fall into
his watery world.
Whatever comes to mind, calm, fun, or frightening, the first thoughts of the ocean
do not typically include the deep sea. It is a realm full of mystery and oddities,
unrecognized by many people. A black abyss, where little to no light penetrates, is
teaming with alien-like life. The deep sea and the bizarre creatures that live there remain
less explored and more poorly understood than the surface of the moon. This is an
1

investigation into some of these incredible deep-sea creatures and various aspects of their
diversity, distribution, and the threats humans pose to them.
The Ocean and the Deep-Sea
The world’s oceans cover 71% of the Earth’s surface (NOAA, 2013), attaining an
average depth of 3800 m (Nouvian, 2007). With such substantial depths, approximately
99% of Earth’s potential for housing life is held in the ocean waters, 85% of which is
contained in the low light or lightless waters of the deep sea (Nouvian, 2007).
Approximately 68% of Earth’s surface is covered with water deeper than 200 m (Angel,
1997) while waters deeper than 1000 m still account for 62% of Earth’s total surface
coverage (Davies et al., 2007). The waters of the deep sea hold more than 100 times the
collective volume of the rest of the world’s water, making the deep sea one of the largest
environments in the biosphere (Haedrich, 1997; Nouvian, 2007; Ramirez-Llodra et al.,
2011).
The ocean’s waters are commonly divided into four zones (Fig. 1-1) determined
by the intensity of light at depth in clear oceanic water along with the relationship to the
base of the continental land masses (Angel, 1997; McEachran & Fechhelm, 1998;
Herring, 2002; Robinson et al., 2010; Ramirez-Llodra et al., 2011). The first zone, the
epipelagic, extends from the surface down to 200 m. Almost all sunlight (~99% ) is
scattered or absorbed by 150 m, leaving only blue wavelengths to penetrate the deeper
waters (Robinson, 2004). This makes the epipelagic zone the only part of the ocean
where photosynthesis can occur (Gallaway et al., 2001). Below the epipelagic zone (220
2

m), the deep sea begins, characterized by waters where very little or no light is found
(Angel, 1997; Gallaway et al., 2001). The mesopelagic zone extends from 200 m to a
depth of 1000 m and can be broken into the upper mesopelagic zone and the lower
mesopelagic zone with the dividing line lying at about 600 m - 700 m (Angel, 1997).
Only trace amounts of light penetrate the mesopelagic waters, resulting in twilight, or
disphotic, conditions (Angel, 1997; Gallaway et al., 2001). Even in the clearest oceanic
waters, virtually no light penetrates beyond 1000 m. This creates the aphotic conditions
of the bathypelagic and abyssal zones (Angel, 1997; Gallway et al, 2001). The
bathypelagic zone extends from 1000 m - 6000 m and can be broken into the upper
bathypelagic (1200 m - 2300 m) and the lower bathypelagic (2400 m - 4000 m) zones
(Robinson, 2004). Below this lies the abyssal plain, which stretches along the ocean’s
floor at depths greater than 6000 m. Although these distinctions in oceanic zones are well
agreed upon, variations in continental margins and local bathymetry can result in
differences in the zonation from place to place (Angel, 1997).
Exhibiting no viable means for primary production through photosynthesis,
extremely high pressures, and very low temperatures, early scientists believed these deep
ocean waters to be devoid of life. This hypothesis was disproved in 1872 with the HMS
Challenger’s four year circumnavigation of the globe (Van Dover, 2007; Robinson,
2009). During the Challenger Expedition, led by Sir Charles Wyville Thomson, trawls
scraped the sea floor at depths up to approximately 5 miles (8047 m). Over 4000 new
species were discovered and described by the expedition, revealing the previously
unrecognized biodiversity of the deep sea (Van Dover, 2007). Since then, our knowledge
3

of the deep sea has only increased, further demonstrating the diversity of the biotic
communities in this ecosystem.
Deep-sea inhabitants have had to adapt to life in a very extreme environment
compared to their shallow-dwelling counterparts. As depth increases, temperatures drop
until they approach freezing, seasonal variability declines, and dissolved oxygen content
in the water decreases. Likewise, pressure increases 1 atm with each 10 m of depth,
resulting in pressures exceeding 100 atm in the bathypelagic zone (Haedrich & Merrett,
1992; Gallaway et al., 2001; Smith & Brown, 2002; Robinson, 2004; Robinson 2009).
Very little, if any, light extends into the deep sea, making photosynthesis impossible and
strictly limiting the amount of energy available to organisms (Pequegnat, 1983; Haedrich
& Merett, 1992; Gallaway et al., 2001; Smith & Brown, 2002; Gartner et al., 2007). At
1000 m, the biomass available as energy drops to only 5% of that which is found above
200 m (Gartner et al., 1997).
Some primary production occurs at hydrothermal vents via chemoautotrophic
organisms. However, the majority of deep-sea inhabitants directly or indirectly rely on
energy from the epipelagic zone (Pequegnat, 1983; Haedrich & Merrett, 1992; Gartner et
al., 1997; Smith & Brown, 2002; Gartner et al., 2007). Deep-sea organisms receive
nutrients from the surface waters via transportation in currents or downwellings.
Dissolved organic matter from the epipelagic zone also falls to the depths in the form of
“marine snow,” providing many deep sea organisms with a source of nutrition. Likewise,
marine and terrestrial plants and animal carcasses sometimes sink to the bottom of the
ocean where they become food for deep-sea benthic communities. Some deep-sea species
4

do not wait for the organic matter to drift down from the epipelagic. Many deep-sea
species of the meso- and upper bathypelagic zones feed on planktonic organisms found in
the surface waters where they are more concentrated. In order to avoid predators during
daylight hours when they are more visible, these species travel to the surface at night to
search for food, returning to the depths of the mesopelagic zone at dawn (Herring, 2002).
These daily vertical migrations are known as diel-vertical migrations and make up one of
the largest migrations in the animal kingdom (Fothergill, 2001). After feeding in the
epipelagic zone, the migrators carry the food down to the deep-sea, where they then
excrete their gut contents in the nutrient poor oceanic zone. In this way biomass, nutrients
and carbon are cycled back into deep-sea environments (Angel, 1997; Haedrich, 1997;
Herring, 2002; Youngbluth, 2007).
Fish o f the Deep Sea
Despite these extreme environmental conditions associated with deep-sea
habitats, 10- 15 % of known fish species are found to inhabit these waters (Gartner et al.,
1997) and evolutionary adaptations for living in these conditions have convergently
evolved in at least 22 orders of fish (Weitzman, 1997). Some of these adaptations include
reduced metabolisms, ambush predation strategies to reduce swimming distances, and
increased olfaction and mechanosensory detection to account for low-light conditions
(Montgomery & Pankhurst, 1997). An estimated 90% of deep-sea inhabitants are also
able to produce light for communication, mating, foraging, or predator avoidance
5

(Robinson, 2004). These are just a few of the adaptations species have evolved for
inhabiting the extreme environments of the deep-sea.
Observations that some taxonomic groups appear to be more prevalent in certain
zones has led to various hypotheses about the colonization of the deep-sea. One such
hypothesis observes the frequent occurrence of Perciformes, a relatively young order of
teleost fish on the evolutionary time scale, in the epipelagic zone. According to this
hypothesis, Perciformes colonized the epipelagic zone after being out-competed by older
taxonomic groups highly specialized to life in the deep-sea (Weitzman, 1997). The
general observation of Perciformes in the epipelagic leads to the prediction that the
epipelagic has been colonized more recently than the deep-sea, however no quantitative
data have been presented to support this conclusion.
Although relatively little is known about these deep-sea inhabitants compared to
organisms in shallow water communities, researchers have found that the faunal
assemblages of the deep-sea tend to vary with depth (Haedrich & Merrett, 1992; Angel,
1997; Haedrich, 1997; Moranta et al., 1998; Smith & Brown, 2002; Fujita et al., 2005;
Robinson et al., 2010). Studies find a decrease in species diversity with depth but spikes
in abundance and biomass in the upper bathypelagic zone (~1200 - 2300 m). Demersal
fish biomass in the Atlantic Ocean was found to be the highest in the mesopelagic (at 600
m), with decreasing biomass below this depth until 1200 m, where there was a peak in
biomass before further decreasing again (Haedrich & Merrett, 1992). A similar trend has
been found in the Mediterranean with the maximum fish biomass found between 1000 m
- 1200 m, followed by decreasing values at increasing depths (Moranta et al., 1998).
6

Although pelagic fish have been shown to have a low species richness below 600 m,
studies have cited increased numbers of pelagic fish species in the upper bathypelagic
around 1000 - 1100 m (Smith & Brown, 2002). A survey of Monterey Canyon found the
highest organism abundance of bathypelagic communities in the upper bathypelagic
between depths of 1500 m - 2000 m (Robinson et al., 2010). Causes for this trend are
unknown but changes in photosynthetic productivity, light limitation, temperature,
sediment characteristics, oxygen content, pressure, salinity, and depth have all been
predicted as factors influencing zonation of deep-sea faunal assemblages (Smith &
Brown, 2002; Powell & Haedrich, 2003; Fujita et al., 2005). More information is needed
to reveal any broadly applicable zonation patterns in the faunal assemblages of the deep
sea.
The Gulf o f Mexico
This study focuses on the deep sea ichthyofauna assemblages (fishes) of the Gulf
of Mexico. The Gulf of Mexico is a distinct biogeographical region (Pequegnat et al.,
1990; Garner et al., 1987; McEachran & Fechhelm, 1998) bordered by Mexico, Cuba and
the United States. With 4000 km of coastline and covering 1,138,980 km2, it is the ninth
largest body of water in the world. The eastern border is formed where the Caribbean Sea
and the Atlantic Ocean meet, in a line from Key West to Cape Catoche. There are three
geographical subregions of the Gulf of Mexico (Fig. 1-2). The Eastern subregion extends
from Florida Bay to Pensicola or Mobile, the western from Pensicola or Mobile to Cape
Rojo, and the southern from Cape Rojo to Cape Catoche. At its deepest, the Gulf of
7

Mexico extends to 3750 m, missing the abyssal zone’s upper boundary by only 250 m
(McEachran & Fechhelm, 1998; Ross et al., 2010). Average surface temperatures vary
seasonally, ranging from 18.3 - 29° C, while bathypelagic waters remain a fairly constant
4.35 ° C (Pequegnat et al., 1990; McEachran & Fechhelm, 1998). Throughout all
geographic and vertical regions, the benthos is comprised mostly of silty-clay sediment
(Pequegnat et al., 1990; McEachran & Fechhelm, 1998; Gallaway et al., 2001).
Nutrient and water flow are influenced by two major systems: the Mississippi
River output and the Loop Current (Pequegnat et al., 1990; McEachran & Fechhelm,
1998; Wei et al., 2012). The Mississippi River contributes 65% of the freshwater input
into the area as well as 4.1 x 10¹⁰ tons of sediment per year, which is deposited on the
northern slope and shelf (McEachran & Fechhelm, 1998). The deposits from the
Mississippi River are responsible for carrying organic matter into the Gulf of Mexico
(Gallaway et al., 2001). Organic matter, plants, pelagic fish and invertebrates as well as
their larvae are also brought into the Gulf by the Loop Current which flows into the Gulf
of Mexico from the Caribbean Sea. The current flows through the Yucatan Channel
(located between the northwestern tip of the Yucatan Peninsula and Cuba) then travels
north, towards the Mississippi River Delta, bends east towards Florida, and makes a final
loop south where it exits the Gulf of Mexico into the Atlantic Ocean between Florida’s
southern tip and Cuba (Gallaway et al., 2001). This current drives the major surface
circulation of the Gulf and brings warm Caribbean water into the area, affecting species
distribution throughout the Gulf of Mexico (Gallaway et al., 2001).
8

The Gulf of Mexico is of particular interest due to the diverse array of marine
organisms inhabiting the area. Although the ichthyofauna of the region is somewhat
poorly known, there has been extensive biological exploration of the region because of its
proximity to the United States. These began with land based surveys in the mid 1800’s
focusing on describing the newly discovered species of the Gulf of Mexico. The first
research vessel, the Blake, was deployed in the Gulf by the United States Coast Survey in
1872. The Blake, followed by the Albatross ’ and the Fish Hawk’s explorations in the late
1800’s, focused mainly on the research of shallow benthic environments, reefs, and
invertebrates, with an emphasis on bivalves (McEachran & Fechhelm, 1998). Beginning
in the early 1900’s marine laboratories began popping up along the northern coast of the
Gulf of Mexico, including the Gulf Biological Station in Cameron, Louisiana (1902
1910), the Marine Laboratory in Loggerhead Key, Dry Tortugas (1904), and the
Louisiana State University Laboratory on Grande Isle (late 1920’s - early 1950’s)
(McEachran & Fechhelm, 1998). At the same time, explorations in the Gulf of Mexico
were focusing more on the physical aspects of the area, investigating bathymetry,
oceanography, and hydrology (Moretzsohn et al., 2013). Researchers in marine
laboratories associated with universities such as the University of Miami, University of
Texas, and Florida State University continued to study the faunal assemblages of the Gulf
of Mexico through the mid 1900’s. Many of these researchers contributed to the
knowledge of the fish fauna of the area. The first investigations into the fauna of the
deep-sea were commissioned by Texas A&M University. The voyage of Alaminos in the
1960’s sampled the ichthyofaunal assemblages of the slope and abyssal plains of the Gulf
9

of Mexico (McEachran & Fechhem, 1998). The first quantitative macrofaunal sampling
of the deep-sea communities began in the 1970’s (Wei et al., 2012). In the 1980’s the
Mineral Management Service commissioned a three year survey of the northern Gulf of
Mexico benthos. The research contributed to the knowledge of the benthic environment
and the faunal assemblages of the northern Gulf of Mexico. Commissioned by LGL
Ecological Research Associate Inc., Texas A&M University supported an exploration
from 1983-1987. The mission of this exploration was the development of knowledge
about the deep Gulf of Mexico fauna and its relationship to the environment (Gallaway et
al., 2001). Both of the former studies were funded in light of the growing off shore oil
development in the Gulf, lending to greater concerns regarding the lack of understanding
about the deep sea communities in the area. In the 21st century fewer scientific
explorations of the fauna have been conducted. Only recently has research in the Gulf of
Mexico again been substantially conducted. After the Deepwater Horizon oil spill of
2010 released record amounts of crude oil compounds into the Gulf of Mexico, the
government increased its willingness to fund scientific explorations in the Gulf to try and
discover the impacts the oil will have on the environment and the organisms inhabiting
areas affected by the spill (Moretzsohn et al., 2013).
From this long history of surveys, it has become apparent that the region has a
relatively rich fauna, with 1,461 recorded species of fishes inhabiting the waters. Of
these, 66 species are endemic to the Gulf of Mexico (McEachran & Fechhelm, 2005).
While research on the pelagic midwater fauna below 200 m of the Gulf of Mexico is
scarce, deep benthic communities are relatively well sampled as a result of the extensive
10

oil exploration and drilling in the deep-sea (Ross et al., 2010). Most studies have been
conducted in the northern and eastern subregions of the Gulf of Mexico, however, in
these regions the ichthyofauna appears to be relatively homogeneous within depth
regions (Powell & Haedrich, 2003; Ross et al., 2010). While, some studies cite higher
abundance in the Mississippi Trough and DeSoto Canyon (Powell & Haedrich, 2003;
Wei et al., 2012), depth appears to be more important than geography in determining the
distribution of deep-sea faunal assemblages in the Gulf of Mexico (Powell & Haedrich,
2003; Ross et al., 2010).
Between about 1000 m and 1100 m not only does the light disappear entirely, but
the temperatures of the Gulf of Mexico drop to 4° C, a potential explanation for the
change in faunal assemblages noted by many scientists at this depth range (Gallaway et
al., 2001). In the Mineral Management survey of the deep Gulf of Mexico benthos
between 1983 and 1985, the fish diversity was found to increase up to 950 m in depth,
and then declined steadily with depth, drastically dropping below 2300 m. While fish
species richness decreased, many macrofaunal invertebrates (> 0.5 mm in size) showed
increasing species richness in the bathypelagic zone (below 1000 m), especially starfish
and sea cucumbers. Based on the data obtained during this study, Gulf of Mexico faunal
assemblages were broken into seven discrete intervals: The shelf/slope habitat (150 - 450
m; upper mesopelagic), the Archibenthal Horizon A zone (475 - 750 m; upper
mesopelagic into the lower mesopelagic), the Archibenthal Horizon B zone (775 - 950
m; lower mesopelagic), the Upper Abyssal zone (975 - 2250 m; lower mesopelagic
through the upper bathypelagic), the Mesoabyssal Horizon C (2275 - 2700 m; upper
11

bathypelagic and lower bathypelagic), Mesoabyssal Horizon D (2725 - 3200 m; lower
bathypelagic), and the Lower Abyssal zone (3225 - 3850 m; lower bathypelagic)
(Pequegnat, 1983).
Peaks in the abundance and density of meiofauna (> 0.05 mm in size) and
megafauna (> 2.5 mm in size) have also been cited in the Gulf of Mexico’s bathypelagic
zone with a small peak in abundance at 1000 m (Gallaway et al., 2001). The survey also
found a large peak in density in the upper mesopelagic around 300 m. Similarly, a
mesopelagic spike was also shown by Powell et al. (2003) where both abundance and
species richness of demersal Gulf of Mexico fish fauna were found to be greatest between
315 - 785 m and steadily decrease from there. While these studies seem to find a general
trend associated with depth, the data are only representative of portions of the Gulf of
Mexico and do not necessarily show the larger patterns of vertical distribution throughout
the entire geographic region.
The Scope o f This Study
The purpose of this study is to examine the broader distribution of the deep-sea
ichthyofauna in the Gulf of Mexico. By compiling previous catch data for species in the
Gulf of Mexico, this study will examine the geographical and vertical distributions of
deep-sea species in the region. It is hypothesized that the species richness in the Gulf of
Mexico will decline with depth, mirroring the documented patterns of density and
biomass mentioned above. While many species are vertical migrants and the minimum
depth is variable, species should only be able to travel to a certain depth due to
12

environmental constraints (e.g. light, temperature, pressure, etc.). Therefore, the pattern
of species richness is expected to match the maximum depth ranges of species. The study
also examines the taxonomic distributions of deep-sea inhabitants of the Gulf of Mexico.
Following the evolutionary hypothesis that percomorphs are of a younger evolutionary
development and have been out-competed in the deep-sea by older taxa that have evolved
to inhabit the harsh conditions at depth, percomorph species richness is expected to be
higher in the epipelagic and decrease with depth. This study will help to provide a better
understanding of the poorly understood, yet fairly well documented fish assemblages of
the deep Gulf of Mexico.
Materials and Methods:
McEachran and Fechhelm’s Fishes o f the Gulf o f Mexico Volumes 1& 2 (1998;
2005) were used as the primary references for the documented ichthyofauna of the Gulf
of Mexico. I recorded depth ranges from these volumes for all included 1,461 fish species
(McEachran & Fechhelm, 1998; 2005) and input these data into a Microsoft Excel
spreadsheet as integers in meters. Not all species listed are given depth ranges so data
were augmented by adding depth range data from Fishbase.org (Frose & Pauly, 2013).
Species known to inhabit coastal inshore areas, brackish waters, and coral reefs were
assumed to live only in the upper epipelagic zone, unless reported to occur deeper, and
were treated as having a maximum depth range of 100 m. The depth ranges in
McEachran and Fechhelm (1998; 2005) for all deep-sea species were double checked
using Fishbase.org (Frose & Pauly, 2013) by running a search on all species inhabiting
13

the meso- and bathypelagic zone. Ranges were obtained from Fishbase.org (Frose &
Pauly, 2013) for species with no documented ranges in McEachran and Fechhelm (1998;
2005) when available. Data for many deep-sea species are sparse. For this reason, even
though the depth ranges of many non-endemic species included in the study are not Gulf
of Mexico specific, ranges were assumed to be the same throughout each species’
geographic range. Many deep-sea inhabitants have been recorded as vertical migrants.
The depth ranges for these species include the migration ranges so that the minimum
depth is the absolute minimum depth documented. Species with no known range
distributions were excluded.
Species richness was examined using minimum and maximum depths for each
species. Species were assumed to inhabit all areas in between the minimum and
maximum documented depths. For the purpose of this study, maximum depth was
determined to be the most important range determinant for the species, assuming that
most species may migrate to the surface at night or live nearer the surface during earlier
ontogenetic stages but can only travel to a certain depth before environmental constraints
will restrict deeper migration. Vertical distribution patterns were determined by
examining number of species with maximum depths in 100 m intervals from the surface.
Range data were used to determine species richness and taxonomic
distributions of fish within varying depth intervals. Ranges were broken into four
different depth intervals and species richness and compositions were compared between
the four. The four intervals are listed in Table 1-1. For all four depth intervals, species
were determined to inhabit each interval which fell between their minimum and
14

maximum documented depths of occurrence. If data were missing for either the minimum
or maximum depths of occurrence for a species (so that the range data were incomplete)
the species was only said to inhabit the depth interval of the documented depth. Species
ranges were broken up into 100 m intervals. Species were counted as inhabiting each 100
m interval between the minimum and maximum depths for their documented range. A
buffer zone of 20 m was included into each range and only species with ranges falling
into the interval by over 20 m were included in the depth interval. Total numbers of
species inhabiting each interval was then summed to find species richness for the given
interval. These data were then log transformed and plotted on a graph in Microsoft
Excel. A linear regression was run on the data in PSAW Statistics 18 to test the
relationship between species richness and depth.
Species richness and taxonomic distributions were examined using the other three
intervals (Table 1-1). Ranges were broken into 200 m intervals up to 1000 m. Below this
depth species abundance is known to drop drastically. For this reason, the remaining
depths were broken only into two ranges: 1000 - 2000 m and 2000+ m. As described for
the 100 m intervals, a 20 m buffer was included in the 200 m intervals as well. Species
ranges were also broken into the intervals proposed by Pequegnat (1983) in his survey of
the Gulf of Mexico benthos: Shelf/ slope (150 - 450 m), Archibenthal Horizon A (475 -
750 m), Archibenthal Horizon B (775 - 950 m), Upper Abyssal (975 - 2250 m),
Mesoabyssal Horizon C (2275 - 2700 m) , Mesoabyssal Horizon D (2725 - 3200 m),
and Lower Abyssal (3225 - 3850 m ). For the purpose of this study the Mesoabyssal
Horizon C, Mesoabyssal Horizon D and Lower Abyssal zones were combined into the
15

Mesoabyssal zone because of the low fish species abundance at these depths (Table 1-1).
Following the methods of Pequegnat (1983), only species with minimum depth ranges of
150 m or maximum depth ranges exceeding 220 m were included in the Shelf/slope
interval, excluding many epipelagic species from these data. A 25 m buffer is already
included by Pequegnat (1983) between each interval; therefore, no additional buffer was
included. Finally, ranges were divided into traditional oceanic depth zones: epipelagic (0
- 200 m), upper mesopelagic (200 - 600 m), lower mesopelagic (600 - 1000 m), upper
bathypelagic (1000 - 2400 m) and lower bathypelagic (2400+ m). A 20 m buffer was
included in these intervals as mentioned above for the 100 m and 200 m depth intervals.
For example, Bathyuroconger vicinus, has a documented range of 229 m - 1318
m. For the 100 m intervals, this species was included in all ranges between 200 - 1300 m.
For the 200 m intervals, B. vicinus was included in all ranges besides the 0-200 m range.
The species was included in the Shelf/Slope, Archibenthal Horizon A, Archibenthal
Horizon B, and Upper Abyssal zones for Pequegnat’s intervals and in the upper and
lower mesopelagic and the upper bathypelagic zones for the traditional oceanic zones.
Taxonomic distributions were determined for these intervals by breaking species
into monophyletic groups (Table 1-2) using the phylogeny of Near et al. (2012) to
identify relevant clades. Species in this study are recognized in 24 different clades in the
Gulf of Mexico. Where possible traditional ordinal level taxa were used, recognizable
because they end in the suffix “-iformes.” The exceptions are the Chondrichthys and
Percomorpha. Members of the orders Carchariniformes, Chimeriformes,
Hexanchiformes, Lamniformes, Myliobatiformes, Orectolobiformes, Pristiformes,
16

Rajiformes, Squaliformes, and Topediniformes were all included in the clade
Chondrichthys. The clade Percomorpha includes species from the orders
Batrachoidiformes, Beloniformes, Cyprinodontiformes, Gasterosteiformes, Lophiiformes,
Mugiliformes, Perciformes, Pleuronectiformes, Scorpaeniformes, and Tetraodontiformes.
The use of the Percomorpha follows a more traditional usage (e.g., Nelson, 2006) rather
than the recent usage of Near et al. (2012) in excluding the Ophidiiformes from the
Percomopha. Because the Ophidiiformes are the sister clade to the traditional
Percomorpha (Near et al., 2012), this difference is simply one in naming and not in how
the basic biological entities (clades) are recognized. Taxonomic uncertainty is greatest
within the Percomorpha, and these grouping ensure that all clades studies originated by
approximately 100 million years ago (Near et al., 2012).
Taxonomic distribution patterns were examined by counting the number of
species from each clade within the various depth intervals. The number of species in each
clade was totaled for each discrete depth interval. The percentage of species representing
each clade was calculated by comparing the number of species in each clade at a given
depth interval to the total number of species occupying that depth interval. Taxonomic
distribution patterns were compared across the three sets of depth intervals mentioned
above. Patterns were identified by eye based on graphs generated using Microsoft Excel.
Patterns were also visualized in a continuous form by graphing the percentage of total
species in 100 m intervals for all clades that represent at least 15% of the total species
richness at some depth, with the exception of the chondrichthyan clade.
17

Results:
Vertical distributions were examined from 1461 species known to inhabit the
Gulf of Mexico. The first 100 m of the Gulf of Mexico is the most speciose. Below 100
m, the species richness decreases exponentially with increasing depths. Linear regression
of log-transformed data indicate a tight fit of the data to a log-transformed linear decrease
(Fig 1-3; R2 = 0.968, t = -33.369, p < 0.001).
Trends in maximum depths for species found below the epipelagic zone (>220 m)
demonstrate an increase in the number of species’ depth maxima from the 300 m (upper
mesopelagic) until 600 m (the barrier between upper and lower mesopelagic). Below 600
m, the number of species’ depth maxima in each interval drop until there is a peak at
1000 m (the boundary between meso-and bathypelagic), 1500 m (the upper
bathypelagic), and another at 2000 m (the upper bathypelagic). Beyond 2000 m, there are
less than 10 species with depth maxima in each interval (Fig. 1-4).
The 200 m depth intervals (Fig. 1-5 & 5, Tables 1-3 & 1-4) demonstrate that
species richness declines substantially after the first 200 m (epipelagic zone) but has a
more gradual decrease for depths below 200 m (meso- and bathypelagic zone).
Percomorpha represents the majority (67%) of the high number of species in the
epipelagic but the proportion of percomorphs in each depth interval decreases,
representing only 33% of species in the 200 - 400 m range, 24% in the 400 - 600 m
range, 17% in the 600 - 800 m range, 14 % for 800 - 1000 m and 1000 - 2000 m ranges,
and 7% for depths exceeding 2000 m (Fig. 1-6). The species composition is not
homogenous for all depth intervals and as the number and proportion of percomorphs
18

decreases, other clades proportionally increase (Fig. 1-7). For example, Osmeriformes
and Ophidiiformes represent only 0.5% and 1.8% of the total species composition
respectively from 0 - 200 m. However, in the depths below 2000 m they represent 17.8%
and 19.2% of species respectively.
Species richness and taxonomic distributions showed similar trends for
Pequegnat’s (1983) intervals (Fig. 1-8, Tables 1-5 & 1-6) and for traditional oceanic
intervals (Fig. 1-9, Tables 1-7 & 1-8). While both zonation patterns show declining
species richness with depth, Pequegnat’s (1983) intervals don not appear to follow an
exponential decline, but rather follow a more step-like pattern. The traditional oceanic
vertical divisions show a similar trend in declining species richness as displayed by 200
m intervals. In both Pequegnat’s (1983) and the traditional oceanic intervals,
percomorphs compose a smaller proportion of the species in deeper intervals. For
Pequegnat’s (1983) intervals, Percomorpha represents 32.72% for Shelf/Slope (150 - 450
m) then drops to 21.05% for Archibenthal A (475 - 750 m), 13.57 % for Archibenthal B
(775 - 950 m), 12.25% for Upper Abyssal (975 - 2250 m) and 5.36% for Mesoabyssal
(2275+ m). The traditional oceanic intervals show Percomorpha declining from 66.7%
(epipelagic; 0-200 m) to 30.39% (upper mesopelagic; 200-600 m), 15.60% (lower
mesopelagic; 600-1000 m), 13.04% (upper bathypelagic; 1000-2400 m), and 10.64%
(lower bathypelagic; 2400+ m). Osmeriformes and Ophidiiformes also show trends
comparable in the 200 m intervals with values of 0.54% and 1.79% respectively in the
epipelagic and values of 14.89% and 17.02% respectively in the lower bathypelagic.
19

Distribution patterns also show variation for individual clades with depth.
Percomorpha is highly represented in the first 100 m, however after that, the number of
percomorphs drops drastically and by 1000 m, there are very few representatives (Fig. 1
10). Other clades do not show such drastic declines with depth. Stomiiformes have
proportionally fewer representatives than Percomorpha (Fig. 1-10) but show a much less
drastic drop in species with depth (Fig. 1-11). Unlike Percomorpha, Stomiiformes show a
peak in species abundance between 300 - 600 m (upper mesopelagic). This trend is
mimicked by another clade of vertical migrating fishes, Myctophiformes (Fig. 1-11).
Myctophiformes similarly show a peak species abundance in the upper mesopelagic
around 400 - 500 m. However, the Myctophiformes also show a relatively similar species
abundance between 0 - 400 m before the peak and show a much more drastic drop below
800 m and are entirely absent from depths below 2000 m.
Osmeriformes and Ophidiiformes have fewer species in the Gulf of Mexico than
Percomorpha, Stomiiformes, and Myctophiformes, but show different vertical
distribution patterns (Fig. 1-12). Osmeriformes have fewer species than Ophidiiformes
between 0 - 400 m but have more species present than the Ophidiiformes between 400 -
1900 m. However, by 2000 m, both clades show similar declining patterns of number of
species with depth.
Chondrichthyans show relatively constant values proportionally to other
examined clades (Fig. 1-6, Table 1-4). Excluding 0 - 200 m, where Chondrichthyans
show a value of 6.52%, and 2000+ m, where the value drops to 2.74%, Chondrichthyans
represent between 11.06 and 12.35% of species for all depths between 200 - 2000 m.
20
However, the total number of chondrichthyan species in each depth interval is not as
evenly represented (Fig. 1-13). The maximum number of Chondrichthyan species is
found between 0 - 100 m, after which there is a steep decline in number species before
showing another peak in species for 300 - 400 m with steadily decline with greater depth.
Discussion:
Species Richness declines exponentially with depth (Fig. 1-3). This pattern of
diversity does not support the hypothesis that the species richness will show peaks in the
upper bathypelagic, mirroring documented patterns of abundance and biomass in
Montery Canyon’s faunal communities (Robinson et al., 2010), macrofaunal
communities in the Gulf of Mexico (Gallaway et al., 2001), the demersal fish
assemblages of the North Atlantic (Haedrich & Merrett, 1992), and fish communities in
the Mediterranean (Moranta et al., 1998). While no peaks were found in species richness
in the upper bathypelagic as expected, these results are consistent with documented
species richness trends in pelagic fish assemblages of the Eastern Pacific (Smith &
Brown, 2002) and fish communities in the Mediterranean (Moranta et al., 1998). The
species richness of the Eastern Pacific closely follows the exponential trend shown in this
study with the exception of finding a maximum between 100 - 200 m instead of the 0 -
100 m maximum seen in the Gulf of Mexico (Smith & Brown, 2002). The exponential
trend is not seen in the fish communities of the Mediterranean (Moranta et al., 1989) but
that is explained by the fact that the sample did not include species richness in the
epipelagic. Below 200 m (i.e., below the epipelagic) a linear regression line for the
21

Mediterranean fish communities well explained the presented species-richness data, very
similar to the trend seen for the Gulf of Mexico. Alternatively, a study conducted on the
demersal fish communities in the northern Gulf of Mexico found a maximum species
richness in the lower mesopelagic between 315 -785 m, below which there was declining
species richness (Powell & Haedrich, 2003). Some of the difference in results may be due
this study’s excluded portion of the epipelagic (sampling began at 188 m for the
shallowest interval). However some of the depth intervals tested in the current study
exclude the epipelagic, yet the trends for the other depth ranges are consistent with those
including epipelagic species, further refuting the findings from the demersal fish survey
of the northern Gulf of Mexico (Powel & Haedrich, 2003). This inconsistency in the data
could simply be an artifact of the exclusion of pelagic fishes in the previous study.
Regardless of the differences in depths of maximum species richness, there appears to be
a general trend in decreasing species richness with increasing depths. This suggests that
the documented peaks in biomass and density found in the upper bathypelagic zone in
previous studies are not caused by diversity but rather by abundance and density of the
species occupying these ranges. Future studies should be conducted examining the
species composition and biomass as it relates to increasing depths to gain a better
understanding of what is influencing the peaks in the upper bathypelagic zone.
Maximum depths were also examined because it was determined to be an
important range determinant for species. While upper limits of many ranges are more
flexible (due to ontogenic and diel-vertical migrations) the maximum documented depth
is restricted by environmental factors (pressure, temperature, salinity, etc.) that likely
22

prevent the free movement of species into deeper areas. Maximum depths were expected
to follow a similar trend to species richness; however, this hypothesis was also rejected.
Instead of declining with depth, the number of species-range maximums increased for
depths of around 600 m, 1000 m, 1500 m and 2000 m. A previous study conducted by the
Mineral Management Service found breaks in species assemblages at around 450 m, 750
m, 950 m, and 2250 m (Pequegnat, 1983). My data, however, fits more closely with
traditional oceanic zonation breaks compared to the faunal assemblage breaks determined
by Pequegnat (1983). The increases in maximum depth occur at the upper
mesopelagic/lower mesopelagic boundary (which falls ~600 - 700 m), the boundary
between the mesopelagic and bathypelagic zones (at 1000 m) and at two points within the
upper bathypelagic zone (which extends to 2200 m). Sampling limitations preventing
accurate estimation of maximum-depth ranges for some species but these results are
consistent with trends found for pelagic fish of the Atlantic Ocean (Smith & Brown,
2002) which show peaks in the maximum-depth counts between 500 - 700 m, 1000 -
1100 m, and 1400 - 1500 m. These data suggest that the factors influencing traditional
oceanic zonation, such as light and relationship to continental land masses, are also
strongly affecting the vertical distribution of species.
There also appears to be taxonomic variation along the vertical gradient. It has
been hypothesized that the percomorphs are a relatively young clade that never colonized
deeper waters due to competition from older clades, more specialized to living in the
extreme environment of the deep sea. To test this hypothesis, this study examined
proportions of monophyletic taxonomic groupings at depth intervals. In support of the
23

hypothesis, higher proportions of percomorphs were found in shallower waters. Over
75% of the species found in the epipelagic are representatives of Percomorpha. The
abundance of percomorph species declines sharply below the epipelagic zone. Opposing
this trend, Ophidiiformes and Osmeriformes are very poorly represented in the epipelagic
(making up only 2% and 1% of total species composition of the epipelagic respectively).
However, both of these groups have proportionally more representatives as depth
increases, reaching maximum percentages of representative species in the bathypelagic
zone. These two groups show that there are certain taxonomic clades which have become
specialized for living in the deep-sea. Percomorpha has relatively few representatives in
the deeper ocean, supporting the hypothesis that this clade is more specialized to life in
the epipelagic zone and may also lend support to the hypothesis that percomorphs
colonized the epipelagic and later moved into deeper waters.
These data also show interesting trends in several other groups, markedly in two
orders known for their diel-vertical migrations: the Myctophiformes and Stomiiformes
(Gartner et al., 1987; Sutton & Hopkins, 1996; Hopkins et al., 1998). Myctophiforms
make up the highest percentage of the species composition in the mesopelagic. Although,
the percentage of representative species in the epipelagic is markedly lower than that
found in the mesopelagic, the actual number of species found in the epipelagic is almost
exactly the same as that found in the mesopelagic. This confirms that most of the
myctophiforms are migrating to the surface at night. Interestingly, the number of species
found below the mesopelagic is much lower. This may be due to sampling errors, as
many myctophiforms had no documented maximum depth. However, this group of fish
24

may be primarily found in the mesopelagic with only few, larger individuals found in the
deeper waters of the bathypelagic zone. More studies are required on these species to
determine the ranges they may occupy.
Stomiiformes have also been widely suspected of being daily migrators. However,
the data presented in this study does not fully agree. Like myctophiforms, the majority of
the Stomiiformes appear to inhabit mesopelagic waters. However, there is a large drop in
the number of species which have been found in the epipelagic. This suggests that not all
stomiiform fishes migrate into the epipelagic at night. However, this may be another
artifact of sampling times not accurately depicting all migrating species. Another
possibility is that a large number of species of Stomiiformes occupy the lower
mesopelagic or upper bathypelagic, and only migrate into the upper mesopelagic without
reaching the epipelagic (Gartner et al., 1987; Sutton & Hopkins, 1996). Further studies
should be conducted on these species to determine the full extent of their ranges and at
which ranges migration occur.
There is an interesting trend in Chondrichthyan species richness. Unlike the
previously mentioned groups, the Chondrichthyans compose a relatively stable percent of
the ichthyofauna in each depth. Proportionally, the Chondrichthyans show a slight
decrease in the epipelagic, but their percent composition of the ichthyofauna is constant
throughout the mesopelagic and into the upper bathypelagic. There are proportionally
fewer species representing Chondrichthyans in the epipelagic and lower bathypelagic
zones. However, there may be more representatives at depth (such as large sleeper and
gulper sharks) which have yet eluded capture in deep-sea surveys because their large size
25

makes trawl-net capture rare. There is also a substantial decrease in the number of
Chondrichthyan species between 100 - 300 m. This is very likely due to a lack of data
about these species. Many pelagic sharks have documented depth ranges below 100 m.
This lower species richness may be due to the fact that they are too large to be caught
using standard sampling methods. More studies should be conducted to determine if
epipelagic Chondrichthyans occupy deeper ranges than are currently documented. The
consistent presence of Chondrichthyans throughout the ocean depth zones points to their
importance in the oceanic ecosystem and suggests that these species may be important
indicators of the ecosystem’s health.
26

Figure 1-1: The vertical zonation of the ocean (from seasky.org). Brown represents the continental and oceanic crust while blue shows water. Labels on the crustal landmass denote changes in continental slope while labels in the water show oceanic zones and the depths associated with them.
27

Figure 1-2: Map of the Gulf of Mexico showing prominent bathymetric and geographical features. Basemap source: NOAA
28

1200
Deprh (in)
Figure1- 3: Species richness shown by the total number of species found in each depth range. Ranges are depicted in 100 m intervals. Number of species represents the total number of species documented to inhabit the range. The histogram (Top) depicts total species richness at each depth interval. The scatter plot with best fit line (bottom) depicts the log transformed number of species, indicating an exponentially declining species richness with increasing depth (R2 = 0.968).
29

80
70
60
.a 50 &« 40 -«4-
J 30 S1 20
10
0 ~T~H"~ H -TT-t i rfl r-TTn r-T l-r-
^ ^ ^ ^ ^ ^ ^ ^ 0? n'S’ ^ nS^ ^ ^
Depth (m)
Figure 1-4: The number of species with depth range maxima in each range. Ranges are in 100 m intervals. Only species with depth maximums below 220 m are included.
30

0-200 m 200-400 m 400-600 m 600-800 m 800-1000 m 1000-2000 m 2000 + m
Depth Interval
■ Acipen seriform e s ■ Albuliformes U Angulliformes
■ A tel eopodiformes h Atheri niform e s HAuloptfomies
■ B eryciform es H Chondrichthyans U Clupeiform es
aElopi formes uGadiformes u L ampiri diform e s
u Myctophiformes H Myxniform es u Notacanthiformes
H Ophidiiformes u Osmeriformes u Percomorpha
■J P etromy zontifonn es -i P olym ixi iform e s -J Semionotiformes
U Siluriform es u Stephanober>rcifonn es .J Stomiiform es
_iZeiformes
Figure 1-5: Species richness at 200 m depth intervals except for the last two which are larger intervals. The bars denote the total number of species found in each depth interval. Pie charts above each bar denote the percent species composition by clade in each depth interval.
31

Figure 1-6: Taxonomic distribution of the Gulf of Mexico ichthyofauna in 200 m depth intervals. Each section of the pie chart represents the percentage of species for each clade at each depth interval. Numbers on sections represent the total number of species representing the clade in the given depth interval. Numbers of species are only shown for species which show prominent trends in vertical distributions. Clade names are in bold in the legend for groups which have numerical values shown in the charts.
32

eegatneureo.
70
60
50
40
30
20
10
0
80AulopiformesChondrichthyansGadiformesMyctophiformesOphidiiformesOsmeriformesPercomorphaStomiiformes
0 00 0t" OS3 3Depth (m)
Figure 1-7: Percentage of the total species richness attributed to each clade. Clades are only included if percentage exceeds 15% for at least one depth, with the exception of Chondrichthyans.
33

600
500
•Si« 400 p
£ 300 e.aEE| 200
100
Shelf/ slope (150450 m)
Archibenthal Zone Archibenthal Zone BUpper Abyssal (975- Mesoabyssal (2275-A (475-750 m) (775-950 m)
Depth Interval2250 m) 3850 m)
■ Acipen seiifotm e s ■ Albnliformes y Angulliformes
■ A tel eopo diformes H Atheri niform e s u Aulopiform es
■ B eryciform es a Chondrichthyans y Clupeifonu es
aElopiform es U Gadiformes u Lampiri diformes
u Myctophiformes H Myxniform es M Notacanthiformes
y Ophidiiformes u Osmeriformes j Percomorpha
■J Petromyzontiformes _i P oly m ixi ifor m e s -i Semionotiform es
u Siluri formes j Stephanob eryciform es _i Stomiiform es
_iZeiformes
Figure 1-8: Species richness at Pequegnat’s (1983) depth intervals. The bars denote the total number of species found in each depth interval. Pie charts above each bar denote the percent species composition by clade in each depth interval
0
34

Epipelagic Upper Mesopelagic Lower Mesopelagic Upper BathypelagicLower BathypelagicDepth Interval
■ Acipen seriform e s ■ Albuliformes H Angulliformes
■ A tel eopo diformes B Atheriniformes H Aulopiform es
■ B eryciform es y Chondrichthyans y Clupeiform es
aElopi formes y Gadiformes u Lampiri diformes
y Myctophiformes aMyxniformes H Notacanthiformes
H Ophidiiformes u Osmeriformes j Percomorpha
u Petromyzontiformes u Poly mi x i if onn es -i Semionotifbrmes
u Silnrifbrm es j Stephanob eryciform es y Stomiiform es
_iZeiformes
Figure 1-9: Species richness at traditional oceanic depth intervals. The Epipelagic extends from 0 - 200 m, the Upper Mesopelagic from 200 - 600 m, the Lower Mesopelagic from 600 - 1000 m, the Upper Bathypelagic from 1000 - 2400 m and the Lower Bathypelagic from 2400 m to the bottom of the Gulf. The bars denote the total number of species found in each depth interval. Pie charts above each bar denote the percent species composition by clade in each depth interval
35

Num
ber
of sp
ecie
s
700
600
500
400
300
200
100
0
Depth (m)
Figure 1-10: Number of species of Stomiiformes (beige line) and Percomorphs (orange line) at 100 m intervals, showing vertical distribution of each clade.
Stomiiformes
Percomorpha
36

Num
ber
of sp
ecie
s
70
Depth (m)
Figure 1-11: Number of species of Stomiiformes (beige line) and Myctophiformes (blue line) at 100 m intervals, showing vertical distribution of each clade.
37

Num
ber
of sp
ecie
s
20
18
16
14
12
10
Ophidiiformes
Osmeriformes
^ ^ dfP ^ ^ ^ ^ ^ oS ^ ^ ^ /f? J?> 75 *5 , ' FT N > N ? N P V ^ V V V V V ^ V V V ' 1?'fS (?> ^ ^ c S S ’ ^tSS ' tSPoSS' ^r SS ’ tSPtS?’ ^ rg? tS?* tS? aS?^ f \» ^ f fj> f f f ^ f y rp - n!p r§>
Depth (m)
Figure 1-12: Number of species of Ophidiformes (purple line) and Osmeriiformes (blue line) at 100 m intervals, showing vertical distribution of each clade.
8
6
0
38

Num
ber
of sp
ecie
s
80
70
Depth (m)
Figure 1-13: Number of species of Chondrichthyan at 100 m intervals, showing vertical distribution
39

Table 1-1: Depth intervals species ranges were broken into for species richness and taxonomic distribution studies
Depth Interval Intervals IncludedBuffer
Included100 m intervals Every 100 m from 0 - 3900 m 20 m
200 m intervals (up to 1000 m)
0 - 200 m 200 - 400 m 400 - 600 m 600 - 800 m 800 - 1000m 1000 - 2000m 2000 + m
20 m
Shelf / Slope: 150 - 450 m
Archibenthal A: 475 - 750 m
Pequegnat’s (1983) Intervals Archibenthal B:
Upper Abyssal :
Mesoabyssal :
775 - 950 m
975 - 2250 m
2275 m +
No extra included
Epipelagic: 0 - 200 m
UpperMesopelagic: 200 - 600 m
Traditional Oceanic ZonesLowerMesopelagic:
UpperBathypelagic:
LowerBathypelagic:
600 - 1000 m
1000 - 2400m
2400 m +
20 m
40

Table 1-2: Cladistic breakdown of ichthyofauna in the Gulf of Mexico used for examination of taxonomic distribution with respect to depth. Clades were determined using Near et al (2012).
Clade Common Name Orders IncludedAcipenseriformes Sturgeons and Acipenseriformes
PaddlefishesAlbuliformes Bonefishes AlbuliformesAngulliformes Eels AnguliformesAtheriniformes Silversides AteleopodiformesAulopiformes Lizzardfishes AulopiformesBeryciformes Toadfishes BeryciformesChondrichthyans Cartilaginous Fishes Carcharhiniformes Orectolobiformes
(sharks, skates, and Chimeriformes Pristiformesrays) Hexanchiformes Rajiformes
Lamniformes SqualiformesMyliobatiformes Torpediniformes
Clupeiformes Sardines ClupeiformesElopiformes Tarpons and Elopiformes
LadyfishesGadiformes Cods GadiformesLampiridiformes Lamprids LampiridiformesMyctophiformes Lanternfishes MyctophiformesMyxniformes Hagfishes MyxniformesNotacanthiformes Spiny eels NotacanthiformesOphidiiformes Cusk eels OphidiiformesOsmeriformes Smelts OsmeriformesPercomorpha Spiny-rayed Batrachoidiformes Mugiliformes
fishes Beloniformes PerciformesCyprinodontiformes PleuronectiformesGasterosteiformes ScorpaeniformesLophiiformes Tetraodontiformes
Petromyzontiformes Lampreys PetromyzontiformesPolymixiiformes Beardfishes PolymixiiformesSemionotiformes Holosteans Semionotiformes
41

Siluriformes Catfishes SiluriformesStephanoberyciformes Ridgeheads StephanoberyciformesStomiiformes Dragonfishes StomiiformesZeiformes Dories Zeiformes
42

Table 1-3: Cladistic breakdown of species richness for 200 m depth intervals
Clade 0 - 200 m 200 - 400 m 400 - 600 m 600 - 800 m 800 - 1000 m 1000 - 2000 m 2000 + mAcipenseriformes 1 0 0 0 0 0 0Albuliformes 1 0 0 0 0 0 0Angulliformes 65 34 29 20 18 14 3Ateleopodiformes 1 1 2 1 0 0 0Atheriniformes 7 0 0 0 0 0 0Aulopiformes 25 27 24 17 18 15 8Beryciformes 14 8 10 4 4 2 1Chondrichthyans 73 52 48 37 30 22 2Clupeiformes 26 0 0 0 0 0 0Elopiformes 2 0 0 0 0 0 0Gadiformes 13 19 26 30 24 23 7Lampiridiformes 2 3 2 1 1 0 0Myctophiformes 48 50 51 47 25 12 0Myxniformes 0 1 2 2 1 1 0Notacanthiformes 1 1 3 5 6 5 2Ophidiiformes 20 15 12 11 10 15 14Osmeriformes 6 11 14 12 16 19 13Percomorpha 747 151 96 50 33 27 5Petromyzontiformes 1 0 0 0 0 0 0Polymixiiformes 2 2 2 1 0 0 0Semionotiformes 3 0 0 0 0 0 0Siluriformes 3 0 0 0 0 0 0Stephanoberyciformes 2 4 7 7 11 8 7Stomiiformes 53 65 69 55 44 36 11Zeiformes 4 7 4 2 2 0
Total 1120 451 401 302 243 199 73

Table 1-4: Percentage of total species richness for each 200 m depth interval accounted for by each clade
Clade 0 - 200 m % 200 - 400 m % 400 - 600 m % 600 - 800 m % 800 - 1000 m % 1000 - 2000 m % 2000 + m %Acipenseriformes 0.09 0.00 0.00 0.00 0.00 0.00 0.00Albuliformes 0.09 0.00 0.00 0.00 0.00 0.00 0.00Angulliformes 5.80 7.54 7.23 6.62 7.41 7.04 4.11Ateleopodiformes 0.09 0.22 0.50 0.33 0.00 0.00 0.00Atheriniformes 0.63 0.00 0.00 0.00 0.00 0.00 0.00Aulopiformes 2.23 5.99 5.99 5.63 7.41 7.54 10.96Beryciformes 1.25 1.77 2.49 1.32 1.65 1.01 1.37Chondrichthyans 6.52 11.53 11.97 12.25 12.35 11.06 2.74Clupeiformes 2.32 0.00 0.00 0.00 0.00 0.00 0.00Elopiformes 0.18 0.00 0.00 0.00 0.00 0.00 0.00Gadiformes 1.16 4.21 6.48 9.93 9.88 11.56 9.59Lampiridiformes 0.18 0.67 0.50 0.33 0.41 0.00 0.00Myctophiformes 4.29 11.09 12.72 15.56 10.29 6.03 0.00Myxniformes 0.00 0.22 0.50 0.66 0.41 0.50 0.00Notacanthiformes 0.09 0.22 0.75 1.66 2.47 2.51 2.74Ophidiiformes 1.79 3.33 2.99 3.64 4.12 7.54 19.18Osmeriformes 0.54 2.44 3.49 3.97 6.58 9.55 17.81Percomorpha 66.70 33.48 23.94 16.56 13.58 13.57 6.85Petromyzontiformes 0.09 0.00 0.00 0.00 0.00 0.00 0.00Polymixiiformes 0.18 0.44 0.50 0.33 0.00 0.00 0.00Semionotiformes 0.27 0.00 0.00 0.00 0.00 0.00 0.00Siluriformes 0.27 0.00 0.00 0.00 0.00 0.00 0.00Stephanoberyciformes 0.18 0.89 1.75 2.32 4.53 4.02 9.59Stomiiformes 4.73 14.41 17.21 18.21 18.11 18.09 15.07Zeiformes 0.36 1.55 1.00 0.66 0.82 0.00 0.00

Table 1-5: Cladistic breakdown of species richness for Pequegnat’s depth intervals
CladeShelf/ slope (150
450)Archibenthal
Zone A (475-750)Archibenthal
Zone B (775-950)Upper Abyssal
(975-2250)Mesoabyssal(2275-3850)
Acipenseriformes 0 0 0Albuliformes 0 0 0 0 0Angulliformes 39 25 17 17 3Ateleopodiformes 2 2 0 0 0Atheriniformes 0 0 0 0 0Aulopiformes 29 24 21 20 6Beryciformes 9 10 4 4 1Chondrichthyans 55 51 30 25 1Clupeiformes 0 0 0 0 0Elopiformes 0 0 0 0 0Gadiformes 25 32 28 27 5Lampiridiformes 3 2 1 1 0Myctophiformes 51 49 29 16 0Myxniformes 2 2 2 1 0Notacanthiformes 2 5 6 6 2Ophidiiformes 16 14 10 19 11Osmeriformes 11 14 15 27 9Percomorpha 159 84 35 31 3Petromyzontiformes 0 0 0 0 0Polymixiiformes 2 2 0 0 0Semionotiformes 0 0 0 0 0Siluriformes 0 0 0 0 0Stephanoberyciformes 6 8 11 15 5Stomiiformes 68 70 47 44 10Zeiformes 7 5 2 0 0
Total 486 399 258 253 56

Table 1-6: Percentage of total species richness for Pequegnat’s depth intervals accounted for by each clade
Clade Shelf/ slope Archibenthal Zone Archibenthal Zone B Upper Abyssal (975- Mesoabyssal (2275-(150-450) % A (475-750) % (775-950) % 2250) % 3850) %
Acipenseriformes 0.00 0.00 0.00 0.00 0.00Albuliformes 0.00 0.00 0.00 0.00 0.00Angulliformes 8.02 6.27 6.59 6.72 5.36Ateleopodiformes 0.41 0.50 0.00 0.00 0.00Atheriniformes 0.00 0.00 0.00 0.00 0.00Aulopiformes 5.97 6.02 8.14 7.91 10.71Beryciformes 1.85 2.51 1.55 1.58 1.79Chondrichthyans 11.32 12.78 11.63 9.88 1.79Clupeiformes 0.00 0.00 0.00 0.00 0.00Elopiformes 0.00 0.00 0.00 0.00 0.00Gadiformes 5.14 8.02 10.85 10.67 8.93Lampiridiformes 0.62 0.50 0.39 0.40 0.00Myctophiformes 10.49 12.28 11.24 6.32 0.00Myxniformes 0.41 0.50 0.78 0.40 0.00Notacanthiformes 0.41 1.25 2.33 2.37 3.57Ophidiiformes 3.29 3.51 3.88 7.51 19.64Osmeriformes 2.26 3.51 5.81 10.67 16.07Percomorpha 32.72 21.05 13.57 12.25 5.36Petromyzontiformes 0.00 0.00 0.00 0.00 0.00Polymixiiformes 0.41 0.50 0.00 0.00 0.00Semionotiformes 0.00 0.00 0.00 0.00 0.00Siluriformes 0.00 0.00 0.00 0.00 0.00Stephanoberyciformes 1.23 2.01 4.26 5.93 8.93Stomiiformes 13.99 17.54 18.22 17.39 17.86Zeiformes 1.44 1.25 0.78 0.00 0.00

Table 1-7: Cladistic breakdown of species richness for traditional oceanic zones
Clade Epipelagic Upper Mesopelagic Lower Mesopelagic Upper Bathypelagic Lower BathypelagicAcipenseriformes 1 0 0 0 0Albuliformes 1 0 0 0 0Angulliformes 65 40 21 15 2Ateleopodiformes 1 2 1 0 0Atheriniformes 7 0 0 0 0Aulopiformes 25 30 22 15 6Beryciformes 14 11 4 2 1Chondrichthyans 73 59 37 20 1Clupeiformes 26 0 0 0 0Elopiformes 2 0 0 0 0Gadiformes 13 28 31 24 4Lampiridiformes 2 3 1 0 0Myctophiformes 48 52 49 13 0Myxniformes 0 2 2 1 0Notacanthiformes 1 3 6 5 1Ophidiiformes 20 17 13 19 8Osmeriformes 6 15 16 22 7Percomorpha 747 155 51 27 5Petromyzontiformes 1 0 0 0 0Polymixiiformes 2 2 1 0 0Semionotiformes 3 0 0 0 0Siluriformes 3 0 0 0 0Stephanoberyciformes 2 9 11 8 4Stomiiformes 53 75 59 36 8Zeiformes 4 7 2 0 0
Total 1120 510 327 207 47

Table 1-8: Percentage of total species richness for traditional oceanic zones accounted for by each clade
Clade % Epipelagic % Upper Mesopelagic % Lower Mesopelagic % Upper Bathypelagic % Lower BathypelagicAcipenseriformes 0.09 0.00 0.00 0.00 0.00Albuliformes 0.09 0.00 0.00 0.00 0.00Angulliformes 5.80 7.84 6.42 7.25 4.26Ateleopodiformes 0.09 0.39 0.31 0.00 0.00Atheriniformes 0.63 0.00 0.00 0.00 0.00Aulopiformes 2.23 5.88 6.73 7.25 12.77Beryciformes 1.25 2.16 1.22 0.97 2.13Chondrichthyans 6.52 453.85 11.31 9.66 2.13Clupeiformes 2.32 0.00 0.00 0.00 0.00Elopiformes 0.18 0.00 0.00 0.00 0.00Gadiformes 1.16 155.56 9.48 11.59 8.51Lampiridiformes 0.18 0.59 0.31 0.00 0.00Myctophiformes 4.29 216.67 14.98 6.28 0.00Myxniformes 0.00 0.39 0.61 0.48 0.00Notacanthiformes 0.09 0.59 1.83 2.42 2.13Ophidiiformes 1.79 3.33 3.98 9.18 17.02Osmeriformes 0.54 2.94 4.89 10.63 14.89Percomorpha 66.70 30.39 15.60 13.04 10.64Petromyzontiformes 0.09 0.00 0.00 0.00 0.00Polymixiiformes 0.18 0.39 0.31 0.00 0.00Semionotiformes 0.27 0.00 0.00 0.00 0.00Siluriformes 0.27 0.00 0.00 0.00 0.00Stephanoberyciformes 0.18 1.76 3.36 3.86 8.51Stomiiformes 4.73 14.71 18.04 17.39 17.02Zeiformes 0.36 1.37 0.61 0.00 0.00

References
Angel, M.V. (1997). “What is the deep sea?”. In Deep-Sea Fishes. San Diego: Academic Press. pp 2-41
Davies, A.J., Roberts, J.M., & Hall-Spencer, J. (2007). Preserving deep-sea naturalheritage: Emerging issues in offshore conservation and management. Biological Conservation, 138, 299-312.
Fothergill, A (Producer). (2001). The Deep [Television series episode]. In The Blue Planet. Burbank, CA: Warner Home Video.
Frose, R. and Pauly, D., eds. (02/2013). Fishbase. World Wide electronic publication. Retrieved 15 March, 2013 from http://fishbase.org.
Fujita, T., Inada, T. & Ishito, Y (1995). Depth-gradient structure of the demersal fish community on the continental shelf and upper slope off Sendai Bay, Japan. Marine Ecology Progress Series, 118, 13-23.
Gallaway, B.J., Cole, J.G, & Martin, L.R. (2001). The deep sea Gulf of Mexico: an overview and guide. U.S. Department of the Interior, Minerals Management Service, Gulf of Mexico OCS Region, New Orleans, LA. OCS Study MMS 2001065. 27pp.
Gartner, J.V. Jr., Hopkins, T.L., Baird, R.C., & Milliken, D. (1987). The lanternfishes(Pices: Myctophidae) of the Eastern Gulf of Mexico. Fishery Bulletin, 35 (1), 8198.
Gartner, J.V. Jr., Crabtree, R.E., & Sulak, K.J. (1997) “Feeding at depth”. In Deep-Sea Fishes. San Diego: Academic Press. pp 115- 194
Gartner, J.V. Jr., Sulak, K.J., & Ross, S.W. (2007). Persistent near-bottom aggregations of mesopelagic animals along the North Carolina and Virginia continental slope. Marine Biology, 153 (5), 825-841.
Haedrich, R.L. (1997) “Distribution and population ecology”. In Deep-Sea Fishes. San Diego: Academic Press. pp 79-114
Haedrich, R.L. & Merrett, N. R. (1992). Production/ biomass rations, size frequencies, and biomass spectra in deep-sea demersal fishes. Deep-sea food chains and the global carbon cycle, 157-182.
Herring, P. (2002). The Biology of the Deep Ocean. Oxford: Oxford University Press.Hopkins, T. L., Torres, J. J., & Lancraft, T. M. (1988). Aspects of the Ecology of the
Mesopelagic Fish (Stomiiformes) in the Eastern Gulf of Mexico. Marine Science Faculty Publications.
McEachran, J.D. & Fechhelm, J.D. (1998). Fishes o f the Gulf o f Mexico Vol 1. Austin: University of Texas Press.
McEachran, J.D. & Fechhelm, J.D. (2005). Fishes o f the Gulf o f Mexico Vol 2. Austin: University of Texas Press.
Montgomery, J. and Pankhurst, N. (1997) “Sensory Physiology”. In Deep-Sea Fishes.San Diego: Academic Press. pp 325-349.
Moranta, J., Stefanescu, C., Massuti, E., Morales-Nin, B., & Lloris, D.(1998). Fish community structure and depth-related trends on the continental slope of the Balearic Island (Algerian basin, western Mediterranean). Marine Ecology Progress Series, 171, 247-259.
49

Nouvian, C. (2007). The Deep: The extraordinary creatures o f the abyss. Chicago: University of Chicago Press.
Moretzsohn, F, Sanches Chavez, JA, Tunnell, JW Jr., Eds (2013). Exploration History. GulfBase: Resource Database for Gulf of Mexico Research. World Wide Web electronic publication. Retrieved 16 March 2013 from http://www.gulfbase.org.
Near, T. J., Eytan, R. I., Dornburg, A., Kuhn, K. L., Moore, J. a, Davis, M. P.,Wainwright, P. C., et al. (2012). Resolution of ray-finned fish phylogeny and timing of diversification. Proceedings o f the National Academy o f Sciences o f the United States o f America, 109(34), 13698-703. doi:10.1073/pnas.1206625109.
Nelson, J. 2006. Fishes o f the world. (4 ed.). Hoboken,New Jersey: John Wiley.NOAA. (Jan, 2013) Oceans. National Oceanic and Atmospheric Administration United
States Department o f Commerce. Jan, 2013. Retrieved Jan 12, 2013 from http://www.noaa.gov.
Pequegnat, W. E. (1983). The ecological communities of the continental slope andadjacent regimes of the northern Gulf of Mexico. U.S Department of the Interior, Minerals Management Service, Gulf of Mexico OCS Region, Metairie, LA. OCS Study MMS 1983-11.
Pequegnat, W.E., Gallaway, B.J., & Pequegnat, L.H. (1990). Aspects of the ecology of the deep-water fauna of the Gulf of Mexico. American Zoologist, 30, 45-64.
Powell, S.M. & Haedrich, R.L. (2003). The deep-sea demersal fish fauna of the Northern Gulf of Mexico. Journal o f Northwestern Atlantic Fisheries Science, 31, 19-31. Ramirez-Llodra, E., Tyler, P. a, Baker, M. C., Bergstad, O. A., Clark, M. R., Escobar, E., Levin, L. a, et al. (2011). Man and the last great wilderness: human impact on the deep sea. PloS one, 6(8), 1-25
Ramirez-Llodra, E., Tyler, P. a, Baker, M. C., Bergstad, O. A., Clark, M. R., Escobar, E., Levin, L. a, et al. (2011). Man and the last great wilderness: human impact on the deep sea. PloS one, 6(8), e22588. doi:10.1371/journal.pone.0022588
Robinson, B. H. (2004). Deep pelagic biology. Journal o f Experimental Marine Biology and Ecology, 300, 253-272.
Robinson, B. H. (2009). Conservation of Deep Pelagic Biodiversity. Conservation Biology, 23(4), 847-858. doi:10.1111/j.1523-1739.2009.01219.x.
Robinson, B.H., Sherlock, R.E, & Reisenbichler, K.R. (2010). The bathypelagiccommunity of Monterey Canyon. Deep Sea Research Part II: Tropical Studies in Oceanography, 57 (16), 1551-1556.
Ross, S. W., Quattrini, A. M., Roa-Varon, A. Y., & McClain, J. P. (2010). Speciescomposition and distributions of mesopelagic fishes over the slope of the north- central Gulf of Mexico. Deep-Sea Research Part II, Topical Studies In Oceanography, 57(21-23), 1926-1956. doi:10.1016/j.dsr2.2010.05.008.
Smith, K. F. & Brown, J.H. (2002). Patterns of diversity, depth range and body size among pelagic fishes along a gradient of depth. Global Ecology and Biogeography, 11 (4), 313-322.
Sutton, T. T., & Hopkins, T. (1996). Species composition, abundance, and verticaldistribution of the Stomiid (Pisces: Stomiiformes) fish assemblage of the Gulf of Mexico. Bulletin o f Marine Science, 59(3), 530-542.
Van Dover, C.L. (2007) The exploration of the deep. In The Deep: The extraordinary creatures o f the abyss. Chicago: University of Chicago Press. pp. 39 - 40.
50

Wei, C., Rowe, G.T., Escobar-Briones, C.N., Nunnally, C., Soliman, Y., Ellis, N. (2012). Standing stocks and body size of deep-sea Macrofauna: Predicting the baseline of 2010 Deepwater Horizon oil spill in the Northern Gulf of Mexico, Deep-Sea Research I, http://dx.doi.org/10.10167j.dsr.2012.07.008.
Weitzman, S.H. (1997) “Systematics of deep-sea fishes”. In Deep-Sea Fishes. San Diego: Academic Press. pp 42-78
Youngbluth, M. (2007) The nocturnal ballet of deep-sea creatures. In The Deep: The extraordinary creatures o f the abyss. Chicago: University of Chicago Press. pp 71- 72.
51
C hapter 2: Conservation of the deep-sea: a look at deep-sea Chondrichthyans and the threats posed to them in the G ulf of Mexico
Introduction
There is no area of the ocean that is unaffected by human activity, including even
the farthest reaches of the deep-sea (Ramirez-Llodra et al., 2011). Although conservation
efforts have been successful in some marine ecosystems, almost all of these have focused
on the protection of coastal ecosystems and near-surface waters. Unfortunately the lack
of conservation attention to the deep-sea does not mean that the ecosystems are
unaffected by or safe from anthropogenic disturbance.
Specific Conservation Threats
Pollution
Pollution is a substantial threat that impacts almost all marine ecosystems and
organisms worldwide. Although routine dumping of certain waste materials by ships at
sea was banned in 1972, over 636,000 tons of litter is dumped into the oceans by vessels
annually, and an estimated 6.4 million tons of trash enters the ocean due to direct
dumping or as unintentional waste each year (Ramirez-Llodra et al., 2011). A bottom
survey of the northern Gulf of Mexico found multiple types of trash at all sampled
depths, including the farthest reaches of the bathyal zone (Fig. 2-1). Once in the marine
environment, trash causes mortalities to a range of aquatic organisms through
suffocation, strangulation, and entanglement. Trash also becomes ingested by many
marine organisms, which can be toxic to the organism and may result in death (Ramirez-
52

Llodra et al., 2011; Moore, 2011). Other pollutants, such as chemical waste and discarded
pharmaceuticals make their way into marine environments as well and can disturb
physiological processes or result in mortalities among marine organisms (Robinson,
2009; Moore, 2011; Ramirez- Llodra et al., 2011).
Ocean Acidification
Increasing amounts of carbon dioxide in marine environments is another cause for
concern. As carbon dioxide levels in the ocean rise, the water becomes more acidic as the
carbon dioxide reacts with water in the carbonate buffer system, producing bicarbonate
ion and the hydrogen ions that are the basis of acidity (a process known as ocean
acidification). The acidification compromises the ability of calcifying organisms (e.g.
corals and crustaceans) to produce calcium carbonate hard body parts, reducing their
abundance in marine ecosystems (Davies et al., 2007; Robinson, 2009; Ramirez-Llodra et
al., 2011). It was modeled that the production of important planktonic calcifying
organisms may decrease by as much as a 50% compared to their numbers in pre
industrial times within the next 250 years. Many of these calcifying organisms are
important to marine food webs and their decline has the potential to impact the entire
ecosystem (Davies et al., 2007). Furthermore, high concentrations of carbon dioxide in
and the resultant acidosis have been shown to have toxic effects on organisms (Davies et
al., 2007; Ramirez-Llodra et al., 2011). Sessile infauna and epifauna (immobile
organisms buried in the bottom and sitting on the bottom of the ocean floor) have been
shown to suffer from respiratory stress and even death due to acidosis. Although mobile
species are able to avoid areas of high carbon dioxide concentration and acidification,
fish swimming through carbon dioxide plumes have exhibited a loss of consciousness
53

from the increased concentrations. Long-term exposure can cause hypercapnia, an
increase in the body’s acidity. This is a physiological stressor and, over time, has
detrimental effects to the health of the organisms (Robinson, 2009).
Climate Change
Climate change, itself in part traceable to increased carbon dioxide levels, is
another marine stressor. Ocean temperatures are predicted to rise 1.4° - 5.8° C in the next
100 years (Ramirez-Llodra et al., 2011). The warming of surface temperatures will
inhibit the circulation and vertical mixing of cold, nutrient-rich water from the deep
ocean which is required for photosynthesis in the epipelagic zone and may cause a
redistribution of plankton away from warm tropical waters (Davies et al., 2007;
Robinson, 2009; Ramirez-Llodra et al., 2011). Because deep-sea organisms rely upon the
productivity of epipelagic photosynthetic and planktonic organisms, the primary
producers whose energy productivity eventually is exported to the deep-sea, warming
ocean temperatures will also impact the life there (Davies et al., 2007; Robinson, 2009;
Ramirez-Llodra et al., 2011). The warming may even extend into the deep waters
themselves. The inhabitants of the deep-sea have evolved in an environment far more
stable than the environments near the surface (Devine et al., 2006; Robinson, 2009).
Temperature changes in the deep sea will have unknown consequences but will likely
alter physiological processes such as growth and reproductive rates (Davies et al., 2007).
Fishing
While pollution, ocean acidification, and climate change are of concern to deep-
sea communities worldwide, the two most imminent threats in the Gulf of Mexico are
54

fishing and oil and gas drilling. Fishing has always been integral to the life of the people
inhabiting land near the Gulf of Mexico. Although historically not a major threat to the
deep ocean, over time fishing gear has improved and allowed fishermen to exploit deeper
and deeper areas of the Gulf of Mexico (Davies et al., 2007; Grace et al., 2010; Ramirez-
Llodra et al., 2011). Today, deep-water fishing is a large industry in the United States,
both for recreation and consumption. In 2008, commercial fishing in the Gulf of Mexico
had a total catch of 1.27 billion pounds of fish and a total of 3.2 million recreational
fishermen took a total of 24 million fishing trips in the area (NOAA, 2010a). Deep-water
fishing only accounted for ~6.5% of total worldwide fisheries captures in 2002, a landing
worth $70 - 80 billion (USD), yet both shallow water and deep-sea fisheries have
significant impacts on marine ecosystems. While deep-sea fishes are not yet a frequent
target of fisheries, depletion of shallow water stocks may necessitate a switch to deeper
dwelling species as targets.
Examples of this have already been seen in several deep water species, such as
orange roughy (Hoplostethus atlanticus, known as red slimehead before it was widely
marketed as a food fish) which quickly became a fishery target after discovery of large-
scale spawning grounds in New Zealand in the 1980’s. Extensive gear (heavy duty
benthic trawling nets which must be towed several thousand meters below and at least
1000 m behind the fishing vessel) is needed to harvest the fish compared to shallower
dwelling species. Regardless of the increased effort required, orange roughy became a
valuable fishery in New Zealand, Australia, and Nambia (Stevens, 2003). The orange
roughy was originally estimated to have a lifespan of 20-30 years. However, as more
became known about its habits and biology, it became apparent that orange roughy can
55

live over 100 years and often do not reproduce until they are in their twenties. By this
time fisheries had already overexploited the slow growing, deep-sea population.
Biologists predict the recovery of the populations to be very slow, yet orange roughy
remains one of the most valuable commercial fisheries in New Zealand (Jensen, 1997;
Stevens, 2003; Monterey Bay Aquarium, 2013).
The grenadier fishery also exemplifies this same increasing use of deep-water
species. Formerly discarded as unwanted by fishermen when caught incidentally, the
grenadiers (deep-water fishes also known as rattails in the family Macrouridae) are now
targeted by fisheries. Due to reduced population sizes and increased fishing regulations of
inshore species, fisherman began catching the unregulated grenadiers off the west coast
of the United States. Little is known of the biology of these fish apart from the fact that
they are slow-growing and, therefore likely long lived and later reproducing like the
orange roughy (Jensen, 1997; Abbott, 2006). Not only are grenadiers generally
considered to be a less preferable tasting fish, but they also have an overall lower product
yield (only 22-26% sellable meat per fish) compared to many other commercially
targeted fish (Abbott, 2006). As humans overfish the meatier and more productive per
individual fishes (e.g. groupers, bonito, tuna), fishermen are forced to catch less
productive, less desirable fish like the grenadier. Globally, fishing depths have increased
since the 1950’s and improved technology has allowed fisheries to target deep-dwelling,
long-lived species like the orange rougy and grenadiers (Grace et al., 2010). Both the
orange roughy and grenadiers are currently listed as fish to avoid by the Monterey Bay
Aquarium’s Seafood Watch (Monterey Bay Aquarium, 2013), further demonstrating the
56

risk of exploitation of deep-sea species. If overfishing in the epipelagic continues, more
deep sea species may soon be at risk of exploitation.
Fishing also threatens species not directly targeted by commercial fisheries.
Trawls are deployed for catching targeted species in the Gulf of Mexico, including,
among other organisms, rock shrimp, royal red shrimp, and calico scallops. The royal red
shrimp industry has the potential to be extremely detrimental to the deep sea
environment. With a range between 180 - 730 m, the royal red shrimp overlaps with
many species in the mesopelagic (Stiles et al., 2007). Trawling not only captures non
targeted species (bycatch) but also damages the benthic habitat as the net is dragged
along the substrate, which can reduce biodiversity (Bianchi et al., 2010; Ramirez-Llodra
et al., 2011). Damage to populations and environments in the deep sea are of particular
concern. The species inhabiting the deep-sea have not evolved in a rapidly variable
environment like those species in the epipelagic and are therefore not as adapted to
dealing with environmental changes. In general, deep-sea species also tend to have a
slower growth rate, reach reproductive maturity at a later age, and live longer than
shallow species (Devine et al., 2006; Ramirez-Llodra et al., 2011). These traits make the
deep sea inhabitants more susceptible to over exploitation. For some deep-sea fisheries,
depletion of harvested populations has already been shown by reductions in catch rates.
Deep-sea species in the Northwestern Atlantic, including the roundnose grenadier
(Coryphaenoides rupestris), onion-eye grenadier (Macrourus berglax), blue hake
(Antimora rostrata), spiny eel (Notacanthus chemnitzi), and the spinytail skate
(Bathyraja spinicauda) experienced substantial population loses in a 17-year period due
to fishery and bycatch mortalities. Because of the population declines, all five species are
57
now categorized as critically endangered in the region according to the IUCN (Devine et
al., 2006; Davies et al., 2007).
Oil and Gas Drilling
The Gulf of Mexico has a high incidence of hydrocarbons in its underlying
geological formation, including very large petroleum reserves (Pequegnat et al., 1990;
Gallaway et al., 2001). This has led to extensive hydrocarbon exploitation in the Gulf of
Mexico, and along with it, another source of concern for the deep-sea environment.
Deep-sea hydrocarbon exploitation began in the Gulf of Mexico in 1979. By 1992 there
were 6 producing wells, 17 by 1997, and 118 by 2006 (Davies et al., 2007). The Gulf of
Mexico has been on the forefront of deep-sea hydrocarbon drilling, and is the site of the
first exploratory wells drilled into the lower bathyal zone at 3000 m deep (Davies et al.,
2007; Robinson, 2009).
Drilling in the Gulf of Mexico is a very important industry, supplying about 25%
of the United States’ natural gas and around 18% of its oil (Franks, 2000). There are
currently 110 active petroleum and gas platforms in the northern Gulf of Mexico (IHS,
2013). The drilling platforms do provide hard structure for marine organisms to use as
habitat to which they can directly attach or use for shelter, acting as fish aggregation
devices (Franks, 2000). While many fish use the platform structure as an artificial habitat,
living near the oil and gas wells can be harmful to the health of marine organisms. Rigs
release oil, gas, and toxic drilling fluids into the surrounding water during drilling and
extraction (Robinson, 2009). Hydrocarbons and metals (especially silver, barium,
cadmium, mercury, lead, and zinc) can be detected up to 200 m away from wells
(Peterson et al., 1996). Corals growing near rigs suffer greater than 30% polyp mortality,
58

a substantially higher rate than corals living elsewhere (Davies et al., 2007). Elevated
organic carbon levels and anoxic conditions as well as more patchy distributions of
benthic communities have also been found surrounding wells in the Gulf of Mexico
(Ramirez-Llodra et al., 2011). Discharged hydrocarbons can be incorporated into food
chains after absorption or consumption by primary consumers and may persist in
sediments, chronically exposing organisms to the toxic chemicals (Peterson et al., 2012).
Prolonged exposure to toxic hydrocarbons can lead to bioaccumulation in the tissues of
the organisms which can lower growth, reproduction, and survival rates (Ramirez-Llodra
et al., 2011; Fodrie & Heck, 2011).
While studies of bioaccumulation of crude oil components have been conducted
on epipelagic organisms after oil spills, the information on deep-sea communities related
to hydrocarbon exposure is limited. With such a high incidence of drilling in the deep
Gulf of Mexico, it is important to assess the effects hydrocarbons have on the organisms
living in areas where drilling byproducts are prevalent or oil spills are of concern.
Studies have shown that other pollutants (e.g. DDT and PCB) are correlated with fish
diseases such as fin rot (Peterson et al., 1996). Studies on salmon exposed to oil after the
Exon Valdez oil spill suffered from bioaccumulation of pollutants, altered migration
routes, and diverted spawning grounds (Wertheimer et al., 2000). Epipelagic species have
been known to suffer from depleted populations after oil spills as well, making
extirpations and local extinctions another concern (Chakrabarty et al., 2012). During his
survey of the deep sea benthic communities, Pequegnat (1983) warns of the devastation
that could occur in bathypelagic zones in the event of a deep sea blow out. He also notes
that without further information on the effects of bioaccumulation of crude-oil
59
components in this environment, it is difficult to assess the extent of damage that could
be done to the ecosystem.
The Deepwater Horizon Spill
The concern for the health of deep-sea environments under exposure to crude oil
components and other pollutants became obvious on April 20th, 2010 when a deep-sea oil
well being drilled by BP experienced a blowout at the well head. The spill was not
stopped until September 19th, 2010. Over the 84 day period, 5 million barrels of crude oil,
amounting to over 200 million gallons, were released into the ocean (Fodrie & Heck,
2011). This spill was novel in several ways. First, this is the largest accidental oil spill
ever to occur (Ramirez- Llodra et al., 2011). This is also the deepest oil spill yet known to
have occurred, releasing oil into the environment around 1500 m deep, at the top of the
bathyal zone (Chakrabarty et al., 2012). Finally, the Deepwater Horizon oil spill is the
first to be extensively treated with chemical dispersants (Ramirez-Llodra et al., 2011).
Over 2 million gallons of dispersants were added to the spill (Chakrabart et al., 2012).
Dispersants are used to emulsify the oil, breaking it into tiny droplets that are “dispersed”
in the water column. These tiny drops are too small to float up to the surface, thereby
reducing the oil slick on the water’s surface and potentially reducing the direct effects in
the epipelagic. The emulsified hydrocarbons are then supposed to be degraded by
bacteria capable of metabolizing the chemicals (NOAA, 2010b). However, after the
dispersants alter the chemistry of the hydrocarbons, the oil more readily enters larger
organisms, causing a risk of toxicity and bioaccumulation (Upton, 2011).
Because dispersants were used on the spill (combined with the effects of turbulent
mixing of emulsified oil particles at the well head) only half of the oil released during the
60

blowout rose to the surface (Fodrie & Heck, 2011). Large amounts of oil remains
emulsified at depth and there is a large mid-water hydrocarbon plume found around the
well at 1100 m and several others found between 800 m and 1200 m (Fodrie & Heck,
2011; Peterson et al., 2012). The plume at 1100 m represents more than double the
amount of hydrocarbons released by the natural seeps in the Gulf of Mexico (~10 million
gallons per year) and has, as of yet, shown no evidence of substantial biodegradation
(Gallaway et al., 2001; Ramirez-Llodra et al., 2011). Because extensive efforts by BP
removed surface oil, the majority of the spill’s impact has occurred below the ocean’s
surface (Fodrie & Heck, 2011; Chakrabarty et al., 2012) yet the effects on the deep sea
communities remains unknown.
Unfortunately there is little information on how the chemicals in crude oil and oil
treated with dispersants will react in the high pressure environment of the deep sea,
making it very difficult to predict the movement, persistence, or chemical transformation
of the oil in the environment. There have already been novel transformations of the crude
oil witnessed by scientists that have yet to be seen by previous oil spills. Transformation
of the chemical components of the oil raises the concern of chemicals’ altered toxicities
and prevalence in the environment (Schrope, 2011). There is potential for this oil to move
into the surrounding waters in the Gulf and Atlantic and over time it may affect more
than just the organisms inhabiting areas near the well head (Schrope, 2010). One year
after the spill, deposits of transformed oil were found on the Gulf of Mexico sea bed as
far as 130 kilometers away from the well head. The movement of other crude-oil
components is unknown, especially given the novelty of the Deepwater Horizon spill
(Scrope, 2011). It is particularly important to assess the impact of hydrocarbon exposure
61

to deep sea communities which may be more susceptible to change in their normally
more stable environments.
Chondrichthyans (Sharks, Skates, Rays, and Chimeras)
Larger-bodied, longer-lived organisms have a great potential to be affected by
fishing and chronic exposure to toxins due to their tendency to mature later in life and
produce fewer offspring. Many deep-sea organisms display these traits but
chondrichthyan species are of particular interest and concern. Chondrichthyans are a
group of cartilaginous fishes which include sharks, skates, rays and chimaeras. Many
chondrichthyans have poorly understood life histories, but those that have been
extensively studied display K-selected life history traits. They are longer-lived, have
slower growth rates, reach sexual maturity later in life, and lay relatively few, large eggs
or give birth to few, large offspring (Holden, 1974; Wood et al., 1979; Walker, 1998;
Walker & Hislop, 1998; Baum & Myers, 2004). Chondrichthyans have also been
reported to have low natural mortality rates (Holden, 1973). These traits make
chondrichthyans especially susceptible to fishing and likely make them susceptible to
bioaccumulations of toxins over their long life spans as well.
Sharks have been historically targeted by fisheries (Holden, 1974) and remain
targets for consumption of liver, fins, skin, meat and cartilage to this day (Walker, 1998).
Shark populations worldwide declined substantially between 1950 and 1990 (Walker &
Hislop, 1998), attributed to their being targeted by fisheries which have been increasing
catches since the 1920’s (Walker, 1998). Shark landings more than tripled worldwide
between 1960 and 1997. While there have been numerous restrictions and regulations put
in place on shark fishing, there was only a 7.5% decline in total shark landings between
62

1997 and 2010 (Worm et al., 2013). Between 1980 and 1990 alone, the Mexican and US
shark catches increased three fold (Bonfil, 1997) and today there is still a large shark
fishery in the Mexican waters of the Gulf of Mexico (Walker, 1998). While restrictions
have been placed on fishing gear and allotted catches to protect sharks in United States
waters, no regulations exist in Mexican waters (Bonfil, 1997). Shark fisheries averaged
3.5% of total catches in the southern Gulf of Mexico between 1977 and 1992
(substantially larger than the world average of 0.7%; Bonfil, 1997). In addition, the
majority of shark catches are due to bycatch from other fisheries, which do not get
reported in total shark landings and therefore cannot be used to regulate shark
populations (Walker & Hislop, 1998; Worm et al., 2013).
Sharks are not the only chondrichthyans at risk from fisheries exploitation.
Skates, flattened fish which live on the bottom of the ocean and are similar in appearance
to a sting ray, have also been targeted by fisheries and are commonly caught as bycatch
in bottom trawls (Walker & Hislop, 1998). Skates are currently one of the most
threatened groups of all marine species, many of which have suffered little noticed
declines due to fisheries exploitation until well after the populations have been
substantially depleted (Stevens et al., 2000; Devine et al., 2006).
Because of their life-history traits, chondrichthyans are unable to endure the same
level of harvest as shallow-water shellfish and teleost fishes can. Like other fishes,
fecundity of chondrichthyan species increases with size (Holden, 1973), putting the
population at even greater risk when larger individuals are preferentially captured by
fisheries. Commercial landings are reported for shark and skate fisheries. However,
bycatch for these species are often not catalogued (Walker, 1998; Stevens et al., 2000;
63

Worm et al., 2013). An estimation of the total mortalities (including both from reported
landings and estimates of unreported bycatch) suggests that in the year 2000, total shark
catches weighed over 1,638,000 tons and of those, 1,445,000 tons resulted in mortalities.
The study estimated that the 88% mortality of sharks was equivalent to around
69,471,000 individual mortalities (Worm et al., 2013).
Many species of chondrichthyans inhabiting the deep Gulf of Mexico and are at
risk of overexploitation from fisheries (Fig. 2-2). In the year 2000, there was a total
landing of 5004 tons of deep water sharks reported to the United Nations Food and
Agricultural Organization. Although accounting for less than 2% of the reported landings
for the year (Worm et al., 2013) this shows that deep-sea species are at risk of
exploitation. Extinction has already been a cause for concern in many skate species
because of overexploitation through direct fishing and bycatch (Stevens et al., 2000) and
other chondrichthyans may be at a similar risk considering their similar life histories.
These deep-sea species are also at risk from the deep water hydrocarbon
extraction. The life-history traits of chondrichthyans put these species at substantially
greater risk from chronic exposure to hydrocarbons in the environments (Peterson et al.,
1996). The effect of crude oil exposure has been studied in several species of epipelagic
bony fish. While teleosts have been said to have the ability to metabolize polycyclic
aromatic hydrocarbons (PAHs), a major toxic compound of oil, (Metabolism of PAH by
teleost, 2010) detrimental effects have still been shown in teleost species exposed to
crude oil. Salmon embryos exposed to low amounts of aqueous hydrocarbons after the
Exon Valdez oil spill showed substantial uptake of the chemicals resulting in reduced
larval growth and survival rates, delayed effects of growth in juveniles, and straying from
64

normal migration routes as adults (Wertheimer et al., 2000). Similarly, in a lab setting all
zebrafish embryos exposed to oil mixed with dispersants in the levels expected to be
present after the Deepwater Horizon oil spill showed developmental defects such as fatal
heart deformities (Schrope, 2011). Despite the studies on these model organisms, the
effects of crude oil contamination on most fish is unknown and is very poorly understood
for deep-dwelling species, including chondrichthyan species.
The effects of deep-water toxin exposure may be greater in deep-water
chondrichthyans that are at a higher risk for chronic exposure due to long life history
traits and reproductive strategies. Unlike many other marine organisms which spend
larval stages in the epipelagic, chondrichthyans do not undergo ontogenetic migrations
into surface waters. Either few, large egg cases (known as mermaid’s purses) are
deposited on sediment and remain in the deep-sea until they hatch, or a few, large young
are born alive at depth, where they remain for the duration of their life, putting many
species at risk for exposure from the mid-water plumes found after the Deepwater
Horizon oil spill. Furthermore, there has been no demonstration of metabolic pathways
for PAHs in chondrichthyans, potentially increasing the exposure effects of crude oil
components. More research is necessary to assess how extensive the threat of exposure to
toxic crude oil and dispersant or drilling chemicals poses to these organisms.
Chondrichthyans in the Gulf of Mexico may be at a high risk of exposure to toxic
chemicals released into the water during the Deepwater Horizon oil spill. There are 7
endemic species of chondrichthyans in the Gulf of Mexico that have been shown to have
overlapping ranges with the spill site (Chakrabarty et al., 2012). Endemic species are at
increased risk of extinction and should be monitored for population declines in light of
65

threats. The location of dispersed oil below the surface is poorly known (Chakarbarty et
al., 2012) but reports of affected species occurring throughout the water column
(Schrope, 2011) suggest that the Deepwater Horizon oil spill is impacting all depth
ranges from the surface to the well head. Chondrichthyans are present in relatively
constant proportions throughout all depth ranges in the Gulf of Mexico (Fig. 2-2). The
constant prevalence of this group of fish means that they likely play an important role
throughout the marine ecosystem and also means that there may be unreported species
living in ranges contaminated by the blowout.
Chondrichthyans represent important apex predators whose life traits put them at
an increased risk of exploitation and chronic exposure to toxic chemicals. The recent
Deepwater Horizon blowout has illuminated the damage that can be caused by future
drilling accidents in the Gulf of Mexico. With such high incidents of oil and gas drilling
in the northern Gulf of Mexico, it has become increasingly important to assess potential
threats to species, such as chondrichthyans, at risk of exploitation, extirpations or
extinctions before another devastating accident occurs. Unfortunately, little is known
about chondrichthyan behaviors. This includes both geographic and vertical ranges which
may increase the risk of extinction and extirpations in the Gulf of Mexico due to deep-sea
drilling. This study focuses on the distribution of two orders of chondrychthyans that
tend to inhabit the deep sea: Rajiformes and Squaliformes. By examining previously
documented catch locations for these chondrichthyans. I hope to better identify the
threats presented by extensive drilling in the northern Gulf of Mexico.
66
M aterials and M ethods:
Chondrichthyan distribution patterns were investigated using two orders of the
clade: Rajiformes and Squaliformes. These orders were chosen because of the relatively
large number of species representing each order in the Gulf of Mexico, the large
proportion of individuals cited as having a depth range below the epipelagic zone
(McEachran & Fechhelm, 1998), and the tendency for all Rajiformes and some
Squaliformes to be benthic or demersal (on the bottom or associated closely with the
bottom). I included all rajiforms in the study because of their known benthic behavior but
I only included the squaliforms identified as benthic or demersal (McEachran &
Fechhelm, 1998; Castro, 2011). Individual catch data were acquired for benthic and
demersal species of these two orders using the Global Biodiversity Information Facility’s
web database which is connected to collections from numerous natural history museums
and universities (GBIF.org, 2012). Records from Cuba, Mexico, and the United States
were included in the search but out of those, only records with latitude and longitude
points located within the Gulf of Mexico were used for the purpose of this study. Latitude
and longitude points were input into ArcGIS version 10 (ESRI, 2011) mapping software
and overlaid on a map of the Gulf of Mexico and its bathymetry. Because benthic and
demersal fish are closely associated with the seabed, catch location, as documented by
the records accessed through GBIF.org (2012), was used to determine the depth of
occurrence. A depth range was determined for each catch record by determining which
two bathymetry lines a catch record’s geographical coordinates fell between on the map.
Depth contours were shown in intervals of 10 m for 0 - 100 m, 100 m for 100 - 1000 m
and 500 m for intervals of 1000 - 3500 m (Fig. 2-3).
67

Each catch record from the GBIF database (GBIF.org, 2012) was associated with
a depth range using bathymetry contours in ArcGIS. These data were used to determine a
minimum and maximum depth, the depth range, and the average depth for each species.
Minimum and maximum depths, as well as depth ranges were compared to depths
documented in McEachran and Fechhelm (1998) and on fishbase.org (Froese & Pauly,
2013). Geographic ranges were also referenced against active gas and oil drilling leases,
documented platforms, and projected oil movement from the Deepwater Horizon oil spill.
Results:
There are 25 species of Rajiformes from 11 genera documented as inhabiting the
Gulf of Mexico. Distribution patterns were investigated for all Rajiformes. Squaliformes
have 21 species from 10 genera documented to inhabit the Gulf of Mexico. Of these, 8
are documented as benthic or demersal species and were included in the study. O f the
species studied, four (three Rajiformes and one Squaliform) had no records of occurrence
in the database accessed through GBIF.org (2012). ArcGIS mapping expanded the depth
ranges of 21 of the 32 species compared to previously documented depth ranges (Fig 2-4;
Table 2-1). Vertical ranges according to ArcGIS mapping were larger than documented
ranges for 19 of the 25 rajiforms (76%) and for and 2 of the 8 squaliforms (25%). The
vertical ranges of three rajiforms were reduced compared to otherwise documented
ranges. Four squaliforms exhibited a decrease in the vertical range compared to both
documented depth ranges while one (Squalus mitsukurii) had an increased range
compared to McEachran & Fecchelm (1998), but a decreased range compared to the
range documented by Fishbase.org (Froese & Pauly, 2013). Of the species demonstrating
expansions in vertical range, 17 were due to increases in both the minimum and
68

maximum depths, 1 was due to increase only in minimum depth, and 5 were due to
increases only in maximum depths compared to previously documented depth ranges.
ArcGIS mapping demonstrates the variation in species vertical and geographic
distribution patterns. Rajella fuliginea has a relatively even distribution throughout the
Gulf of Mexico within the meso- and bathypelagic, displaying a shallower distribution in
the southern portion of its range (Fig. 2-5). Anacanthobatis folirostris likewise has a
vertical distribution primarily in the mesopelagic zone but has more records of
occurrence in the northern Gulf of Mexico than in the south (Fig. 2-6). Dipturus oregoni
has only four records of occurrence in the Gulf of Mexico, three of which are located in
the northeastern and one of which is located in the southwestern Gulf. All records are
found below the epipelagic zone (Fig. 2-7). Raja texana has both a wide geographic and
vertical distribution. The majority of the records are located in the epipelagic zone in the
northern and southern Gulf of Mexico but some records suggest occurrences within the
meso- and bathypelagic zones as well (Fig. 2-8). Similarly, most records for Dipturus
olseni are located within the epipelagic zone. However, several records show distribution
within the meso- and bathypelagic zones as well. D. olseni is relatively evenly distributed
around the Gulf of Mexico, with the exception of the farthest eastern borders surrounding
the Yucatan Peninsula and the coast of Florida (Fig. 2-9). Conversly, Fenestraja plutonia
is found only in a very narrow vertical range between the meso-and bathypelagic zones
with a single record of occurrence within the epipelagic zone. F. plutonia is only
recorded to occur in the eastern Gulf of Mexico near Florida (Fig. 2-10). Similar to R.
texana, Leucoraja lentiginosa is distributed widely within the Gulf of Mexico. While
represented throughout the vertical zones and geographic regions of the Gulf, L.
69

lentiginosa has a majority of its records in the upper mesopelagic and is more densely
represented in the northeastern Gulf of Mexico, where the species has a higher
occurrence in the epipelagic (Fig. 2-11). Rajellapurpuriventralis similarly shows a wide
distribution, with occurrences in the epi-, meso-, and bathypelagic. The records shown
indicate distribution in the northern Gulf of Mexico extending into the southwestern Gulf
(Fig. 2-12).
Similar distribution patterns are apparent for the squaliforms investigated. Squalus
cubensis has the largest number of records in the Gulf of Mexico out of the squaliforms
investigated. Geographically and vertically, S. cubensis appears to have a wide range,
distributed throughout the Gulf of Mexico from the epipelagic down through the
bathypelagic. The majority of S. cubensis records are shown in the upper mesopelagic
near the boundary between the epi- and mesopelagic zones (which lies at 200 m). Other
squaliform distribution patterns are less explicit given the small number of records in the
Gulf of Mexico. Deaniaprofundorum has only four records, all of which are located in
the northeastern Gulf of Mexico near Louisiana. D. profundorum's vertical distribution is
in the mesopelagic and the upper bathypelagic (Fig. 2-14). Etmopterus gracilipinis has
similarly few records in the Gulf of Mexico. Four are located in the meso- and
bathypelagic waters of the northeastern Gulf very near Louisiana while a single record is
displayed in the epipelagic, near-shore waters further east (Fig. 2-15).
These distribution patterns can be compared to locations of oil and gas extraction
in order to determine potential threats posed to each species by drilling in the Gulf of
Mexico. The records of oil and gas platforms in the Gulf of Mexico as of 2013 show a
large, densely packed aggregation of platforms in the northern Gulf from the western
70

boundary of the Texas coastline around to the area of the Mississippi River Delta (Fig. 2
16). This includes all platforms listed in the Bureau of Ocean Energy Management’s
database and depicts more platforms that are currently extracting oil (only 118 rigs are
drilling in the Gulf of Mexico as of March 2013 while over 4,000 platforms are depicted
on the map). Most platforms are located in inshore, epipelagic waters. However several
occur at mesopelagic and bathypelagic depths. The Bureau of Ocean Energy
Management’s database for drilling leases as of March 2013 shows a larger number of
leased plots within the meso- and bathypelagic zones and a reduced occurrence of drilling
within the epipelagic (Fig. 2-17). The Deepwater Horizon well which blew out in 2010
fell within this range of densely packed bathypelagic drilling. The oil from the blowout is
expected to travel into the northeastern Gulf of Mexico, radiating outward from the
location of the blowout (Fig. 2-18).
Discussion:
Using ArcGIS mapping to determine species ranges, 21 of the 32 demersal
chondrichthyan species (from the Orders Rajiformes and Squaliformes) showed increased
vertical ranges compared to previously documented ranges (McEachran & Fechhelm,
1998; Froese & Pauly, 2013; Fig. 2-4). Of species which showed vertical range
decreases, compared to documented ranges, only one species had more than six records
used for range determination. The range decreases are, therefore, most likely due to low
sample sizes and not indicative of a decrease in the realized niche compared to
documented depth ranges. Range increases however, may indicate that the species is
found in a larger vertical range than previously determined by other sampling methods. If
71

there are errors in the geographical coordinates for specimen records or if the
documented demersal species were traveling upwards in the water column at the time of
capture at the given location, the depth of occurrence based on ArcGIS mapping may be
inaccurate. However, assuming that all demersal species were on or near the bottom at
the time of capture and assuming that the coordinates are accurate for the location of
capture, the methodology used in this study may provide a more accurate vertical range
depiction of poorly studied benthic or demersal species than the other examined
resources.
Based on the vertical and geographic distribution patterns in conjunction with
population sizes and endemism, different levels of risk can be assessed for species.
Exposure to hydrocarbons is of particular interest in this study and the distribution
patterns found using ArcGIS mapping can be used to determine the potential risk to
different species due to hydrocarbon drilling in the Gulf of Mexico.
The rajiforms of the Gulf of Mexico show four major patterns of vertical
distribution. Rajella fuliginea (Fig. 2-5) displays a distribution pattern mostly below the
epipelagic, with most points in the lower mesopelagic and upper bathypelagic. Several
points occur in the epipelagic in the southern part of the range. This species shows a
range expansion and has previously only been documented to occupy the mesopelagic. R.
fuliginea is distributed fairly evenly around the entire Gulf of Mexico and no records
show occupancy of the area immediately affected by the Deepwater Horizon spill. This
species is also not endemic to the Gulf of Mexico, suggesting that R. fuliginea is not
likely at great risk of extinction or large-scale extirpation from the Gulf of Mexico from
72

exposure to hydrocarbons, especially so given the described increase in recognized
vertical rage.
Anacanthobatis folirostris (Fig. 2-6) shows a similar distribution pattern but is
found almost exclusively below the epipelagic. Most points of occurrence fall within the
mesopelagic and a single record shows occurrence in the epipelagic. This record may be
an outlier or data error that does not represent the true species range, but without
additional information to suggest error, it is treated as a valid record. Based on these data,
A. folirostris shows an increased recognized depth range both shallower and deeper
compared to previous documentation. This species is endemic to the Gulf of Mexico and
most of the capture records are located in the northern Gulf of Mexico. A previous study
using similar methodology involving mapping of database data (some of which came
from GBIF records, as in this study), estimates that 78.95% of A. folirostris’s range
overlaps with the Deepwater Horizon oil spill (Chakrabarty et al., 2012). High number of
specimen records for this species indicates that A. folirostris has a large population size.
However, due to the high degree of overlap with the Deepwater Horizon spill and a
majority of records documenting the range in the mesopelagic, A. folirostris is likely at a
high risk of exposure to the toxic chemicals trapped at depth from the spill, especially
from mid-water plumes in the area. The very rare (or possibly inaccurate) occurrence in
the epipelagic also indicates that A. folirostris has few or no shallow-water populations
that would be away from the mid-water plumes in the meso- and bathypelagic. Thus, this
species is at higher risk of dispersed hydrocarbon exposure. This species may be at high
risk of extinction given its endemism and range overlap with the recent deep-water spill.
73

Similarly, Dipturus oregoni (Fig. 2-7) is exclusively located in the meso- and
bathypelagic zones. There is a slight range increase compared to documented ranges for
this species. The increase may be due to the limitations in the bathymetric maps used for
the bathypelagic. Contours for the bathypelagic were only given in 500 m increments,
giving a large range of possible depths for data points located between two contours
which may be the source of range expansion in this case. D. oregoni is endemic to the
Gulf of Mexico, yet only four records were found for the species, indicating that the
species has a very small and poorly sampled range, a very small population size, or both.
An estimated 80% of D. oregonfs range overlaps the Deepwater Horizon oil spill
(Chakrabarty et al., 2012). As mentioned for Anacanthobatis folirostris, the mid-water
plumes present a threat to D. oregoni. This high overlap of a small range and a possibly
small population size suggest high risk of extinction from exposure to chemicals released
by the spill. A. folirostris and D. oregoni should both be considered to be candidate
species for U.S. or international protection given the current threats after the Deepwater
Horizon oil spill and the potential threats that may present themselves in the event of
another deep-water spill in the northern Gulf of Mexico.
In contrast with the ranges of Rajella fuliginea, Anacanthobatis folirostris, and
Dipturus oregoni, Raja texana (Fig. 2-8) is almost exclusively found in the epipelagic.
However, three records indicate that R. texana also occurs less frequently below this
range, extending into the bathypelagic. Two separate records note occurrence of R.
texana at the bottom of the Gulf of Mexico. These two records document the same
latitude and longitude and were caught separately in two different years. This suggests
that R. texana has a substantially larger depth range than previously documented. This
74

endemic species has a large number of records, suggesting a large population size. Only
11% of R. texana’s range overlaps with the Deepwater Horizon oil spill (Chakrabarty et
al., 2012). Although traditionally at a higher risk of extinction due to endemism, the large
range, both vertically and geographically, and the likely large population size as
determined by the high incidence of catch records, demonstrates that R. texana is not at
significant risk of extinction from the Deepwater Horizon oil spill. However, R texana
shows a high incidence of occurrence in the northern Gulf of Mexico, overlapping with
common areas of hydrocarbon extraction (Figs. 2-16 and 2-17). While not facing an
immediate threat from the Deepwater Horizon oil spill, R. texana may be at an increased
risk in the event of future spills in the area. Given the endemism of the species in the Gulf
of Mexico, precautionary regulations should be considered for this species.
Dipturus olseni (Fig. 2-9), also endemic to the Gulf of Mexico, shows a mostly
epipelagic vertical distribution with few records indicating occurrence in the meso- and
bathypelagic zones. This species is estimated to have a range overlap of 28.57% with the
Deepwater Horizon oil spill (Chakrabaty et al., 2012). However, this species has fewer
catch records than Raja texana, suggesting that D. olseni has a smaller population.
Furthermore, around half of the catch records are found in the northern Gulf of Mexico,
overlapping with the area of active drilling. Given the endemism in the Gulf of Mexico,
smaller population size, and larger range overlap with oil and gas drilling, this species is
likely at a higher risk of population declines or extinction due to exposure to chemicals
from hydrocarbon extraction. Raja eglanteria (Appendix I), also displays this distribution
pattern and has the majority of its records in the northeastern Gulf of Mexico,
75

overlapping with drilling activity. Although not endemic to the Gulf of Mexico, the
species is vulnerable to local extirpation from hydrocarbon exposure.
Very narrow vertical ranges are shown for some species, a pattern that is
especially evident for Fenestrajaplutonia (Fig. 2-10). Almost all catch records fall in a
narrow range in the mesopelagic of the northeastern Gulf of Mexico, with a few records
spilling into the upper bathypelagic and a single record occurring in the epipelagic.
Previously documented ranges for F. plutonia do not show occurrence in the epipelagic.
F. plutonia is not endemic to the Gulf of Mexico and is found away from the prominent
drilling sites in the Gulf of Mexico. Narrow ranges are commonly associated with lower
adaptability and therefore indicate higher vulnerability to exploitation and other
disruptions. However, given F. plutonia does not show substantial overlap with
hydrocarbon extraction, the species is not likely at considerable risk from exposure to
crude oil components. This species should be watched for other threats (e.g. bottom
trawling) given its narrow range. Because of its narrow range, monitoring of possible
effects of oil and other chemicals from the Deepwater Horizon spill on F. plutonia
populations may be valuable for indicating the spread of spill chemicals and their effects.
Wide ranges are exhibited by several species including Leucoraja lentiginosa
(Fig. 2-11) and Rajellapurpuriventrals (Fig. 2-12). L. lentiginosa occupies the epi-,
meso-, and bathypelagic zones of the Gulf of Mexico, a large expansion of recognized
vertical range in comparison to previously documented vertical ranges for the species. L.
lentiginosa is also widely distributed throughout the Gulf of Mexico and has a large
number of specimen records, which is likely indicative of a large population size.
Although L. lentiginosa is endemic and has a 52.94% range overlap with the Deepwater
76

Horizon oil spill (Chakrabarty et al., 2012), there is a reduced likelihood of the species
becoming extinct from hydrocarbon exposure because of the large range, both vertically
and geographically. However, a large proportion of catch records of this species in the
northern Gulf of Mexico, overlap with offshore oil and gas extraction. This may put the
northern populations of this species at risk from chemical exposure during drilling and in
the event of future oil spills.
Rajellapurpuriventralis also occupies all three vertical zones in the Gulf of
Mexico but is not endemic to the area. I found shallower records than the depth range
documented in McEachran and Fechhelm (1998). However, no minimum depth is
documented by Fishbase.org (Froese & Pauly, 2013). This indicates a poorly known
range for the species and suggests that the use of ArcGIS mapping provide a more
accurate depth range for the species than indicated in previous documentation. The sparse
records in the Gulf of Mexico indicate that R. purpuriventralis likely has a small
population in the Gulf of Mexico and is therefore at an increased risk of extirpation. Over
50% of the records for the Gulf of Mexico overlap with the regions of oil and gas drilling,
further suggesting risk to this species in the Gulf of Mexico from hydrocarbon extraction.
Vertical distribution patterns were also examined for squaliforms; however less
data on habitat preferences (i.e. benthic, demersal, or pelagic) are available for this group
of chondrichthyans. For this reason, fewer species were surveyed, and of those surveyed,
few had many documented catch records in the Gulf of Mexico. Despite these data
limitations, similar trends in vertical distributions were apparent and ArcGIS mapping
similarly determined increased ranges compared to documented ranges for some species.
Squalus cubensis (Fig. 2-13) has the largest number of documented specimens of the
77

squaliforms surveyed. S. cubensis has a range mostly localized to the upper mesopelagic
with several documented captures extending into the epi- and bathypelagic zones.
Previously documented ranges do not include occurrence in the bathypelagic. The range
also extends into the northern Gulf of Mexico where most Gulf of Mexico oil extraction
occurs. This may put S. cubensis at risk. However, the species is not endemic to the area,
has a large range outside the Gulf of Mexico, and may have large population sizes as
indicated by the relatively large number of specimen records. Relative to S. cubensis,
Deaniaprofundorum (Fig. 2-14) and Etmopterus gracilispinis (Fig. 2-15) are likely at
increased risk due to hydrocarbon extraction within their ranges. Both species have very
few specimen records in the Gulf of Mexico (five and four records respectively),
indicating that the species likely has small population sizes in the area. Furthermore, the
catch records have a very narrow distribution and are almost all located in the area of
drilling in the northern Gulf of Mexico (Figs. 2-16 and 2-17) and very near the range of
oil spilled by the Deepwater Horizon spill (Fig. 2-18). Both species may be vulnerable to
extirpation.
The large proportion of species which showed an expansion in recognized depth
range through use of ArcGIS mapping highlights the lack of data available for these
species and demonstrates the necessity for more studies to determine more accurate
ranges of chondrichthyans. Accurate ranges must be identified in order to accurately
assess conservation threats posed to these species. Given the possibility of expanded
ranges shown here, some species may be at risk from other sources (e.g. oil spills,
chemical dumping, trawling, and fishing) that were not previously considered to be
threats.
78

These patterns are not unique for chondrichthyans and the threats explained here
also apply to other deep-sea species. ArcGIS mapping methodology can be used to
determine ranges of other benthic and demersal fauna and to assess geographically
identifiable threats to populations of these species. Threat assessment is very important in
measuring a population or ecosystem’s health and its ability to rebound from human
disturbance. While healthy populations may be able to rebound from population decrease
resulting from stressors such as toxin exposure or overfishing, the potential to rebound
decreases as stress on the population increases. Populations, especially chondrichthyans
and other long lived deep-sea species, are at increased risk of extirpation or extinction
when experiencing multiple stressors (such as a combination of overfishing and exposure
to the chemicals released during hydrocarbon extraction). For these species, close
population monitoring is pertinent. In light of the Deepwater Horizon oil spill, regulations
should be put in place to regulate threats (i.e. fishing and trawling) to these species in an
effort to alleviate the potential for multiple stressors reducing population health. Endemic
species are of particular concern given their localized range and increased risk of
extinction after local population decline.
Importance also should be put on monitoring these species due to their potential
as indicator species. As apex predators, chondrichthyans may show signs of toxic
accumulation not seen in smaller, shorter-lived species. Through chronic exposure and
bioaccumulation of toxins from the organisms they feed upon, chondrichthyans may
show symptoms related to crude oil exposure that are not seen in the epipelagic species
lower in the food chain that have previously been studied (Wertheimer et al., 2000;
Schrope, 2011). Symptoms from bioaccumulation are of particular interest given the
79

possibility that they may present themselves in humans if the species caught
commercially are exposed to hydrocarbons from drilling in the Gulf of Mexico.
Chondrichthyan population declines should not only be monitored to assess overall
biodiversity and ecosystem health (Robinson, 2009) but also for the potential to
illuminate the health of the ecosystem after toxic chemical exposure. In essence,
chondrichthyans may act as a canary in a coal mine- illuminating threats posed to other
organisms (including humans) before their effects are more catastrophic.
Indicator species may prove important given the recent increase in deep-sea
hydrocarbon extraction which has unknown effects on the deep-sea communities or the
chemical released from the wells at such high pressure. Both past and present well
locations (Fig. 2-16) pose environmental threats to the area. Post drilling surveys have
demonstrated poor benthic habitat surrounding wells. Furthermore, oil-based mud
deposited during the process may persist for 5 or more years while benthic damage
caused by anchoring may remain for more than 14 years (Continental Shelf Associates,
Inc., 2006).
The shift of platform locations from predominantly in the epipelagic (Fig. 2-16) to
the majority of current leases being within the meso- and bathypelagic (Fig. 2-17)
highlights the increasing threats the deep-sea ecosystems. Oil and gas extraction is
moving into deeper territories and exposing poorly studied deep-sea organisms to new
threats. The effects are further uncertain because we have no knowledge of the behavior
and biological effects of crude oil at such high pressures. Without a deeper understanding
of the deep-sea environments and the organisms therein, we cannot effectively conserve
them.
80

Conclusion:
I have become increasingly aware of the need for a deeper understanding of the
deep-sea ichthyofauna and the deep-sea environment. There is surprisingly little
information about the biology and life history traits of most deep-sea species. With such
sparse information, it is very difficult to accurately assess the types and severity of
conservation threats which may be posed to these specialized organisms.
Hydrocarbon extraction in the Gulf of Mexico makes this lack of knowledge a
particularly large problem. Scientists examining the aftermath of the Deewater Horizon
oil spill have no idea how the oil released will be altered by the high pressures of the deep
sea, where the oil remains after emulsification by dispersants, and if it is even being
naturally degraded. The extent of habitat destruction caused by the blowout (as well as
the more regular drilling activities in the Gulf of Mexico) is unknown, leaving little
information to assess conservation threats to the area. This issue is compounded by the
fact that so little is known about the biology, life history, and distribution of many deep-
sea species. With such large gaps in our knowledge of both the threats and the organisms
themselves, species and habitats cannot effectively be protected through conservational
efforts. The work I did in my thesis attempts to classify threats posed to a specific subset
of deep-sea organisms by deep-sea drilling in the Gulf of Mexico. However, many other
poorly studied species are likely in jeopardy, and may suffer population reduction,
extirpation, and/or extinction as a result of the current problems they face. Without
knowing exactly how oil released during the drilling process and well-head blowouts are
impacting the environment, we cannot accurately determine which species are most
affected and cannot therefore work on protecting them.
81

I focus on oil and gas drilling as a major threat in my thesis because of the high
incidence of drilling in the northern Gulf of Mexico. However, this is not the only area in
the world where deep-sea species are being put at risk by deep-sea hydrocarbon
extraction, and oil and gas drilling is by no means the only threat that affects marine
organisms. There are numerous threats that are as detrimental, if not more threatening
and have likewise unknown consequences. The deep-sea has commonly been exploited
both as a place to dump pollutants (trash, toxic waste, etc.) and as a place of resource
acquisition (hydrocarbons, minerals, etc.) when these activities have been questioned or
curtailed in nearshore coastal ecosystems (Rarmirez-Llodra et al., 2011). The philosophy
of “out of sight, out of mind” seems to be applied quite literally to the deep sea as many
less ethical practices are easily continued in the depths of the oceans where damage can
slip by unnoticed for quite some time. We cannot continue to exploit the ocean just
because the immediate consequences of our actions are not as visible as they would be in
a terrestrial ecosystem. I believe we must start acting under the precautionary principle to
protect these fragile and valuable deep-sea ecosystems, working to prevent exploitation
before it happens rather than trying to put a band-aid over the gaping wounds we create in
the environment.
Humanity has already severely damaged marine ecosystems, causing extinction of
some species, such as the Caribbean monk seal, and endangering countless others.
Coastal marine ecosystems, like the extremely important mangrove habitats, have been
destroyed for shrimp farming and hotel construction. Whereas coral reefs have been
devastated by pollution, eutrophication, bottom trawling and direct physical damage. It is
heart wrenching for me to hear of the destruction caused to oceanic ecosystems I find so
82

beautiful and to the marine organisms that enchant me. Before this intellectual journey
into the deep-sea, I was unaware that these miraculous, alien-like, poorly-understood
organisms were already threatened by mankind. It seems unconscionable to me that we
have so substantially damaged the deep-sea environment before we have taken the time
to realize the full extent of the wonder that nature has presented to us.
Despite the tragedy of destruction in the deep-sea, I remain hopeful. Our planet
has proven time and time again that when left to its own devices, repairs can be made. If
we act now to end the dumping of pollutants into the ocean, look for sustainable fishing
options, and search for clean energy sources, the ecosystem likely will be able to rebound
from the damage that has been caused. This hope is what fuels my desire to continue my
explorations of the ocean and after my work on this thesis, of the deep-sea. I firmly
believe that knowledge is the key to putting an end to the destruction. Only through
knowledge can we discover the true extent of the damage caused and the organisms
harmed and then act to correct it. I realize that change will be slow, but I hope that by
researching organisms and illuminating threats posed to these species, policies can be
made which will protect these organisms that I find so fascinating.
It is with this goal in mind that I continue with my research on the deep-sea.
While I end here with the work specifically on the geographic and depth distribution of
the deep-sea ichthyofauna of the Gulf of Mexico and the conservation threats presented
in this geographical region, I will move on to researching the biology of deep-sea fish in
a Master’s program, with the intention of uncovering some of the many questions left
unanswered about these incredible fish. I hope that this new journey will lead me down
83

the road of conservation once again, even if that is expressed through sharing my
research with others.
I firmly believe education is the most effective mode of conservation at our
disposal. Only when people are made aware of the wrongs in the world can they act to
change them. The more I learn about the ocean, the more beauty I find. I hope that by
sharing my enthusiasm about the ocean with others they will also learn to appreciate the
beauty in the creatures and habitats that lie beneath the waves, and through this
appreciation, can join me in the journey of trying to protect the seas. But only by sharing
my knowledge and educating the public can I even begin to redeem the world, “all of it,
just as it is” (Dillard, 1999).
84

Figure 2-1: Litter occurrence in the Mississippi Trough in the Gulf of Mexico (Ramirez- Llodra et al., 2011: Fig. 3). Trawls were dominated by plastic, aluminum cans, discarded fishing gear and wood in trawls from 74 of the tested sites (n = 34).
85

Figure 2-2: Chondrichthyan species richness along 100 m intervals in the Gulf of Mexico. Red bars denote the total number of chondrychthyan species at each depth interval. Pie charts below the X axis show the fish species composition at each respective depth interval. Blue-gray shading shows traditional oceanic zonation of the Epipelagic, Mesopelagic, and Bathypelagic. Dashed lines show boundaries between upper/lower oceanic zones and enclose pie charts that demonstrate the taxonomic composition for each respective zone.
86

0 150 300 600 Kilometers--- 1 1— i— i------1— i---------------1— i---------------1
Figure 2-3: Bathymetry of the Gulf of Mexico. Highlighted blue lines show the 200 m contour (closer to shore) and the 1000 m contour (farther from shore). Lightest grey contours represent 0 - 100 m depths in 10 m intervals, medium grey contours represent 200 - 100 m depths in 100 m intervals, and darkest grey contours represent 1000 - 3500 m depths in 500 m intervals. Scale shown in kilometers.
87

A)
B)
aoQSsS’53es
f eg & ,g waaCS
25
McEachran & Fecchelm Maximum Depth (m)
Fishbase Maximum Depth (m)
Figure 2-4: Range comparisons between maximum depths obtained using the ArcGIS mapping methodology and those (A) documented in McEachran & Fecchelm (1998) and (B) Fishbase.org (2013). Red line shows a 1:1 ratio for the depths. Blue X ’s denote chondrichthyan species. Data points that fall above the 1:1 line show general increases in maximum depths from the documented sources using ArcGIS mapping
88

Figure 2-5: Distribution of Rajella fuliginea in the Gulf of Mexico. Same scale as shown in Fig. 2-3.
89

Figure 2-6: Distribution of Anacanthobatis folirostris in the Gulf of Mexico. Same scale as shown in Fig. 2-3.
90

Figure 2-7: Distribution of Dipturus oregoni in the Gulf of Mexico. Same scale as shown in Fig. 2-3.
91

Figure 2-8: Distribution map of Raja texana in the Gulf of Mexico. Same scale as shown in Fig. 2-3.
92

Figure 2-9: Distribution of Dipturus olseni in the Gulf of Mexico. Same scale as shown in Fig. 2-3.
93

Figure 2-10: Distribution of Fenestrajaplutonia in the Gulf of Mexico. Same scale as shown in Fig. 2-3.
94

Figure 2-11: Distribution of Leucoraja lentiginosa in the Gulf of Mexico. Same scale as shown in Fig. 2-3.
95

Figure 2-12: Distribution of Rajella purpuriventralis in the Gulf of Mexico. Same scale as shown in Fig. 2-3.
96

Figure 2-13: Distribution of Squalus cubensis in the Gulf of Mexico. Same scale as shown in Fig. 2-3.
97

Figure 2-14: Distribution of Deaniaprofundorum in the Gulf of Mexico. Same scale as shown in Fig. 2-3.
98

Figure 2-15: Distribution of Etmopterus gracilispinis in the Gulf of Mexico. Same scale as shown in Fig. 2-3.
99

Figure 2-16: Location of oil and gas platforms in the Gulf of Mexico as of March 2013. Data provided by Bureau of Ocean Energy Management. All platforms in the BOEM’s database are included in the map, active and inactive platforms. Same scale as shown in Fig. 2-3.
100

Figure 2-17: Active oil and gas drilling leases in the Gulf of Mexico as of March 2013. Information provided by Bureau of Ocean Energy Management. Same scale as shown in Fig. 2-3.
101

Figure 2-18: Surface area and deepwater areas affected by the oil from the Deep Water Horizon oil spill. Orange diamond indicates the location of the Horizon well. Same scale as shown in Fig. 2-3. Basemap source: ESRI
102

Table 2-1: Comparisons of species ranges from documented sources (McEachran & Fecchelm, 1998; Fishbase.org, 2013) to those determined using GBIF specimen record catch locations overlaid on a bathymetric map in ArcGIS. Purple highlights denote a decrease in the mapped depth when compared to both documented depths while red highlights indicate depth increases compared to both documented depths. Blanks occur when there is no data available.
McEachran & Fecchelm (1998)
Fishbase.org (2013) ArcM apping Data
Species Min max Range min m ax Range min m ax Range average # o f records
Centroscymnus cryptacanthus 400 1164 764 400 1200 800 700 900 200 775 2
Deania profundorum 275 1785 1510 205 1800 1595 300 1500 1200 608.33 6Etmopterus bigelowi 110 1000 890 163 1000 837 200 900 700 506.67 45
Etmopterus gracilispinis 100 1000 900 70 1000 930 10 1500 1490 730.71 7Etmopterus schultzi 348 732 384 200 1000 800Scymnodon squamulosus 550 1450 900 0 2200 2200 500 900 400 766 .67 3Squalus cubensis 60 380 320 60 400 340 50 2500 2450 452.27 91Squalus mitsukurii 330 394 64 29 600 571 300 800 500 550 2
Rhinobatos lentiginosus 0 18 18 0 30 30 0 1000 1000 42.84 58Anacanthobatis folirostris 300 512 212 425 472 47 60 1500 1440 432.5 114
Anacanthobatis longirostris 520 1052 532 530 1052 522 10 1500 1490 877.5 4Breviraja colesi 220 415 195 366 522 156
Breviraja spinosa 366 671 305 323 675 352 20 1000 980 555 .45 12
Curiraja poeyi 355 870 515 385 870 485 500 700 200 600 1Curiraja rugosa 366 915 549 366 1007 641 20 3000 2980 730.98 33
Dactylobatus armatus 338 685 347 300 900 600 0Dactylobatus clarki 366 915 549 475 1000 525 400 2000 1600 720 .59 22Dipturus bullisi 183 549 366 200 600 400 100 700 600 407.41 14

Dipturus garricki 275 476 201 275 476 201 200 500 300 400 5Dipturus olseni 55 384 329 91 238 147 20 1500 1480 178.59 71
Dipturus oregoni 475 1079 604 369 468 99 300 1500 1200 687.5 4Dipturus teevani 320 732 412 320 940 620 5 700 695 436.59 24
Fenestraja ishiyamai 503 950 447 400 1000 600 900 1000 100 950 3Fenestraja plutonia 293 1024 731 290 750 460 70 1500 1430 551.71 56Fenestraja sinusmexicanus 59 1096 1037 311 311 0
Leucoraja garmani 66 366 300 55 530 475 10 700 690 262 .35 45Leucoraja lentiginosa 53 588 535 53 457 404 30 3500 3470 335.57 56
Pseudoraja fischeri 412 576 164 412 412 0 300 800 500 393.75 8Raja ackleyi 32 384 352 45 45 40 60 20 50 3
Raja eglanteria 0 119 119 0 0 500 500 74.731 53Raja texana 15 110 95 183 183 0 3500 3500 98.756 94Rajella fuliginea 731 1280 549 732 824 92 30 3000 2970 954.16 40
Rajella purpuriventralis 732 2010 1278 922 0 3000 3000 1317.2 16

References:
Abbott, K. (2006). Grenadier. Seafood Watch Seafood Report Monterey Bay Aquarium.Baum, J. K., & Myers, R. a. (2004). Shifting baselines and the decline of pelagic sharks
in the Gulf of Mexico. Ecology Letters, 7(2), 135-145. doi: 10.1111/j .1461- 0248.2003.00564.x
Bianchi, G., Gislason, H., Graham, K., Hill, L., Jin, X., Sainsbury, K., Sanchez, F., et al. (2000). Impact of fishing on size composition and diversity of demersal fish communities. ICES Journal o f Marine Science, 57(3), 558-571. doi:10.1006/jmsc.2000.0727
Bonfil, R. (1997). Status of shark resources in the Southern Gulf of Mexico and Caribbean : implications for management. Fisheries Research, 29, 101-117.
Castro, J. I. (2011). The Sharks o f North America. Oxford: Oxford University Press.Chakrabarty, P., Lam, C., Hardman, J., Aaronson, J., House, P. H., & Janies, D. a.
(2012). SpeciesMap: a web-based application for visualizing the overlap of distributions and pollution events, with a list of fishes put at risk by the 2010 Gulf of Mexico oil spill. Biodiversity and Conservation, 21(7), 1865-1876. doi:10.1007/s 10531-012-0284-4
Continental Shelf Associeates, Inc. (2006). Effects of Oil and Gas Exploration andDevelopment at Selected Continental Slope Sites in the Gulf of Mexico, Volume I: Executive Summary. U.S. Department of the Interior, Minerals Management Service, Gulf of Mexico OCS Region, New Orleans, LA. OCS Study MMS 2006044. 45pp.
Davies, A. J., Roberts, J. M., & Hall-Spencer, J. (2007). Preserving deep-sea natural heritage: Emerging issues in offshore conservation and management. Biological Conservation, 138(3-4), 299-312. doi:10.1016/j.biocon.2007.05.011
Devine, J. a, Baker, K. D., & Haedrich, R. L. (2006). Fisheries: deep-sea fishes qualify as endangered. Nature, 439(7072), 29. doi:10.1038/439029a
Dillard, A. (1999). For the Time Being. New York: Vintage Books.ESRI 2011. ArcGIS Desktop: Release 10. Redlands, CA: Environmental Systems
Research Institute.Fodrie, F. J., & Heck, K. L. (2011). Response of coastal fishes to the Gulf of Mexico oil
disaster. PloS one, 6(7), e21609. doi:10.1371/journal.pone.0021609Franks, J. (2000). A review: pelagic fishes at petroleum platforms in the northern Gulf of
Mexico; diversity, interrelationships, and perspectives. Biology and behaviour o f pelagic fish aggregations, 502-515.
Frose, R. and Pauly, D., eds. (02/2013). Fishbase. World Wide electronic publication. Retrieved 15 March, 2013 from http://fishbase.org.
Gallaway, B. J., Cole, J. G., Martin, L. R., & Ecological, L. G. L. (2001). The Deep Sea Gulf of Mexico : An Overview and Guide. OCS Study.
GBIF.org (2013). GBIF Data Portal. World Wide electronic publication. Retrieved January, 2013 from http://gbif.org.
Grace, M. A., Noble, B., Ingram, W., & Pollack, A. (2010). Fishery-independent Bottom Trawl Surveys for Deep-water Fishes and invertebrates of the U . S . Gulf of Mexico, 2002-08. Marine Fisheries Review, 72(4), 20-25.
105

Holden, M. J. (1973). Are long-term sustainable fisheries for elasmobranchs possible? Rapports et Process-Verbaux des Reunions du Conseil International pour l"Expoloration de laMer, 164, 360-367.
Holden, M. J. (1974). Problems in the rational exploitation of elasmobranch populations and some suggested solutions. Sea Fisheries Research (pp. 117- 137).
IHS (2013). IHS Petrodata weekly rig count. Received March 20, 2013 from http://www.ihs.com
Jensen, M.N. (1997). Pacific Grenadier, an old-growth fish? Science Notes. Retrieved March 18, 2013 from http://sciencenotes.ucsc.edu.
McEachran, J.D. & Fechhelm, J.D. (1998). Fishes o f the Gulf o f Mexico Vol 1. Austin: University of Texas Press.
Metabolism of PAHs by teleost fish, scientific findings: Memorandum to Eric Schwaab, Assistant Administrator for Fisheries, National Marine Fisheries Service and John Oliver, Deputy Assistant Administrator for Operations, National Marine Fisheries Service, from /s/ John E. Stein, Deputy Director Northwest Fisheries Science Center, NMFS. (2010). Silver Spring, MD: U.S. Dept. of Commerce, National Oceanic and Atmospheric Administration, National Marine Fisheries Service. QL615.S84.2010.
Monterey Bay Aquarium (2013) Seafood Watch. Retrieved March 18, 2013 from http://www.montereybayaquarium.org.
Moore, C. (2011). Plastic Ocean. New York: Avery.NOAA (2010a). Fish stocks in the Gulf of Mexico fact sheet.NOAA (2010b). Oil spill dispersant application and monitoring. NOAA’s Oil Spill
Response.Pequegnat, W. E. (1983). The ecological communities of the continental slope and
adjacent regimes of the northern Gulf of Mexico. United States Department o f the Interior Minerals Management Services (Vol. 11, pp. 1-39).Pequegnat, L. H., Gallaway, W. E., & Pequegnat, B. J. (1990). Aspects of the ecology of the deep- water fauna of the Gulf of mexico. American Zoologist, 30, 45-64.
Pequegnat, W.E., Gallaway, B.J., & Pequegnat, L.H. (1990). Aspects of the ecology of the deep-water fauna of the Gulf of Mexico. American Zoologist, 30, 45-64.
Peterson, Charles H, Anderson, S. S., Cherr, G. N., Ambrose, R. F., Anghera, S., Bay, S., Blum, M., et al. (2012). A Tale of Two Spills: Novel Science and Policy Implications of an Emerging New Oil Spill Model. BioScience, 62(5), 461-469. doi:10.1525/bio.2012.62.5.7
Peterson, C.H., Kennicutt II, M. C., Green, R. H., Montagna, P., Harper, D. E. J., Powell, E. N., & Roscigno, P. F. (1996). Consequences of deepsea hydrocarbon fromation in Gulf of Mexico (1996).pdf. Canadian journal o f fisheries and aquatic sciences1, 53(11), 2637-2654.
Ramirez-Llodra, E., Tyler, P. a, Baker, M. C., Bergstad, O. A., Clark, M. R., Escobar, E., Levin, L. a, et al. (2011). Man and the last great wilderness: human impact on the deep sea. PloS one, 6(8), e22588. doi:10.1371/journal.pone.0022588
Robison, B. H. (2009). Conservation of deep pelagic biodiversity. Conservation biology: the journal o f the Society for Conservation Biology, 23(4), 847-58. doi:10.1111/j.1523-1739.2009.01219.x
106

Schrope, M. (2010). Deepwater Horizon: A scientist at the centre of the spill. Nature, 455(466), 680-684.
Schrope, M. (2011). Deep wounds. Nature, 472, 152-154.Stevens, M. (2003). Orange Roughy Hoplostethus atlanticus. Seafood Watch Seafood
Report Monterey Bay Aquarium.Stevens, J., Bonfil, R., Dulvy, N. K., & Walker, P. A. (2000). The effects of fishing on
sharks, rays, and chimaeras (chondrichthyans), and the implications for marine ecosystems. ICES Journal o f Marine Science, 57, 476-494. doi:10.1006/jmsc.2000.0724
Stiles, M., Harrould-Kolieb, E., Faure, P., Ylitalo-Ward, H., & Hirshfield, F. (2007). Deep Sea Trawl Fisheries of the Southeast US and Gulf of Mexico : Rock shrimp, Royal red Shrimp, Calico scallops.
Upton, H. F. (2011). The Deepwater Horizon Oil Spill and the Gulf o f Mexico Fishing Industry. CRSReport for Congress. pp. 1-14.
Walker, P. A., & Hislop, J. R. G. (1998). Sensitive skates or resilient rays ? Spatial and temporal shifts in ray species composition in the central and north-western North Sea between 1930 and the present day. ICES Journal o f Marine Science, 55, 392402.
Walker, T. I. (1998). Can shark resources be harvested sustainably? A question revisited with a review of shark fisheries. Marine Freshwater Research, 49, 553-572.
Wertheimer, A. C., Heintz, R. A., Thedinga, J. F., Maselko, J. M., & Stanley, D. (2000). Straying of Adult Pink Salmon from their Natal Stream following Embryonic Exposure to Weathered Exxon Valdez Crude Oil Straying of Adult Pink Salmon from their Natal Stream. Transactions o f the American Fisheries Societly, 129, 9891004.
Wood, C. C., Ketchen, K. S., & Beamish, R. J. (1979). Population Dynamics of Spiny Dogfish ( Squalus acanthias ) in British Columbia Waters Age-Structure. Journal o f Fisheries Board Canada, 36, 647-656.
Worm, B., Davis, B., Kettemer, L., Ward-Paige, C. a., Chapman, D., Heithaus, M. R., Kessel, S. T., et al. (2013). Global catches, exploitation rates, and rebuilding options for sharks. Marine Policy, 40, 194-204. Elsevier. doi:10.1016/j.marpol.2012.12.034
107

APPENDIX I
Distribution maps of all Rajiformes and Squaliformes examined in this study in alphabetical order. The genera Centroscymnus, Deania, Etmopterus, Scymnodon, and Squalus belong to the order Squaliformes. All other included taxa are in Rajiformes.
Anacanthobatis longirostris Centroscymnus cryptacanthus
Breviraja colesi Curiraja poeyi
108

Curiraja rugosa
Dactylobatus armatus
Dactylobatus clarki
Dipturus bullisi
Dipturus garricki
Dipturus olseni
109

Dipturus oregoni
Etmopterus bigelowi
Etmopterus gracilispinis
Fenestraja ishiyamai
110
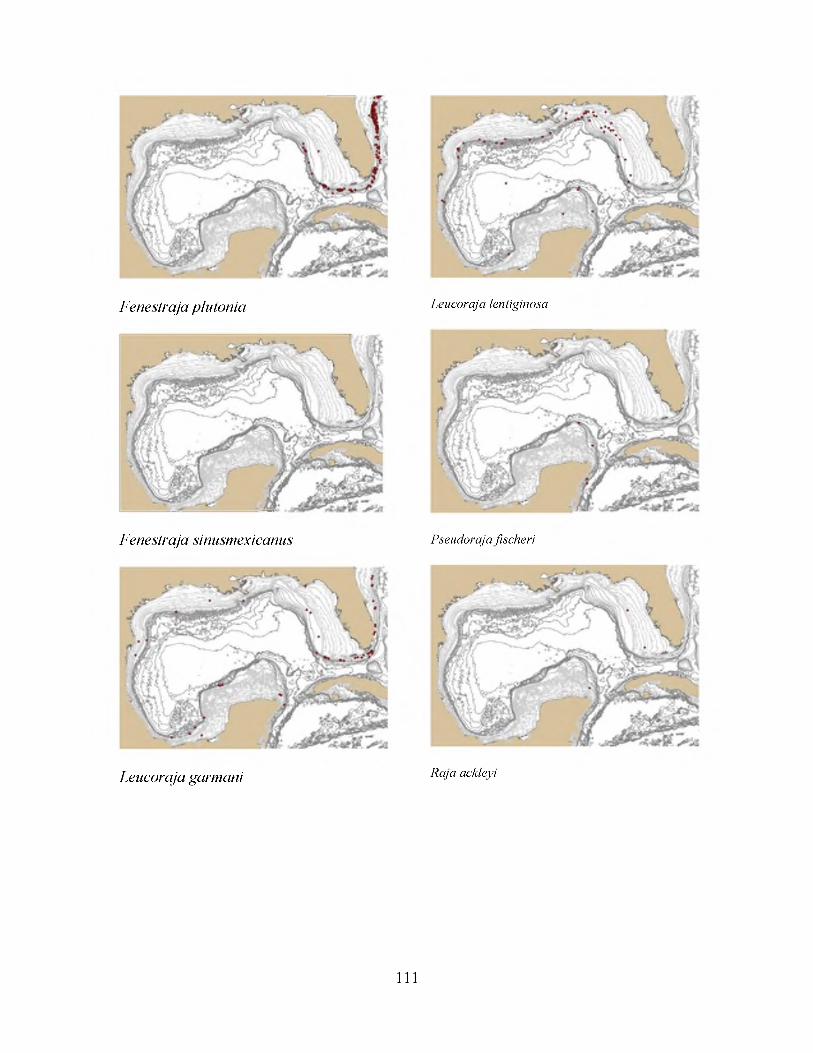
Fenestraja plutonia Leucoraja lentiginosa
Fenestraja sinusmexicanus Pseudoraja fischeri
Leucoraja garmani Raja ackleyi
111

Raja eglanteria Rajella purpuriventralis
Raja texana Rhinobatos lentiginosus
Rajella fuliginea Scymnodon squamulosus
112

Squalus cubensis Squalus mitsukurii
113