diversity figures - 2011aws189-prod-web-900668400.ap-southeast-2.elb.amazo… · web...
TRANSCRIPT

Diversity FiguresDepartment of Aboriginal and Torres Strait Islander and Multicultural Affairs
Great state. Great opportunity.
Diversity FiguresAt the time of the 2011 Census, 20.5% (888,636 people) of Queensland’s total resident population1 stated they were born overseas, an increase from 17.9% (699,448 people) at the 2006 Census.Queensland is home to people who speak more than 220 languages, hold more than 100 religious beliefs and come from more than 220 countries.
The Queensland Government supports the continued growth and development of strong multicultural communities in Queensland. It also supports the celebration of, and education about, Queensland’s diverse cultural heritage and to ensuring our cultural differences are viewed as a positive and valuable resource for us all.
The government also values the cultural, social and economic rewards cultural diversity2 generates in Queensland and has compiled this document to illustrate the unique features of our diverse population.
This document primarily uses data from the Australian Bureau of Statistics (ABS) 2011 Census of Population and Housing to provide a snapshot of Queensland’s population diversity, with additional data sourced from the Commonwealth Department of Immigration and Citizenship (DIAC).
There are a number of interesting social and cultural characteristics featured in the following pages including:
the source countries of overseas-born people in Queensland the ancestry of Queensland residents languages spoken other than English English language proficiency of overseas-born people Aboriginal people and Torres Strait Islander people migration patterns.
20.5% or 888,636 Queenslanders were born overseas in more than 220 countries.
Country of birthCensus 2011 data shows that 4,332,739 residents were counted in Queensland, an increase of 11.0% (428,204 people) from 3,904,534 in 2006. Queensland’s cultural diversity has also increased during this time.
1 1 5.8% (251,987) of people who were usual residents of Queensland did not state their birthplace at the time of the 2011 Census. These people are included in Queensland’s total usual resident population.2 Unless otherwise stated, all Census data in this document relate to place of usual residence, which is where persons usually live rather than the place where they were counted on Census night.
1

There were 888,636 people living in Queensland in 2011 who stated they were born overseas. This represented 20.5% of Queensland’s total resident population, compared with 17.9% in 2006. The number of Queensland residents born overseas increased by 27.0% (189,188 people) from 2006 to 2011, compared with an increase of 18.5% (688,927 people) in the rest of Australia.
At the same time, the proportion of Queensland’s total resident population born overseas was lower than most other jurisdictions, for example 30.7% in Western Australia, 26.2% in Victoria and 25.7% in New South Wales. Only Tasmania and the Northern Territory had lower proportions of residents born overseas (Table 1). However, when comparing the actual number of people born overseas, Queensland has the third highest number after New South Wales (1,778,550) and Victoria (1,405,337). Almost one in every 10 of Queensland’s residents was born in a non-main English speaking country (9.5%). This was about half of the proportion reported in both Victoria (19.6%) and New South Wales (18.6%).
Table 1 -Overseas-born people as a proportion of the total population, states and territories, 2011
StateOverseas-born as % of population
Born in a non-MESC as % of population (a)
NSW 25.7 18.6
Vic. 26.2 19.6
Qld 20.5 9.5
SA 22.1 12.7
WA 30.7 14.4
Tas. 11.6 5.1
NT 16.6 10.4
ACT 24.2 16.8
(a) non-main English speaking country (MESC) (excludes United Kingdom, Republic of Ireland, New Zealand, Canada, United States of America and South Africa)
Source: ABS 2011 Census of Population and Housing.
The majority of people in Queensland in 2011 who were born overseas were born in New Zealand (192,037 people, or 4.4% of the total population) and England (179,495 people, or 4.1% of the total population). Together, these two countries accounted for 41.8% of all residents born overseas (Table 2). However, there were also considerable numbers of Queensland residents born in South Africa, India, Philippines, China, Scotland and Germany in the Queensland population. In the rest of Australia, England was the main country of birth, followed by China, New Zealand and India.
People born in New Zealand represented a much higher proportion of the Queensland population (4.4%) compared with the rest of Australia (1.7%). Of all New Zealand-born
Australian residents, 39.7% lived in Queensland. People born in China, India, Italy and Vietnam were under-represented in Queensland with proportions for these countries of birth less than half of those measured for the rest of Australia.
2

36.2% or 1,566,854 Queenslanders were either born overseas or have at least one parent born overseas.Table 2: Top 20 overseas countries of birth, Queensland and rest of Australia, 2011Queensland Rest of Australia
Country of birth Number
% of total
population
Country of birth Number
% of total population
Australia 3,192,114 73.7 Australia 11,825,731 68.9
New Zealand 192,037 4.4 England 732,097 4.3
England 179,495 4.1 China(a) 291,933 1.7
South Africa 35,549 0.8 New Zealand 291,359 1.7
India 30,259 0.7 India 265,104 1.5
Philippines 29,462 0.7 Italy 172,170 1.0
China(a) 27,036 0.6 Vietnam 168,770 1.0
Scotland 24,058 0.6 Philippines 141,771 0.8
Germany 21,027 0.5 South Africa 110,134 0.6
Vietnam 16,269 0.4 Scotland 109,374 0.6
United States of America 15,811 0.4 Malaysia 103,406 0.6
Netherlands 14,986 0.3 Greece 96,497 0.6
Papua New Guinea 14,500 0.3 Germany 86,976 0.5
Italy 13,231 0.3 Sri Lanka 78,717 0.5
Malaysia 12,790 0.3 Lebanon 75,157 0.4
South Korea 12,552 0.3 Hong Kong(b) 66,226 0.4
Fiji 11,401 0.3 South Korea 61,986 0.4
Ireland 10,901 0.3United States of America 61,199 0.4
Taiwan 10,893 0.3 Netherlands 61,061 0.4
Japan 10,317 0.2 Indonesia 56,599 0.3
Canada 9664 0.2 Ireland 56,417 0.3
3

Other(c) 196,398 4.5 Other(c) 1,318,558 7.7
Total overseas-born(c) 888,636 20.5
Total overseas-born(c) 4,405,511 25.7
Total(d)4,332,7
39 100.0 Total(d)17,174,9
81 100.0
(a) Excludes Special Administrative Regions of Hong Kong and Macau, and Taiwan Province. (b) Special Administrative Region of China.
(c) Includes ‘Australian External Territories’, ‘Inadequately described’ and ‘At sea’. (d) Includes ‘Not stated’.
Source: ABS 2011 Census of Population and Housing.
In addition to the 20.5% of Queensland residents born overseas, 10.5% of the population were born in Australia and had one parent born overseas, and 5.2% of the population were born in Australia and had both parents born overseas (Table 2.1). More than one in three (36.2%) Queenslanders were either born overseas or had at least one parent born overseas.
In the rest of Australia, a higher proportion of the population (45.3%) were either born overseas or had at least one parent born overseas (Table 2.2). This was largely a result of a higher proportion of people born overseas (25.7% in the rest of Australia) and a higher proportion of people born in Australia with both parents born overseas (9.2% compared with 5.2% in Queensland). The proportion of the population born in Australia with one parent born overseas was similar, with 10.5% in Queensland and 10.4% in the rest of Australia.
Table 2.1: Country of birth and birthplace of parents, Queensland, 2011
4

Queensland %
Overseas-born 20.5%
Australian-born (both parents overseas-born) 5.2%
Australian-born (one parent overseas-born) 10.5%
Overseas-born or had at least one parent born overseas (sub total) 36.2%
Australian-born (both parents born in Australia) 56.2%
Australian-born (birthplace for either or both parents not stated) 1.8%
Birthplace not stated 5.8%
Table 2.2: Country of birth and birthplace of parents, rest of Australia, 2011
Source: ABS 2011 Census of
Population and Housing
20.5% of Queenslanders stated they were born outside Australia.Overseas-born persons by local government area (LGA), Queensland, 2011
Among Queensland’s local government areas, Brisbane had the highest proportion of residents born overseas (28.3%), closely followed by the Gold Coast (27.9%) and Logan (26.1%) as shown in Table 4.
The Top 20 Local Government Areas (LGAs) with highest proportion of people born overseas are shown in Table 2.
Table 2: Top 20 LGAs (ASGS 2011) with highest proportion of people born overseas (2011 Census usual residence counts)
1)Brisbane (C) Persons %Population born overseas: 295,201 28.3
5
Rest of Australia %
Overseas-born 25.7%
Australian-born (both parents overseas-born) 9.2%
Australian-born (one parent overseas-born) 10.4%
Overseas-born or had at least one parent born overseas (sub total) 45.3%
Australian-born (both parents born in Australia) 47.5%
Australian-born (birthplace for either or both parents not stated) 1.8%
Birthplace not stated 5.5%

Top overseas countries of birth: New Zealand 41,077 3.9
England 39,721 3.8China (a) 18,555 1.8India 18,049 1.7
Population speaking LOTE at home: 192,586 18.5Most common LOTE spoken at home: Mandarin 27,363 2.62)Gold Coast (C) Persons %Population born overseas: 138,036 27.9Top overseas countries of birth: New Zealand 42,543 8.6
England 27,705 5.6South Africa 5882 1.2Japan 3672 0.7
Population speaking LOTE at home: 50,640 10.2Most common LOTE spoken at home: Japanese 4727 1.03)Logan (C) Persons %Population born overseas: 72,611 26.1Top overseas countries of birth: New Zealand 21,835 7.9
England 12,511 4.5Philippines 2271 0.8South Africa 1883 0.7
Population speaking LOTE at home: 35,544 12.8Most common LOTE spoken at home: Samoan 3876 1.44)Cook (S) Persons %Population born overseas: 963 23.2Top overseas countries of birth: Sri Lanka 219 5.3
Afghanistan 188 4.5England 133 3.2New Zealand 98 2.4
Population speaking LOTE at home: 352 8.5Most common LOTE spoken at home:
Guugu Yimidhirr 76 1.8
5)Redland (C) Persons %Population born overseas: 31,404 22.6Top overseas countries of birth: England 9803 7.1
New Zealand 7596 5.5South Africa 2011 1.5Scotland 1350 1.0
Population speaking LOTE at home: 7951 5.7Most common LOTE spoken at home: German 640 0.56)Cairns (R) Persons %Population born overseas: 31,598 20.2Top overseas countries of birth: England 6503 4.2
6

New Zealand 5281 3.4Papua New Guinea 1996 1.3Japan 1541 1.0
Population speaking LOTE at home: 17,069 10.9Most common LOTE spoken at home: Japanese 2063 1.37)Sunshine Coast (R) Persons %Population born overseas: 60,780 19.8Top overseas countries of birth: England 20,249 6.6
New Zealand 14,908 4.9South Africa 2,448 0.8Germany 2196 0.7
Population speaking LOTE at home: 12,593 4.1Most common LOTE spoken at home: German 1868 0.68)Moreton Bay (R) Persons %Population born overseas: 71,710 19.0Top overseas countries of birth: England 20,462 5.4
New Zealand 18,628 4.9South Africa 3665 1.0Scotland 2531 0.7
Population speaking LOTE at home: 20,391 5.4Most common LOTE spoken at home: Samoan 1564 0.49)Ipswich (C) Persons %Population born overseas: 31,266 18.7Top overseas countries of birth: New Zealand 8631 5.2
England 5912 3.5Samoa 1423 0.9Philippines 1167 0.7
Population speaking LOTE at home: 15,500 9.3Most common LOTE spoken at home: Samoan 3130 1.910)Scenic Rim (R) Persons %Population born overseas: 5428 14.9Top overseas countries of birth: England 1847 5.1
New Zealand 1254 3.4Germany 255 0.7Netherlands 200 0.5
Population speaking LOTE at home: 1136 3.1Most common LOTE spoken at home: German 188 0.511)Mount Isa (C) Persons %Population born overseas: 3099 14.6Top overseas countries of birth: New Zealand 866 4.1
Philippines 412 1.9
7

England 326 1.5South Africa 172 0.8
Population speaking LOTE at home: 1557 7.3Most common LOTE spoken at home: Filipino 162 0.812)Tablelands (R) Persons %Population born overseas: 6348 14.5Top overseas countries of birth: England 1471 3.4
New Zealand 940 2.1Italy 811 1.9Germany 376 0.9
Population speaking LOTE at home: 3158 7.2Most common LOTE spoken at home: Italian 1279 2.913)Whitsunday (R) Persons %Population born overseas: 4437 14.1Top overseas countries of birth: England 1093 3.5
New Zealand 1083 3.4Philippines 233 0.7South Africa 189 0.6
Population speaking LOTE at home: 1433 4.6Most common LOTE spoken at home: Korean 165 0.5
14)Fraser Coast (R) Persons %Population born overseas: 13,339 14.0Top overseas countries of birth: England 4668 4.9
New Zealand 2712 2.8Germany 654 0.7Scotland 591 0.6
Population speaking LOTE at home: 2969 3.1Most common LOTE spoken at home: German 423 0.415)Cassowary Coast (R) Persons %Population born overseas: 3668 13.3Top overseas countries of birth: England 643 2.3
New Zealand 535 1.9India 450 1.6Italy 395 1.4
Population speaking LOTE at home: 2488 9.0Most common LOTE spoken at home: Italian 665 2.416)Townsville (C) Persons %Population born overseas: 23,182 13.3Top overseas countries of birth: England 4936 2.8
New Zealand 4483 2.6Philippines 1208 0.7
8

South Africa 930 0.5Population speaking LOTE at home: 10,471 6.0Most common LOTE spoken at home: Italian 887 0.517)Gladstone (R) Persons %Population born overseas: 7184 12.4Top overseas countries of birth: New Zealand 1950 3.4
England 1498 2.6South Africa 581 1.0Philippines 444 0.8
Population speaking LOTE at home: 2366 4.1Most common LOTE spoken at home: Afrikaans 282 0.518)Lockyer Valley (R) Persons %Population born overseas: 4315 12.3Top overseas countries of birth: England 1066 3.0
New Zealand 693 2.0Philippines 159 0.5Germany 158 0.5
Population speaking LOTE at home: 1720 4.9Most common LOTE spoken at home: Arabic 185 0.519)Somerset (R) Persons %Population born overseas: 2609 12.1Top overseas countries of birth: England 810 3.7
New Zealand 555 2.6
Philippines 191 0.9
Germany 124 0.6Population speaking LOTE at home: 729 3.4Most common LOTE spoken at home: Tagalog 82 0.420)Bundaberg (R) Persons %Population born overseas: 10,750 12.0Top overseas countries of birth: England 3270 3.6
New Zealand 1863 2.1Philippines 497 0.6Germany 477 0.5
Population speaking LOTE at home: 3286 3.7Most common LOTE spoken at home: Italian 382 0.4 (a) Excludes Special Administrative Regions of Hong Kong and Macau, and Taiwan Province .
Source: ABS 2011 Census of Population and Housing
LOTE Language other than English LGAs Local Government Area s(C) City (R) Regional Council
9

Country of birth continued
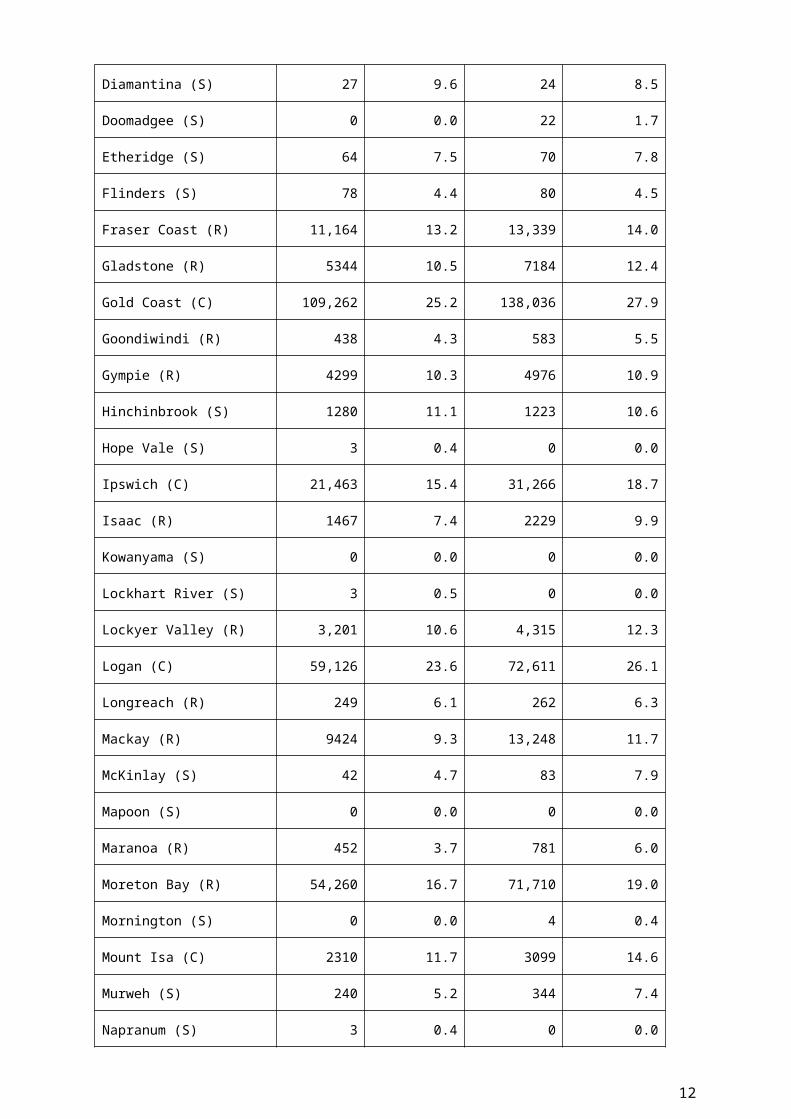
Comparative data on the number and proportion of people born overseas across all Queensland LGAs for 2006 and 2011 is shown in Table 3.
The data shows increases in both the number and percentage of the overseas born population in most of Queensland’s local government areas. Some notable increases between 2006 and 2011 in the number of people born overseas include Ipswich (21,463 to 31,266 people), Mackay (9424 to 13,248 people), Rockhampton (7565 to 10,097 people) and Townsville (17,990 to 23,182 people). Local government areas are listed in alphabetical order.
Table 3: Born overseas by LGAs (ASGC 2011) (a), 2006 and 2011 Census (usual residence counts)
2006 Census 2011 Census
LGAIn alphabetical order of local government area
Born overseas
% of population
Born overseas
% of population
Aurukun (S) 0 0.0 0 0.0
Balonne (S) 178 3.8 221 4.7
Banana (S) 885 6.1 1167 8.1
Barcaldine (R) 143 4.4 177 5.5
Barcoo (S) 15 4.2 16 4.6
Blackall Tambo (R) 67 3.3 104 4.7
Boulia (S) 19 4.5 17 3.5
Brisbane (C) 229,161 24.0 295,201 28.3
Bulloo (S) 13 3.5 19 4.7
Bundaberg (R) 9007 10.9 10,750 12.0
Burdekin (S) 1342 7.9 1459 8.4
Burke (S) 29 5.8 33 6.4
Cairns (R) 25,058 18.2 31,598 20.2
Carpentaria (S) 125 6.4 150 7.3
Cassowary Coast (R) 3317 11.9 3668 13.3
Central Highlands (R) 2212 8.4 3120 10.9
Charters Towers (R) 651 5.7 722 5.9
Cherbourg (S) 3 0.3 0 0.0
Cloncurry (S) 202 6.4 266 8.2
10

Cook (S) 385 11.1 963 23.2
Croydon (S) 12 4.7 14 4.5
Diamantina (S) 27 9.6 24 8.5
Doomadgee (S) 0 0.0 22 1.7
Etheridge (S) 64 7.5 70 7.8
Flinders (S) 78 4.4 80 4.5
Fraser Coast (R) 11,164 13.2 13,339 14.0
Gladstone (R) 5344 10.5 7184 12.4
Gold Coast (C) 109,262 25.2 138,036 27.9
Goondiwindi (R) 438 4.3 583 5.5
Gympie (R) 4299 10.3 4976 10.9
Hinchinbrook (S) 1280 11.1 1223 10.6
Hope Vale (S) 3 0.4 0 0.0
Ipswich (C) 21,463 15.4 31,266 18.7
Isaac (R) 1467 7.4 2229 9.9
Kowanyama (S) 0 0.0 0 0.0
Lockhart River (S) 3 0.5 0 0.0
Lockyer Valley (R) 3,201 10.6 4,315 12.3
Logan (C) 59,126 23.6 72,611 26.1
Longreach (R) 249 6.1 262 6.3
Mackay (R) 9424 9.3 13,248 11.7
McKinlay (S) 42 4.7 83 7.9
Mapoon (S) 0 0.0 0 0.0
Maranoa (R) 452 3.7 781 6.0
Moreton Bay (R) 54,260 16.7 71,710 19.0
Mornington (S) 0 0.0 4 0.4
Mount Isa (C) 2310 11.7 3099 14.6
Murweh (S) 240 5.2 344 7.4
Napranum (S) 3 0.4 0 0.0
11
North Burnett (R) 664 6.5 830 8.2
Northern Peninsula Area (R) 0 0.0 13 0.6
Palm Island (S) 3 0.2 0 0.0
Paroo (S) 72 3.7 79 4.3
Pormpuraaw (S) 0 0.0 3 0.5
Quilpie (S) 44 4.5 63 6.5
Redland (C) 26,592 20.8 31,404 22.6
Richmond (S) 25 2.8 46 5.6
Rockhampton (R) 7565 7.5 10,097 9.2
Scenic Rim (R) 4558 13.9 5428 14.9
Somerset (R) 2087 11.2 2609 12.1
South Burnett (R) 2454 8.4 2908 9.4
Southern Downs (R) 2874 9.1 3348 9.9
Sunshine Coast (R) 49,977 18.1 60,780 19.8
Tablelands (R) 5990 14.6 6348 14.5
Toowoomba (R) 12,882 9.1 15,785 10.4
Torres (S) 36 1.1 239 7.3
Torres Strait Island (R) 9 0.2 16 0.4
Townsville (C) 17,990 11.6 23,182 13.3
Weipa (T) 283 10.0 361 10.8
Western Downs (R) 1398 4.9 2005 6.3
Whitsunday (R) 3826 13.0 4437 14.1
Winton (S) 66 4.8 72 5.4
Woorabinda (S) 0 0.0 3 0.3
Wujal Wujal (S) 0 0.0 0 0.0
Yarrabah (S) 0 0.0 0 0.0
(a) Census 2006 data have been concorded to latest local government area boundaries.
Source: ABS 2011 Census of Population and Housing
Source: ABS 2006 Census of Population and Housing, unpublished data (concorded by Queensland Treasury and Trade)
12

LGAs Local Government Area s(C) City (R) Regional Council (S) Shire (T) Town
Overseas-born persons by suburb, South East Queensland, 2011
There were 20 suburbs across the Brisbane area where more than 40% of the population was born overseas as shown in Table 4.
The Top 20 State Suburbs with highest proportion of people born overseas are shown in Table 4.
Table 4: Top 20 State Suburbs (ASGS 2011) with highest proportion of people born overseas (2011 Census usual residence counts)
1)Robertson Persons %
Population born overseas: 2747 56.4
Top overseas countries of birth: China (a) 612 12.6
Taiwan 467 9.6
India 261 5.4
Population speaking LOTE at home: 2672 54.9
Most common LOTE spoken at home: Mandarin 1145 23.5
2)Stretton Persons %
Population born overseas: 2248 55.2
Top overseas countries of birth: China (a) 289 7.1
Taiwan 284 7.0
New Zealand / Hong Kong 162 4.0
Population speaking LOTE at home: 2295 56.4
Most common LOTE spoken at home: Mandarin 657 16.1
3)Macgregor Persons %
Population born overseas: 3021 54.2
Top overseas countries of birth: China (a) 837 15.0
Taiwan 348 6.2
India 258 4.6
Population speaking LOTE at home: 2893 51.9
Most common LOTE spoken at home: Mandarin 1125 20.2
13

4)Sunnybank Persons %
Population born overseas: 4111 50.8
Top overseas countries of birth: China (a) 1217 15.0
Taiwan 578 7.1
India 280 3.5
Population speaking LOTE at home: 3846 47.5
Most common LOTE spoken at home: Mandarin 1653 20.4
5)Calamvale Persons %
Population born overseas: 7762 50.8
Top overseas countries of birth: China (a) 1266 8.3
New Zealand 791 5.2
Taiwan 562 3.7
Population speaking LOTE at home: 7098 46.4
Most common LOTE spoken at home: Mandarin 1999 13.1
6)Runcorn Persons %
Population born overseas: 7143 50.7
Top overseas countries of birth: China (a) 1290 9.2
India 667 4.7
New Zealand 557 4.0
Population speaking LOTE at home: 6546 46.5
Most common LOTE spoken at home: Mandarin 1900 13.5
7)Sunnybank Hills Persons %
Population born overseas: 8296 49.3
Top overseas countries of birth: China (a) 1765 10.5
Taiwan 1110 6.6
New Zealand 725 4.3
Population speaking LOTE at home: 7873 46.8
Most common LOTE spoken at home: Mandarin 2992 17.8
8)Brisbane City Persons %
14

Population born overseas: 3835 48.6
Top overseas countries of birth: South Korea 522 6.6
England 346 4.4
China (a) 308 3.9
Population speaking LOTE at home: 2739 34.7
Most common LOTE spoken at home: Mandarin 613 7.8
9)Eight Mile Plains Persons %
Population born overseas: 6495 48.5
Top overseas countries of birth: China (a) 1000 7.5
South Korea 789 5.9
Taiwan 573 4.3
Population speaking LOTE at home: 5993 44.8
Most common LOTE spoken at home: Mandarin 1597 11.9
10)Darra Persons %
Population born overseas: 1719 44.8
Top overseas countries of birth: Vietnam 605 15.8
New Zealand 130 3.4
India 110 2.9
Population speaking LOTE at home: 1865 48.6
Most common LOTE spoken at home: Vietnamese 889 23.2
11)South Brisbane Persons %
Population born overseas: 2388 44.1
Top overseas countries of birth: England 202 3.7
New Zealand 200 3.7
China (a) 177 3.3
Population speaking LOTE at home: 1714 31.6
Most common LOTE spoken at home: Mandarin 299 5.5
12)Kuraby Persons %
Population born overseas: 3412 43.9
15

Top overseas countries of birth: India 308 4.0
New Zealand 297 3.8
South Africa 270 3.5
Population speaking LOTE at home: 3184 41.0
Most common LOTE spoken at home: Mandarin 409 5.3
13)Richlands Persons %
Population born overseas: 882 42.5
Top overseas countries of birth: Vietnam 214 10.3
New Zealand 182 8.8
England 49 2.4
Population speaking LOTE at home: 845 40.7
Most common LOTE spoken at home: Vietnamese 357 17.2
14)Heathwood Persons %
Population born overseas: 766 42.1
Top overseas countries of birth: New Zealand 138 7.6
Vietnam 101 5.5
England 84 4.6
Population speaking LOTE at home: 597 32.8
Most common LOTE spoken at home: Vietnamese 165 9.1
15)St Lucia Persons %
Population born overseas: 4654 41.6
Top overseas countries of birth: China (a) 627 5.6
Malaysia 552 4.9
Singapore 459 4.1
Population speaking LOTE at home: 3440 30.7
Most common LOTE spoken at home: Mandarin 1105 9.9
16)Doolandella Persons %
Population born overseas: 1287 41.4
Top overseas countries of birth: Vietnam 369 11.9
16

New Zealand 172 5.5
India 88 2.8
Population speaking LOTE at home: 1364 43.9
Most common LOTE spoken at home: Vietnamese 605 19.5
17)Spring Hill Persons %
Population born overseas: 2165 41.2
Top overseas countries of birth: South Korea 207 3.9
India 200 3.8
New Zealand 187 3.6
Population speaking LOTE at home: 1496 28.4
Most common LOTE spoken at home: Spanish 176 3.3
18)Mount Ommaney Persons %
Population born overseas: 928 39.8
Top overseas countries of birth: England 106 4.5
Vietnam 80 3.4
Taiwan 78 3.3
Population speaking LOTE at home: 689 29.5
Most common LOTE spoken at home: Mandarin 150 6.4
19)Durack Persons %
Population born overseas: 2445 39.6
Top overseas countries of birth: Vietnam 884 14.3
New Zealand 239 3.9
England 199 3.2
Population speaking LOTE at home: 2487 40.3
Most common LOTE spoken at home: Vietnamese 1436 23.2
20)Logan Central Persons %
Population born overseas: 2440 39.5
Top overseas countries of birth: New Zealand 590 9.6
Burma 196 3.2
17

England 155 2.5
Population speaking LOTE at home: 1914 31.0
Most common LOTE spoken at home: Samoan 334 5.4
(a) Excludes Special Administrative Regions of Hong Kong and Macau, and Taiwan Province.
Source: ABS 2011 Census of Population and HousingNote: Population born overseas includes 'Australian External Territories', 'Inadequately described', and 'At sea'.
Note: Population speaking LOTE at home includes 'Inadequately described' and 'Non-verbal, so described'.
Note: All percentages are based on the 2011 Census usual resident population for each State Suburb.
AncestryAncestry, when used in conjunction with a person’s country of birth and their parent’s country of birth, provides a good indication of the ethnic background of first and second generation Australians.The ancestry data collected in the Census are a measure of self-identification of ethnic or cultural background and therefore provides a broad measure of cultural diversity.
The most common ancestries reported at the time of the 2011 Census in both Queensland and Australia were English, Australian and Irish, representing 85.5% of the Queensland population, higher than reported for the rest of Australia (74.1%) as shown in Table 5.
German, New Zealand and Maori ancestries were more common in Queensland compared with the rest of Australia, while Italian, Greek and Indian ancestries were more common in the rest of Australia, reflecting the different settlement patterns of these communities.
Table 5: Top 10 ancestries (a), Queensland and rest of Australia, 2011Queensland Rest of Australia
Ancestry(b) Number%
Population Ancestry(b) Number % Population
English1,629,46
3 37.6 English 5,609,070 32.7
Australian1,587,99
2 36.7 Australian 5,510,494 32.1Irish 484,929 11.2 Irish 1,602,829 9.3Scottish 421,004 9.7 Scottish 1,371,618 8.0German 270,890 6.3 Italian 799,858 4.7Italian 116,263 2.7 Chinese 771,360 4.5Chinese 94,848 2.2 German 627,784 3.7Dutch 69,217 1.6 Greek 350,583 2.0
18

New Zealander 60,621 1.4 Indian 344,753 2.0Maori 48,283 1.1 Dutch 266,276 1.6
(a) Respondents to the Census are asked to report up to two ancestries on the Census form; therefore, the percentages may sum to more than 100%.
(b) Based on 4-digit ancestry codes from the Australian Standard Classification of Cultural and Ethnic Groups (ASCCEG) Second Edition, Revision 1, 2011.
Source: ABS 2011 Census of Population and Housing.
Year of arrival in AustraliaResults from the 2011 Census show that of the 888,636 people born overseas living in Queensland, 40.8% had arrived in Australia prior to 1990, 14.2% arrived between 1990 and 1999 and 40.2% arrived between 2000 and 20113.The year of arrival in Australia of people born overseas varied considerably by country of birth. Of those Queensland residents born in England, 59.7% (107,162 people) arrived before 1990, 9.3% (16,689 people) arrived between 1990 and 1999, and 26.4% (47,386 people) arrived between 2000 and 2011. People born in New Zealand arrived in Australia more recently, with 33.9% (65,054 people) arriving before 1990, while 17.8% (34,110 people) arrived between 1991 and 1999, and 43.0% (82,613 people) arrived between 2000 and 2011.
Figure 4 shows the year of arrival for the top 10 source countries of birth for Queensland residents (after England and New Zealand). Year of arrival for people from Europe (Scotland, Germany and the Netherlands) is skewed heavily toward the period before 1990, with relatively few arrivals since 1991. In contrast, arrivals from South Africa, India and China have been much greater since 2000, compared with previous time periods.
Figure 4: Year of arrival, overseas-born Queenslanders by top 10 source birthplaces (excluding England and New Zealand), 2011
Arrived before 1990 Arrived 1991 to 1999
Arrived 2000 to 2011(a)
South Africa 5992 5509 23252India 3674 2271 23203Philippines 7823 6070 14444China(b) 3663 3458 18601Scotland 15700 2209 4956Germany 14456 1649 4078Vietnam 7221 3636 4456USA 5278 2419 7456Netherlands 11878 803 1818PNG 8465 1687 3450
(a) 1 January 2000 to 9 August 2011.
(b) Excludes Special Administrative Regions of Hong Kong and Macau, and Taiwan Province.
3 At the time of the 2011 Census, 41,819 (4.7%) Queensland usual residents who stated they were born overseas did not state their year of arrival in Australia. These people are included in Queensland’s total usual resident overseas-born population.
19

Source: ABS 2011 Census of Population and Housing.
Table 6 highlights the composition of overseas arrivals into Queensland over time by country of birth. The key point to note is the constancy of arrivals of people born in New Zealand and England. However, other major countries of birth have changed considerably over this time.
Table 6 Top 10 source birthplaces by year of arrival, overseas-born Queenslanders, 2011
Rank Before 1970 1970–1979 1980–1989 1990–1999 2000–2011(a)
1 England England New Zealand New Zealand New Zealand2 Germany New Zealand England England England3 Italy PNG Philippines Philippines South Africa4 Netherlands Scotland Vietnam South Africa India5 Scotland USA South Africa Taiwan China(b)
6 New Zealand Germany Scotland Vietnam Philippines7 Greece South Africa Germany China(b) South Korea8 Malta Vietnam Fiji Fiji USA9 Ireland Malaysia PNG Hong Kong(c) Japan10 PNG Ireland Malaysia Samoa Zimbabwe
(a) 1 January 2011 to 9 August 2011.
(b) Excludes Special Administrative Regions of Hong Kong and Macau, and Taiwan Province.
(c) Special Administrative Region of China.
Source: ABS 2011 Census of Population and Housing.
Arrivals before 1970 were dominated by people from European countries. During the 1970s, there was an increase in arrivals of people born in Papua New Guinea (following independence from Australia in 1975) and Vietnam (following the end of the Vietnam War). Arrivals of people born in these two countries, together with those from the United States, Germany, South Africa, Malaysia and Ireland, strongly underpinned the migration landscape of the 1970s.
Throughout the 1980s, there was a shift to arrivals of people born in the Philippines and Fiji. From the 1990s onwards there has been an increasing trend towards arrivals of people born in Asian and Pacific Island countries, together with a large number of arrivals of people born in South Africa, the United States of America and Zimbabwe.
Language other than English, and proficiency in spoken EnglishThe 2011 Census showed there were 423,838 Queensland residents who spoke a language other than English at home—9.8% of the population4. This was considerably lower than the proportion in the Northern Territory (26.7%), Victoria (23.1%) and New South Wales (22.5%).
4 At the time of the 2011 Census, 232,939 usual residents of Queensland did not state their language spoken at home.
20

In Queensland, 1.4% of residents spoke a language other than English at home and spoke English not well or not at all. This proportion was significantly lower than in Victoria and New South Wales (4.0% and 3.9% respectively) as shown in Table 10.
Table 7: Language other than English spoken at home by proficiency in spoken English, 2011
State or territory
Speaks Englishvery well or well
Speaks Englishnot well or not at all
Number % Population Number % PopulationNSW 1,285,078 18.6 271,689 3.9Vic. 1,023,923 19.1 212,634 4.0Qld 366,866 8.5 62,404 1.4SA 191,613 12.0 39,933 2.5WA 280,476 12.5 46,838 2.1Tas. 19,708 4.0 3249 0.7NT 46,981 22.2 10,394 4.9ACT 56,940 15.9 7825 2.2
Australia(a) 3,272,385 15.2 655,382 3.0
(a) Includes Other Territories.
Source: ABS 2011 Census of Population and Housing.
In 2011, the most common language other than English spoken at home in Queensland was Mandarin, followed by Cantonese and Vietnamese (compared with Mandarin, Italian and Arabic in the rest of Australia) as shown in Table 8.
Table 8: Top 10 languages other than English spoken at home, Queensland and rest of Australia, 2011Queensland Rest of AustraliaLanguage(a)
Number
% Population
Language(a)
Number
% Population
Mandarin 38,117 0.9 Mandarin298,29
3 1.7
Cantonese 22,258 0.5 Italian278,12
2 1.6Vietnamese 21,852 0.5 Arabic
275,754 1.6
Italian 21,711 0.5 Cantonese241,41
6 1.4
German 16,352 0.4 Greek240,81
6 1.4
Spanish 15,602 0.4Vietnamese
211,538 1.2
Hindi 13,188 0.3 Spanish101,89
6 0.6Japanese 13,086 0.3 Hindi 98,163 0.6Samoan 12,810 0.3 Tagalog 69,046 0.4
21

Korean 12,733 0.3Macedonian 67,653 0.4
(a) Based on 4-digit ancestry codes from the Australian Standard Classification of Cultural and Ethnic Groups (ASCCEG) Second Edition, Revision 1, 2011.
Source: ABS 2011 Census of Population and Housing.
9.8 % or 423,838 Queenslanders speak a language other than English at home.
Aboriginal people and Torres Strait Islander peopleAt the time of the 2011 Census, 155,824 people or 3.6% of Queensland’s residents identified as being either Aboriginal, Torres Strait Islander or Aboriginal and Torres Strait Islander. This figure represented 28.4% of Australia’s Aboriginal and Torres Strait Islander population of 548,370. Queensland had the second largest Aboriginal and Torres Strait Islander population after New South Wales (172,621).Nearly two-thirds (64%) of Australia’s Torres Strait Islander population and about a quarter (24.8%) of Australia’s Aboriginal population lived in Queensland at the time of the 2011 Census.
The majority (78.9%) of Indigenous Queenslanders identified as being Aboriginal, with a further 12.9% identifying as Torres Strait Islander and 8.2% identifying as being both Aboriginal and Torres Strait Islander.
In the five years to 2011, Queensland’s count of Aboriginal and Torres Strait Islander residents increased by 28,246 or 22.1%. This growth reflects natural population increase, improved data collection methods and the likelihood of people newly identifying their Aboriginal and Torres Strait Islander status in the Census.
Australian South Sea IslandersAt the time of the 2011 Census, there were 3093 Australian South Sea Islander residents in Queensland, compared with 944 in the rest of AustraliaWhile the number of Australian South Sea Islanders in Queensland increased by 41 people over the five years from the 2006 Census, the number in the rest of Australia decreased by 102 people. While Australian South Sea Islanders lived in 42 local government areas across Queensland, more than half (55.4%) lived in five areas only, including Mackay (R) (635 people), followed by Rockhampton (368 people) and Brisbane (C) (338 people) as shown in Table 9.
It is likely the Census significantly undercounted the Australian South Sea Islander population. The 1992 Call for Recognition report, published by the Human Rights and Equal Opportunity Commission, estimated there were 15,000 to 20,000 descendants of the original labourers in Australia, many with mixed ancestry and including some who do not identify as Australian South Sea
22

Islanders. The report estimated there were between 10,000 and 12,000 self-identified Australian South Sea Islanders Australia-wide5.
Table 9: Top five local government areas (LGA), Australian South Sea Islanders(a), Queensland, 2011
LGA Number% of Australian South Sea
Islander populationMackay (R) 635 20.5Rockhampton (R) 368 11.9Brisbane (C) 338 10.9Townsville (C) 189 6.1Cairns (R) 184 5.9Balance of Queensland 1379 44.6
(a) Based on 4-digit ancestry codes from the Australian Standard Classification of Cultural and Ethnic Groups (ASCCEG) Second Edition, Revision 1, 2011.
Source: ABS 2011 Census of Population and Housing.
ReligionIn the 2011 Census, the most common religious affiliation was Christianity (2,785,084 people or 64.3% of the total population), followed by Buddhism (1.5%), Islam (0.8%) and Hinduism (0.7%) as shown in Figure 5.While affiliates of religions other than Christianity remain a relatively small proportion (4.5%) of Queensland’s population, there has been significant growth in the number of people affiliated with some of these religions. Affiliates of Hinduism more than doubled from 14,058 in 2006 to 28,641 in 2011. Affiliates of Islam also grew by 67.5% to 34,047 people and Buddhism by 38.8% to 65,941 people over the same period.
There were 955,782 people (22.1% of the total population) with no religious affiliation, while 395,603 (9.1%) did not answer the question on religious affiliation (answering the census question on religious affiliation is optional).
68.8 % or 2,981,353 Queenslanders followed more than 100 religions.Figure 5: Religious affiliation, Queensland, 2011Religious affiliation Number %
Christianity2,785,08
464.
3Buddhism 65,941 1.5Islam 34,047 0.8Hinduism 28,641 0.7Judaism 4442 0.1
5 Human Rights and Equal Opportunity Commission. The call for recognition – a report on the situation of Australian South Sea Islanders. Canberra: Human Rights and Equal Opportunity Commission 1992.
23

Other religions 63,198 1.5
No religion 955,78222.
1Not stated 395,603 9.1
Note: Percentages in Table 13 have been rounded to the nearest 10. As a result of rounding, discrepancies may occur between sums of the component items and totals.
Source: ABS 2011 Census of Population and Housing.
Settler arrivalsSettler arrivals comprise:
holders of a permanent visa holders of a temporary (provisional) visa where there is a clear intention to
settle New Zealand citizens who indicate an intention to migrate permanently those who are otherwise eligible to settle (e.g. overseas-born children of
Australian citizens).
Over the 20 years to 2010–11, Queensland consistently received the third highest number of settler arrivals into Australia, after New South Wales and Victoria as shown in Figure 6.
While the number of settler arrivals to Queensland declined sharply from a peak of 33,029 in 2008–09 to 24,946 in 2009–10, the number increased slightly to 25,827 in 2010–11.
Figure 6: Settler arrivals, New South Wales, Victoria, Queensland and Western Australia(a), 1985-86 to 2010-11
Period Qld NSW Vic. WA
1985–86 11,772 36,760 23,848 11,572
1986-87 14,042 45,569 29,007 15,710
1987-88 20,988 57,286 35,050 20,054
1988-89 21,780 56,065 35,024 22,278
1989-90 15,922 47,153 31,788 17,512
1990–91 16,243 47,569 32,071 15,819
1991-92 15,189 44,066 27,547 11,712
1992-93 10,939 32,093 19,053 7928
1993-94 10,267 30,886 15,918 7743
1994-95 13,179 38,056 19,968 10,379
1995–96 15,284 44,327 22,269 11,318
1996-97 14,640 37,212 18,266 10,518
1997-98 15,095 31,694 16,233 9741
1998-99 16,028 35,141 17,291 10,672
1999-2000 17,286 39,311 19,319 11,512
24

2000–01 19,535 46,745 24,159 11,565
2001-02 15,825 35,301 21,374 10,954
2002-03 16,182 36,431 23,109 12,279
2003-04 20,284 40,561 28,028 15,411
2004-05 22,660 44,746 30,581 16,318
2005–06 24,862 44,661 32,297 17,638
2006-07 28,640 43,835 34,698 19,783
2007-08 32,496 43,520 37,213 22,738
2008-09 33,029 47,030 39,559 24,463
2009-10 24,946 42,267 36,725 20,976
2010-11 25,827 38,816 33,632 18,441
(a) Based on intended residence at time of arrival only. There can be no guarantee that the settler actually settled in the nominated state.
Source: DIAC, Settler Arrivals 2008–09 to 2010–11.
20.3 % of the national total settler arrivals were in Queensland in 2010–11.
Half (13,018) of all permanent arrivals to Queensland in 2010–11 were New Zealand citizens arriving under the Trans-Tasman Travel Arrangement, and indicated an intention to migrate permanently to Australia as shown in Table 10.The skill category provided the second largest source of settler arrivals to Queensland (5702 people) in 2010–11, followed by the family category (5364 people) and the humanitarian program (1354 people).
Over the two years from 2008–09 to 2010–11, there was a significant decrease in the number of migrants arriving under the skilled category, down from a peak of 10,810 in 2008–09 to 5702 in 2010–11, a decrease from 32.7% to 22.1% of all settler arrivals. There has also been a significant increase in the number of New Zealand citizens intending to settle in Queensland in recent years, up from 10,559 in 2005–06 to 13,018 in 2010–11, an increase from 42.5% to 50.4% of all settler arrivals.
Table 10: Settler arrivals (a) by eligibility category, Queensland (b), 2002-03 to 2010-11
Eligibility category
Year Family Skill Humanitarian
New Zealand
citizenOther(c) Total
Total permanent settlers2002–03 3453 5204 950 6331 244 16,182
25

2003–04 3893 7421 990 7681 299 20,2842004–05 4185 7243 1506 9443 283 22,6602005–06 4,511 8101 1432 10,559 259 24,8622006–07 4969 8899 1398 12,979 395 28,6402007–08 5054 10,132 976 15,973 361 32,4962008–09 5790 10,810 1159 14,890 380 33,0292009–10 5775 7963 1284 9608 316 24,9462010–11 5364 5702 1354 13,018 389 25,827
% of total permanent settlers2002–03 21.3 32.2 5.9 39.1 1.5 100.02003–04 19.2 36.6 4.9 37.9 1.5 100.02004–05 18.5 32.0 6.6 41.7 1.2 100.02005–06 18.1 32.6 5.8 42.5 1.0 100.02006–07 17.3 31.1 4.9 45.3 1.4 100.02007–08 15.6 31.2 3.0 49.2 1.1 100.02008–09 17.5 32.7 3.5 45.1 1.2 100.02009–10 23.2 31.9 5.1 38.5 1.3 100.02010–11 20.8 22.1 5.2 50.4 1.5 100.0
(a) Settler arrival statistics presented in this table are derived from passenger card and other data relating to overseas arrivals, where arriving persons have indicated an intention or legal entitlement to permanently settle in Australia. Not all persons intending to stay, or with legal entitlement to permanently stay, will actually do so. In addition, these data do not include those persons granted a permanent visa while residing in Australia.
(b) Based on Queensland as intended residence at time of arrival only. There can be no guarantee that the settler actually settled in Queensland.
(c) Includes the Special eligibility category made up of former citizens of Australia, former residents of Australia and family (dependents) of New Zealand Citizens, and other non-program migration which refers primarily to the arrival in Australia of children born to Australian citizens overseas. It also includes residents of Cocos (Keeling) Islands, Norfolk Island and persons granted Australian citizenship overseas.
Source: DIAC Settler arrivals, 2010–2011, and Immigration Update, 2002–2003 to 2010–2011.
Table 11 shows the country of birth of settler arrivals by migration stream for people residing in Queensland who arrived in Australia in 2010–11. Both the skilled and family categories included people born in China, India, the Philippines, South Africa and the United Kingdom.
The top 10 countries of birth in the humanitarian category reflect those countries at the centre of recent global conflicts, such as Afghanistan, Iran and Iraq, as well as a number of Asian nations, including Burma, Laos, Thailand and Bhutan. The Democratic Republic of Congo and Somalia also make the top 11.
Table 11: Settler arrivals (a), top 10 countries of birth by migration stream (b), Queensland (c), 2010–11 (d)
Skilled Family Humanitarian
Country of birth
Number
Country of birth
Number
Country of birth
Number
United Kingdom 1470 United Kingdom 846 Afghanistan 228
India 1469 China(e) 676 Iran 182
26

Philippines 1019 Philippines 641 Burma 146
South Africa 1001 India 391 Laos 141
China(e) 845 Thailand 369 Bhutan 113
South Korea 435 Vietnam 297 Iraq 112
Australia 425 United States of America 294
Congo, Democratic Republic of
95
Ireland 354 South Africa 229 Thailand 72
Sri Lanka 272 Japan 191 Nepal 72
New Zealand 245 Canada 180 Somalia 70
Total(f) 11,328 Total(f) 6997 Total(f) 1818
(a) Settler arrival statistics presented in this table are derived from various departmental systems used to process migration applications both in Australia and overseas and external sources including Medicare Australia. It should be noted that not all persons intending to permanently stay, or with legal entitlement to permanently stay, will actually do so. (b) Excludes persons in the non-program migration category, such as New Zealand citizens who indicate an intention to migrate permanently and those who are otherwise eligible to settle (e.g. overseas-born children of Australian citizens). (c) State of residence. The numbers of migrants in this location may not be an accurate reflection of all current residents due to limitations in the collection of residential information. (d) Arrival date. For migrants granted a permanent visa while residing in Australia, ‘arrival date’ refers to the arrival date entry prior to permanent visa grant. For those granted a permanent visa while outside of Australia, ‘arrival date’ refers to their next date of entry into Australia after the visa grant. (e) Excludes Special Administrative Regions of Hong Kong and Macau, and Taiwan Province.
(f) Includes other countries of birth.
Source: DIAC Settlement Database (extracted 30 July 2012). This database is updated on the 4th of each month, and the figures presented in this table were current at the time of extraction only and contains the following records:
Permanent visas issued and arrivals of visaed settlers processed overseas. Permanent residence grants processed in Australia.
Temporary entrantsAt 30 June 2011, there were 145,160 temporary entrants nominating Queensland as their intended primary place of residence as shown in Table 12.Of these, one-third (49,110) were students and a further 20.5% were visitors. These categories were followed by working holiday makers (15.3%) and business (long stay) visa holders (15.2%).
The top 10 source countries for temporary entrants intending to reside in Queensland include India (11.7%), followed by United Kingdom (10.9%), China (9.1%), South Korea (8.7%) and the United States (5.0%).
Table 12 Stock of temporary entrants(a) by visa type and top 10 countries of citizenship, Queensland(b), 30 June 2011
Number% temporary
entrantsVisa type
Student(c) 49,110 33.8
27

Visitor 29,830 20.5Working Holiday Maker 22,280 15.3Business (Long stay) 22,000 15.2Other 21,940 15.1Total 145,160 100.0
Country of citizenshipIndia 17,000 11.7United Kingdom 15,750 10.9China(d) 13,140 9.1South Korea 12,630 8.7USA 7270 5.0Japan 6890 4.7Taiwan 5660 3.9Philippines 4570 3.1Ireland 4420 3.0Canada 3890 2.7
a) Notes on temporary entrant stock data: these data exclude all provisional and selected other (e.g. humanitarian) visa subclasses; revised data are based on latest visa in effect and may not be consistent with data based on latest visa granted; unlawful stay cases excluded. (b) State of intended residence. (c) Student includes student guardian. (d) Excludes Special Administrative Regions of Hong Kong and Macau, and Taiwan Province.
Note: Numbers are rounded to the nearest 10. Table components may not sum consistently to totals due to rounding.
Source: DIAC, unpublished data (received 9 August 2011).
Copyright
© The State of Queensland (Department of Aboriginal and Torres Strait Islander and Multicultural Affairs) December 2012.
Licence
This document is licensed by the State of Queensland (Department of Aboriginal and Torres Strait Islander and Multicultural Affairs) under a Creative Commons Attribution (CC BY) 3.0 Australia licence. To view a copy of this licence, visit http://creativecommons.org/licenses/by/3.0/au/deed.en.
In essence, you are free to copy, communicate and adapt this information as long as you attribute the work to the State of Queensland (Department of Aboriginal and Torres Strait Islander and Multicultural Affairs) and abide by the other licence terms.
Diversity Figures 2011 is a joint project of the Department of Aboriginal and Torres Strait Islander and Multicultural Affairs and Queensland Treasury and Trade. For more information please contact Government Statistician , Queensland Treasury and Trade on (07) 3035 6418. Information about Queensland’s diversity is also outlined in the Diversity Figures snapshot available from Multicultural Affairs Queensland at www.multicultural.qld.gov.au.
This document uses data primarily from the Australian Bureau of Statistics (ABS) 2011 Census of Population and Housing and the Department of Immigration and Citizenship (DIAC) to provide a snapshot of the geographical distribution of Queensland’s diverse population. The Census data are on a usual residence basis, which is where people usually live rather than the place where they were counted on Census night. There were 251,987 people who were usual residents of Queensland who did not state their birthplace at the time of the 2011 Census. These people are included in Queensland’s total usual resident population when calculating the percentage of Queenslanders born overseas. The boundaries shown are based on the ABS 2011 Australian Statistical Geography Standard (ASGS).
28