diversity in estimates of the impact of intellectual
TRANSCRIPT

Diversity in Estimates of the Impact of Intellectual Capital on
Firm Performance Created by Varied Adoptions of VAIC Method
Sampath Kehelwalatennaa , Gamini Premaratneb
aDepartment of Accounting, University of Colombo, Sri Lanka
bUBD School of Business and Economics, Universiti Brunei Darussalam, Brunei
Abstract
Value Added Intellectual Coefficient (VAIC) method has become the most efficient
method for measuring intellectual capital (IC). However, there are inconsistencies in the
mechanism of adopting the VAIC method to measure IC, thus questioning the robustness of
established relationships between IC and firm performance. Therefore, this study attempts to
examine the diversity in estimates of the impact of IC on firm performance as a result of
adopting the VAIC method in a diverse manner. The study also proposes a modification to the
basic VAIC method to eliminate its key limitation. Findings of the study indicate that there are
differences in the estimates of the impact of IC on firm performance as a result of varied VAIC
adoptions. The proposed modification to the basic VAIC method incorporates theoretically
agreed value compositions of IC (human capital, structural capital and relational capital)
replacing traditional value compositions (human capital and structural capital) in the basic
VAIC method.
Keywords: Firm Performance, Intellectual Capital, Measuring Intellectual Capital, VAIC
Received:
25 February 2019
Accepted revised version:
16 May 2019
Published:
30 June 2019
Suggested citation: Kehelwalatenna, S. & Premaratne, G. (2019). Diversity in estimates
of the impact of intellectual capital on firm performance created by varied adoptions of
VAIC method. Colombo Business Journal, (10)1, 66-113.
DOI: http://doi.org/10.4038/cbj.v10i1.43
© 2019 The Authors. This work is licenced under a Creative Commons Attribution 4.0
International Licence which permits unrestricted use, distribution, and reproduction in
any medium, provided the original work is properly cited.
[email protected] https://orcid.org/0000-0001-5702-2364
Faculty of
Management & Finance
University of Colombo
Colombo
Business
Journal
International Journal of
Theory & Practice
Vol. 10, No. 01, June, 2019
Kehelwalatenna & Premaratne
67
Introduction
In the present global economy, intellectual capital (IC) is progressively being
acknowledged as a vital constituent of organisational value (Alhassan & Asare,
2016). The impetus for this awareness is a sequence of challenges in the knowledge-
based corporate setting that motivates firms to invest in IC, given that it has become
a key driver of productivity (Goh & Lim, 2004). IC represents the knowledge,
experience, intellectual property, and information that can be put to use to create
wealth. In many instances, IC appears to be vital for decision making both within the
firm and external stakeholders (Alhassan & Asare, 2016). Novel theories of strategic
management such as the Resource-based View, the Competencies and Capabilities-
based View and the Knowledge-based View of the firm are improving the
understanding of the nature and importance of IC as a strategic resource (Bontis,
Janosevic, & Dzenopoljac, 2015). As a result of a higher IC recognition, researchers
are also keen to assess its impact on companies’ business performance (Morariu,
2014). Regarding this, past studies (i.e. Hasan, Mohammad, & Alam, 2017; Linda,
Rasyid, & Megwati, 2017; Soetanto & Liem, in press) have found that IC helps in
creating competitive advantages and superior performance for modern business
organisations in a sustainable manner.
A paramount challenge confronted by IC practitioners and researchers is
identifying the value of IC accurately. According to Zeghal and Maaloul (2010), the
intangible nature of IC creates difficulties to measure it. Likewise, Abdulsalam, Al-
Qaheri, and Al-Khayyat (2011) and Zhicheng, Zhuoer, Shing, and Wah (2016) state
that finding an appropriate and universally accepted measuring technique for IC is
still difficult. Chen, Cheng, and Hwang (2005), Nazari and Herremans (2007) and
Tan, Plowman, and Hancock (2007) have emphasised that IC measures are still in an
exploratory stage and a coherent measuring technique for IC has not been formulated
yet. However, the Value Added Intellectual Coefficient (VAIC) method has gained
recognition as the most efficient (Chan, 2009), and widely adopted (Zhicheng et al.,
2016; Yilmaz & Acar, 2018) measure amongst an array of measures (see Table 1)
available to value IC.
Resource-based scholars contend that firm level factors account for a greater
variance in firm performance than industry or country level factors (Hansen &
Wernerfelt, 1989; Rumelt, 1991 as cited in Moon & Lado, 2000). Resource-based
View equals an organisation to the resources it owns, and resources are divided into
two categories as tangible and intangible. Researchers have attempted to establish the
relationship between IC and performance of the firm by assuming that firm

Colombo Business Journal 10(1), 2019
68
performance is a function of hard-to-copy, firm-specific and idiosyncratic resources.
A significant number of such research work have reported a positive relationship
between IC and firm performance (for example, Bontis, Keow & Richardson, 2000;
Bornemann, 1999; Calisir, Gumussoy, Bayraktaroglu & Deniz, 2010; Chu, Chan, &
Wu, 2011; Clarke, Seng, & Whiting, 2011; Dumay & Tull, 2007; Ghosh & Mondal,
2009; Ghosh & Wu, 2007; Yalama & Coskun, 2007; Zeghal & Maaloul, 2010). In
contrast to the above positive relationship, Firer and Williams (2003), Kamath (2008),
Maditinos, Chatzoudes, Tsairidis, and Theriou (2011), Mehralian, Rajabzadeh,
Sadeh, and Rasekh (2012) and Stahle, Stahle, and Aho (2011) have documented that
IC does not have a significant impact on performance. Parallel to reporting mixed
results as highlighted above, the inherited contextual differences (i.e., social, political,
cultural and technical) in diverse settings have been identified as reasons for such
mixed results (Abeysekera, 2007; Firer & Williams, 2003; Marr, Schiuma, & Neely,
2004). In addition to the said contextual differences, the present study presumes that
varied applications of the VAIC method to measure IC might have been partially
responsible for the reported mixed results.
A closer observation of existing literature on VAIC method reveals that there are
inconsistencies in the mechanism of adopting it to measure IC. Consequently, these
inconsistencies may pose questions on the robustness of findings presented in past
studies that used the VAIC method. This is applicable specially to the areas of
comparing IC values and established associations between IC and firm performance.
Moreover, it is evident that there is a number of underlying limitations of using the
VAIC method, as highlighted in the IC literature. Although it is natural to have
limitations in any measure, including the measures available to compute IC, they
undoubtedly affect the reliability of findings of empirical studies. Considering the
issues of inconsistencies in adopting the VAIC method and existence of limitations of
the VAIC method highlighted in the extant IC literature, this paper develops the
following research objectives:
1. To examine the diversity in estimates of the impact of IC on firm
performance created by varied adoptions of VAIC method; and
2. To propose a modification to the existing approach of measuring IC in
the VAIC method.
Continuation of the paper henceforth is organised as follows. A review of past
studies on methods of measuring IC, studies which adopted the VAIC method to
measure IC, and studies that highlighted limitations of the method is conducted next.
This is followed by an explanation of the methodological concerns of the study. Then

Kehelwalatenna & Premaratne
69
empirical results of the analysis are presented, followed by the discussion and
conclusion.
Literature Review
Methods of Measuring IC
Methods of measuring IC are still evolving (Tan et al., 2007) and a single most
appropriate measure for IC has not been identified yet. There are two groups of
researchers, namely, cost group and value group attempt to measure IC. Cost group
captures the intellectual essence through the difference between market and book
value of the firm. This group uses the market-to-book value ratio as an effective
yardstick to value IC. The value group mainly uses the VAIC method.
Various methods have been applied to measure IC, and such measures include
traditional financial measures (i.e. Tobin’s q), recently developed non-financial
performance measures (i.e. Balanced Scorecard) and the latest models (i.e. VAIC
method) (Kamath, 2007). However, Komnenic and Pokrajcic (2012) state that none
of the existing measures can fully meet the qualitative criteria or fulfil all the needs
of users. In early 1990s, various frameworks were developed to measure the
performance of a firm by overcoming weaknesses of financial measures that were
used to measure performance of firms (Bourne, Mills, Wilcox, Neely, & Platts, 2000).
This initiation emerged because of the greater focus on intangible resources (Amir &
Lev, 1996). Although a few measures had been developed during the 1990s the lack
of proper measures to measure IC can be observed even in the beginning of the 21st
century (Guthrie, Petty, & Johanson, 2001). Furthermore, they have emphasised the
necessity of developing new measures to measure IC for organisations where
traditional accounting practices are not competent enough to identify and measure
intangibles. Among the formulated methods, Intangible Assets Monitor (Dorweiler
& Yakhou, 2005) and Skandia Navigator (Sveiby, 1997) were developed specifically
for recognising the IC of firms (Tayles, Pike, & Sofian, 2007). Even though the
Balanced Scorecard (Kaplan & Norton, 2004), another method of valuing IC, had
been able to incorporate relational, structural and human capital perspectives with the
financial perspective, it can be argued that the Balanced Scorecard has not been used
to measure the IC of a firm singularly because it has more strategic focus. Moreover,
Abeysekera (2003) and Dzinkowski (2000) have recommended using measures such
as market-to-book value, intangible value and knowledge capital to assess IC.
Similarly, Lev (2001) has emphasised that the Value Chain Scoreboard is a vital tool
for managers and investors to measure the impact of intangibles on corporate

Colombo Business Journal 10(1), 2019
70
performance and valuation. Tan et al. (2007) list out the available IC measures,
including the afore-mentioned measures, as presented in Table 1.
Table 1: IC Measures
Key non-dollar valuation
of IC
Key dollar valuation
of IC
Other methods from
accounting bodies and
practitioners
• The Balanced Scorecard
• Technology Broker
Method
• Skandia IC Report
Method
• IC Index
• Intangible Asset Monitor
Approach
• Heuristic Frame
• Vital Sign Scorecard
• Ernst and Young Model
• EVA and MVA Model
• Market-to-book Value
Model
• Tobin’s q Method
• Pulic’s VAICTM Model
• Calculated Intangible
Value
• Knowledge Capital
Earnings Model
• Human Resource Costing
and Accounting
• Accounting for Future
• Total Value Creation
• The Value ExplorerTM
and Weightless Weights
Source: Tan et al. (2007)
Diversity in inherent merits of each IC measure ensures their survival and their
demerits however create cautions for researchers in selecting a suitable measure for
their studies. In reviewing the three categories in Table 1, the major criticism against
non-dollar measures is that the data used to calculate those measures are subjective
to the necessities of the firm and mostly unavailable in audited financial statements
(Roos, Roos, Dragonetti & Edvinsson, 1997). Lack of standardisation could be a
probable challenge for non-dollar measures, especially, in respect to statutory
reporting (Andriessen, 2004; Bontis, 2001). Consequently, according to Firer and
Williams (2003), the above-specified limitation of non-dollar measures restricts the
comparison of results among other firms. Furthermore, the lack of awareness on the
contextual differences when developing measures and the questions related to the
external validity of a study, which adopts an existing IC measure can also be cited as
criticisms against the available IC measures. The remainder of this section details out
ten quantitative IC measures.
Market-to-book Value Method/Market or Value Based Approach (MBM)
This approach is the simplest way of calculating IC. Further, the MBM could be
identified as the most frequently used IC measure (Dzinkowski, 2000). According to
Housel and Nelson (2005) the MBM captures the difference between stock market
value of the firm and the net value of its assets. Stock market value is the market price
per share multiplied by number of issued shares. Book value is the net value of firm’s

Kehelwalatenna & Premaratne
71
assets (net of depreciation). However, it is unclear whether opening balance sheet
values, closing balance sheet values or average values should be used in applying this
method to compute IC. According to Dzinkowski (2000), the main advantages of this
measure are that it is easy to calculate and can be compared with other measures. It
is directly related to the widely used operational definition for IC that IC is the
difference between market-value and book-value (Goebel, 2015; Tseng, Lin, & Yen,
2015). However, Dumay (2012) and Housel and Nelson (2005) have identified the
following inherited limitations of the method:
• share price is determined not only by tangible and intangible assets of the
firm, and many other external factors can influence it;
• book value is the net of depreciation and it does not represent the revenue
generation amount;
• many of the tangible assets recorded on the balance sheet are much lower
than their current market value;
• it measures IC as a whole and does not measure IC components or elements;
• the current financial accounting model does not attempt to value a firm in its
entirety though the market values a firm in its entirety;
• difference between market and book value of the firm cannot entirely be
attributed to IC due to anomalies in historical cost accounting for assets; and
• continual fluctuation of share prices distorts the value of IC.
Knowledge Capital Earnings Method/Residual Income Method (KCE Method)
Lev (2001) and Wall, Kirk, and Martin (2004) have elaborated that KCE method
involves the following steps to compute knowledge capital earnings:
Step 1: Find the average annual earnings of a company. It suggests using three
years of actual earnings, and three years of forecasted earnings by the
financial analysts to compute normalised earnings.
Step 2: Identify financial assets reported on the balance sheet and then compute
the expected after tax return on financial assets.
Step 3: Turn to physical assets and take average after tax return for physical
assets.
Step 4: Take the total of return on financial assets and the return of physical
assets to be deducted from normalised earnings to find out knowledge
capital earnings.
Step 5: Knowledge capital earnings should be deducted from the expected rate of
return on knowledge assets. Expected rate of return on knowledge assets
(intellectual asset discount rate) is determined by taking the correlation
between IC earnings and equity returns.
Colombo Business Journal 10(1), 2019
72
According to Housel and Nelson (2005) and Wall et al. (2004), the main
advantage of this method is the use of both earnings and assets to compute IC rather
than totally relying on assets. However, the same authors have identified certain
limitations of the method such as choice of expected return on assets being somewhat
arbitrary, the model not identifying the value derived from individual components of
IC, and the uncertainty whether IC can be valued merely as residual assets because
Resource-based View shows that IC is embedded in competitive advantages.
Economic Value Addition (EVA) and Market Value Addition (MVA) Methods
Bontis (2001) has mentioned that EVA concentrates on maximising incremental
earnings over capital costs. MVA represents the spread between the cash that firm’s
investors have to put into the business since the establishment of the company and
the present value of the cash that they can earn by selling their shares (Bontis, 2001).
In another way, the difference between the firm’s total value and the total capital that
the investors have invested in is called the MVA. Further, EVA is intended to offer
improvements to the market value added calculation and EVA can be used as a
surrogate measure for the stock of IC assuming that the effective management of
knowledge assets increases EVA (Bontis, 2001). The computation of EVA can be
summarised under two options:
Option 1: 𝐸𝑉𝐴 = Net sales – operating expenses – taxes – capital charges
Capital charges = Weighted average cost of capital (𝑊𝐴𝐶𝐶) x Total
capital invested
Option 2: 𝐸𝑉𝐴 = Profit after tax (𝑃𝐴𝑇) – 𝑊𝐴𝐶𝐶 x Total capital invested
where, 𝑊𝐴𝐶𝐶 = Cost of debts (𝑘𝑑) + Cost of equity capital (𝑘𝑒)
𝑘𝑑 = Interest x (1-t) / Total debts
𝑘𝑒 = 𝑅𝑓 + 𝛽(𝑅𝑚 − 𝑅𝑓)
𝑅𝑓 = Risk free rate (10-year treasury bill rate is used in the present study)
𝑅𝑚 = Expected market return
𝛽 = Market risk
t = Tax rate
Total capital invested = Share capital + Debt capital
As advantages Bontis (2001) has stated that EVA method has received widespread
acceptance among the financial community. Further, the author has mentioned that
MVA can represent the market assessment of the net present value of a company’s

Kehelwalatenna & Premaratne
73
current and contemplated capital investment projects. As such, MVA is a significant
summary assessment of corporate performance. According to Bontis (2001), MVA is
gains and losses accruing from historic activities when aggregated on a one-to-one
basis with last year’s results plus today’s moods as they are shown in the marketplace.
Moreover, Bontis (2001) has identified three limitations of EVA. They are; the use of
book assets relies on historical costs in which current market or replacement value is
not represented, empirical research has not conclusively shown that EVA is a better
predictor of stock price or its variation, and the starting point for EVA analysis
assumes that companies should be run in the interest of shareholders exclusively.
Calculated Intangible Value (CIV)
This approach computes the fair market value of intangible assets. In other words,
the method calculates the excess return on hard assets. Briefly, the method uses a
three-year period for averaging the pre-tax earnings and tangible assets to calculate
company’s return on assets, which is then compared with the industry average
(Abeysekera, 2007). The CIV involves the following detailed process in computing
intangible values:
• Calculate average pre-tax earnings for the past three years.
• Take the average year-end tangible assets for the same three years.
• Divide earnings by assets to compute return on assets (ROA).
• Find industry average ROA.
• Compute excess return using the equation: Excess return = (Industry average
ROA x average company tangible assets) – pre-tax earnings.
• Find the three-year average income by multiplying excess return by tax-rate.
• Determine IC as the present value of the premium above. Present value
percentage is the cost of capital of the company.
This method is based on the assumption that a company’s premium earnings
(when earnings are greater than those of an average company within the industry) are
a result of IC in the company. This further implies that a company can reach only an
average level of earnings by utilising tangible assets and that IC generates the
premium. The CIV facilitates inter-company and industry comparisons. The method
also uses data on financial statements to ensure the reliability and consistency of inter-
company and industry comparisons. However, Abeysekera (2003) argues that the
usage of average but not the actual return on assets to determine excess return on
assets, and company’s cost of capital dictates the net present value of intangible
assets. In addition to the above limitation, the fact that average ROA is susceptible to

Colombo Business Journal 10(1), 2019
74
outlier effects, the inability to evaluate individual elements of IC and the question of
how IC can be separated from goodwill remained as disadvantages of CIV.
Tobin’s q Ratio
Tobin’s q ratio is another proxy measure to assess IC. According to Dzinkowski
(2000), Tobin’s q is one of the most suitable methods to assess the relevance of IC of
firms within the same industry and is computed over a period of several years.
Usually, the replacement cost is necessary to compute the Tobin’s q. Tobin’s q
accounts for both past and expected future performances of the firm (Hejazi,
Ghanbari, & Alipour, 2016). However, the difficulty of estimating the information
needed to calculate the Tobin’s q stands as the main limitation (Ghosh & Wu, 2007).
The ratio identifies the difference between the market value of the firm and the
replacement cost of its tangible assets. A widely used proxy for the q ratio is the
excess of market value of a firm over the accounting book value of its tangible assets.
According to Chung and Pruitt (1994) and Housel and Nelson (2005), the q ratio is
calculated as follows:
𝑇𝑜𝑏𝑖𝑛′𝑠 𝑞
= [(𝑀𝑉 𝑜𝑓 𝐶𝑆) + (𝐵𝑉 𝑜𝑓 𝑃𝑆) + (𝐵𝑉 𝑜𝑓 𝑆𝑇𝐿) + (𝐵𝑉 𝑜𝑓 𝐿𝑇𝐿) − (𝐵𝑉 𝑜𝑓 𝑆𝑇𝐴)]
𝐵𝑉 𝑜𝑓 𝑇𝐴
where, MV is market value, CS is common stock, BV is book value, PS is preferred
stock, STL is short-term liabilities, LTL is long-term liabilities, STA is short-term
assets and TA is total assets. Although the q ratio assists IC practitioners to assess the
IC of firms, the usage of this method is limited because it was developed in the
industrial era. Therefore, its applicability in the knowledge economy is questionable
as the former economy placed more importance on physical assets and the latter has
both physical and knowledge assets (Abeysekera, 2003). Apart from the difficulty of
estimating the replacement cost of intangible assets, in practice, this model suffers
from the inability to value the individual components of IC separately.
Return on Assets Method (ROA Method)
According to Rodov and Leliaert (2002), the ROA of a particular firm is calculated
using the following equation:
𝑅𝑂𝐴 = 𝐴𝑣𝑒𝑟𝑎𝑔𝑒 𝑒𝑎𝑟𝑛𝑖𝑛𝑔𝑠 𝑜𝑓 𝑎 𝑐𝑜𝑚𝑝𝑎𝑛𝑦 𝑜𝑣𝑒𝑟 𝑡ℎ𝑟𝑒𝑒 𝑡𝑜 𝑓𝑖𝑣𝑒 𝑦𝑒𝑎𝑟𝑠
𝐴𝑣𝑒𝑟𝑎𝑔𝑒 𝑡𝑎𝑛𝑔𝑖𝑏𝑙𝑒 𝑎𝑠𝑠𝑒𝑡𝑠 𝑜𝑣𝑒𝑟 𝑡ℎ𝑒 𝑠𝑎𝑚𝑒 𝑝𝑒𝑟𝑖𝑜𝑑
Kehelwalatenna & Premaratne
75
Then, ROA of the firm is compared with the industry average to identify the
difference. If the ratio is zero or negative, the company is considered as not having
excess IC. If it is positive, the excess is multiplied by the company’s average tangible
assets to calculate the average annual excess earnings. Eventually, the excess earning
of the firm is divided by the average cost of capital to estimate the value of IC.
Market Capitalisation Method (MCM)
MCM recognises IC as the excess of a company’s market capitalisation over its
stockholders’ equity (Chan, 2009). The MCM is based on the capital market premium
and share price quotations. In order to calculate MCM accurately, historical financial
statements must be adjusted to reflect the effects of inflation or replacement costs
(Wall et al., 2004). One limitation of this approach is that it does not easily assist
managers to get a comprehensive understanding of the IC (Andriessen, 2004; Bontis,
2001; Guthrie et al., 2001).
Knowledge Capital Valuation Method (KC Method)
According to Wall et al. (2004), KC method uses economic profits (financial
capital rental) as a basis to compute knowledge capital. Then, the method identifies
the difference between profits and financial capital rental before dividing it by the
interest of long-term debts.
Intellectual Capital Formula
El-Tawy and Tollington (2010) have adopted this formula to compute IC. The
following formula is used to calculate the intellectual assets (IA) of a firm:
𝐼𝐴 = ∑ 𝑋
𝑛
𝑖=0
(1 − 𝑟)𝑖 ∗ 𝐶𝐹
where, X is first year sale, n is expected life of the product (in years or months), r is
a suitable discount rate, CF is the contribution proportion that the new idea had in
terms of the ultimate success of the product (a number between 1 – 0). A major
limitation of this technique could be the subjective nature of the estimates of r, n and
CF values.
Discounted Residual Income Approach (DRI)
As long as earnings and book value of the firm are forecasted in a manner
consistent with clean surplus accounting, the value of a rational firm can be measured
by the sum of firm’s book value and the present value of the expected future residual
Colombo Business Journal 10(1), 2019
76
income (Ohlson, 1995). Frankel and Lee (1998) have restated the above argument as
added infinite sum of discounted residual income to the reported book value as
follows:
𝐹𝑉𝑡 = 𝐵𝑉𝑡 + ∑ 𝐸𝑡
∞
𝑖=1
[𝑁𝐼𝑡+1 − (𝑅𝑒𝐵𝑉𝑡+𝑖−1)]/(1 + 𝑅𝑒)𝑖
𝐹𝑉𝑡 = 𝐵𝑉𝑡 + ∑ 𝐸𝑡
∞
𝑖=1
[(𝑅𝑂𝐸𝑡+1 − 𝑅𝑒) 𝐵𝑉𝑡+𝑖−1]/(1 + 𝑅𝑒)𝑖
where, 𝐹𝑉𝑡= present value at time t; 𝐵𝑉𝑡 = book value at time t; 𝐸𝑡 = expected future
residual income; 𝑁𝐼𝑡+1 = net income for period; 𝑅𝑒 = cost of equity capital; 𝐵𝑉𝑡+𝑖−1
= book value at t+i-1;and 𝑅𝑂𝐸𝑡+1 = after tax return on book equity for period t+1.
The above model is used to measure the present value of the future discounted
cash flows, which are not captured in the current book value and 𝑅𝑒 is against
financial theory (Tsai & Hua, 2006). Therefore, Tsai and Hua (2006) replaced WACC
in the place of 𝑅𝑒 and adopted the following model to measure IC:
𝐼𝐶𝑡 = ∑ 1
∞
𝑖=1
𝐸𝑡[(𝑅𝑂𝐸𝑡+1 − 𝑅𝑒) 𝐵𝑉𝑡+𝑖−1]/(1 + 𝑅𝑒)𝑖
(1 + 𝑊𝐴𝐶𝐶)𝑖× [
1
2(𝐵𝑉𝑡−1 + 𝐵𝑉𝑡)]
Finally, 𝐼𝐶𝑡 = (𝑅𝑂𝐸− 𝑅𝑒)
𝑊𝐴𝐶𝐶× [
1
2(𝐵𝑉𝑡−1 + 𝐵𝑉𝑡)]
where, 𝐼𝐶𝑡 = firm’s IC; 𝑅𝑂𝐸 = weighted average after tax return on book value of
equity in last five years (previous five quarters in this study) on the weights of 1,2,3,4,
and 5 from first year to last year (first to last quarter in this study); 𝑅𝑒 = Cost of
capital based on the capital assets pricing model (CAPM); 𝑊𝐴𝐶𝐶 = weighted average
cost of capital; 𝐵𝑉𝑡 = book value at time t; and 𝐵𝑉𝑡−1 = book value at time t-1.
Further, 𝑊𝐴𝐶𝐶 = 𝑊𝑑 × 𝑅𝑑(1-t) +𝑊𝑒 × 𝑅𝑒; where 𝑊𝑑 is debt capital to total
capital ratio, 𝑅𝑑 is interest rate, t is tax rate, 𝑊𝑒 is equity capital to total capital ratio,
and 𝑅𝑒 = 𝑅𝑓 + 𝛽 (𝑅𝑚 − 𝑅𝑓).

Kehelwalatenna & Premaratne
77
In addition to the discussed approaches to measure IC thus far, several researchers
have adopted some other proxy measures to compute IC. For example, Riahi-
Belkaoui (2003) has used both trademarks and/or patents as a proxy measure for IC.
Riahi-Belkaoui has initially taken the number of applications for trademark protection
in each sample firm for ten years. Then the difference between the total trademarks
of the sample firms and the median number of trademarks of the total sample was
taken to represent IC. Additionally, Al-Twaijry (2009) has selected investments on
intangible assets as a proxy variable for IC.
VAIC Method
Ante Pulic at The Austrian Intellectual Capital Research Centre first developed
the VAIC method with the intention of measuring IC of firms. The method is known
as a “universal indicator that shows abilities of a company in value creation, and it
represents as a measure for business efficiency in the knowledge-based economy”
(Pulic, 1998b, p. 9). Among the available IC measures, the VAIC method is being used
widely in business and academic applications (Chan, 2009; Chen et al., 2005; Firer
& Williams, 2003; Pulic, 1998a, 2000a; Shiu, 2006). According to Kujansivu and
Lonnqvist (2007), the method is based on the assumption of measuring and
developing the value addition of a company. Tan et al. (2007) explain that the VAIC
method was designed to provide value creation information on both tangible and
intangible assets. Furthermore, the VAIC method measures the performance of IC and
physical assets of the firm (Mavridis, 2005). Hence, this method facilitates computing
and comparing the level of efficiency of IC and physical capital among firms.
Majority of research work that was conducted with the purpose of establishing the
relationship between IC and firm performance has frequently adopted the VAIC
method to compute IC. According to Zeghal and Maaloul (2010), the VAIC method is
still in the early stages of its application in management accounting practices and it
needs to be empirically validated with a large number of companies. However, many
researchers (such as Chan, 2009; Chen et al., 2005; Kamath, 2007, 2008, 2015;
Kujansivu & Lonnqvist, 2007; Tan et al., 2007; Shiu, 2006; Yalama & Coskun, 2007;
Gangi, Salerno, Meles, & Daniele, 2019) identify the method as the most attractive
among the available measures for IC. In addition, Chan (2009) recognises it as the
most appropriate method to value IC.
As Kamath (2007) has identified, the logic for using the VAIC method as a tool to
measure IC performance is supported by the following reasons:
• intellectual potential is the most important resource of corporate success,
especially in the knowledge economy;
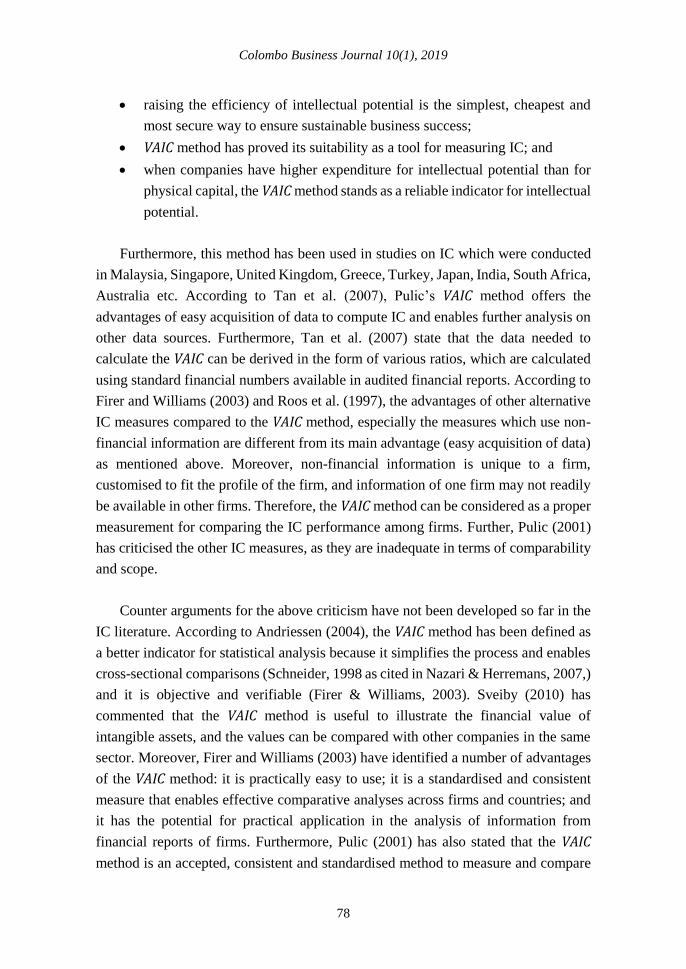
Colombo Business Journal 10(1), 2019
78
• raising the efficiency of intellectual potential is the simplest, cheapest and
most secure way to ensure sustainable business success;
• VAIC method has proved its suitability as a tool for measuring IC; and
• when companies have higher expenditure for intellectual potential than for
physical capital, the VAIC method stands as a reliable indicator for intellectual
potential.
Furthermore, this method has been used in studies on IC which were conducted
in Malaysia, Singapore, United Kingdom, Greece, Turkey, Japan, India, South Africa,
Australia etc. According to Tan et al. (2007), Pulic’s VAIC method offers the
advantages of easy acquisition of data to compute IC and enables further analysis on
other data sources. Furthermore, Tan et al. (2007) state that the data needed to
calculate the VAIC can be derived in the form of various ratios, which are calculated
using standard financial numbers available in audited financial reports. According to
Firer and Williams (2003) and Roos et al. (1997), the advantages of other alternative
IC measures compared to the VAIC method, especially the measures which use non-
financial information are different from its main advantage (easy acquisition of data)
as mentioned above. Moreover, non-financial information is unique to a firm,
customised to fit the profile of the firm, and information of one firm may not readily
be available in other firms. Therefore, the VAIC method can be considered as a proper
measurement for comparing the IC performance among firms. Further, Pulic (2001)
has criticised the other IC measures, as they are inadequate in terms of comparability
and scope.
Counter arguments for the above criticism have not been developed so far in the
IC literature. According to Andriessen (2004), the VAIC method has been defined as
a better indicator for statistical analysis because it simplifies the process and enables
cross-sectional comparisons (Schneider, 1998 as cited in Nazari & Herremans, 2007,)
and it is objective and verifiable (Firer & Williams, 2003). Sveiby (2010) has
commented that the VAIC method is useful to illustrate the financial value of
intangible assets, and the values can be compared with other companies in the same
sector. Moreover, Firer and Williams (2003) have identified a number of advantages
of the VAIC method: it is practically easy to use; it is a standardised and consistent
measure that enables effective comparative analyses across firms and countries; and
it has the potential for practical application in the analysis of information from
financial reports of firms. Furthermore, Pulic (2001) has also stated that the VAIC
method is an accepted, consistent and standardised method to measure and compare

Kehelwalatenna & Premaratne
79
IC performance of the firm. Pulic (2001, 2002b) has emphasised that VAIC method
enables internal (over a period for the same firm) as well as external comparisons
(across sectors and countries).
Moving further in identifying the merits of the method, Mavridis (2005) has
recognised it as a simple but excellent method of highlighting the intellectual
phenomenon in a rational way, and as providing meaningful in-depth performance
insights into the role of the physical capital and the human capital. Nazari and
Herremans (2007) argue that qualitative methods to compute IC are attempting to
measure IC within companies by referring to the indicators that are not publicly
available. The alternative methods for the VAIC method have not developed
mechanisms to deal with the issues of calculating market-based IC for companies that
are not listed on the stock market and such methods have failed to explore the
efficiency of human capital (Tan et al., 2007). Overall, the following advantages can
be identified through the review of literature (mainly, Appuhami, 2007; Chang &
Hsieh, 2011; Chen et al., 2005; Firer & Williams, 2003; Goh, 2005; Mavridis, 2004;
Tseng & Goo, 2005) which adopted the VAIC method for measuring IC:
• it generates objective, quantifiable and quantitative measurements without
using subjective grading;
• its’ indicators are useful and appropriate for all stakeholders who may want
to identify and compare IC whereas most of the alternative measures are
categorically informative for the shareholders;
• it exists as a ratio measurement drawn from the input of financial data,
therefore, it is most suitable to be used along with traditional financial
indicators of the business;
• it offers a relatively simple and straightforward process to compute the value
creation efficiencies of assets. As a result, whoever who is familiarised with
traditional accounting information may understand and apply the VAIC
method;
• it can be used as a benchmarking method because it is a standardised
measure which can be useful for internal (over a period of time for the same
firm) and external (across sectors and countries) comparisons;
• the data needed to compute the VAIC are publicly and mostly freely available
in the published financial statements. The reliability of the measure is also
ensured as it uses data from audited financial statements;
• the VAIC approach is consistent with stakeholder view and the Resource-
based View as it uses a value added approach;
Colombo Business Journal 10(1), 2019
80
• one of the main assumptions of the method is that human capital is the most
important aspect of IC, which is consistent with all major definitions for IC;
and
• the literature on IC measurement and testing of the relationship between IC
and corporate performance shows that the VAIC method is the most widely
used and the most popular among IC scholars.
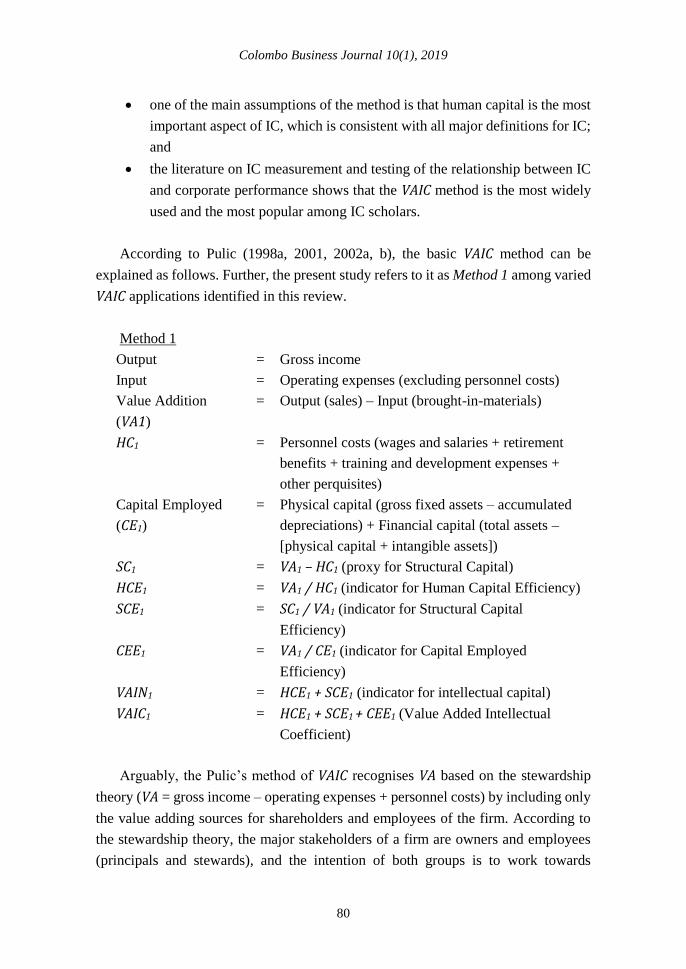
According to Pulic (1998a, 2001, 2002a, b), the basic VAIC method can be
explained as follows. Further, the present study refers to it as Method 1 among varied
VAIC applications identified in this review.
Method 1
Output = Gross income
Input = Operating expenses (excluding personnel costs)
Value Addition
(VA1)
= Output (sales) – Input (brought-in-materials)
HC1 = Personnel costs (wages and salaries + retirement
benefits + training and development expenses +
other perquisites)
Capital Employed
(CE1)
= Physical capital (gross fixed assets – accumulated
depreciations) + Financial capital (total assets –
[physical capital + intangible assets])
SC1 = VA1 – HC1 (proxy for Structural Capital)
HCE1 = VA1 / HC1 (indicator for Human Capital Efficiency)
SCE1 = SC1 / VA1 (indicator for Structural Capital
Efficiency)
CEE1 = VA1 / CE1 (indicator for Capital Employed
Efficiency)
VAIN1 = HCE1 + SCE1 (indicator for intellectual capital)
VAIC1 = HCE1 + SCE1 + CEE1 (Value Added Intellectual
Coefficient)
Arguably, the Pulic’s method of VAIC recognises VA based on the stewardship
theory (VA = gross income – operating expenses + personnel costs) by including only
the value adding sources for shareholders and employees of the firm. According to
the stewardship theory, the major stakeholders of a firm are owners and employees
(principals and stewards), and the intention of both groups is to work towards
Kehelwalatenna & Premaratne
81
satisfying their own psychological and sociological characteristics (Davis,
Schoorman, & Donaldson, 1997).
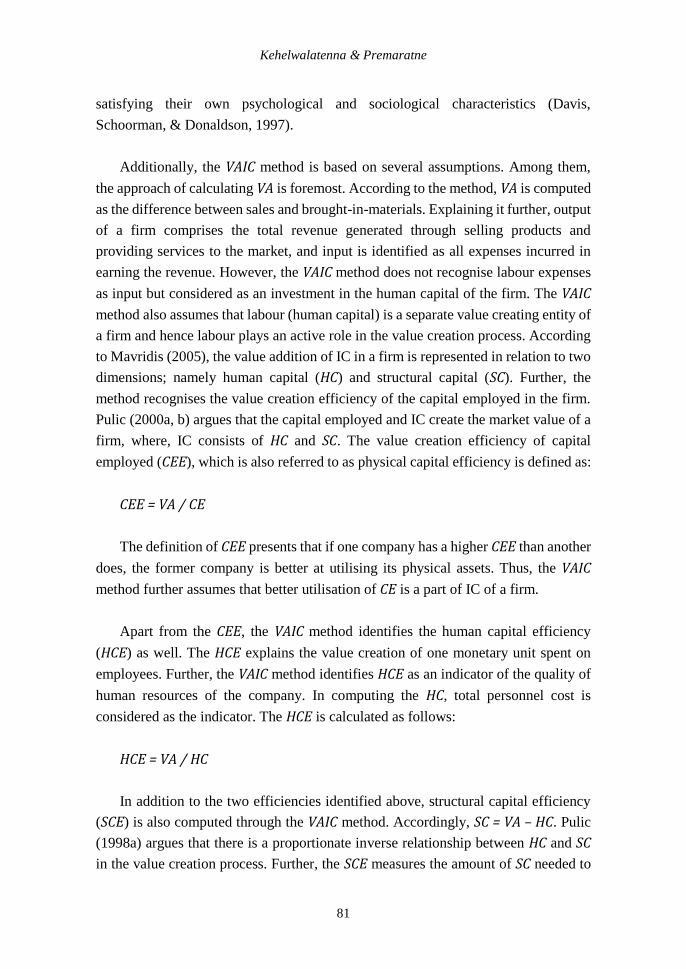
Additionally, the VAIC method is based on several assumptions. Among them,
the approach of calculating VA is foremost. According to the method, VA is computed
as the difference between sales and brought-in-materials. Explaining it further, output
of a firm comprises the total revenue generated through selling products and
providing services to the market, and input is identified as all expenses incurred in
earning the revenue. However, the VAIC method does not recognise labour expenses
as input but considered as an investment in the human capital of the firm. The VAIC
method also assumes that labour (human capital) is a separate value creating entity of
a firm and hence labour plays an active role in the value creation process. According
to Mavridis (2005), the value addition of IC in a firm is represented in relation to two
dimensions; namely human capital (HC) and structural capital (SC). Further, the
method recognises the value creation efficiency of the capital employed in the firm.
Pulic (2000a, b) argues that the capital employed and IC create the market value of a
firm, where, IC consists of HC and SC. The value creation efficiency of capital
employed (CEE), which is also referred to as physical capital efficiency is defined as:
CEE = VA / CE
The definition of CEE presents that if one company has a higher CEE than another
does, the former company is better at utilising its physical assets. Thus, the VAIC
method further assumes that better utilisation of CE is a part of IC of a firm.
Apart from the CEE, the VAIC method identifies the human capital efficiency
(HCE) as well. The HCE explains the value creation of one monetary unit spent on
employees. Further, the VAIC method identifies HCE as an indicator of the quality of
human resources of the company. In computing the HC, total personnel cost is
considered as the indicator. The HCE is calculated as follows:
HCE = VA / HC
In addition to the two efficiencies identified above, structural capital efficiency
(SCE) is also computed through the VAIC method. Accordingly, SC = VA – HC. Pulic
(1998a) argues that there is a proportionate inverse relationship between HC and SC
in the value creation process. Further, the SCE measures the amount of SC needed to

Colombo Business Journal 10(1), 2019
82
generate one monetary unit of VA, and it indicates how successful SC is in the value
creation process. The SCE is computed as below:
SCE = SC / VA
The sum of HCE and SCE measures IC efficiency of a firm:
VAIN = HCE + SCE
Eventually, the aggregate ratio, VAIC, is calculated as the sum of the three
efficiencies mentioned above. The VAIC (total corporate intellectual ability) can be
calculated using the following equation:
VAIC = CEE + HCE + SCE
Advancing from the basic VAIC method (Method 1), various scholars have
attempted to customise variables of it by using alternative theoretical assumptions to
the already accommodated assumptions. Consequently, the focus of this review now
shifts towards highlighting such alternative assumptions appearing in the IC
literature. Such a review is also useful to explore the varieties of VAIC applications
available in the extant IC literature. Moreover, the review of past studies, which
adopted the VAIC method to measure IC, reveals that there are inconsistencies among
findings of relatively similar studies. Clarke et al. (2011) also state that prior studies
in different contexts, which used the VAIC method have reported mixed results. The
existing IC literature however attempts to explain this situation by pointing out the
fact that contextual differences (socio, political and economic differences) of samples
could have had a significant impact on the findings (i.e. Abeysekera, 2007; Marr et
al., 2004). Nevertheless, the IC literature thus far has not suspected that inconsistent
applications of the VAIC method could also be another factor for reporting mixed
findings. Therefore, the present study attempts to highlight such inconsistent
applications of the VAIC method and examine the effect of those applications on the
associations between IC and corporate performance.
Firer and Williams (2003) were the first to adopt Pulic’s basic VAIC method
(Method 1) by incorporating few different perspectives to compute its variables. In
this respect, variations such as the calculation of VA based on the stakeholder theory,
representation of wages and salaries as HC, and the selection of book value of net
assets to represent CE can be highlighted. Furthermore, this widely cited study in
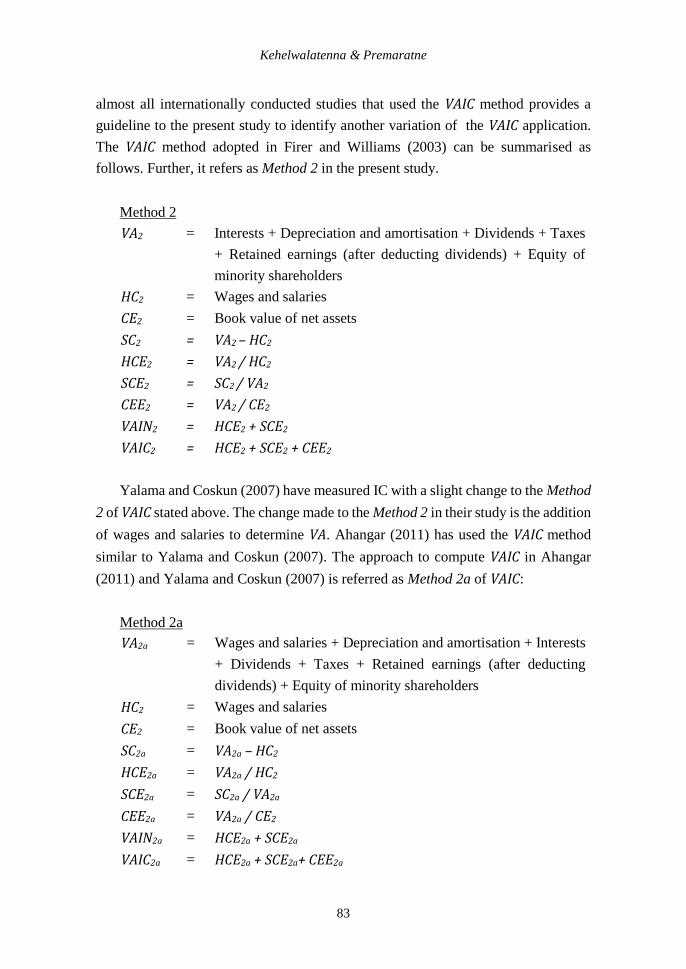
Kehelwalatenna & Premaratne
83
almost all internationally conducted studies that used the VAIC method provides a
guideline to the present study to identify another variation of the VAIC application.
The VAIC method adopted in Firer and Williams (2003) can be summarised as
follows. Further, it refers as Method 2 in the present study.
Method 2
VA2 = Interests + Depreciation and amortisation + Dividends + Taxes
+ Retained earnings (after deducting dividends) + Equity of
minority shareholders
HC2 = Wages and salaries
CE2 = Book value of net assets
SC2 = VA2 – HC2
HCE2 = VA2 / HC2
SCE2 = SC2 / VA2
CEE2 = VA2 / CE2
VAIN2 = HCE2 + SCE2
VAIC2 = HCE2 + SCE2 + CEE2
Yalama and Coskun (2007) have measured IC with a slight change to the Method
2 of VAIC stated above. The change made to the Method 2 in their study is the addition
of wages and salaries to determine VA. Ahangar (2011) has used the VAIC method
similar to Yalama and Coskun (2007). The approach to compute VAIC in Ahangar
(2011) and Yalama and Coskun (2007) is referred as Method 2a of VAIC:
Method 2a
VA2a = Wages and salaries + Depreciation and amortisation + Interests
+ Dividends + Taxes + Retained earnings (after deducting
dividends) + Equity of minority shareholders
HC2 = Wages and salaries
CE2 = Book value of net assets
SC2a = VA2a – HC2
HCE2a = VA2a / HC2
SCE2a = SC2a / VA2a
CEE2a = VA2a / CE2
VAIN2a = HCE2a + SCE2a
VAIC2a = HCE2a + SCE2a+ CEE2a

Colombo Business Journal 10(1), 2019
84
Calisir et al. (2010), Komnenic and Pokrajcic (2012) and Ting and Lean (2009)
conducted studies that used the VAIC method with another different approach to
compute VA compared to Methods 2 and 2a. Their approach to compute VA is using
Pulic’s basic method (Method 1). Therefore, the present study identifies a Method 2b
to accommodate the said difference to Methods 2 and 2a. Method 2b of VAIC is
presented below:
Method 2b
VA2b = Gross income – Operating expenses + Personnel costs
HC2 = Wages and salaries
CE2 = Book value of net assets
SC2b = VA2b – HC2
HCE2b = VA2b / HC2
SCE2b = SC2b / VA2b
CEE2b = VA2b / CE2
VAIN2b = HCE2b + SCE2b
VAIC2b = HCE2b + SCE2b + CEE2b
A well-manifested study was carried out by Chen et al. (2005) by largely adopting
the basic VAIC method (Method 1) to measure the IC of firms selected for their study.
However, they computed the VA variable based on the stakeholder theory (VA =
Wages and salaries + Interests + Taxes + Retained earnings (after dividends) +
Dividends + Depreciation and amortisation). This computation makes the VAIC
method used in their study deviate from Pulic’s standard method (Method 1). Hence,
the present study identifies another approach for the VAIC method, Method 3, as
presented below:
Method 3
VA3 = Wages and salaries + Interests + Taxes + Retained earnings
(after dividends) + Dividends + Depreciation and amortisation
HC3 = Personnel costs (wages and salaries + retirement benefits +
training and development expenses + other perquisites)
CE3 = Physical capital (gross fixed assets – accumulated
depreciations) + Financial capital (total assets – [physical
capital + intangible assets])
SC3 = VA3 – HC3
HCE3 = VA3 / HC3
SCE3 = SC3 / VA3

Kehelwalatenna & Premaratne
85
CEE3 = VA3 / CE3
VAIN3 = HCE3 + SCE3
VAIC3 = HCE3 + SCE3 + CEE3
Tan et al. (2007) measured IC of publicly listed companies on the Singapore
Exchange. They used the Pulic’s initial VAIC method (Method 1) to measure IC, but,
with slight alterations. Those are, HC is represented by the aggregate value of wages
and salaries, and capital employed was proxied by physical capital of the firm.
Accomodating the above variations for the initial VAIC method in Tan et al. (2007),
the current study identifies Method 4 of VAIC as elaborated below:
Method 4
VA4 = Gross income – Operating expenses + Personnel costs
HC4 = Wages and salaries
CE4 = Physical capital (gross fixed assets – accumulated
depreciations)
SC4 = VA4 – HC4
HCE4 = VA4 / HC4
SCE4 = SC4 / VA4
CEE4 = VA4 / CE4
VAIN4 = HCE4 + SCE4
VAIC4 = HCE4 + SCE4 + CEE4
The application of the VAIC method in Clarke et al. (2011) to examine the effect
of IC on firm performance of listed firms on the Australian Stock Exchange provides
the platform to identify another varied application of the VAIC method. The identified
variation is presented below as Method 5 of the VAIC.
Method 5
VA5 = Wages and salaries + Interests + Depreciation and amortisation
+ Dividends + Taxes + Retained earnings (after deducting
dividends) + Equity of minority shareholders
HC5 = Wages and salaries
CE5 = Physical capital (gross fixed assets – accumulated
depreciations) + Financial capital (total assets – [physical
capital + intangible assets])
SC5 = VA5 – HC5

Colombo Business Journal 10(1), 2019
86
HCE5 = VA5 / HC5
SCE5 = SC5 / VA5
CEE5 = VA5 / CE5
VAIN5 = HCE5 + SCE5
VAIC5 = HCE5 + SCE5 + CEE5
According to Clarke et al. (2011), computation of VA (VA = Wages and salaries
+ Interests + Depreciation and amortisation + Dividends + Taxes + Retained earnings
(after deducting dividends) + Equity of minority shareholders) in Method 5 is based
on the stakeholder theory. Further, they have identified HC as the aggregation of
wages and salaries. These are the two adjustments that Clarke et al. (2011) have made
to the basic VAIC method (Method 1).
Limitations and a Modification to the VAIC Method
This sub-section recognises limitations of the VAIC method and rationalises the
suggested modification to its existing procedure to compute IC. As far as the rigour
and evolution of existing IC measures are concerned, Nazari and Herremans (2007)
expressed that IC measures are still in the exploratory stage and researchers from
different disciplines and viewpoints from different theories have an opportunity to
add to the multidimensionality of existing IC measures. Similarly, Kamath (2007) has
pointed out that existing parameters for evaluating IC performance are not exhaustive.
Corresponding to these views, this study suggests a modification to the existing VAIC
method by carefully analysing the fundamental assumptions of it. Additionally, the
modification focuses on the practical usage of the method in a different perspective
as discussed next.
There is a growing body of knowledge that point out demerits of the VAIC method
despite the fact that it has gained some recognition as an efficient measure for IC. In
the same vein, the present study identifies the inability of the VAIC method to
decompose value creation efficiency of relational capital (RC) as a key drawback. It
is acceptable that IC scholars had initially recognised human capital (HC) and
structural capital (SC) as components of IC. For example, Bontis (2004), Edvinsson
(1997) and Edvinsson and Malone (1997) decomposed IC into HC and SC during the
relatively early stages of IC research. In this circumstance, the RC was included in SC.
However, the prominence of decomposing RC and SC into two separate components
arises when external investors value each component differently in the context of
contemporaneous agreement on IC components being around HC, SC and RC (i.e.

Kehelwalatenna & Premaratne
87
Cabrita & Bontis, 2008; Nazari & Herremans, 2007; Tayles et al., 2007). The
evolution of IC components shows an agreement on HC, SC and RC as components of
IC. In this connection, failure to revise underlying assumptions of the VAIC method
in reflection to the said epistemological changes essentially affects the efficiency of
the method adversely. Stahle et al. (2011) also point out that the VAIC method does
not deal with RC at all. Meanwhile, the marketing literature highlights the importance
of market intelligence in creating performance of the firm. Further, the present study
recognises internally derived market intelligence of a firm as RC.
According to Cabrita and Bontis (2008), little research has focused on the
importance of RC and its association with corporate performance. To support this
observation, Dawes (2000) found that competitor orientation, a component of market
orientation, has emerged as a variable, which shows the strongest association with
performance. Moreover, it can be argued that the inability to establish the association
between RC and corporate performance is partly accounted for the failure of
computing the RC component using existing IC measures. Alternative to establishing
the direct relationship between RC and firm performance, RC can also be included as
a control variable in regression models. In both options, sales and distribution
expenses could be used as a proxy variable for RC. This is because according to Laing,
Dunn, and Hughes-Lucas (2010), marketing expenditure is a proxy measure for RC.
Furthermore, Gelb and Siegel (2000) have discovered that firms with larger amounts
of research and development expenses and advertising expenditures have a positive
impact on market reaction, which increases dividends and stock repurchase
announcements.
Apart from the above-discussed issue related to distinguishing RC, Chu et al.
(2011) have identified several other limitations of the VAIC method. Firstly, the
method is inadequate to handle companies with a negative book value of equity or
negative operating profits. Secondly, the inverse relationship between HC and SC is
not immediately apparent in the method though it is theoretically sound and persistent
with the general definition of IC. Thirdly, although the VAIC method depicts the value
addition of human capital, structural capital and capital employed, it does not
calculate the contribution of each element of different components of IC. This
limitation eventually affects prioritising investments in IC elements to increase values
of the IC components. Further, Andriessen (2004) mentioned that the VAIC method
as well as other IC measures might not sufficiently identify the synergistic effects for
value creation from interactions of different forms of capital.

Colombo Business Journal 10(1), 2019
88
Kamath (2007) has identified three different ways to move ahead to develop a
new method for measuring IC as stated below:
1. Adjusting conventional methods of accounting to accommodate new
parameters and variables.
2. Retaining the traditional accounting methods and adding new measures to
account for IC.
3. Abandoning old methods completely and creating a new method.
Following the second suggestion in Kamath (2007), the present study expects to
add new measures to a widely used measure for IC. As highlighted previously, the
VAIC method has been selected for this purpose.
The modification begins with the selection of input variables to the suggested
VAIC method. First, a suitable approach to compute VA has been selected. An
observation on the available approaches in IC literature to compute VA for the VAIC
method reveals that there are two theories behind its computation, namely,
stewardship theory and stakeholder theory. The stewardship theory identifies the
value adding components to owners and employees (VA = Gross income – Operating
expenses + Personnel costs). This approach uses Pulic’s basic method of VAIC
(referred as Method 1 in the present study). The subsequent adoptions of the VAIC
method use stakeholder theory to identify value additions of the firm. This approach
considers the value adding sources for all stakeholder groups (i.e. owners, employees,
financial institutes, government, etc.). Hence, the present modification computes the
VA of the firm based on the stakeholder theory since its VA sources cover the entire
groups of stakeholders without limiting to owners and employees as mentioned in the
stewardship theory. CE variable of the modification is computed as the aggregation
of physical capital and financial capital. This approach is widely used in the IC
literature compared to some of the VAIC applications (i.e. Method 2 and Method 4)
that use physical capital only. Similarly, the HC variable is represented by the total
personnel costs of the firm. This inclusion is much more representative of what firms
invest on employees rather than including wages and salaries as several past VAIC
applications have done (i.e. Methods 2, 4 and 5). As discussed before, sales,
marketing and advertising expenses is the proxy variable for RC – the remaining input
variable of the modified VAIC method.
In conclusion, the modified VAIC method can be elaborated as follows. Moreover,
the modified method is referred to as Method 6 in this study.

Kehelwalatenna & Premaratne
89
Method 6
VA6 = Total staff costs + interests + depreciation and
amortisation + dividends + taxes + retained earnings
(after deducting dividends) + equity of minority
shareholders
CE6 = Physical capital (gross fixed assets – accumulated
depreciations) + financial capital (total assets – [physical
capital + intangible assets])
HC6 = Personnel costs (wages and salaries + retirement benefits
+ training and development expenses + other perquisites)
RC = Sales, marketing and advertising expenses
(SC6 + RC) = VA6 – HC6
HCE6 = VA6 / HC6
RCE = VA6 / RC
SCE6 = [(VA6 – HC6) / VA6] – RCE
CEE6 = VA6 / CE6
VAIN6 = HCE6 + SCE6 + RCE
VAIC6 = CEE6 + HCE6 + SCE6 + RCE
Methodology
Sample and Data
Firer and Williams (2003), Kamath (2007) and Nassar (2018) documented that
financial services firms emphasise more on IC resources. Furthermore, knowledge-
intensive companies tend to dominate the finance sector in the knowledge economy
era (Ting & Lean, 2009). In addition to this, banking firms use huge amounts of
human capital and customer capital (Kamath, 2007). Linda et al. (2017) recognise the
banking sector as one of the sectors that intensively utilises IC assets. According to
D’Hulster (2009) the US, Canada and Switzerland are three countries with large
international banking systems. In line with this, the present study limits to the banking
sector firms listed on the NYSE – the largest stock exchange in the world. All 249
banking sector firms listed in the NYSE by January 01 2012 were selected initially to
represent the research site of the paper. However, data of some firms were omitted
due to the unavailability of quarterly financial statements throughout the sample
period as they did not maintain listing status for a bulk of the quarters in the sample
period. Eventually 58 firms were excluded from the sample and 191 were retained.

Colombo Business Journal 10(1), 2019
90
Data of selected firms was extracted from published quarterly financial
statements available on the Bloomberg database. The authors’ decided to use
quarterly financial data from the first quarter of 2000 to second quarter of 2011of the
above sample where the sample period is distant from the time this study was
conducted. Nevertheless, the decision to use the above data set would not dilute the
contribution of the study due to two reasons. Firstly, the prime usage of the data set
was to extract the differences in IC values (independent variable of the study) through
diverse applications of the VAIC method to input in statistical analyses. Secondly, the
authors do not intend to emphasise on a contemporaneous relationship between IC
and firm performance of the sample. Hence, the time period and cross section of data
for this nature of an investigation become irrelevant. Since the data set was long and
wide, the range within the values in which the variables are positioned was very
broad. Hence, the outliers of the data set were handled in the following manner. The
authors decided beyond which the values are considered to be outliers and then
replaced such values with the average value of a particular variable in a given quarter
calculated by excluding the identified outliers.
Regression Model
Data collected for this study were analysed by employing the following
regression Model 1 for panel data. According to IC theory, a firm can generate
superior performance in a sustainable manner through the efficient utilisation of its
IC resources. Further, the Resource-based View of the firm persists that resources of
the firm is the main driving force behind firm performance. Under these theoretical
expectations, this study expects positive coefficient signs for independent variables
of the regression model.
𝑌𝑖𝑡 = 𝛽01 + 𝛽11𝑉𝐴𝐼𝑁𝑖𝑡 + 𝛽21𝐶𝐸𝐸𝑖𝑡 + 𝜀𝑖𝑡 (1)
where 𝑌𝑖𝑡 is a common notation for ∆𝐴𝑇𝑂, 𝑅𝑂𝐴, 𝑅𝑂𝐸 and ∆𝑀𝐵 of ith firm in tth
quarter. 𝛽01 is the constant of the model. Calculated VAIN values based on the six
methods summarised in this study represent the proxy measure for IC. VAIC method
measures both intellectual capital efficiency (VAIN) (efficiencies of human capital,
structural capital and relational capital), and physical capital efficiency (CEE). The
total of VAIN and CEE forms VAIC (VAIC=VAIN+CEE) (total value creating ability of
the firm using both intangible and tangible assets) which is termed as Value Added
Intellectual Coefficient. Therefore VAIN is used as the proxy measure for IC in model
(1).
Kehelwalatenna & Premaratne
91
According to Forte, Tucker, Matonti, and Nicolò (2017) investment in IC is
increasingly important to firms seeking to achieve productivity and efficiency gains.
Productivity, profitability and market valuation are used as dependent variables of the
study. Revenue divided by total assets forms the assets turnover ratio (ATO), and it
represents the productivity of the firm (Chu et al., 2011; Kamath, 2008; Pal & Soriya,
2012). Profitability is measured through return on assets (ROA) and return on equity
(ROE) ratios. ROA reflects the effectiveness of utilising available assets in creating
profits. The ratio of operating profits to total assets is used to calculate it (Chen et al.,
2005; Pal & Soriya, 2012; Bala, Raja, & Dandgo, 2019). ROE represents the return
generated on common stocks of shareholders, and it is recognised as an important
financial indicator for owners of the firm (Chen et al., 2005; Pal & Soriya, 2012;
Kamath, 2015). The computation of ROE is performed using the ratio of net income
to average shareholder equity. Market valuation is the remaining dependent variable.
Market-to-book value ratio (MB) is used as the proxy measure for the market
valuation (Ghosh & Wu, 2007; Kamath, 2015). The MB is the market value of
common stocks divided by book value of common stocks, where, market value of
common stock is the average stock price multiplied by the number of shares
outstanding. Average shareholder equity represents the book value of common
stocks. The absolute values of ROA and ROE are used in the regression models
considering that these variables are stationary at levels, according to Unit-root test.
However, the change in ATO and MB values between the present and immediate past
quarter (first difference) is included to overcome the non-stationary nature of these
variables as evident in the Unit-root test.
Capital employed efficiency (CEE) of the VAIC method measures the physical
capital intensity of the firm. According to Komnenic and Pokrajcic (2012) and Maji
and Goswami (2016), physical capital intensity of the firm influences the firm
performance. Therefore, CEE computed in six VAIC methods represents the other
independent variable of the regression model.
Empirical Results
Descriptive Statistics
Table 2, 3 and 4 summarise descriptive statistics related to the variables used in
the study. More specifically, Table 2 provides descriptive statistics for input variables
namely, value addition (VA), human capital (HC), capital employed (CE), and
relational capital (RC) of different VAIC methods. Table 3 presents descriptive

Colombo Business Journal 10(1), 2019
92
statistics on output variables of the VAIC methods. Table 4 summarises descriptive
statistics of performance indicators used for the dependent variable of the study.
Figures 1A to 1C and 2A to 2G depict the behaviour of average values of value drivers
and created values in each VAIC method, respectively. Apart from the behaviour of
variables during the sample period, the Figures provide a graphical aid to compare
the behaviour of input and output variables of all VAIC methods.
According to Table 2, the VA of all VAIC methods ranges between 20.13 and
49.58. VA in Methods 1, 2a and 4 bears the minimum value and VA in Method 6 has
the maximum value. VA in Methods 2, 3 and 5 reported a mean of 46.71 and Method
2b has a value of 35.93. Figure 1A confirms that VA of Methods 1, 2a and 4 has the
lowest average and Method 6 has the highest. Figure 1A reveals that VA of Methods
2, 3 and 5 is much closely positioned to Method 6, and 2b behaves roughly in the
middle of lower and higher limits. A closer view on the underlying differences behind
VA approach in each method points out methods that adopted Pulic’s initial approach
to calculate VA are reportedly ranked in the lower band of 20.13. In contrast, the
approach used to compute VA in the suggested modification (Method 6) has recorded
the highest average for VA (value of 49.8). VA in Methods 2, 3 and 5 is slightly lower
than that of Method 6. Reason for this behaviour is that the latter method considers
total staff cost as a VA source whereas the former methods include wages and salaries
(the remaining VA sources are similar in both occasions). Method 2b which excludes
staff cost as a source of VA, despite all other VA sources of Methods 2, 3, 5 and 6 are
being included, is positioned between higher and lower bands. Standard deviation,
the average difference between observed values and the mean, for VA in all VAIC
methods reveals that VA in Method 6 has the least dispersion (2.73 times of mean)
and Methods 1, 2a and 4 has the highest (3.34 times of mean).
HC variable in Table 2 is included in the VAIC methods using two distinctive
applications. They are; total personnel cost in Methods 1, 3 and 6, and wages and
salaries in the remaining methods. A mean difference of 2.87 for HC can be observed
in Table 2. The behaviour of average HC over the sample period is portrayed in Figure
1B. The difference between two HC applications has occurred as Methods 1, 3 and 6
add other sources of personnel expenses to wages and salary expenses, whereas, the
remaining methods are solely based on wages and salaries. Degrees of dispersion (i.e.
2.37 and 2.32 times of mean) are reflected in the standard deviation of HC.
Approximately identical skewness and kurtosis in both occasions confirm that the
distribution of two HC approaches is very much similar.

Kehelwalatenna & Premaratne
93
Table 2: Descriptive Statistics for Value Drivers of VAIC Methods
Variable Method - 1, 2a and 4 Method - 2, 3 and 5 Method - 2b
Mean Med SD Skew Kurt Mean Med SD Skew Kurt Mean Med SD Skew Kurt
VA 20.13 7.66 67.3 -1.38 265 46.71 17.3 129 6.66 98.9 35.93 13.1 110.2 5.17 120.2
Method - 6
Mean Med SD Skew Kurt
18.3 135.4 6.91 95.76
Method - 1, 3 and 6 Method - 2, 4 and 5
Mean Med SD Skew Kurt Mean Med SD Skew Kurt
HC 13.65 5.25 32.4 7.65 78.5 10.78 4.25 25.1 7.66 79.0
Method - 1, 3, 5 and 6 Method - 2 Method - 4
Mean Med SD Skew Kurt Mean Med SD Skew Kurt Mean Med SD Skew Kurt
CE 3707 1343 8905 7 72 394 119 1178 12 237 3749 1328 9007 7 69
Method - 6
Mean Med SD Skew Kurt
RC 1.17 0.40 3.41 9.17 107.9
Keh
elwa
laten
na
& P
rem
ara
tne
93
Colombo Business Journal 10(1), 2019
94
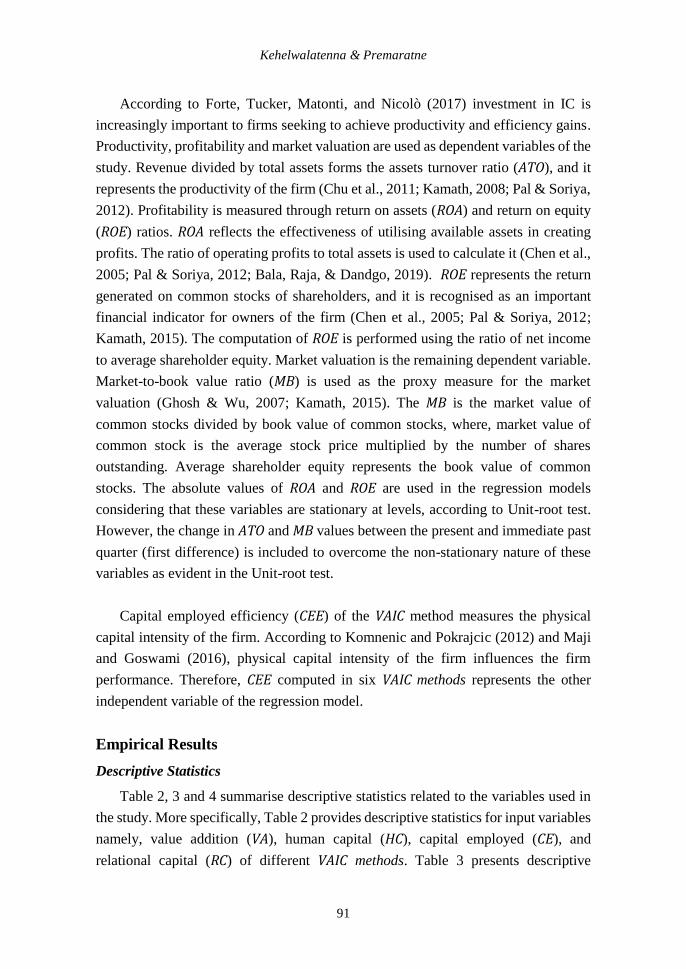
Table 3: Descriptive Statistics of Value Creators of VAIC Methods
Variable Method - 1 Method - 2 and 5 Method - 2a and 4 Method - 2b Method - 3 Method - 6
Mean Med Mean Med Mean Med Mean Med Mean Med Mean Med
SC 6.48 2.69 35.93 13.01 9.34 3.61 25.14 8.61 33.04 11.93
HCE 1.53 1.62 4.64 4.38 1.90 2.01 3.64 3.38 3.73 3.52 3.92 3.72
SCE 0.47 0.39 0.73 0.77 0.57 0.51 0.71 0.71 0.67 0.72 0.57 0.71
RCE 0.038 0.019
VAIN 2.01 2.02 5.38 5.18 2.48 2.52 4.36 4.10 4.40 4.25 4.53 4.46
Method - 1 Method - 2 Method - 2a Method - 2b Method - 3 and 5 Method - 4
Mean Med Mean Med Mean Med Mean Med Mean Med Mean Med
CEE 0.005 0.006 0.14 0.15 0.06 0.07 0.11 0.11 0.013 0.014 0.006 0.006
Method - 6
Mean Med
0.014 0.015
Method - 1 Method - 2 Method - 2a Method - 2b Method - 3 Method - 4
Mean Med Mean Med Mean Med Mean Med Mean Med Mean Med
VAIC 2.01 2.02 6.12 5.94 2.54 2.59 4.47 4.23 4.42 4.26 2.49 2.53
Method - 5 Method - 6
Mean Med Mean Med
5.39 5.18 4.55 4.47
Co
lom
bo
Bu
siness Jo
urn
al 1
0(1
), 20
19
94

Kehelwalatenna & Premaratne
95
Figure 1: Average Values of Input Variables of VAIC Methods
Figure 1A: Value Addition Figure 1B: Human Capital
-10
0
10
20
30
40
50
60
70
80
00 01 02 03 04 05 06 07 08 09 10 11
VA1 VA2 VA2A
VA2B VA3 VA4
VA5 VA6
4
6
8
10
12
14
16
18
20
00 01 02 03 04 05 06 07 08 09 10 11
HC1 HC2 HC3
HC4 HC5 HC6
0
1,000
2,000
3,000
4,000
5,000
6,000
00 01 02 03 04 05 06 07 08 09 10 11
CE1 CE2 CE3
CE4 CE5 CE6
Figure 1C: Capital Employed
Keh
elwa
laten
na
& P
rem
ara
tne
95

Colombo Business Journal 10(1), 2019
96
Figure 2: Average Values of Value Creations through VAIC Methods
Figure 2A: Structural Capital Efficiency
-30
-20
-10
0
10
20
30
40
50
60
00 01 02 03 04 05 06 07 08 09 10 11
SC1 SC2 SC2A
SC2B SC3 SC4
SC5
Figure 2B: Human Capital Efficiency
0
1
2
3
4
5
6
7
00 01 02 03 04 05 06 07 08 09 10 11
HCE1 HCE2 HCE2A
HCE2B HCE3 HCE4
HCE5 HCE6
-5
-4
-3
-2
-1
0
1
2
3
00 01 02 03 04 05 06 07 08 09 10 11
SCE1 SCE2 SCE2A
SCE2B SCE3 SCE4
SCE5 SCE6
Figure 2C: Structural capital efficiency
Co
lom
bo
Bu
siness Jo
urn
al 1
0(1
), 20
19
96

Kehelwalatenna & Premaratne
97
Figure 3: Average Values of Value Creations through VAIC Methods (Contd.)
Figure 2D: Capital Employed Efficiency
-.04
.00
.04
.08
.12
.16
.20
.24
00 01 02 03 04 05 06 07 08 09 10 11
CEE1 CEE2 CEE2A
CEE2B CEE3 CEE4
CEE5 CEE6
Figure 2E: Intellectual Capital Efficiency
-2
0
2
4
6
8
00 01 02 03 04 05 06 07 08 09 10 11
VAIN1 VAIN2 VAIN2A
VAIN2B VAIN3 VAIN4
VAIN5 VAIN6
-2
0
2
4
6
8
10
00 01 02 03 04 05 06 07 08 09 10 11
VAIC1 VAIC2 VAIC2A
VAIC2B VAIC3 VAIC4
VAIC5 VAIC6
Figure 2F: Value Added Intellectual Capital Coefficient
Figure 2G: Relational capital efficiency
-.1
.0
.1
.2
.3
.4
.5
00 01 02 03 04 05 06 07 08 09 10 11
Keh
elwa
laten
na
& P
rem
ara
tne
97
Colombo Business Journal 10(1), 2019
98
The remaining input variable, CE, of the identified VAIC methods can be
categorised under three sections as shown in Table 2. Approaches to compute CE in
Methods 1, 3 and 6, and Method 4 would be identical if Method 4 includes financial
capital in addition to the current approach to represent physical capital as CE.
However, Method 2 uses the book value of net assets, which computationally has a
lower value than CE in other methods (see Figure 1C). Furthermore, the rest of the
descriptive statistics (i.e. standard deviation, skewness and kurtosis) for CE in Table
2 reveal that the distributions of CE in Methods 1, 3, 4, 5 and 6 are very similar.
Sales, marketing and advertising expenses represents RC in the modified VAIC
method (Method 6). RC has a mean of 1.17 with a standard deviation of 3.41.
The mean values of input variables in all VAIC methods are substantially larger
than medians, indicating that the sample includes a small number of very large values.
Additionally, leptokurtic distributions for input variables of all methods indicate that
most of the values are concentrated around the mean (see Table 2).
Reported mean values in Table 2 and Table 3 are substantially higher than
medians. Following leptokurtic distributions for input variables of VAIC methods as
identified earlier, the values obtained (SC, HCE, SCE, CEE, RCE, VAIN and VAIC) in all
VAIC methods persist with leptokurtic distributions. However, certain variables such
as HCE in Methods 1, 2a and 4; CEE in all methods, except Method 1; and SCE, VAIN
and VAIC in Methods 2, 3, 5 and 6 show a negative skewness. These left skewed
distributions indicate that most values for the above variables are higher than the
average value whereas certain firms have very low values. This pattern is contrary to
the observed positive skewness for related input variables in Table 2.
The most interesting observation in Figures 2A to 2F is the reflection of the
behaviour in Figure 1A. This highlights the dominant role that the VA variable plays

Kehelwalatenna & Premaratne
99
in determining the IC level. However, RCE has a relatively distinctive behaviour
though the volatilities of VA at the latter stage of the sample period and these are
reflected in Figure 2G. Further, the same Figures set the upper and lower boundaries
for average value creations in the VAIC methods. According to Figures 2A to 2F,
Pulic’s initial method (Method 1) to measure IC represents the lower boundary for
average values of all created values such as SC, HCE, SCE, CEE, VAIN and VAIC. The
obvious reason for this pattern is that Pulic’s method places VA at a minimum level
compared to other methods. Meanwhile, Method 1 inputs HC and CE at the maximum
level among the identified VAIC methods. In contrast, Methods 2 and 5 provide the
upper boundary for average SC, HCE, SCE, VAIN and VAIC. Method 2 sets the upper
limit for CEE, which is considerably higher than other methods. The reason for this is
that Method 2 includes VA according to the stakeholder theory, which recognises VA
at a higher level. Inclusion of net assets as CE, a considerably lesser value, compared
to including the aggregate value of physical capital and financial capital is the reason
for considerably higher values being reported for CEE in Method 2.
Table 4: Descriptive Statistics of Dependent Variables
Variable Mean Median Max Min SD Skew Kurtosis
ATO 0.017 0.016 0.111 0.007 0.003 3.96 73.69
ROA 0.002 0.003 0.048 -0.10 0.004 -8.81 163.51
ROE 0.017 0.03 6.09 -12.75 0.199 -37.62 2514
MB 0.013 0.014 0.074 0.001 0.006 -3.25 44.52
Note: Number of observations is 8,786
Minimum values related to profitability (ROA and ROE) of sample firms in Table
4 reveal that some firms report losses. Meanwhile, all performance indicators have
leptokurtic distributions, which prove that a majority of values of these variables
gather around the mean values. However, right skewed distribution for ATO indicates
that most of the values of these variables are lower than the average even though some
higher positive amounts do exist. This pattern varies in the distribution for ROA, ROE
and MB as they have left skewed distributions.
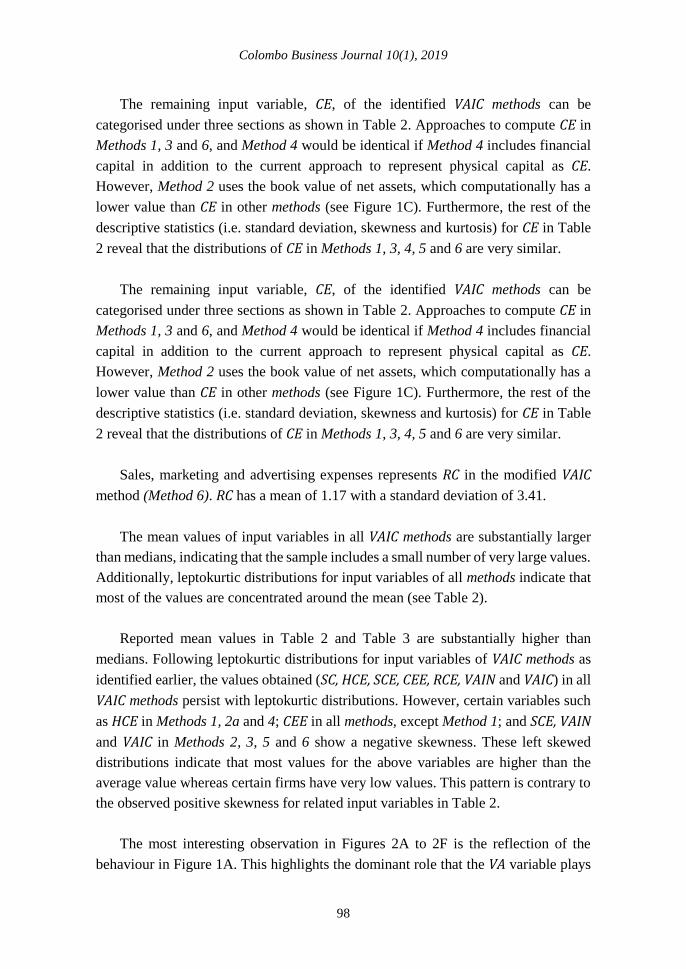
Correlation Analysis
The key observation related to correlations of IC measured under different VAIC
methods and corporate performance is their identical nature in most of the cases (see
Table 5). This pattern is reported despite the fact that the processes of obtaining IC
values in different methods are conceptually and computationally different. However,
Colombo Business Journal 10(1), 2019
100
Pulic’s original VAIC framework (Method 1) has an inconclusive association between
IC and ROA. Commenting on the methods that provide improved associations,
Methods 2 and 5 show marginally higher associations of IC with ATO, ROA, ROE, and
MB. It should be further noticed that all associations of IC and firm performance are
weak positive despite the correlations for Methods 2b and 5 with ROA; Methods 2a,
2b and 5 with ROE; and Methods 2b and 5 with MB are slightly higher than that of
other methods.
Table 5: Correlation between IC and Firm Performance
Variable M – 1 M – 2 M – 2a M - 2b M – 3 M – 4 M – 5 M – 6
ATO 0.032a 0.066a 0.051a 0.104a 0.082a 0.049a 0.106a 0.061a
ROA 0.013 0.03a 0.025b 0.039a 0.035a 0.025b 0.045a 0.024b
ROE 0.090a 0.096a 0.180a 0.160a 0.118a 0.142a 0.158a 0.080a
MB 0.039a 0.070a 0.068a 0.094a 0.084a 0.067a 0.111a 0.056a
Notes: 1. a and b denote significance levels p < 0.01 and p < 0.05, respectively.
2. Number of observations is 8,786
Regression Results
Results of the above correlation analysis constitute the first approach to assess
the associations between selected variables. Next, the study continues to test the
impact of IC on firm performance using constructed linear multiple regression model
(Model 1). Before performing the regression analysis, the correlation coefficients
between explanatory variables were analysed to ascertain the absence of the
multicollinearity problem. In this respect, coefficients of all possible associations
between explanatory variables of the model were observed. The association between
IC and CEE of all VAIC methods in the model ranged between 0.028 (in Method 6)
and 0.21 (in Method 2). These correlations do not provide evidence of strong
correlations between explanatory variables. Hence, it can be presumed that there is
an absence of the multicollinearity problem in this analysis. The Im, Pesaran and Shin
test (Im, Pesaran, & Shin, 2003) was applied to check the stationarity of the data
before carrying out the regression analysis. Results of the test led to the rejection of
the null hypothesis of the unit-root for all related variables in regression models,
except for ATO and MB. However, these variables are stationary at the first difference
level though the remaining variables are stationary at levels.
Before assessing the validity of fixed effects models, a required test was carried
out to check whether fixed effects (i.e. different constants for each group) should
indeed be included in the models. In this respect, the standard F-test was used to check
the validity of fixed effects models against the simple pooled ordinary least squares
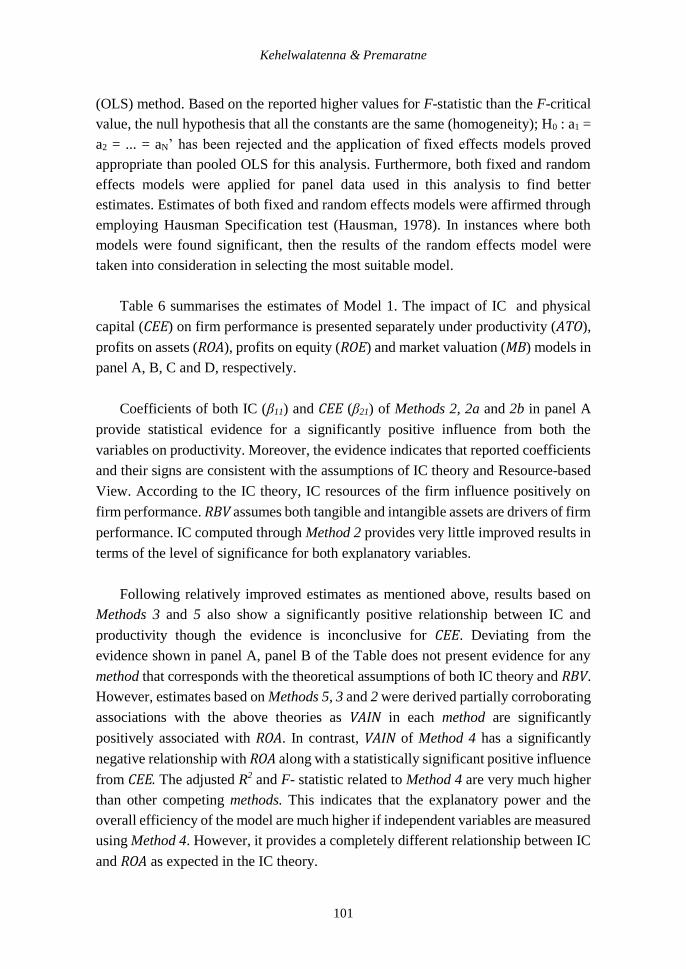
Kehelwalatenna & Premaratne
101
(OLS) method. Based on the reported higher values for F-statistic than the F-critical
value, the null hypothesis that all the constants are the same (homogeneity); H0 : a1 =
a2 = ... = aN’ has been rejected and the application of fixed effects models proved
appropriate than pooled OLS for this analysis. Furthermore, both fixed and random
effects models were applied for panel data used in this analysis to find better
estimates. Estimates of both fixed and random effects models were affirmed through
employing Hausman Specification test (Hausman, 1978). In instances where both
models were found significant, then the results of the random effects model were
taken into consideration in selecting the most suitable model.
Table 6 summarises the estimates of Model 1. The impact of IC and physical
capital (CEE) on firm performance is presented separately under productivity (ATO),
profits on assets (ROA), profits on equity (ROE) and market valuation (MB) models in
panel A, B, C and D, respectively.
Coefficients of both IC (β11) and CEE (β21) of Methods 2, 2a and 2b in panel A
provide statistical evidence for a significantly positive influence from both the
variables on productivity. Moreover, the evidence indicates that reported coefficients
and their signs are consistent with the assumptions of IC theory and Resource-based
View. According to the IC theory, IC resources of the firm influence positively on
firm performance. RBV assumes both tangible and intangible assets are drivers of firm
performance. IC computed through Method 2 provides very little improved results in
terms of the level of significance for both explanatory variables.
Following relatively improved estimates as mentioned above, results based on
Methods 3 and 5 also show a significantly positive relationship between IC and
productivity though the evidence is inconclusive for CEE. Deviating from the
evidence shown in panel A, panel B of the Table does not present evidence for any
method that corresponds with the theoretical assumptions of both IC theory and RBV.
However, estimates based on Methods 5, 3 and 2 were derived partially corroborating
associations with the above theories as VAIN in each method are significantly
positively associated with ROA. In contrast, VAIN of Method 4 has a significantly
negative relationship with ROA along with a statistically significant positive influence
from CEE. The adjusted R2 and F- statistic related to Method 4 are very much higher
than other competing methods. This indicates that the explanatory power and the
overall efficiency of the model are much higher if independent variables are measured
using Method 4. However, it provides a completely different relationship between IC
and ROA as expected in the IC theory.
Colombo Business Journal 10(1), 2019
102
Table 6: Estimates of the Model 1 (t-statistics are in Parentheses)
Model 1 : 𝑌𝑖𝑡 = 𝛽01 + 𝛽11𝑉𝐴𝐼𝑁𝑖𝑡 + 𝛽21𝐶𝐸𝐸𝑖𝑡 + 𝜀𝑖𝑡
Panel A: Productivity (ATO)
M - 1R M - 2R M - 2aR M - 2bR M - 3R M - 4F M - 5R M - 6R
𝛽01 -0.0002a -0.0003a -0.0002a -0.0002a -0.0002a -0.0003a -0.0002a -0.0002a
𝛽11 0.00001
(1.64)
0.0001b
(2.20)
0.0001b
(2.10)
0.0001b
(2.06)
0.0001b
(2.24)
0.00001
(1.34)
0.0001a
(2.67)
0.00001
(1.18)
𝛽21 0.0029c
(1.93)
0.0004a
(2.96)
0.0003c
(1.92)
0.0004a
(2.83)
0.0007
(1.02)
0.030b
(2.01)
0.0006
(0.98)
0.0006
(1.03)
Ad R2 0.03 0.03 0.03 0.03 0.03 0.02 0.03 0.03
F-stat 6.74a 6.95a 6.80a 6.92a 6.73a 1.70a 6.78a 6.64a
Panel B: Profitability (ROA)
M - 1F M - 2F M - 2aF M - 2bF M - 3F M - 4F M - 5F M - 6F
𝛽01 0.001a 0.001a 0.001a 0.001a 0.001a -0.0008a 0.001a 0.001a
𝛽11 0.00001
(0.71)
0.0001a
(2.60)
0.00001
(1.06)
0.0001c
(1.87)
0.0001b
(2.18)
-0.0001b
(-2.03)
0.0001b
(2.31)
0.00001
(1.56)
𝛽21 0.005
(1.24)
0.0001
(0.52)
0.0003
(0.80)
0.0002
(0.64)
0.0001
(1.35)
0.39a
(7.17)
0.001
(1.36)
0.001
(1.36)
Ad R2 0.07 0.07 0.07 0.07 0.07 0.27 0.07 0.07
F-stat 4.09a 4.1a 4.09a 4.10a 4.10a 13.7a 4.1a 4.09a
Panel C: Profitability (ROE)
M - 1R M - 2F M - 2aF M - 2bF M - 3R M - 4F M - 5F M - 6R
𝛽01 0.005b -0.12a -0.04a -0.09a -0.001 -0.02 -0.02 0.008a
𝛽11 0.003a
(7.94)
-0.00001
(-0.37)
-0.0001
(-0.91)
-0.0008
(-1.63)
0.003a
(9.79)
0.004
(1.29)
0.006b
(2.08)
0.0014a
(6.41)
𝛽21 0.123a
(8.52)
0.99a
(11.28)
1.05a
(39.55)
0.035a
(29.54)
0.21a
(3.91)
4.48
(1.36)
0.19
(0.97)
0.21a
(3.90)
Ad R2 0.02 0.07 0.09 0.08 0.02 0.06 0.03 0.017
F-stat 6.15a 11.0a 8.43a 2.39a 5.56a 3.59a 2.38a 4.35a
Panel D: Market valuation (MB)
M - 1R M - 2F M - 2aF M - 2bF M - 3R M - 4F M - 5R M - 6R
𝛽01 -0.01b 0.038 0.01 0.03 -0.005 0.013 -0.0001 -0.009b
𝛽11 -0.001c
(-1.71)
-0.001
(-1.25)
-0.0001
(-0.18)
0.0001
(0.18)
-0.002a
(-2.65)
-0.001
(-0.84)
-0.002a
(-3.39)
-0.0008b
(-2.08)
𝛽21 -0.42c
(-1.91)
-0.333
(-1.59)
-0.41a
(-2.90)
-0.40b
(-2.29)
-0.09
(-0.94)
-3.96
(-1.24)
-0.088
(-0.88)
-0.091
(-0.95)
Ad R2 0.09 0.10 0.13 0.11 0.09 0.08 0.09 0.10
F-stat 21.04a 5.25a 6.10a 5.8a 21.07a 4.29a 21.18a 21.00a
Notes: 1. R and F denote that estimates are based on random effects model and fixed effects model, respectively
2. a, b, and c denote significance levels p < 0.01, p < 0.05 and p < 0.1, respectively. 3. Regression results for ATO and MB models are based on 8,595 firm-quarters, and ROA and ROE models
on 8,786 firm-quarters.
4. Reported t-statistics of fixed effects models are based on White (1980) standard errors
Kehelwalatenna & Premaratne
103
Unlike in the ATO model, Methods 2, 2a and 2b do not provide supportive
evidence for a positive association between IC and ROE despite being the best
methods to establish the association between CEE and ROE (see panel C of Table 6).
The explanatory variables drawn through Methods 1, 3 and 6 stands as better
alternatives, theoretically acceptable as well, to calculate IC and CEE to estimate the
association between IC and ROE. In contrast, the estimates based on the variables
identified in Method 5 provides only a significantly positive association between IC
and ROE, whereas, variables based on Method 4 do not show any conclusive
association.
The key observation on coefficients presented under panel D of Table 6 is that all
statistically significant coefficients bear negative signs, indicating both IC and
physical assets have a negative impact on market valuation (MB). Results based on
Methods 5, 3 and 6 (see panel D) provide relatively better evidence compared to other
estimates on the association between IC and MB. The reported coefficients are
significantly negative in these models and there is no evidence to conclude the impact
of CEE on MB. Alternatively, the associations based on variables in Method 1 show
significantly negative coefficients for both the variables.
Discussion and Conclusion
This study commenced with a review of existing studies (i.e. Pulic, 1998a, 2001,
2002a, b; Firer & Williams, 2003; Yalama & Coskun, 2007; Calisir et al., 2010;
Komnenic & Pokrajcic, 2012; Ting & Lean, 2009; Chen et al., 2005; Tan et al., 2007;
Clarke et al., 2011) which adopted the VAIC method to compute IC of the firm. The
review enabled the authors to categorise the existing approaches of the VAIC method
into five categories (methods). The categorisation was based on the differences in
assumptions used in adopting the method for past studies. Furthermore, the study
carried out an additional review to highlight the limitations of the VAIC method. A
modification for the existing mechanism for computing IC in the VAIC method was
then suggested in Method 6. The modification focused on a key omission in the part
of value creating agencies of the method. Subsequently, the suggested modification
replaced the contemporaneous agreement on human capital, structural capital and
relational capital as components of IC (Cabrita & Bontis, 2008; Nazari & Herremans,
2007; Tayles et al., 2007) with already amalgamated value creating avenues (i.e.
human capital and structural capital as per Bontis, 2004; Edvinsson, 1997; Edvinsson
& Malone, 1997) in the existing VAIC method. This can be considered as a main
contribution of this study. The identified inconsistencies and the suggested

Colombo Business Journal 10(1), 2019
104
modification were empirically tested to find out the actual impact of them on IC
performance estimations, using the data of banking firms listed on the NYSE.
The value addition (VA) which is undoubtedly the predominant variable of the
VAIC method, is positioned at the lowest level in Methods 1, 2a and 4 as used in Pulic
(1998a, 2001, 2002a, b), Ahangar (2011), Yalama and Coskun (2007), and Clarke et
al. (2011). These methods adopt VA as suggested in Pulic’s basic VAIC method (Pulic,
1998a, 2001, 2002a, b). Results of the current study show that VA in Pulic’s basic
method places at the lowest level among the identified six different methods in the
study. In contrast, the modified VAIC method in the current study (Method 6) places
VA at the highest level among all six VAIC methods referred to in this study. The
Method 6 includes all possible VA sources (i.e. retained earnings, total staff cost,
interest paid, depreciation and amortisation, tax paid and dividends) as identified in
the stakeholder theory. Furthermore, the VA of Method 6 stands slightly higher than
that of Methods 2, 3 and 5 appear in Firer and Williams (2003), Chen et al. (2005),
and Clarke et al. (2011), because Method 6 includes the total staff cost as the VA to
employees but the other methods consider only wages and salaries.
Despite the fact that VA has been identified in three different approaches, human
capital (HC), another important input variable of the VAIC method, is recognised in
two ways. They are; total personnel expenses (Chen et al., 2005), and the total of
wages and salaries (Firer & Williams, 2003). However, the distribution of the two
types of HC variables and the correlation between them (ρ = 0.999 [not tabulated])
indicates that no difference is caused when incorporating HC in the VAIC method
using either way. CE, the remaining input variable of the VAIC method, is distributed
in an identical manner in Methods 1, 3, 4, 5 and 6. The distribution of CE in Method
2 and its Sub-Methods 2a and 2b has a different pattern as these methods include book
value of net assets to represents CE, which is very much lower than the approach in
the other methods. The created values (i.e. SC, HCE, SCE, CEE, VAIN and VAIC) in
Pulic’s basic method (Method 1) used in Pulic (1998a, 2001, 2002a, b) are reportedly
the lowest. The reason for this pattern is that Method 1 includes VA at the minimum
level compared to other methods despite inputting HC and CE at the maximum level
amongst all VAIC methods. In contrast, Methods 2 and 5 adopted in Firer and Williams
(2003) and Clarke et al. (2011), respectively provide the upper boundary for SC, HCE,
SCE, VAIN and VAIC; and Method 2 sets the upper boundary for CEE. These upper
levels are formulated through the inclusion of VA at a higher level in Methods 2 and
5 and by including CE at the lowest level in Method 2.
Kehelwalatenna & Premaratne
105
Based on correlation analysis, IC value of each VAIC method have significant
positive relationships with productivity (ATO), profitability (ROA and ROE) and
market valuation (MB), except for the association between IC of Method 1 used in
Pulic (1998a, 2001, 2002a, b) and ROA. However, the reported correlations are weak
positive in each occasion. Nevertheless, IC calculated in Methods 2 and 5 adopted in
Firer and Williams (2003) and Clarke et al. (2011) accounts for marginally higher
correlations with firm performance. Regression estimates on the impact of IC
measured in each method and productivity (ATO) of the firm reveal that both IC and
CEE computed using Methods 2, 2a and 2b in Firer and Williams (2003), Ahangar
(2011) and Yalama and Coskun (2007), Calisir et al. (2010), Komnenic and Pokrajcic
(2012) and Ting and Lean (2009) have a significant positive influence on ATO. In
addition to these, IC measured in Methods 3 and 5 in Chen et al. (2005) and Clarke
et al. (2011) is associated with ATO in a significant and positive manner as well,
though CEE has an inconclusive association. However, the mechanism used in
Methods 2, 2a and 2b to compute CEE needs to be understood before using them to
compute IC and CEE. The estimated impact of IC on ROA by drawing explanatory
variables through Methods 2, 3 and 5 in Firer and Williams (2003), Chen et al. (2005)
and Clarke et al. (2011) indicate that estimated effects are partially corroborated with
theoretical assumptions of the IC theory. In this respect, only IC is related to ROA in
a significant and positive manner and the effect of CEE is inconclusive. In contrast,
IC of Method 4 (Tan et al., 2007) has a significant negative impact on ROA. Hence, it
is worthwhile to note that inconsistencies of the VAIC method cause different effects
on the ROA association. Methods 1, 3 and 6 are appropriate alternatives to calculate
IC and CEE for the ROE model because both variables influence ROE significantly
and positively. In contrast, computation of IC and CEE variables using Method 4
seems to be least effective for the ROE model. Method 2 along with its sub-methods
calculates variables in a way that it reports a strong association between CEE and ROE
but not a conclusive association between IC and ROE. However, all the reported
significant influences of IC on MB are negative and IC in each occurrence is computed
through Methods 1, 3, 5 and 6. The study is novel in its effort to test empirically the
impact of varied applications of the VAIC method on the relationship between IC and
firm performance, and it further suggests modifying the present VAIC method to
match with theoretically agreed value compositions of IC.
This study is not without its limitations. The study considered only the varied
applications of the VAIC method for measuring IC and ignored other methods to
measure IC as they are different from each other both conceptually and
Colombo Business Journal 10(1), 2019
106
computationally. Since the study considered only selected main deviating
applications of the VAIC it ignores some minor differences of the VAIC applications.
Hence, future research can be carried out to address the above limitations. Further,
the present study did not include control variables in the regression model. Therefore,
future researchers may include possible control variables such as firm size and firm
leverage in adopting the regression model of this study specially in estimating the
contemporaneous relationship between IC and firm performance.
Declaration of Conflicting Interests
The authors declared no potential conflicts of interest with respect to the research,
authorship, and publication of this article.
References
Abdulsalam, F., Al-Qaheri, H., & Al-Khayyat, R. (2011). The intellectual capital
performance of Kuwaiti banks: An application of VAIC model. iBusiness, 3, 88-
96. doi:10.4236/ib.2011.31014
Abeysekera, I. (2003). Intellectual Accounting Scorecard - Measuring and reporting
intellectual capital. Journal of American Academy of Business, 3(1&2), 422-427.
Abeysekera, I. (2007). Intellectual capital reporting between a developing and
developed nation. Journal of Intellectual Capital, 8(2), 329-345.
doi:10.1108/14691930710742871
Ahangar, R. G. (2011). The relationship between intellectual capital and financial
performance: An empirical investigation in an Iranian company. African Journal
of Business Management, 5(1), 88–-95. doi:10.5897/AJBM10.712
Alhassan, A. L., & Asare, N. (2016). Intellectual capital and bank productivity in
emerging markets: Evidence from Ghana. Management Decision, 54(3), 589-
609. doi:10.1108/MD-01-2015-0025
Al-Twaijry, A. (2009). Intangible assets and future growth: Evidence from Japan.
Asian Review of Accounting, 17(1), 23-39. doi:10.1108/13217340910956496
Amir, E., & Lev, B. (1996). Value -relevance of non-financial information: The
wireless communications industry. Journal of Accounting and Economics, 22(1-
3), 3-30. doi:10.1016/S0165-4101(96)00430-2
Andriessen, D. (2004). Making sense of intellectual capital: Designing a method for
the valuation of intangibles. Burlington, MA: Elsevier Butterworth-Heinemann.
Appuhami, B. (2007). The impact of intellectual capital on investors' capital gains on
shares: An empirical investigation of Thai banking, finance and insurance sector.
International Management Review, 3(2), 14-25.
Kehelwalatenna & Premaratne
107
Bala, A. J., Raja, A. S., & Dandgo. K. I. (2019). The mediating effect of intellectual
capital on corporate governance and performance of conglomerates in Nigeria.
SEISENSE Journal of Management, 2(3), 16-29. doi:doi:10.33215/sjom.v2i3.109
Bontis, N. (2001). Assessing knowledge assets: A review of the models used to
measure intellectual capital. International Journal of Management Reviews, 3(1),
41-60. doi:10.1111/1468-2370.00053
Bontis, N. (2004). National intellectual capital index: A united nations initiative for
the Arab region. Journal of Intellectual Capital, 5(1), 13-39.
doi:10.1108/14691930410512905
Bontis, N., Janosevic, S., & Dzenopoljac, V. (2015). Intellectual capital in Serbia’s
hotel industry. International Journal of Contemporary Hospitality Management,
27(6), 1365-1384. doi:10.1108/IJCHM-12-2013-0541
Bontis, N., Keow, W. C. C., & Richardson, S. (2000). Intellectual capital and business
performance in Malaysian industries. Journal of Intellectual Capital, 1(1), 85-
100. doi:10.1108/14691930010324188
Bornemann, M. (1999). Potential of value systems according to the VAIC method.
International Journal of Technology Management, 18(5), 463-475.
doi:10.1504/IJTM.1999.002781
Bourne, M., Mills, J., Wilcox, M., Neely, A., & Platts, K. (2000). Designing,
implementing and updating performance measurement systems. International
Journal of Operations and Production Management, 20(7), 754-771.
doi:10.1108/01443570010330739
Cabrita, M. D. R., & Bontis, N. (2008). Intellectual capital and business performance
in the Portuguese banking industry. International Journal of Technology
Management, 43(1-3), 212-237. doi:10.1504/IJTM.2008.019416
Calisir, F., Gumussoy, C. A., Bayraktaroglu, A. E., & Deniz, E. (2010). Intellectual
capital in the quoted Turkish ITC sector. Journal of Intellectual Capital, 11(4),
537-553. doi:10.1108/14691931011085678
Chan, K. H. (2009). Impact of intellectual capital on organizational performance: An
empirical study of companies in the Hang Seng Index (part 1). The Learning
Organization, 16(1), 4-21. doi:10.1108/09696470910927641
Chang, W. S., & Hsieh, J. J. (2011). Intellectual capital and value creation - Is
innovation capital a missing link. International Journal of Business and
Management, 6(2), 3-12. doi:10.5539/ijbm.v6n2p3
Chen, M-C., Cheng, S-J., & Hwang, Y. (2005). An empirical investigation of the
relationship between intellectual capital and firms' market value and financial
performance. Journal of Intellectual Capital, 6(2), 159-176.
doi:10.1108/14691930510592771

Colombo Business Journal 10(1), 2019
108
Chu, S. K. W., Chan, K. H., & Wu, W. W. Y. (2011). Charting intellectual capital
performance of the gateway to china. Journal of Intellectual Capital, 12(2), 249-
276. doi:10.1108/14691931111123412
Chung, K.H., & Pruitt, S.W. (1994). A simple approximation of Tobin’s q. Financial
Management, 23, 70-74. doi:10.2307/3665623
Clarke, M., Seng, D., & Whiting, R. H. (2011). Intellectual capital and firm
performance in Australia. Journal of Intellectual Capital, 12(4), 505-530.
doi:10.1108/14691931111181706
Davis, J. H., Schoorman, F. D., & Donaldson, L. (1997). Towards a stewardship
theory of management. Academy of Management Review, 22(1), 20-47.
doi:10.5465/amr.1997.9707180258
Dawes, J. (2000). Market orientation and company profitability: Further evidence
incorporating longitudinal data. Australian Journal of Management, 25, 173-200.
doi:10.1177/031289620002500204
D'Hulster, K. (2009). The leverage ratio. Retrieved from
www.worldbank.org/financialcrisis/pdf/levrage-ratio-web.pdf
Dorweiler, V., & Yakhou, M. (2005). A scorecard on intellectual capital performance
in the economy. The Journal of American Academy of Business, 7(1), 322-326.
Dumay, J. C. (2012). Grand theories as barriers to using IC concepts. Journal of
Intellectual Capital, 13(1), 4-15. doi:10.1108/14691931211196187
Dumay, J., C., & Tull, J. A. (2007). Intellectual capital disclosure and price-sensitive
Australian stock exchange announcements. Journal of Intellectual Capital, 8(2),
236-255. doi:10.1108/14691930710742826
Dzinkowski, R. (2000). The measurement and management of intellectual capital: An
introduction. Management Accounting: Magazine for Chartered Management
Accountants, 78(2), 32-36.
Edvinsson, L. (1997). Developing capital at Skandia. Long Range Planning, 30(3),
366-373. doi:10.1016/S0024-6301(97)00016-2
Edvinsson, L., & Malone, M. (1997). Intellectual capital: Realizing your company's
true value by finding its hidden brainpower. New York: Harper Business.
El-Tawy, N., & Tollington, T. (2010). Applying artefact-based criteria to the
recognition of "organizational" assets. Journal of Intellectual Capital, 11(4), 451-
480. doi:10.1108/14691931011085632
Firer, S., & Williams, S. M. (2003). Intellectual capital and traditional measures of
corporate performance. Journal of Intellectual Capital, 4(3), 348-360.
doi:10.1108/14691930310487806
Forte, W., Tucker, J., Matonti, G., & Nicolò, G. (2017). Measuring the intellectual
capital of Italian listed companies. Journal of Intellectual Capital, 18(4), 710-
732. doi:10.1108/JIC-08-2016-0083

Kehelwalatenna & Premaratne
109
Frankel, R., & Lee, C. M. C. (1998). Accounting valuation, market expectation, and
cross-sectional stock returns. Journal of Accounting and Economics, 25, 283-319.
v10.1016/S0165-4101(98)00026-3
Gangi, F., Salerno, D., Meles, A., & Daniele, L. M. (2019). Do corporate social
responsibility and corporate governance influence intellectual capital efficiency?
Sustainability, 11(7), 1-25. doi:10.3390/su11071899
Gelb, D. S., & Siegel, P. (2000). Intangible assets and corporate signalling. Review of
Quantitative Finance and Accounting, 76(2), 307-323.
doi:10.1023/A:1012046823636
Ghosh, S., & Mondal, A. (2009). Indian software and pharmaceutical sector IC and
financial performance. Journal of Intellectual Capital, 10(3), 369-388.
doi:10.1108/14691930910977798
Ghosh, D., & Wu, A. (2007). Intellectual capital and capital markets: Additional
evidence. Journal of Intellectual Capital, 8(2), 216-235.
doi:10.1108/14691930710742817
Goebel, V. (2015). Estimating a measure of intellectual capital value to test its
determinants. Journal of Intellectual Capital, 16(1),101-120. doi:10.1108/JIC-
12-2013-0118
Goh, P. C. (2005). Intellectual capital performance of commercial banks in Malaysia.
Journal of Intellectual Capital, 6(3), 385-396. doi:10.1108/14691930510611120
Goh, P. C., & Lim, K. P. (2004). Disclosing intellectual capital in company annual
reports: evidence from Malaysia. Journal of Intellectual Capital, 5, 500-510.
doi:10.1108/ 14691930410550426
Guthrie, J., Petty, R., & Johanson, U. (2001). Sunrise in the knowledge economy:
Managing, measuring and reporting intellectual capital. Accounting, Auditing and
Accountability Journal, 14(4), 365-385. doi:10.1108/EUM0000000005869
Hasan, R., Mohammad, N., & Alam, M. (2017). Impact of intellectual capital on
profitability - Conventional versus Islamic banks. Journal of Accounting,
Finance and Auditing Studies, 3(2), 64-80.
Hansen, G. S., & Wernerfelt, B. (1989). Determinants of firm performance: The
relative importance of economic and organizational factors. Strategic
Management Journal, 10(5), 399-411. doi:10.1002/smj.4250100502
Hausman, J. A. (1978). Specification tests in econometrics. Econometrica, 46(6),
1251-1271. doi:10.2307/1913827
Hejazi, R., Ghanbari, M., & Alipour, M. (2016). Intellectual, human and structural
capital effects on firm performance as measured by Tobin's Q. Knowledge and
Process Management. 23(4), 259-273. doi:10.1002/kpm.1529
Housel, T. J., & Nelson, S. K. (2005). Knowledge valuation analysis: Applications
for organizational intellectual capital. Journal of Intellectual Capital, 6(4), 544-
557. doi:10.1108/14691930510628816

Colombo Business Journal 10(1), 2019
110
Im, K. S., Pesaran, M. H., & Shin, Y. (2003). Testing for unit roots in heterogeneous
panels. Journal of Econometrics, 115(1), 53-74. doi:10.1016/S0304-
4076(03)00092-7
Kamath, G. B. (2007). The intellectual capital performance of Indian banking sector.
Journal of Intellectual Capital, 8(1), 96-123. doi:10.1108/14691930710715088
Kamath, G. B. (2008). Intellectual capital and corporate performance in Indian
pharmaceutical industry. Journal of Intellectual Capital, 9(4), 684-704.
doi:10.1108/14691930810913221
Kamath, G. B. (2015). Impact of intellectual capital on financial performance and
market valuation of firms in India. International Letters of Social and Humanistic
Sciences, 48, 107-122. doi:10.18052/www.scipress.com/ILSHS.48.107
Kaplan, R. S., & Norton, D. P. (2004). The strategy-focused organization. Boston:
Harvard Business School Press
Komnenic, B., & Pokrajcic, D. (2012). Intellectual capital and corporate performance
of MNCs in Serbia. Journal of Intellectual Capital, 13(1), 106-119.
doi:10.1108/14691931211196231
Kujansivu, P., & Lonnqvist, A. (2007). Investigating the value and efficiency of
intellectual capital. Journal of Intellectual Capital, 8(2), 272-287.
doi:10.1108/14691930710742844
Laing, G., Dunn, J., & Hughes-Lucas, S. (2010). Applying the VAIC model to
Australian hotels. Journal of Intellectual Capital, 11(3), 269-283.
doi:10.1108/14691931011064545
Lev, B. (2001). Intangibles: Management, measurement, and reporting. Washington:
The Brookings Institution.
Linda, M. R., Rasyid, R., & Megawati. (2017). Intellectual capital and firm's
performance: An empirical evidence from Islamic Bank in Indonesia. Research
& Reviews: Journal of Social Sciences, 3(3),139-148.
Maditinos, D., Chatzoudes, D., Tsairidis, C., & Theriou, G. (2011). The impact of
intellectual capital on firm's market value and financial performance. Journal of
Intellectual Capital, 12(1), 132-151. doi:10.1108/14691931111097944
Maji, S. G., & Goswami, M. (2016). Intellectual capital and firm performance in
emerging economies: The case of India. Review of International Business and
Strategy, 26(3), 410-430. doi:10.1108/RIBS-03-2015-0019
Marr, B., Schiuma, G., & Neely, A. (2004). The dynamics of value creation: Mapping
your intellectual performance drivers. Journal of Intellectual Capital, 5(2), 312-
325. doi:10.1108/14691930410533722
Mavridis, D. G. (2004). The intellectual capital performance of the Japanese banking
sector. Journal of Intellectual Capital, 5(1), 92-115. doi:10.1108/
14691930410512941
Kehelwalatenna & Premaratne
111
Mavridis, D. G. (2005). Intellectual capital performance determinants and
globalization status of Greek listed firms. Journal of Intellectual Capital, 6(1),
127-140. doi:10.1108/14691930510574708
Mehralian, G., Rajabzadeh, A., Sadeh, M. R., & Rasekh, H. R. (2012). Intellectual
capital and corporate performance in Iranian pharmaceutical industry. Journal of
Intellectual Capital, 13(1), 138-158. doi:10.1108/14691931211196259
Moon, C. W., & Lado, A. A. (2000). MNC- host government bargaining power
relationship: A critique and extension within the resource-based view. Journal of
Management, 26(1), 85-117. doi:10.1177/014920630002600108
Morariu, C. M. (2014). Intellectual capital performance in the case of Romanian
public companies. Journal of Intellectual Capital, 15(3), 392-410.
doi:10.1108/JIC-05-2014-0061
Nassar, S. (2018). The impact of intellectual capital on firm performance of the
Turkish real estate companies before and after the crisis. European Scientific
Journal, 14(1), 29-45. doi:10.19044/esj.2018.v14n1p29
Nazari, J. A., & Herremans, I. M. (2007). Extended VAIC model: Measuring
intellectual capital components. Journal of Intellectual Capital, 8(4), 595-609.
doi:10.1108/14691930710830774
Ohlson, J. A. (1995). Earnings, book value, and dividends in equity valuation.
Contemporary Accounting Research, 11(2), 661-687. doi:10.1111/j.1911-
3846.1995.tb00461.x
Pal, K., & Soriya, S. (2012). IC performance of Indian pharmaceutical and textile
industry. Journal of Intellectual Capital, 13(1), 120-137.
doi:10.1108/14691931211196240
Pulic, A. (1998a). Measuring the performance of intellectual potential in knowledge
economy. Retrieved from http://www.vaic-on.net
Pulic, A. (1998b). Measuring the performance of intellectual potential in knowledge
economy. Paper presented at 2nd World Congress on Measuring and Managing
Intellectual Capital, McMaster University, Hamilton.
Pulic, A. (2000a). VAIC- an An accounting tool for IC management. International
Journal of Technology Management, 20(5-78), 702-714.
doi:10.1504/IJTM.2000.002891
Pulic, A. (2000b). MVA and VAIC analysis of randomly selected companies from
FTSE250. Retrieved from http://www.vaic-on.net
Pulic, A. (2001). Value creation efficiency analysis of Croatian banks 1996-2000.
Retrieved from http://www.vaic-on.net
Pulic, A. (2002a). National IC- efficiency report of Croatian economy. Retrieved
from http://www.vaic-on.net
Pulic, A. (2002b). Do we know if we create or destroy value. Retrieved from
http://www.vaic-on.net

Colombo Business Journal 10(1), 2019
112
Riahi-Belkaoui, A. (2003). Intellectual capital and firm performance of US
multinational firms. Journal of Intellectual Capital, 4(2), 215-226.
doi:10.1108/14691930310472839
Rodov, I., & Leliaert, P. (2002). FiMIAM: Financial method of intangible assets
management. Journal of Intellectual Capital, 3(3), 323-336.
doi:10.1108/14691930210435642
Roos, J., Roos, G., Dragonetti, N. C., & Edvinsson, L. (1997). Intellectual capital:
Navigating in the new business landscape. Palgrave Macmillan UK.
Sveiby, K. (1997). The new organizational wealth - Managing and measuring
knowledge-based assets. San Francisco: Berret-Koehler Publishers, Inc.
Sveiby, K. (2010). Method of measuring intangible assets. Retrieved from
http://www.sveiby.com/articles/IntangibleMethods.htm
Shiu, H. J. (2006). The application of value added intellectual coefficient to measure
corporate performance: Evidence from technological firms. International
Journal of Management, 23(2), 356-365.
Soetanto, T., & Liem, P. F. (in press). Intellectual capital in Indonesia : Dynamic
panel approach. Journal of Asia Business Studies. doi:10.1108/JABS-02-2018-
0059
Stahle, P., Stahle, S., & Aho, S. (2011). Value added intellectual coefficient (VAIC):
A critical analysis. Journal of Intellectual Capital, 12(4), 531-551.
doi:10.1108/14691931111181715
Tan, H. P., Plowman, D., & Hancock, P. (2007). Intellectual capital and financial
returns of companies. Journal of Intellectual Capital, 8(1), 76-95.
doi:10.1108/14691930710715079
Tayles, M., Pike, R. H., & Sofian, S. (2007). Intellectual capital, management
accounting practices and corporate performance. Accounting, Auditing and
Accountability Journal, 20(4), 522-548. doi:10.1108/09513570710762575
Ting, I. W. K., & Lean, H. H. (2009). Intellectual capital performance of financial
institutions in Malaysia. Journal of Intellectual Capital, 10(4), 588-599.
doi:10.1108/14691930910996661
Tsai, H., & Hua, M. (2006). Can intellectual capital powerfully explain the stock price
of electronic companies? Taiwan Academy of Management Journal, 6(2), 237-
250
Tseng, D.C.Y., & Goo, Y.J. J. (2005). Intellectual capital and corporate value in an
emerging economy: Empirical study of Taiwanese manufacturers. R&D
Management, 35(2), 187-201. doi:10.1111/j.1467-9310.2005.00382.x
Tseng, K.-A., Lin, C.-I., & Yen, S.W. (2015). Contingencies of intellectual capitals
and financial capital on value creation: moderation of business cycles. Journal of
Intellectual Capital, 16(1),156-173. doi:10.1142/S0219649217500174
Kehelwalatenna & Premaratne
113
Wall, A., Kirk, R., & Martin, G. (2004). Intellectual capital: Measuring the
immeasurable. CIMA Publishing, Elsevier.
White, H. (1980). A heteroskedasticity-consistent covariance matrix estimator and a
direct test for heteroskedacity. Econometrica, 5(2), 171-180.
doi:10.2307/1912934
Yalama, A., & Coskun, M. (2007). Intellectual capital performance of quoted banks
on the Istanbul stock exchange market. Journal of Intellectual Capital, 8(2), 256-
271. doi:10.1108/14691930710742835
Yilmaz, I., & Acar, G. (2018). The effects of intellectual capital on financial
performance and market value: Evidence from Turkey. Eurasian Journal of
Business and Economics, 11(21), 117-133. doi:10.17015/ejbe.2018.021.07
Zeghal, D., & Maaloul, A. (2010). Analysing value added as an indicator of
intellectual capital and its consequences on company performance. Journal of
Intellectual Capital, 11(1), 39-60. doi:10.1108/14691931011013325
Zhicheng, L., Zhuoer, C., Shing, L. T. T., & Wah, C. S. K. (2016). The impact of
intellectual capital on companies’ performances: A study based on MAKE Award
winners and non-MAKE Award winner companies. Procedia Computer Science,
99, 181–194. doi:10.1016/j.procs.2016.09.110