dividend clienteles: a global investigation -...
TRANSCRIPT
Dividend Clienteles: A Global Investigation
Pawan Jaina, Quentin C. Chub,*
a Department of Finance and Law, College of Business Administration, Central Michigan
University, Mount Pleasant, MI 48859
b Department of Finance, Insurance and Real Estate, Fogelman College of Business and
Economics, The University of Memphis, Memphis, TN 38152
Abstract
We compare the cross-sectional variation in the dividend payout policies of companies
across 32 countries. Beyond the impact of firm-specific accounting and financial variables, this
study investigates how the country level variations: shareholder demand due to demographic
variations and consumption needs, agency problems manifested in the extent of minority
shareholder protection and business disclosures, and market quality in terms of transparency and
liquidity; affect the dividend payout policies. We find that firms have generous dividend payout
policies when diverse shareholder demands are strong, extents of business disclosures and legal
protections are weak, and the market qualities are poor. The empirical evidence supports the
presence of strong dividend clienteles in a global setting.
Keywords: Dividend, International, Clientele, Agency costs, Market quality.
JEL Classification: G15, G35, H25
*Corresponding Author. Voice: 901-678-4643 Fax: 901-678-1714, Email: [email protected]
2
Dividend Clienteles: A Global Investigation
I. Introduction
Miller and Modigliani (1961) established that, in a frictionless world, when the
investment policy of a firm is held constant, the dividend payout policy is irrelevant for
shareholder wealth. Higher dividend payouts lead to lower earnings retained and hence, lower
capital gains, and vice versa, leaving the total wealth of the shareholders unchanged. In empirical
studies using accounting and market data, dividend payout policy has been related to firm-
specific variables, such as net income, cash flows, and firm size.1 However, the observed
dividend payouts are more likely to be the results of premeditated financial decisions which
consider factors beyond firm-specific accounting and financial variables.
We compare the cross-sectional variation in the dividend payout policies of companies
across 32 countries. The measurements of dividend payout policy include dividend yield,
dividend payer, and dividend initiation.2 Beyond the impact of firm-specific accounting and
financial variables, this study investigates how the country level variations, such as shareholder
demand due to demographic variations and consumption needs, agency problems manifested in
the extent of minority shareholder protection and business disclosures, and market quality in
terms of transparency and liquidity; affect the dividend payout policies.
As a departure from the conventional supply-based theory of corporate payout policy,
Becker, Ivkovic, and Weisbenner (2011) propose a demand-based theory and use local senior as
a proxy for shareholder demand. They find that corporations respond to the preferences of their
shareholders when setting the payout policy. Our study extends Becker et al. demand-based
1 See Allen and Michaely (2003) 2 The three measurements are defined in Appendix A.
3
theory to an international setting and investigates whether shareholder demand measured at a
country level helps explain individual firms’ dividend payouts across countries. In addition, we
analyze several other proxy variables such as proportion of government expenditure on health,
proportion of foreign investment in domestic stock markets, and domestic investor
overconfidence, to capture the different dimensions of shareholder demand for dividends.3
Another popular explanation is that dividend payouts address agency problems between
corporate insiders and outside shareholders (Easterbrook, 1984). The explanation stresses that
unless profits are paid out to shareholders, they may be diverted by the insiders for personal use
or committed to unprofitable projects that provide private benefits to the insiders. Additionally,
due to the divergence of interests between insiders and outsiders, the former often process and
trade on information about firm’s shares values, making profits at the expense of the outside
shareholders. Dividends may then act as a signaling mechanism as it is a costly to replicate
vehicle for conveying private information to capital market (Easterbrook, 1984; La Porta et al.,
2000; Dennis and Osobov, 2008; Brockman and Unlu, 2009; 2011; Kuo, 2012). However, most
of the studies testing the agency explanation for dividend payouts use La Porta et al. (1998) Anti-
Director Right Index (ADRI). We extend this literature by testing the agency hypothesis using a
more reliable ADRI index, revised by Spamann (2010), and the extent of business disclosure
index, provided by the World Bank.
Asymmetric information and ease of trading in capital markets provide alternate
explanations for dividend policy. Banerjee, Gatchev, and Spindt (2007) document that the firms
with less liquid common stocks are more likely to pay cash dividends. The asymmetric
3 All the variables used in this study are defined in Appendix A.
4
information explanation for dividends would predict that the firms headquartered in a country
with opaque capital markets will have to rely on generous dividend payouts to establish their
reputation. We test these predictions by analyzing the effect of stock market liquidity and stock
price informativeness on dividend payout policy.
We find that firms respond to the tendency of older investors to hold dividend-paying
stocks in combination with individual investors’ increased financial demands due to a low
government funding in health expenses. Firms also try to attract foreign investors by resorting to
a generous payout policy. We also find that less confident investors, as measured by index of
individualism (IDV) developed by Hofstede (2001), prefer dividends over capital gains.
Next we document that firms operating in countries with poor protection of minority
shareholders and low level of business disclosure pay higher dividends. Hence, dividends serve
as a substitute for effective legal protection, which enables firms in unprotected legal
environments to establish reputations for good treatment of investors through dividend payouts.
Hence, when shareholders face the potential exploitation due to weak shareholder protection, the
preference for dividend payments become stronger.
Further we show that firms headquartered in a country with poor market quality, which
has worse price informativeness due to reduced transparency, and low stock market liquidity;
pay higher dividends. The empirical evidence is consistent with the argument that shareholders
demand a higher dividend payout when the market quality is poor and the uncertainty
surrounding the future realization of capital gain increases.
Finally, we show that firms headquartered in countries with low tax rates on dividends
pay higher dividends relative to the companies headquartered in countries with high taxes on
5
dividends. The empirical results show that there exists a “tax preference” clientele among
investors across countries. Investors in lower tax countries have a preference for equities with
generous payout policy. In contrast, investors in higher tax countries prefer firms to retain cash
flow for investment and realize equity return through the appreciation of stock prices.
II. Hypotheses Development
In this study we test whether the shareholder demand for dividends, the agency costs, and
the stock market quality in a given country affects a firm’s payout policy. In this section we
motivate each of these factors and develop the testable hypotheses.
II.1. Shareholder demand for dividends
Becker, Ivkovic and Weisbenner (2011) find that, for the sample of US firms, shareholder
demand for dividends influences a firm’s payout policy. The authors capture the shareholder
demand for dividends by the fraction of 65 years old or older residents in the county where a
firm is headquartered.4,5 We extend this literature to an international setting and use proportion
of population who are 65 years old or older in a given country (Seniors) as a proxy for the
demand for dividends in that country and test the following hypothesis:
H1. Firms headquartered in countries with larger proportion of Senior population should
have a generous dividend payout policy.
4 The selection of the proxy for dividend demand is based on two streams of literature: first, Shefrin and Thaler
(1988) argue that seniors have a preference for dividend-paying stocks, and second, Huberman (2001) and Grinblatt
and Keloharju (2001), and Ivkovic and Weisbenner (2005) show that individual investors tend to hold stocks of
local firms. 5 Using data on the stock holdings of individual investors, Pettit (1977) and Lewellen, Stanley, Lease, and
Schlarbaum (1978) find that the correlation between dividend yield and age is significantly positive.
6
In addition, to capture different aspects of shareholder demand at the country level, we
include several other proxy variables such as proportion of government expenditure on health,
proportion of foreign investment in domestic stock markets, and domestic investor
overconfidence.
According the World Health Organization, health related expenditures are a major
expense for seniors. Countries across the globe have varying health care services funded by the
government which can drive the consumption needs of the Seniors. We test the following
hypothesis:
H2. Firms headquartered in countries with lower proportion of government expenditure on
health should have a generous dividend payout policy.
Empirical evidence on impact of foreign investment in the domestic stock markets on
dividend payout policy is mixed. Jeon, Lee and Moffett (2011) and Kang, Lee and Park (2010)
find that most foreign investors on Korean markets are institutional investors who maintain large
positions and serve as effective monitors of these firms, which results in higher dividend
payouts. While, Dhalquist and Robertsson (2001) find that foreign investors prefer firms paying
low dividends for Swedish firms as dividends are taxed at a higher rate than capital gains. We
participate in this debate by testing the following hypothesis:
H3. Firms headquartered in countries with higher proportions of equity ownership by
foreign investors should have a generous dividend payout policy.
Impact of investors behavioral biases generated due to cultural difference on dividend
payout policy has not been explored in the literature. Chui, Titman and Wei (2010) find that
Hofstede’s (2001) individualism index measuring investor overconfidence is positively
7
associated with trading volume.6 Van den Steen (2004) argues that when individuals are
overoptimistic about their abilities, they tend to overestimate the precision of their predictions.
Hence we argue that the overconfident investors would be indifferent between capital gains and
dividends while the less confident investors would have a preference for dividend payments.
Specifically, we test the following hypothesis:
H4. Firms headquartered in countries with lower score on individualism index should have
a generous dividend payout policy.
II.2. Agency Cost
Miller and Modigliani derive their dividend irrelevance proposition by ignoring the
agency cost between the owners and outside shareholders. Many researchers have challenged
this assumption and argued the relevance of dividend payout policy in addressing the agency
problems.
Two competing agency hypotheses—outcome model versus substitute model—are
outlined in La Porta et al. (2000) to describe the relationship between the shareholder rights and
dividend payouts. The outcome model hypothesizes that better shareholder rights lead to higher
dividend payouts because shareholders can exercise their legal powers to force firms to disgorge
the excess cash flows. In contrast, the substitute model argues that poor shareholder rights lead to
higher payouts because firms have stronger incentives to establish their reputation for fair
treatment. La Porta et al. find support for the outcome model using the Anti-Director Right Index
(ADRI) proposed by La Porta et al. (1998) as a measurement of shareholder protection.
6 Anderson, Fedenia, Hirschey, and Skiba (2011) present an excellent summary of 5 cultural dimensions provided by
Hofstede.
8
Spamann (2010) re-examines the procedure adopted by La Porta et al. (1998) in
developing the ADRI and finds that the original ADRI does not follow rigorous legal definitions.
To avoid the ambiguity in creating ADRI for individual countries, Spamann gets help from local
attorney in the respective countries and compiles a new ADRI. The reexamination of ADRI data
compilation procedure leads to more than two thirds corrections for the sample countries and the
correlation between corrected and original ADRI values is only 0.53. This study reexamines the
relationship between agency problems using the corrected ADRI and the Business Disclosure
index provided by the World Bank, and the dividend payout policy by testing the following
hypothesis:
H5. Firms headquartered in countries with better minority shareholder protection should
have a generous dividend payout policy.
II.3. Stock Market Quality
Miller and Modigliani’s (1961) dividend irrelevance proposition is based on the key
assumption that trading is frictionless. Hence, investors can instantly buy or sell any stock
without incurring any trading costs and price impact. If an investor prefers dividends, he can
create homemade dividends by selling a portion of his holdings in the firm. However, in real
world, an investor has to incur a cost for trading stocks. Using the data from US markets,
Banerjee, Gatchev, and Spindt (2007) argue that the stocks that pay cash dividends, satisfies
investors’ liquidity needs without any trading in the stock. As a result, investors with current or
anticipated future liquidity needs can avoid trading frictions by investing in dividend paying
stocks. Hence, there should be a negative relationship between liquidity and dividend payout
policy. In this study we use two different measures of liquidity. We measure transaction costs by
9
estimating the proportion of zero daily firm returns (Lesmond, Ogden and Trzcinka, 1999;
Bekaert, Harvey and Lundblad, 2007). To capture different dimension of liquidity we use
turnover ratio as measured by the total value of shares traded divided by the average market
capitalization (Lipson and Mortal, 2009). Using a comprehensive sample of firms from 32
countries we test the following hypothesis:
H6. Firms headquartered in countries with poor liquidity should have a generous dividend
policy.
Another key parameter of stock market quality is the level of market transparency. Miller
and Modigliani in their dividend irrelevance proposition assume complete market transparency.
In this perfect capital market investors have homogeneous expectations of a firm’s current and
future investment opportunities and cash flows. Hence, there exists a consensus about the firm’s
value which makes them indifferent between dividends and capital gains. However, the real
world markets are opaque (Jin and Myers, 2006) and there exist firm specific uncertainties. In
this case investors would show stronger preference for dividends than future capital gains when
the asymmetric information becomes more severe and the market becomes more opaque
(Bhattacharya, 1979; Lee, 2011). We formulate these theoretical predictions by testing the
following hypothesis:
H7. Firms headquartered in countries with opaque stock markets should have a generous
dividend payout policy.
We use stock price informativeness (Jin and Myers, 2006) as a measure of level of stock
market transparency in a given country. Based on Roll’s (1988) Presidential address on 𝑅2, Jin
and Myers (2006) show that, for a sample of firms from 40 countries, stock price
10
informativeness, as measured by one minus coefficient of determination from country specific
market models around the world, is significantly positively related to the stock market
transparency.
III. Data Description and Methodology
The global investigation becomes feasible when the expanded global databases become
readily available and new measurements are documented in finance literature addressing the
issues of shareholder demand, agency problems, and market quality.7 The first sub-section
describes the data sources and the measurement of the country level explanatory variables as
well as the firm level control variables. The second and the third sub sections explain the
measures of the stock price informativeness and the market liquidity, respectively. Summary
statistics are reported in the fourth sub-section. Appendix A describes all the variables used in
the analyses.
III.1. Data Description
We compile data from several sources. Stock price, dividend yield and firm-level
accounting information such as, net income, cash, market-to-book ratio, debt, market value, and
total assets come from Datastream. We download data for all the firms in all the 48 countries for
which Spamann (2010) provides the Anti-Director Rights Index (ADRI) for the years 1997 and
2005. From this original universe, we eliminate firms with dividend yield of greater than 20%
7 World Bank Database, DataStream, International Monetary Fund’s (IMF) Coordinated Portfolio Investment
Survey (CPIS), Investor overconfidence index, OECD tax database, and Hofstede’s cultural dimensions.
11
and select top 100 firms for each country based on market capitalization.8,9 We also control for
the monthly returns averaged over the preceding 3 year period and return volatility for each firm,
which is the variance of monthly stock returns over the preceding 3 years.
To capture different aspects of shareholder demand at the country level, we include proxy
variables such as proportion of population 65 years old or older in a given country (Seniors),
percentage of government expenditure on health (Government Health Expense), proportion of
foreign equity investment in the domestic stock markets (FPI), and an index of individualism
(IDV) developed by Hofstede (2001), which measures investor overconfidence and self-
attribution bias (Chui, Titman and Wei, 2010).
Demographic data on seniors at the country level come from the World Bank. We also
obtain the data on the government expenditure on health, stock trading turnover ratio and the
extent of business disclosure for each of the sample countries from the World Bank database.
Foreign equity investment in the domestic stock markets is provided by the Coordinated
Portfolio Investment Survey (CPIS) database from the International Monetary Fund (IMF) data
library. Data on investor overconfidence as measured by the investors’ individualism scores are
obtained from Hofstede’s website.10
We use Antidirector Rights Index (ADRI) (Spamann, 2010) and extent of business
disclosure to capture the agency problem between the minority shareholders and owner
managers. The ADRI comes from Spamann (2010), and reflects such aspects of minority rights
8 Dividend yield had extreme outliers and we removed those data from our final analysis. Dividend yield of 20%
represents the 99.5th percentile. Our results are robust to alternate cutoffs for the variable (we tested our results for
cutoffs ranging from 10%-30%) 9 We select top 100 firms to create a balanced sample among countries. Our results hold for the full sample of firms
from DataStream. 10 http://geerthofstede.nl/index.aspx
12
as the ease of voting for directors, the possibility of electing directors through a cumulative
voting mechanism, the existence of grievance mechanism for oppressed minority shareholders,
such as a class action lawsuit, the percentage of votes needed to call a special shareholder
meeting, and the existence of preemptive rights. Since this index is available only for years 1997
and 2005, we restrict our analysis to these years with most of our analyses focusing on the data
from the more recent year, 2005. Extent of business disclosure index measures the financial and
operational transparency of businesses in a given country. This index is based on a survey
conducted by the World Bank and the scores vary between zero and ten.
We use country-level data on taxes in some of the analysis. Data on tax rates are obtained
from the Organization for Economic Co-operation and Development (OECD) Tax Database,
which provides effective tax rates on distribution of domestic source of income to a resident
individual shareholder in each country. We use the Net Dividend Tax, which is the top marginal
statutory personal income tax rate imposed on dividend income after taking account imputation
systems, tax credits, and tax allowances in each country. 11
We merge the data from the various data sources and the unmatched firms were deleted
from the final analyses. We delete the countries with less than 35 firms from our final analysis
that reduces our sample to 2,975 firms from 32 countries.
III.2. Stock Price Informativeness
We calculate our measure of stock price informativeness using a two-factor international
model as in Morck, Yeung, and Wu (2000) to include both the local and U.S. market index
11 Under a classical system (like in the U.S.), profits are first taxed at the corporate level, and then after corporate tax
profits are taxed again at the shareholder level when that income is distributed to them as a dividend. Under an
imputation system (whether in full or just partial), part or all of the corporate income tax paid by a company on its
profits is credited against the personal income tax liability of the shareholders

13
returns. This model is also used by Fernandes and Ferreira (2009) and has the following
specifications:
𝑟𝑗,𝑡 = ∝𝑗+ 𝛽1𝑗𝑟𝑚,𝑡 + 𝛽2𝑗𝑟𝑈𝑆,𝑡 + 𝜀𝑗,𝑡 (1)
where 𝑟𝑗,𝑡 is the firm j return for month t, 𝑟𝑚,𝑡 is the domestic market index return, 𝑟𝑈𝑆,𝑡 is the
USA market index return during month t with,12
𝐶𝑜𝑣(𝑟𝑚,𝑡, 𝜀𝑗,𝑡) = 𝐶𝑜𝑣(𝑟𝑈𝑆,𝑡, 𝜀𝑗,𝑡) = 0. (2)
Our measure of informativeness is 1 −𝑅𝑗2of equations (1). Given the bounded nature of
R2, we conduct our tests using the following logistic transformation of 1 −𝑅𝑗2 outlined in
Fernandes and Ferreira (2009):
𝜓𝑗 = log (1 −𝑅𝑗
2
𝑅𝑗2 ) (3)
Thus, 𝜓𝑗 measures firm-specific stock return variation relative to market-wide variation,
or lack of synchronicity with the market. To conduct our country-level study, we list 𝜓𝑗 across
firms for each country. The median 𝜓𝑗 in the list represents the price informativeness for a
country. A higher median value derived from all firms in a country means more informativeness
for that country.
III.3. Measures of Liquidity
One of the problems with an international study is that the data from certain countries are
of relatively poor quality, and detailed transaction data (for example, bid-ask spreads or market
impact estimates) are not widely available (Bekaert, Harvey and Lundblad, 2007). To take care
12 In a separate analysis we used world market index return from Morgan Stanley Capital International (MSCI)
database to calculate the informativeness measure. We obtained qualitatively similar results to the one presented
using USA market index return.
14
of this problem we rely on the incidence of observed zero daily returns in these markets.
Lesmond et al. (1999) argue that if the value of an information signal is insufficient to outweigh
the costs associated with transacting, then market participants will elect not to trade, resulting in
an observed zero return. The advantage of this measure is that it requires only a time series of
daily equity returns. Given the paucity of time-series data on preferred measures such as bid-ask
spreads or bona-fide order flow used in Kyle (1985), this measure is an attractive empirical
alternative as documented by Bekaert, Harvey and Lundblad (2007).
Our second measure of liquidity is the turnover ratio reported for every country by the
World Bank. This ratio is the total value of shares traded divided by the average market
capitalization.
III.4. Descriptive Statistics
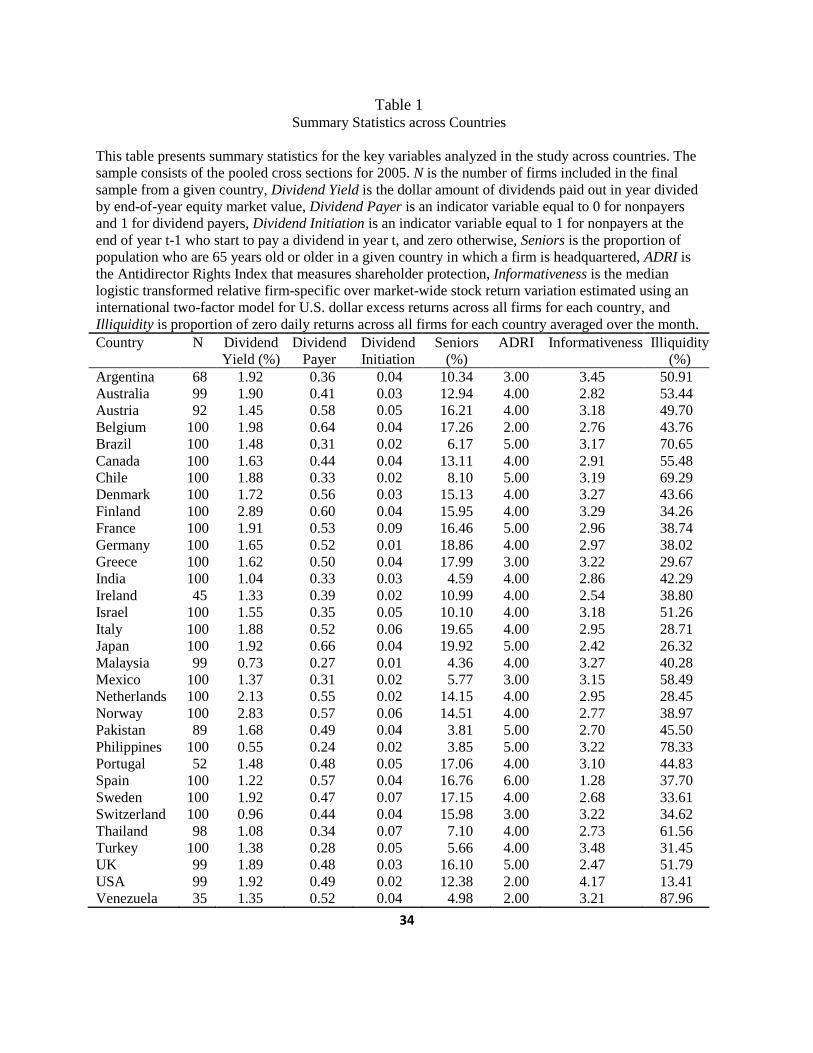
Table 1 reports the 32 countries included in the analysis with the descriptive statistics on
the key variables across countries. We find that Finland had the highest average dividend yield
(2.89%), Japan had the largest proportion of firms paying dividends (66%) while France had the
largest proportion of firms initiating dividends (9%) during the sample period. Japan had the
highest proportion of senior population (19.92%) during 2005. The USA had the worst
shareholder protection (ADRI) and the most liquid stock market while Spain had the most
opaque stock market during the sample period.
\\\\\ Insert Table 1 about here \\\\\
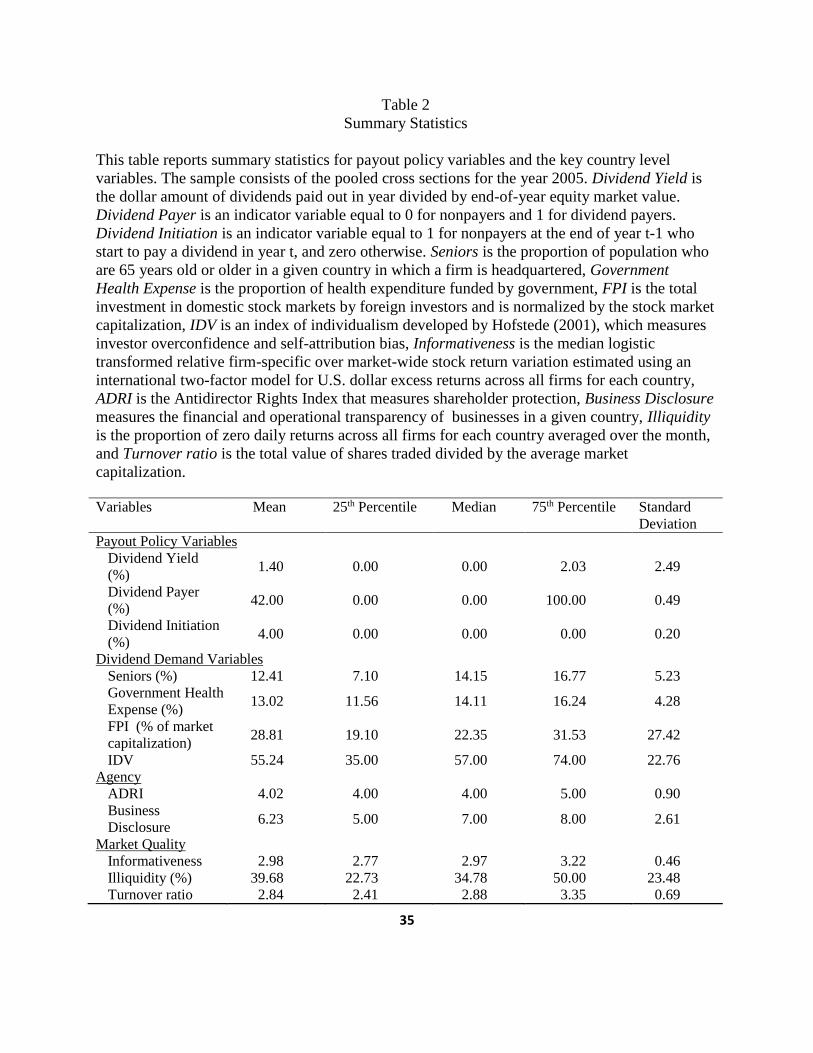
Table 2 summarizes the descriptive statistics for the key explanatory variables included in
the study. We observe that a typical firm included in the sample pays about 1.40% dividends per
year. About 42% of the sample firms paid dividends during the period under investigation while
15
4% of the sample firms initiated dividends in 2005. An average sample country has about 12% of
population classified as seniors, with the mean government expenditure on health of about 13%.
Foreign equity investment comprises of about 29% of domestic market capitalization of a typical
sample country’s stock market and the individualism score for typical investor is 55.24 on a scale
of 1 through 100. The average minority shareholder protection as measured by ADRI index is
4.02 on a scale of 1 through 6 and the average level of business disclosure is 6.23 on a scale of 1
through 10. Average informativeness and illiquidity scores are 2.98 and 39.68% respectively
while the turnover ratio is about 2.84 times the market capitalization.
\\\\\ Insert Table 2 about here \\\\\
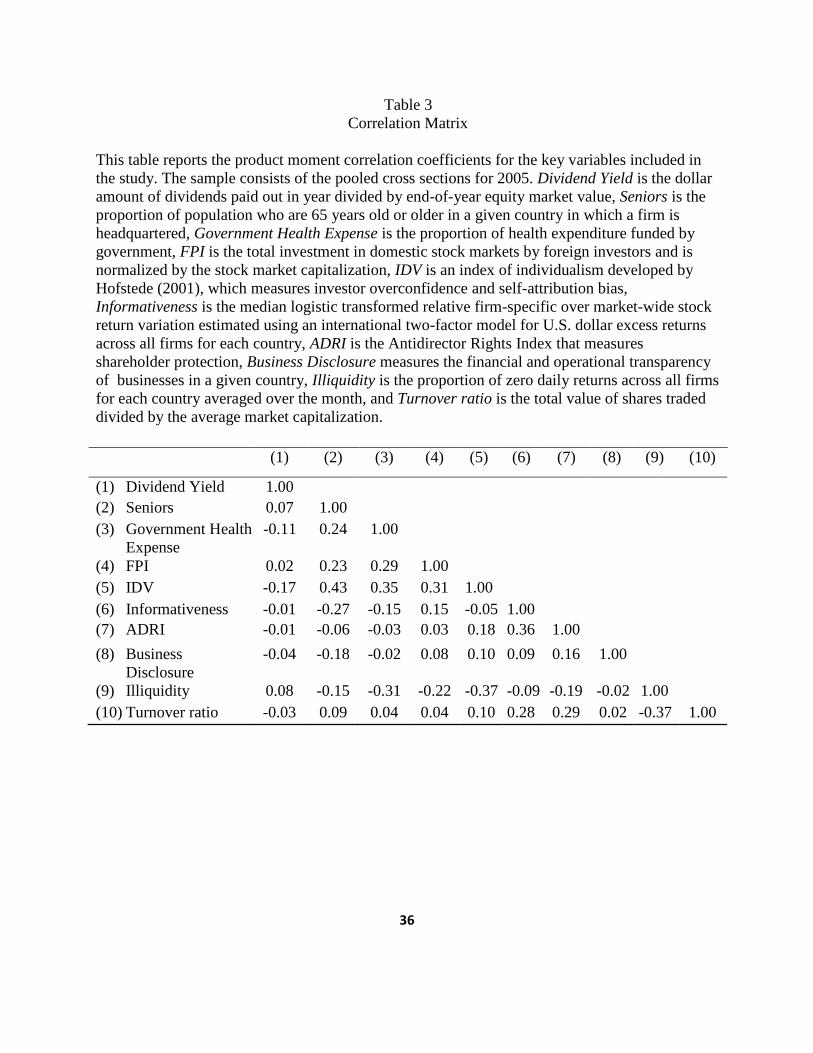
Table 3 presents the Pearson’s product moment correlation coefficients among the key
variables included in the study. We find that the Seniors is positively related Dividend Yield.
Hence, a firm headquartered in a country with larger proportion of senior population pays higher
dividend. We also find that Dividend Yield increases with low Government Health Expense,
high FPI, and low IDV. These results support our demand based explanation for dividends
summarized in Hypotheses 1 through 4. Table 3 also reports that Dividend Yield is higher for
firms headquartered in a country with a lower score for ADRI and Business Disclosure. These
results reject the outcome model for dividends and our Hypothesis 5. Hence, our results support
the substitute model for dividends. Finally we find that Dividend Yield is higher for firms
headquartered in a country with lower Informativeness, higher Illiquidity, and lower Turnover
Ratio. Hence, the Dividend Yield declines as the stock market quality of a given country
improves. These results support our market quality Hypotheses 6 and 7. Overall, the bivariate
16
results shows that investors demand higher dividends from a firm headquartered in a country
with strong shareholder demand, poor minority shareholder rights or poor market quality.
\\\\\ Insert Table 3 about here \\\\\
IV. Results
We analyze the factors that affect the payout policy. Dividend yield, dividend payer and
dividend initiation capture the payout policy of a firm. We analyze the three broad factors that
can influence the payout policy: investor demand for dividends, agency costs and stock market
conditions. Finally we analyze the impact of taxation on payout policy.
IV.1. Relationship between the payout policy and investor demand, agency costs and market
conditions.
We analyze the impact of the following three broad factors on the dividend payout
policy: (1) the local dividend demand determined by country specific demographics such as,
Seniors, Government Health Expense, FPI and IDV, (2) agency costs determined by ADRI index
and business disclosure index, and (3) stock market quality determined by price informativeness
and liquidity. We consider three measures of dividend payout policy: the dividend yield variable
(Dividend Yield), an indicator variable for paying dividends (Dividend Payer), and an indicator
variable for paying dividends conditional on having not paid dividends in the previous fiscal year
(Dividend Initiation). To analyze this relationship we use the following regression model:
DIVIDEND POLICYi,t = α1 + α2DEMANDit-1 + α3AGENCYit-1+ α4MARKET QUALITYit-1+
α5CONTROL VARIABLESit-1 + µi,t (4)
Our payout policy dependent variables, defined in the previous section, are measured one
year after the independent variables. Demand factors include: Seniors, which is the proportion of
17
population who are 65 years old or older in a given country in which a firm is headquartered;
Government Health Expense, which is the proportion of health expenditure funded by
government, as reported by the world bank; FPI, which is the total investment in domestic stock
markets by foreign investors and is normalized by the stock market capitalization; IDV, which is
an index of individualism developed by Hofstede (2001) as a measurement of investor
overconfidence and self-attribution bias.
Agency factors are ADRI, which is the Antidirector Rights Index that measures
shareholder protection; and Business Disclosure, that measures the financial and operational
transparency of businesses in a given country. Market Quality factors include Informativeness,
which is the median logistic transformed relative firm-specific over market-wide stock return
variation estimated using an international two-factor model for U.S. dollar excess returns across
all firms for each country; Illiquidity, which is the proportion of zero daily returns across all
firms for each country averaged over the month; and Turnover ratio, which is the total value of
shares traded divided by the average market capitalization.
In addition to these factors, the regressions also include firm-specific controls scaled by
the market value of the equity: Net Income, Cash, market-to-book ratio and Debt. Volatility
refers to the variance of monthly stock returns over the preceding 3 years. Return refers to
monthly stock returns over the preceding 3 years. Asset Growth is the logarithm of the growth
rate of assets over the prior year and Lagged Dividend Yield is the dividend yield during the
previous year.
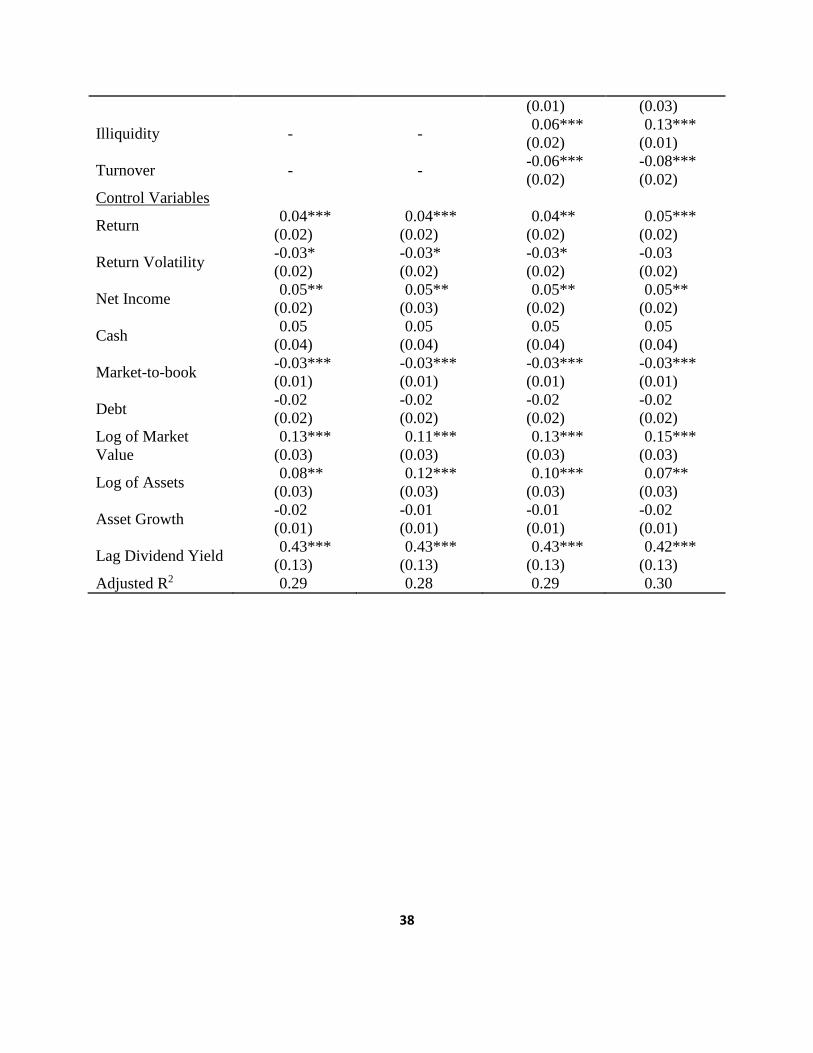
The results from these analyses are presented in the Tables 4 and 5. The Variance
Inflation Factors (VIFs) for all the variables are less than 5 hence, we do not have any
18
multicollinearity issues when including all the relevant explanatory variables together in one
regression model.13 The estimated coefficients pertaining to the firm-specific accounting and
financial variables, (control variables) line up with the prior expectations and the literature.
Return, net income, cash, and firm size (market value and total assets), all increase the dividend
yield and the probability of paying dividends, while return volatility, market-to-book ratio, debt,
and asset growth reduces the dividend yield and the likelihood of paying dividends.14 Positive
and statistically significant coefficient for lagged dividend yield shows the stickiness in the
payout policy.
IV.1.a. Demand based explanation
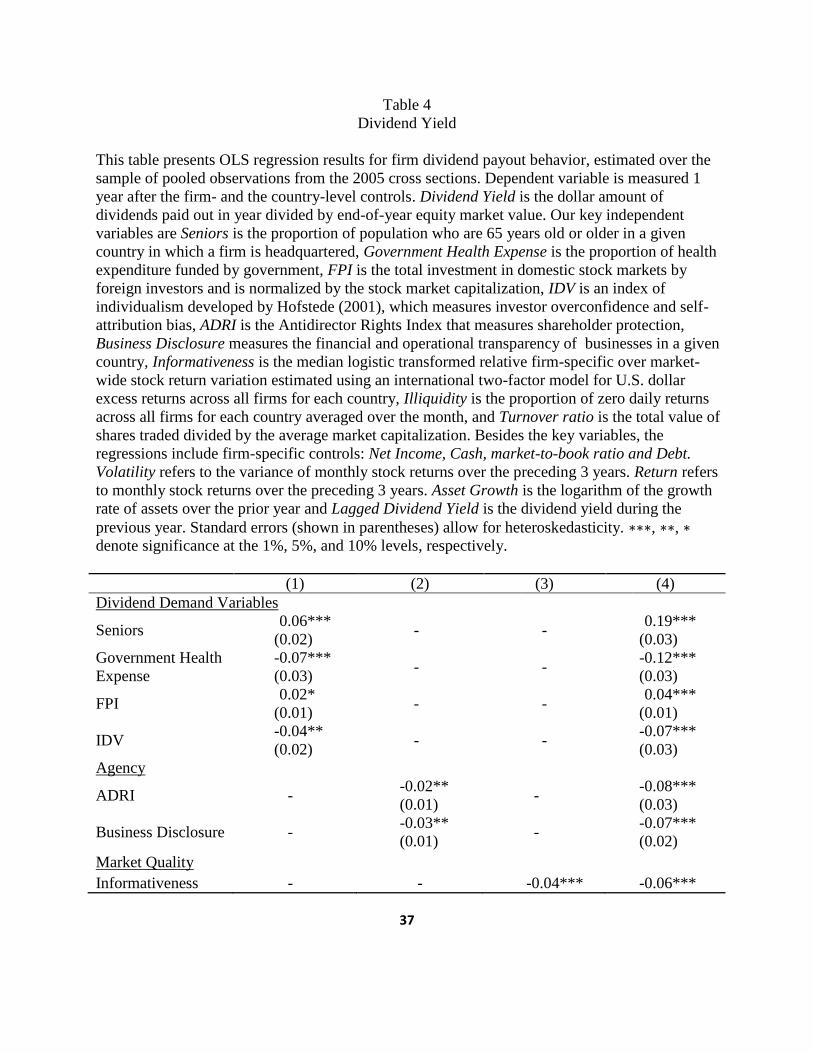
Table 4, Column (1) summarizes the results from a restricted model including only the
DEMAND factors and the control variables. All four of the DEMAND factors significantly
predict dividend yield. Seniors and foreign equity investment (FPI) are significantly positively
related to the dividend yield, while government expenditure on health and individualism (IDV)
are significantly negatively related to the payout policy. Column (4) summarizes the results
from the pooled regression analysis. A positive and statistically significant coefficient of 0.19 for
Seniors suggests that Dividend Yield increases by 0.19 standard deviations for every one standard
deviation increase in Seniors. Hence, firms headquartered in a country with larger Senior
population pays higher dividend than a firm headquartered in a country with lower Senior
population. This result is consistent with the findings in Becker et al. (2011) and supports our
Hypothesis 1.
13 For each independent variable, VIF is calculated as: 𝑉𝐼𝐹𝑖 = 1/(1 − 𝑅𝑖
2) (see Greene (2000) for more details) 14 Our results support Lee, Gupta, Chen, and Lee’s (2011) findings that dividend yield is negative related to firm’s
growth.
19
A negative and statistically significant coefficient of -0.12 for government health expense
suggest that with the decline in government health expenditure, personal out-of-pocket health
related expenses increases and the firms respond to this increased demand for dividends by
investors by paying generous dividends. Hence, we find support for our Hypothesis 2.
We also find a positive and statistically significant coefficient of 0.04 for FPI. Hence,
dividend yield also increases with the increase in the foreign equity investment. This result is
consistent with the findings in Jeon, Lee and Moffett (2011) and Kang, Lee and Park (2010) and
supports our Hypothesis 3. Finally we find that the dividend yield declines with the increase
investor individualism (IDV). Overconfident investors show the willingness to assume the
uncertainty associated with capital gains and hence reduce the demand for dividends. This result
is consistent with our Hypothesis 4.
\\\\\ Insert Table 4 about here \\\\\
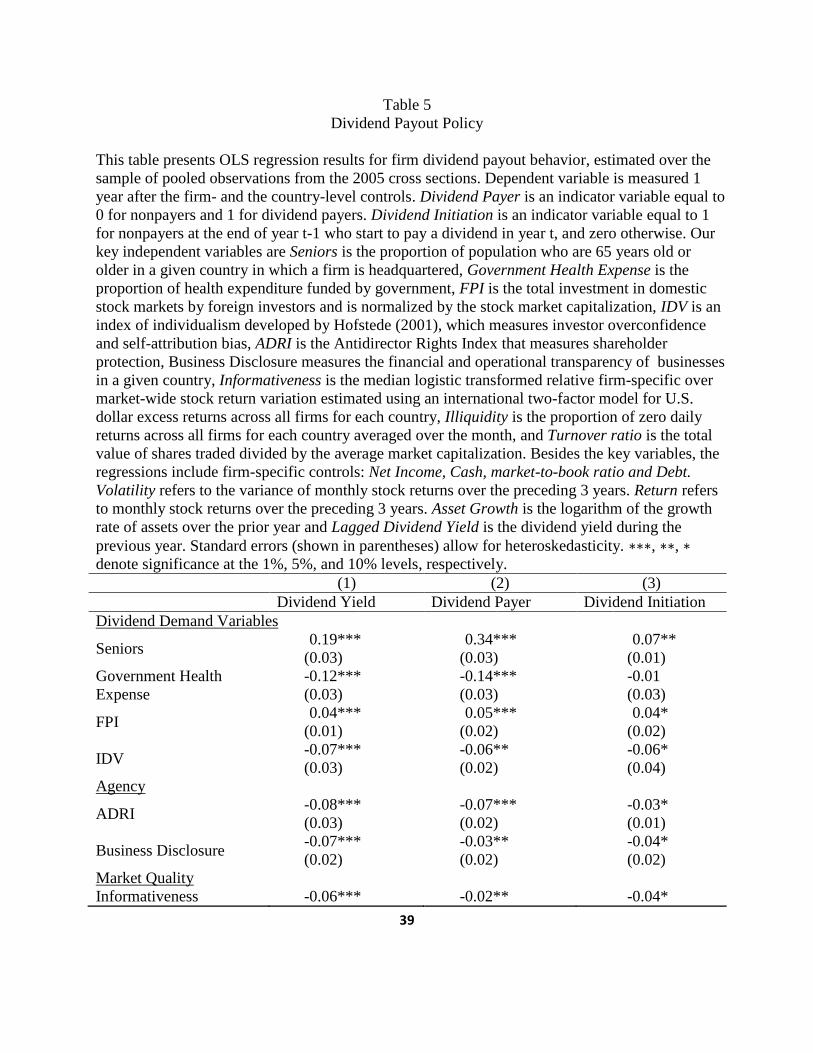
Results for our other payout policy variables, dividend payer and dividend initiation, are
summarized in columns (2) and (3) of Table 5. Column (1) in Table 5 is copied from column (4)
in Table 4 and used as a benchmark for comparison purpose. Column (2) summarizes the results
for the impact of demand factors on firm’s probability of dividend payments. In general, the
results in column (2) are qualitatively similar to the ones presented for dividend yield in column
(1). All the four demand factors are significant predictor of probability of a firm paying dividend.
We find that increase in both, the Senior population and foreign investors, increases the
probability of dividend payments while increase in government health expense and IDV
decreases the probability of dividend payments.
20
Results for our last payout policy variable, dividend initiation, are summarized in column
(3) of Table 5. The variability in the dividend initiation variable is smaller because few
nondividend payers in the year 2005 began to pay dividends in the year 2006 (only 4% of the
sample firms fall in this category). Three of the DEMAND factors, Seniors, FPI, and IDV,
significantly predict the dividend initiations.
\\\\\ Insert Table 5 about here \\\\\
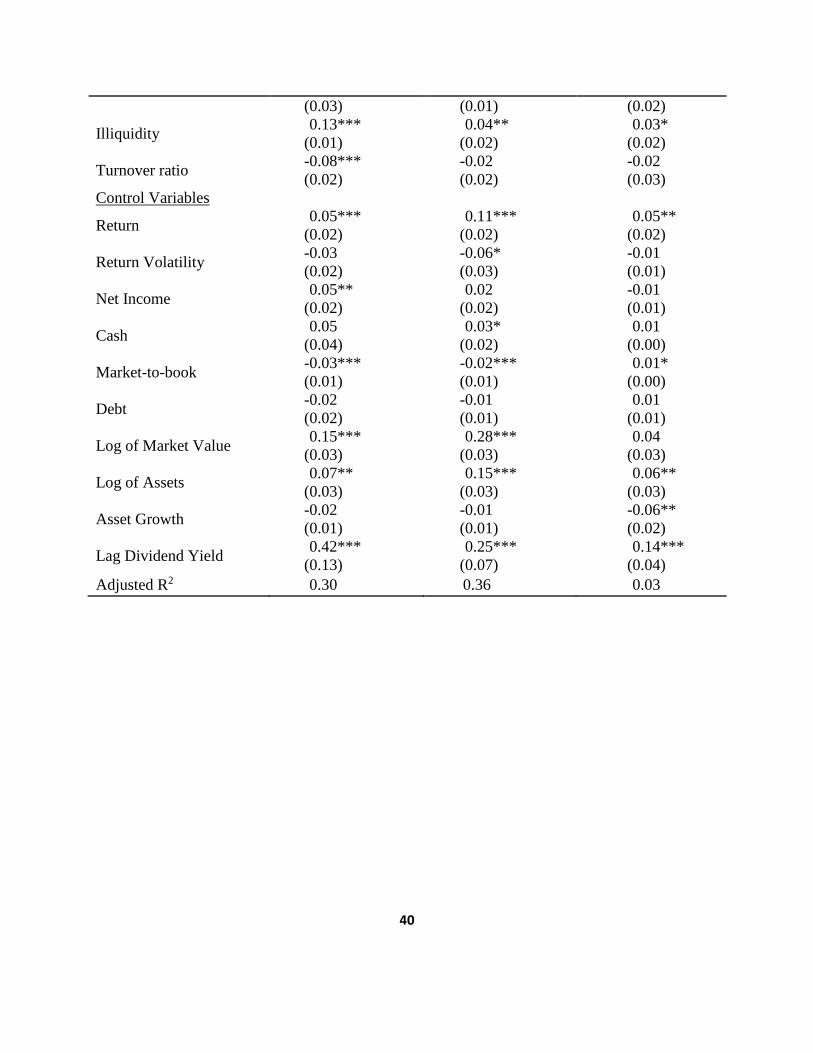
These results provide evidence of an effect of investor demand on dividend policy. The
estimated coefficients suggest an economically important relation between corporate payout
behavior and local dividend demand, particularly for dividend yield and dividend payer.
Although our findings are consistent with individual investor demand driving corporate
payout policy decisions, this clearly is not the only plausible interpretation of our results. We
consider potential alternative explanations in the following sub-sections.
IV.1.b. Explanation based on agency problems
Easterbrook (1984) argue that dividends help in reducing the agency problems between
the insiders and outside shareholders. La Porta et al. (2000) use the ADRI from La Porta et al.
(1998) as a proxy for this agency cost. The ADRI for the year 2005 is corrected and updated by
Spamann (2010). We analyze the agency explanation for dividends for more recent period and
using the corrected ADRI and business disclosure index provided by the World Bank.
Columns (2) and (4) in Table 4 summarize the impact of agency cost on the dividend
yield. We find a negative and statistically significant coefficient of -0.08 for ADRI and -0.07 for
Business Disclosure in column (4). These results suggest that firms operating in countries with
poor protection of minority shareholders and low business disclosure pay higher dividends. We
21
find qualitatively similar results for other two payout policy variables, dividend payer and
dividend initiation, as summarized in Table 5, columns (2) and (3). These results contradict the
findings of La Porta et al. (2000) and are inconsistent with our Hypothesis 5. Hence, our results
reject the outcome model but support the substitute model for dividends. We provide two
explanations for this contradiction. First, we consider a different time period than La Port et al.
(2000). The way the market operates has changed drastically between the two time periods [see
Jain, (2005) for more details]. Second, Spamann (2010) revised the La Porta et al (1998) ADRI
index and finds that the LLSV ADRI compiled by La Porta et al. does not follow rigorous legal
definition. To avoid the ambiguity in compiling ADRI, Spamann gets help from local attorney in
individual countries and compiles a new set of corrected ADRI. The revised measurement of
agency costs provides a new perspective on the relation between the dividend payout policy and
the agency problems.
In untabulated results, we analyzed the impact of ADRI on dividend yields for the year
1997 (same period as in La Porta et al. (2000)).We find support for La Porta et al. results for this
sample period and using the LLSV ADRI index from La Porta et al. (1998). When we used the
corrected index from Spamann for 1997, we find that the sign of the coefficient on ADRI is
consistent with the outcome model but not significant.
IV.1.c. Explanation based on market quality
Miller and Modigliani’s homemade dividend argument relies on the key assumptions of
complete transparency and frictionless trading. We test these predictions for markets with
varying degree of transparency and illiquidity. Table 4, column (3) summarizes the results for the
restricted model including only the market quality factors: the price informativeness and the
22
market liquidity, and the control variables. We find a negative and statistically significant
coefficient of -0.04 for informativeness which suggests that higher the informativeness, lower is
the dividend yield. Pooled regression results from column (4) show similar results and support
our Hypothesis 6.
We also find a statistically significant and positive coefficient for Illiquidity and negative
coefficient for Turnover in both, the restricted regression results (column (3)) and pooled
regression results (column (4)). These results suggest that firms headquartered in a country with
better stock market liquidity pay lower dividends. Hence, the results support our Hypothesis 7.
We find qualitatively similar results for the other two payout policy variables, dividend
payer and dividend initiation, summarized in Table 5, columns (2) and (3), except for Turnover,
which is not significant predictor for either the dividend payer or the dividend initiation. Hence,
the firms headquartered in a country with poor stock price informativeness and lower liquidity,
have a higher probability for dividend payments and dividend initiations.
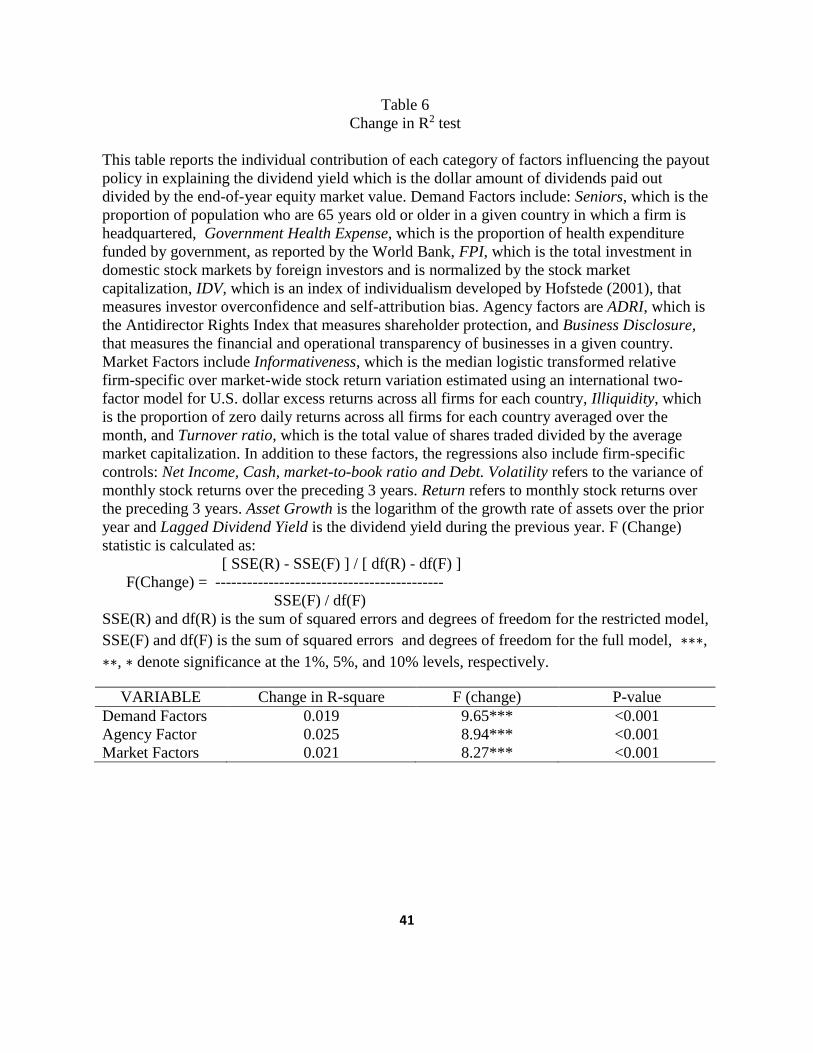
IV.2. Relative contribution of the individual factors
In order to measure the relative importance of each of the three factors: shareholder
demand, agency costs and market quality, in explaining the dividend yield, we calculate the
individual contribution of each of these factors to the R2 of the pooled dividend yield regression
summarized in Table 4, Column (4). Results from this analysis are summarized in Table 6. We
find that all the three factors have significant explanatory power for explaining the dividend
yields of the sample firms. We find that demand factors and market quality factors improve the
explanatory power for dividend yields by about 2% each, while the agency factors improve the
23
explanatory power for dividend yields by 2.5%, beyond what is explained by the firm specific
controls.
\\\\\ Insert Table 6 about here \\\\\
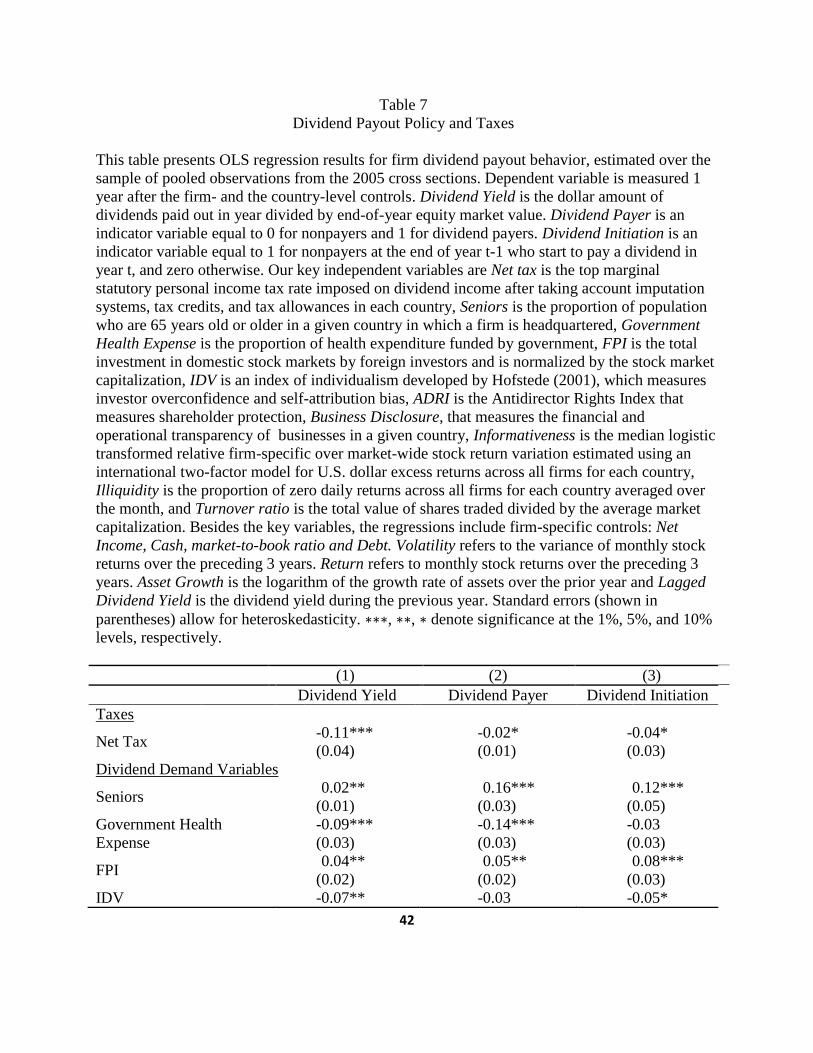
IV.3. Taxes and dividend payout policy
As our final analysis, we analyze the impact of taxes on dividend payout policy. The
empirical evidence of impact of taxes on dividend payout policy is ambiguous. Many researchers
have argued that changes in the tax rate on dividends have a significant effect on payout policy
(Elton and Gruber, 1970; Pettit, 1977; Perez-Gonzalez, 2003; and Graham and Kumar; 2006)
while others have found that taxes have no effect on dividend payout policy (Lewellen, Stanley,
Lease, and Schlarbaum, 1978; Grinstein and Michaely, 2005; and Barclay, Holderness and
Sheehan, 2009). Hence, the debate over the effect of taxes on dividend payout policy continued
unresolved. We participate in this debate and use the net dividend tax to measure the level of
taxes on dividends in each country. Since we have dividend tax information only for the
Organization for Economic Co-operation and Development (OECD) countries, for this analysis
we consider companies listed on 24 countries for which we can find the data on net tax rate on
dividends. The Net Dividend Tax is the top marginal statutory personal income tax rate imposed
on dividend income after taking account imputation systems, tax credits, and tax allowances in
each country.
The results from this analysis are summarized in Table 7. We find a negative and
statistically significant coefficient for Net Taxes for all the three dividend payout policy
variables. This result suggests that the higher the tax rate on dividends, the lower is the dividend
24
yield. We also find that probability of dividend payments and dividend initiations increases with
decline in the dividend tax rates.
\\\\\ Insert Table 7 about here \\\\\
V. Robustness Tests
V.1. Country fixed effects
A robust test with respect to heterogeneous error variance terms across countries is in
order. Stock prices within a country are subject to market disturbance and hence, their regression
disturbance terms for all firms in a country will be highly cross correlated. Ordinary least squares
estimators are unbiased but their variance-covariance matrix is inefficient. In estimating an
efficient covariance structure, White (1980) heteroscedasticity consistent estimator is applied to
control for both within country correlation and heteroscedasticity across countries. The
correlation among various residual terms from a country is allowed to change across countries.
The variance-covariance matrix for regression coefficients is estimated by
(𝑋′𝑋)−1 ∑ (𝑋𝑖′�̂�𝑖�̂�𝑖
′𝑋𝑖𝑖 )(𝑋′𝑋)−1 where X is the regression design matrix, Xi is the explanatory
variables for firms in the i-th country, �̂�𝑖 is residual vector estimated from ordinary least squares
regression model applied to firms in the i-th country. This exercise gives us results consistent
with the ones presented earlier. We find support for our result that all the three factors- investor
demand, agency costs and market quality, explain the dividend payout policy, although the
statistical significance for IDV regression coefficient weakens after the adjustment for within
country correlation and heteroscedasticity across countries.
25
V.2. Sample Selection
For the results presented thus far, we select top 100 stocks from each sample country
based on market capitalization. In untabulated results we also use total assets as selection
criterion and we get qualitatively similar results as the ones reported. Our results are also robust
to inclusion of all the firms available in Datastream from the 32 sample countries.
It might be argued that selecting top 100 firms based on market capitalization may bias
the results due to the presence of large capital markets, such as US, UK, and Japan. Hence,
instead of selecting top 100 firms from each country, we randomly select 100 firms from each of
the sample country. Our results are robust to this alternate sample selection process.15
V.3. Model Specifications
The results presented thus far are derived using the ordinary least squares regression
method. To test the robustness of our results to alternate model specifications, we estimate these
regressions using Tobit framework for Dividend Yield and Probit and Logit frameworks for
Dividend Payer and Dividend Initiation models. The results are reported in Table 8. We obtain
qualitatively similar results as the ones reported in Table 5. All the three factors, investor
demand for dividends, agency costs, and market quality, significantly predict dividend payout
policy and the coefficients have the same signs with similar statistical significance as reported in
Table 5.
\\\\\ Insert Table 8 about here \\\\\
15 Results are available on request.
26
VI. Conclusions
This paper uses a sample of firms from 32 countries around the world to analyze the
firm’s dividend payout policies. We take advantage of the diverse demographics, market quality
and different levels of legal protection of minority shareholders across these countries to
compare dividend policies of companies. Finally, we analyze the effect of taxes on dividend
payout policy.
Miller and Modigliani (1961) raise an important question of whether the firms set their
payout policies and investors sort accordingly, or whether companies set their payout policies in
response to the preferences of their current shareholders. In this paper, we provide evidence
consistent with the later argument. Specifically, we test for the effect of dividend demand on
payout policy. Firms seem to respond to the tendency of older investors to hold dividend-paying
stocks in combination with individual investors’ increased financial demands due to a low
government funding in health expenses. Firms also try to attract foreign investors by resorting to
a generous payout policy. We also find that overconfident investors, as measured by index of
individualism (IDV) developed by Hofstede (2001), reduce their demand for dividends.
Demographics thus provide an empirical proxy for dividend demand, which we exploit in this
paper to examine the broader question of whether the demand factors of current owners influence
corporate actions.
Next, we analyze the agency costs based explanation for payout policy. Agency costs are
captured by the extent of minority shareholder protection as measured by Anti-Director Right
Index (ADRI) and the level of business disclosure. We find that firms operating in countries with
poor protection of minority shareholders and low level of business disclosure pay higher
27
dividends. Unlike LaPorta et al. (2000) findings that support the outcome agency model, our
results support the substitute agency model for dividends. Dividends serve as a substitute for
effective legal protection, which enables firms in unprotected legal environments to establish
reputations for good treatment of investors through the dividend policies. We find that the reason
for this contradiction is the difference in the study periods covered by the two studies. Also,
Spamann (2010) argues that the LLSV ADRI compiled by La Porta et al. (1998) does not follow
rigorous legal definition. The findings are consistent with the intuition that when shareholders
face the potential exploitation due to weak shareholder protection, the demand for dividend
payments becomes stronger.
A country with good market quality has better price informativeness due to improved
transparency, and higher stock market liquidity. We test the effect of market quality on payout
policy and find that a firm headquartered in a country whose stock market is transparent and
liquid, pay lower dividends. Finally, we show that companies headquartered in countries with
low dividend tax rates pay higher dividends relative to the companies headquartered in countries
with high taxes on dividends.
Overall, our results support the presence of strong dividend clienteles. Firms
headquartered in countries with a lower proportion of senior citizens, generous universal health
care, higher investor overconfidence, lower proportion of foreign investors, lower agency costs, a
liquid and transparent market, and higher taxes have clients for firms with lower dividend
payouts.
Understanding dividend policy is important not only because of the amount of money
involved and the repeated nature of the decision, but also because payout policy is closely related

28
to, and interacts with most of the financial and investment decisions firms make (Allen and
Michaely, 2003). Synthesizing innovations in financial theories and measurements, this global
investigation of dividend clienteles substantiate the explanatory power of variables derived from
shareholder demand, agency problems, market quality and taxes.
29
References
Allen F, Michaely R (2003) "Payout policy" Handbook of the Economics of Finance in: G.M.
Constantinides and M. Harris & R. M. Stulz (ed.) Handbook of the Economics of Finance
edition 1 volume 1 chapter 7: 337-429 Elsevier.
Anderson CW, Fedenia M, Hirschey M, Skiba H (2011) Cultural influences on home bias and
international diversification by institutional investors. Journal of Banking and Finance
35: 916-934.
Banerjee S, Gatchev VA, Spindt PA (2007) Stock Market Liquidity and Firm Dividend Policy.
Journal of Financial and Quantitative Analysis 42: 369-397.
Barclay M, Holderness C, Sheehan D (2009) Dividends and corporate shareholders. Review of
Financial Studies 22: 2423-2455.
Becker B, Ivković Z, Weisbenner S (2011) Local dividend clienteles. Journal of Finance 66:
655-683.
Bekaert G, Harvey CR, Lundblad C (2007) Liquidity and expected returns: Lessons from
emerging markets. Review of Financial Studies 20: 1783-1831.
Bhattacharya S (1979) Imperfect Information Dividend Policy and "The Bird in the Hand
Fallacy." Bell Journal of Economics 10: 259-70.
Brockman P, Unlu E (2009) Dividend policy creditor rights and the agency costs of debt. Journal
of Financial Economics 92: 276-299.
Brockman P, Unlu E (2011) Earned/contributed capital dividend policy and accounting discourse
quality: An international study. Journal of Banking and Finance 35: 1610-1625.

30
Chui ACW, Titman S, Wei KCJ (2010) Individualism and momentum around the world. Journal
of Finance 65: 361–92.
Denis DJ, Osobov I (2008) Why do firms pay dividends? International evidence on the
determinants of dividend policy. Journal of Financial Economics 89: 62–82.
Dahlquist M, Robertsson G (2001) Direct foreign ownership institutional investors and firm
characteristics. Journal of Financial Economics 59: 413–440.
Easterbrook F (1984) Two agency-cost explanations of dividends. American Economic Review
74: 650-659.
Elton E, Gruber M (1970) Marginal Stockholder Tax Rates and the Clientele Effect. Review of
Economics and Statistics 52: 68–74.
Fernandes N, Ferreira MA (2009) Insider trading laws and stock price informativeness. Review
of Financial Studies 22: 1845-1877.
Graham J, Kumar A (2006) Do Dividend Clienteles Exist? Evidence on Dividend Preferences of
Retail Investors. Journal of Finance 61: 1305–36.
Greene W (2000) Econometric Analysis 4th ed. Prentice Hall Englewood Cliffs.
Grinblatt M, Keloharju M (2001) How distance language and culture influence stockholdings
and trades. Journal of Finance 56: 1053–1073.
Grinstein Y, Michaely R (2005) Institutional Holdings and Payout Policy. Journal of Finance
60:1389–426.
Hofstede G (2001) Culture’s consequences: Comparing values behaviors institutions and
organizations across Nations 2nd edition (Sage Publication: Beverly Hills CA)
Huberman G (2001) Familiarity Breeds Investment. Review of Financial Studies 14: 659-680.
31
Ivkovic Z, Weisbenner S (2005) Local does as local is: Information content of the geography of
individual investors' common stock investments. Journal of Finance 60: 267-306.
Jain PK (2005) Financial market design and the equity premium: Electronic versus floor trading.
Journal of Finance 60: 2955–2985.
Jeon JQ, Lee C, Moffett CM (2011) Effects of foreign ownership on payout policy: Evidence
from the Korean market. Journal of Financial Markets 14: 344-375.
Jin L, Myers SC (2006) R2 around the world: New theory and new tests. Journal of Financial
Economics 79: 257-292.
Kang HC, Lee DW, Park KS (2010) Does the difference in valuation between domestic and
foreign investors help explain their distinct holdings of domestic stocks? Journal of
Banking and Finance 34: 2886-2896.
Kuo,NT (2012) Dividend tax signaling and the pricing of future earnings: a case of taxable stock
dividends. Review of Quantitative Finance and Accounting: 1-32.
Kyle AS (1985) Continuous auctions and insider trading. Econometrica 53: 1315-1336
La Porta R, Lopez de Silanes F, Shleifer A, Vishny R (1998) Law and finance. Journal of
Political Economy 106: 1113–1155
La Porta R, Lopez de Silanes F, Shleifer A, Vishny R (2000) Agency problems and dividend
policies around the world. Journal of Finance 55: 1-33.
Lee CF, Gupta MC, Chen HY, Lee AC (2011) Optimal payout ratio under uncertainty and the
flexibility hypothesis: Theory and empirical evidence. Journal of Corporate Finance
17(3): 483-501.
32
Lee WJ (2011) Managerial entrenchment and the value of dividends. Review of Quantitative
Finance and Accounting 36(2): 297-322.
Lesmond DA, Ogden JP, Trzcinka CA (1999) A new estimate of transaction costs. The Review
of Financial Studies 12: 1113–1141.
Lewellen WG, Stanley KL, Lease RC, Schlarbaum GG (1978) Some direct evidence on the
dividend clientele phenomenon. Journal of Finance 33: 1385–1399.
Lipson ML, Mortal SC (2009) Liquidity and Capital Structure Journal of Financial Markets 12:
611-644.
Miller M, Modigliani F (1961) Dividend policy growth and the valuation of shares. Journal of
Business 34: 411–33.
Morck R, Yeung B, Wu W (2000) The information content of stock markets: Why do emerging
markets have synchronous stock price movements? Journal of Financial Economics 58:
215-260.
Pettit RR (1977) Taxes transaction costs and the clientele effect of dividends. Journal of
Financial Economics 5: 419–436.
Roll R (1988) R². Journal of Finance 43: 541-566.
Perez-Gonzalez F (2003) Large Shareholders and Dividends: Evidence from U.S. Tax Reforms.
Unpublished Working Paper Columbia University New York.
Shefrin H, Thaler RH (1988) The behavioral life-cycle hypothesis. Economic Inquiry 26: 609–
643.
Spamann H (2010) The “Antidirector rights index” revisited. Review of Financial Studies 23:
467–486.

33
Van den Steen E (2004) Rational overoptimism (and other biases). American Economic Review
94: 1141-1151.
White H (1980) A heteroscedasticity-consistent covariance matrix estimator and a direct test for
heteroscedasticity. Econometrica 48: 817-838.
34
Table 1 Summary Statistics across Countries
This table presents summary statistics for the key variables analyzed in the study across countries. The
sample consists of the pooled cross sections for 2005. N is the number of firms included in the final
sample from a given country, Dividend Yield is the dollar amount of dividends paid out in year divided
by end-of-year equity market value, Dividend Payer is an indicator variable equal to 0 for nonpayers
and 1 for dividend payers, Dividend Initiation is an indicator variable equal to 1 for nonpayers at the
end of year t-1 who start to pay a dividend in year t, and zero otherwise, Seniors is the proportion of
population who are 65 years old or older in a given country in which a firm is headquartered, ADRI is
the Antidirector Rights Index that measures shareholder protection, Informativeness is the median
logistic transformed relative firm-specific over market-wide stock return variation estimated using an
international two-factor model for U.S. dollar excess returns across all firms for each country, and
Illiquidity is proportion of zero daily returns across all firms for each country averaged over the month.
Country N Dividend
Yield (%)
Dividend
Payer
Dividend
Initiation
Seniors
(%)
ADRI Informativeness Illiquidity
(%)
Argentina 68 1.92 0.36 0.04 10.34 3.00 3.45 50.91
Australia 99 1.90 0.41 0.03 12.94 4.00 2.82 53.44
Austria 92 1.45 0.58 0.05 16.21 4.00 3.18 49.70
Belgium 100 1.98 0.64 0.04 17.26 2.00 2.76 43.76
Brazil 100 1.48 0.31 0.02 6.17 5.00 3.17 70.65
Canada 100 1.63 0.44 0.04 13.11 4.00 2.91 55.48
Chile 100 1.88 0.33 0.02 8.10 5.00 3.19 69.29
Denmark 100 1.72 0.56 0.03 15.13 4.00 3.27 43.66
Finland 100 2.89 0.60 0.04 15.95 4.00 3.29 34.26
France 100 1.91 0.53 0.09 16.46 5.00 2.96 38.74
Germany 100 1.65 0.52 0.01 18.86 4.00 2.97 38.02
Greece 100 1.62 0.50 0.04 17.99 3.00 3.22 29.67
India 100 1.04 0.33 0.03 4.59 4.00 2.86 42.29
Ireland 45 1.33 0.39 0.02 10.99 4.00 2.54 38.80
Israel 100 1.55 0.35 0.05 10.10 4.00 3.18 51.26
Italy 100 1.88 0.52 0.06 19.65 4.00 2.95 28.71
Japan 100 1.92 0.66 0.04 19.92 5.00 2.42 26.32
Malaysia 99 0.73 0.27 0.01 4.36 4.00 3.27 40.28
Mexico 100 1.37 0.31 0.02 5.77 3.00 3.15 58.49
Netherlands 100 2.13 0.55 0.02 14.15 4.00 2.95 28.45
Norway 100 2.83 0.57 0.06 14.51 4.00 2.77 38.97
Pakistan 89 1.68 0.49 0.04 3.81 5.00 2.70 45.50
Philippines 100 0.55 0.24 0.02 3.85 5.00 3.22 78.33
Portugal 52 1.48 0.48 0.05 17.06 4.00 3.10 44.83
Spain 100 1.22 0.57 0.04 16.76 6.00 1.28 37.70
Sweden 100 1.92 0.47 0.07 17.15 4.00 2.68 33.61
Switzerland 100 0.96 0.44 0.04 15.98 3.00 3.22 34.62
Thailand 98 1.08 0.34 0.07 7.10 4.00 2.73 61.56
Turkey 100 1.38 0.28 0.05 5.66 4.00 3.48 31.45
UK 99 1.89 0.48 0.03 16.10 5.00 2.47 51.79
USA 99 1.92 0.49 0.02 12.38 2.00 4.17 13.41
Venezuela 35 1.35 0.52 0.04 4.98 2.00 3.21 87.96
35
Table 2
Summary Statistics
This table reports summary statistics for payout policy variables and the key country level
variables. The sample consists of the pooled cross sections for the year 2005. Dividend Yield is
the dollar amount of dividends paid out in year divided by end-of-year equity market value.
Dividend Payer is an indicator variable equal to 0 for nonpayers and 1 for dividend payers.
Dividend Initiation is an indicator variable equal to 1 for nonpayers at the end of year t-1 who
start to pay a dividend in year t, and zero otherwise. Seniors is the proportion of population who
are 65 years old or older in a given country in which a firm is headquartered, Government
Health Expense is the proportion of health expenditure funded by government, FPI is the total
investment in domestic stock markets by foreign investors and is normalized by the stock market
capitalization, IDV is an index of individualism developed by Hofstede (2001), which measures
investor overconfidence and self-attribution bias, Informativeness is the median logistic
transformed relative firm-specific over market-wide stock return variation estimated using an
international two-factor model for U.S. dollar excess returns across all firms for each country,
ADRI is the Antidirector Rights Index that measures shareholder protection, Business Disclosure
measures the financial and operational transparency of businesses in a given country, Illiquidity
is the proportion of zero daily returns across all firms for each country averaged over the month,
and Turnover ratio is the total value of shares traded divided by the average market
capitalization.
Variables Mean 25th Percentile Median 75th Percentile Standard
Deviation
Payout Policy Variables
Dividend Yield
(%) 1.40 0.00 0.00 2.03 2.49
Dividend Payer
(%) 42.00 0.00 0.00 100.00 0.49
Dividend Initiation
(%) 4.00 0.00 0.00 0.00 0.20
Dividend Demand Variables
Seniors (%) 12.41 7.10 14.15 16.77 5.23
Government Health
Expense (%) 13.02 11.56 14.11 16.24 4.28
FPI (% of market
capitalization) 28.81 19.10 22.35 31.53 27.42
IDV 55.24 35.00 57.00 74.00 22.76
Agency
ADRI 4.02 4.00 4.00 5.00 0.90
Business
Disclosure 6.23 5.00 7.00 8.00 2.61
Market Quality
Informativeness 2.98 2.77 2.97 3.22 0.46
Illiquidity (%) 39.68 22.73 34.78 50.00 23.48
Turnover ratio 2.84 2.41 2.88 3.35 0.69
36
Table 3
Correlation Matrix
This table reports the product moment correlation coefficients for the key variables included in
the study. The sample consists of the pooled cross sections for 2005. Dividend Yield is the dollar
amount of dividends paid out in year divided by end-of-year equity market value, Seniors is the
proportion of population who are 65 years old or older in a given country in which a firm is
headquartered, Government Health Expense is the proportion of health expenditure funded by
government, FPI is the total investment in domestic stock markets by foreign investors and is
normalized by the stock market capitalization, IDV is an index of individualism developed by
Hofstede (2001), which measures investor overconfidence and self-attribution bias,
Informativeness is the median logistic transformed relative firm-specific over market-wide stock
return variation estimated using an international two-factor model for U.S. dollar excess returns
across all firms for each country, ADRI is the Antidirector Rights Index that measures
shareholder protection, Business Disclosure measures the financial and operational transparency
of businesses in a given country, Illiquidity is the proportion of zero daily returns across all firms
for each country averaged over the month, and Turnover ratio is the total value of shares traded
divided by the average market capitalization.
(1) (2) (3) (4) (5) (6) (7) (8) (9) (10)
(1) Dividend Yield 1.00
(2) Seniors 0.07 1.00
(3) Government Health
Expense
-0.11 0.24 1.00
(4) FPI 0.02 0.23 0.29 1.00
(5) IDV -0.17 0.43 0.35 0.31 1.00
(6) Informativeness -0.01 -0.27 -0.15 0.15 -0.05 1.00
(7) ADRI -0.01 -0.06 -0.03 0.03 0.18 0.36 1.00
(8) Business
Disclosure
-0.04 -0.18 -0.02 0.08 0.10 0.09 0.16 1.00
(9) Illiquidity 0.08 -0.15 -0.31 -0.22 -0.37 -0.09 -0.19 -0.02 1.00
(10) Turnover ratio -0.03 0.09 0.04 0.04 0.10 0.28 0.29 0.02 -0.37 1.00
37
Table 4
Dividend Yield
This table presents OLS regression results for firm dividend payout behavior, estimated over the
sample of pooled observations from the 2005 cross sections. Dependent variable is measured 1
year after the firm- and the country-level controls. Dividend Yield is the dollar amount of
dividends paid out in year divided by end-of-year equity market value. Our key independent
variables are Seniors is the proportion of population who are 65 years old or older in a given
country in which a firm is headquartered, Government Health Expense is the proportion of health
expenditure funded by government, FPI is the total investment in domestic stock markets by
foreign investors and is normalized by the stock market capitalization, IDV is an index of
individualism developed by Hofstede (2001), which measures investor overconfidence and self-
attribution bias, ADRI is the Antidirector Rights Index that measures shareholder protection,
Business Disclosure measures the financial and operational transparency of businesses in a given
country, Informativeness is the median logistic transformed relative firm-specific over market-
wide stock return variation estimated using an international two-factor model for U.S. dollar
excess returns across all firms for each country, Illiquidity is the proportion of zero daily returns
across all firms for each country averaged over the month, and Turnover ratio is the total value of
shares traded divided by the average market capitalization. Besides the key variables, the
regressions include firm-specific controls: Net Income, Cash, market-to-book ratio and Debt.
Volatility refers to the variance of monthly stock returns over the preceding 3 years. Return refers
to monthly stock returns over the preceding 3 years. Asset Growth is the logarithm of the growth
rate of assets over the prior year and Lagged Dividend Yield is the dividend yield during the
previous year. Standard errors (shown in parentheses) allow for heteroskedasticity. ∗∗∗, ∗∗, ∗
denote significance at the 1%, 5%, and 10% levels, respectively.
(1) (2) (3) (4)
Dividend Demand Variables
Seniors 0.06***
(0.02) - -
0.19***
(0.03)
Government Health
Expense
-0.07***
(0.03) - -
-0.12***
(0.03)
FPI 0.02*
(0.01) - -
0.04***
(0.01)
IDV -0.04**
(0.02) - -
-0.07***
(0.03)
Agency
ADRI - -0.02**
(0.01) -
-0.08***
(0.03)
Business Disclosure - -0.03**
(0.01) -
-0.07***
(0.02)
Market Quality
Informativeness - - -0.04*** -0.06***
38
(0.01) (0.03)
Illiquidity - - 0.06***
(0.02)
0.13***
(0.01)
Turnover - - -0.06***
(0.02)
-0.08***
(0.02)
Control Variables
Return 0.04***
(0.02)
0.04***
(0.02)
0.04**
(0.02)
0.05***
(0.02)
Return Volatility -0.03*
(0.02)
-0.03*
(0.02)
-0.03*
(0.02)
-0.03
(0.02)
Net Income 0.05**
(0.02)
0.05**
(0.03)
0.05**
(0.02)
0.05**
(0.02)
Cash 0.05
(0.04)
0.05
(0.04)
0.05
(0.04)
0.05
(0.04)
Market-to-book -0.03***
(0.01)
-0.03***
(0.01)
-0.03***
(0.01)
-0.03***
(0.01)
Debt -0.02
(0.02)
-0.02
(0.02)
-0.02
(0.02)
-0.02
(0.02)
Log of Market
Value
0.13***
(0.03)
0.11***
(0.03)
0.13***
(0.03)
0.15***
(0.03)
Log of Assets 0.08**
(0.03)
0.12***
(0.03)
0.10***
(0.03)
0.07**
(0.03)
Asset Growth -0.02
(0.01)
-0.01
(0.01)
-0.01
(0.01)
-0.02
(0.01)
Lag Dividend Yield 0.43***
(0.13)
0.43***
(0.13)
0.43***
(0.13)
0.42***
(0.13)
Adjusted R2 0.29 0.28 0.29 0.30
39
Table 5
Dividend Payout Policy
This table presents OLS regression results for firm dividend payout behavior, estimated over the
sample of pooled observations from the 2005 cross sections. Dependent variable is measured 1
year after the firm- and the country-level controls. Dividend Payer is an indicator variable equal to
0 for nonpayers and 1 for dividend payers. Dividend Initiation is an indicator variable equal to 1
for nonpayers at the end of year t-1 who start to pay a dividend in year t, and zero otherwise. Our
key independent variables are Seniors is the proportion of population who are 65 years old or
older in a given country in which a firm is headquartered, Government Health Expense is the
proportion of health expenditure funded by government, FPI is the total investment in domestic
stock markets by foreign investors and is normalized by the stock market capitalization, IDV is an
index of individualism developed by Hofstede (2001), which measures investor overconfidence
and self-attribution bias, ADRI is the Antidirector Rights Index that measures shareholder
protection, Business Disclosure measures the financial and operational transparency of businesses
in a given country, Informativeness is the median logistic transformed relative firm-specific over
market-wide stock return variation estimated using an international two-factor model for U.S.
dollar excess returns across all firms for each country, Illiquidity is the proportion of zero daily
returns across all firms for each country averaged over the month, and Turnover ratio is the total
value of shares traded divided by the average market capitalization. Besides the key variables, the
regressions include firm-specific controls: Net Income, Cash, market-to-book ratio and Debt.
Volatility refers to the variance of monthly stock returns over the preceding 3 years. Return refers
to monthly stock returns over the preceding 3 years. Asset Growth is the logarithm of the growth
rate of assets over the prior year and Lagged Dividend Yield is the dividend yield during the
previous year. Standard errors (shown in parentheses) allow for heteroskedasticity. ∗∗∗, ∗∗, ∗
denote significance at the 1%, 5%, and 10% levels, respectively.
(1) (2) (3)
Dividend Yield Dividend Payer Dividend Initiation
Dividend Demand Variables
Seniors 0.19***
(0.03)
0.34***
(0.03)
0.07**
(0.01)
Government Health
Expense
-0.12***
(0.03)
-0.14***
(0.03)
-0.01
(0.03)
FPI 0.04***
(0.01)
0.05***
(0.02)
0.04*
(0.02)
IDV -0.07***
(0.03)
-0.06**
(0.02)
-0.06*
(0.04)
Agency
ADRI -0.08***
(0.03)
-0.07***
(0.02)
-0.03*
(0.01)
Business Disclosure -0.07***
(0.02)
-0.03**
(0.02)
-0.04*
(0.02)
Market Quality
Informativeness -0.06*** -0.02** -0.04*
40
(0.03) (0.01) (0.02)
Illiquidity 0.13***
(0.01)
0.04**
(0.02)
0.03*
(0.02)
Turnover ratio -0.08***
(0.02)
-0.02
(0.02)
-0.02
(0.03)
Control Variables
Return 0.05***
(0.02)
0.11***
(0.02)
0.05**
(0.02)
Return Volatility -0.03
(0.02)
-0.06*
(0.03)
-0.01
(0.01)
Net Income 0.05**
(0.02)
0.02
(0.02)
-0.01
(0.01)
Cash 0.05
(0.04)
0.03*
(0.02)
0.01
(0.00)
Market-to-book -0.03***
(0.01)
-0.02***
(0.01)
0.01*
(0.00)
Debt -0.02
(0.02)
-0.01
(0.01)
0.01
(0.01)
Log of Market Value 0.15***
(0.03)
0.28***
(0.03)
0.04
(0.03)
Log of Assets 0.07**
(0.03)
0.15***
(0.03)
0.06**
(0.03)
Asset Growth -0.02
(0.01)
-0.01
(0.01)
-0.06**
(0.02)
Lag Dividend Yield 0.42***
(0.13)
0.25***
(0.07)
0.14***
(0.04)
Adjusted R2 0.30 0.36 0.03
41
Table 6
Change in R2 test
This table reports the individual contribution of each category of factors influencing the payout
policy in explaining the dividend yield which is the dollar amount of dividends paid out
divided by the end-of-year equity market value. Demand Factors include: Seniors, which is the
proportion of population who are 65 years old or older in a given country in which a firm is
headquartered, Government Health Expense, which is the proportion of health expenditure
funded by government, as reported by the World Bank, FPI, which is the total investment in
domestic stock markets by foreign investors and is normalized by the stock market
capitalization, IDV, which is an index of individualism developed by Hofstede (2001), that
measures investor overconfidence and self-attribution bias. Agency factors are ADRI, which is
the Antidirector Rights Index that measures shareholder protection, and Business Disclosure,
that measures the financial and operational transparency of businesses in a given country.
Market Factors include Informativeness, which is the median logistic transformed relative
firm-specific over market-wide stock return variation estimated using an international two-
factor model for U.S. dollar excess returns across all firms for each country, Illiquidity, which
is the proportion of zero daily returns across all firms for each country averaged over the
month, and Turnover ratio, which is the total value of shares traded divided by the average
market capitalization. In addition to these factors, the regressions also include firm-specific
controls: Net Income, Cash, market-to-book ratio and Debt. Volatility refers to the variance of
monthly stock returns over the preceding 3 years. Return refers to monthly stock returns over
the preceding 3 years. Asset Growth is the logarithm of the growth rate of assets over the prior
year and Lagged Dividend Yield is the dividend yield during the previous year. F (Change)
statistic is calculated as:
[ SSE(R) - SSE(F) ] / [ df(R) - df(F) ]
F(Change) = -------------------------------------------
SSE(F) / df(F)
SSE(R) and df(R) is the sum of squared errors and degrees of freedom for the restricted model,
SSE(F) and df(F) is the sum of squared errors and degrees of freedom for the full model, ∗∗∗,
∗∗, ∗ denote significance at the 1%, 5%, and 10% levels, respectively.
VARIABLE Change in R-square F (change) P-value
Demand Factors 0.019 9.65*** <0.001
Agency Factor 0.025 8.94*** <0.001
Market Factors 0.021 8.27*** <0.001
42
Table 7
Dividend Payout Policy and Taxes
This table presents OLS regression results for firm dividend payout behavior, estimated over the
sample of pooled observations from the 2005 cross sections. Dependent variable is measured 1
year after the firm- and the country-level controls. Dividend Yield is the dollar amount of
dividends paid out in year divided by end-of-year equity market value. Dividend Payer is an
indicator variable equal to 0 for nonpayers and 1 for dividend payers. Dividend Initiation is an
indicator variable equal to 1 for nonpayers at the end of year t-1 who start to pay a dividend in
year t, and zero otherwise. Our key independent variables are Net tax is the top marginal
statutory personal income tax rate imposed on dividend income after taking account imputation
systems, tax credits, and tax allowances in each country, Seniors is the proportion of population
who are 65 years old or older in a given country in which a firm is headquartered, Government
Health Expense is the proportion of health expenditure funded by government, FPI is the total
investment in domestic stock markets by foreign investors and is normalized by the stock market
capitalization, IDV is an index of individualism developed by Hofstede (2001), which measures
investor overconfidence and self-attribution bias, ADRI is the Antidirector Rights Index that
measures shareholder protection, Business Disclosure, that measures the financial and
operational transparency of businesses in a given country, Informativeness is the median logistic
transformed relative firm-specific over market-wide stock return variation estimated using an
international two-factor model for U.S. dollar excess returns across all firms for each country,
Illiquidity is the proportion of zero daily returns across all firms for each country averaged over
the month, and Turnover ratio is the total value of shares traded divided by the average market
capitalization. Besides the key variables, the regressions include firm-specific controls: Net
Income, Cash, market-to-book ratio and Debt. Volatility refers to the variance of monthly stock
returns over the preceding 3 years. Return refers to monthly stock returns over the preceding 3
years. Asset Growth is the logarithm of the growth rate of assets over the prior year and Lagged
Dividend Yield is the dividend yield during the previous year. Standard errors (shown in
parentheses) allow for heteroskedasticity. ∗∗∗, ∗∗, ∗ denote significance at the 1%, 5%, and 10%
levels, respectively.
(1) (2) (3)
Dividend Yield Dividend Payer Dividend Initiation
Taxes
Net Tax -0.11***
(0.04)
-0.02*
(0.01)
-0.04*
(0.03)
Dividend Demand Variables
Seniors 0.02**
(0.01)
0.16***
(0.03)
0.12***
(0.05)
Government Health
Expense
-0.09***
(0.03)
-0.14***
(0.03)
-0.03
(0.03)
FPI 0.04**
(0.02)
0.05**
(0.02)
0.08***
(0.03)
IDV -0.07** -0.03 -0.05*
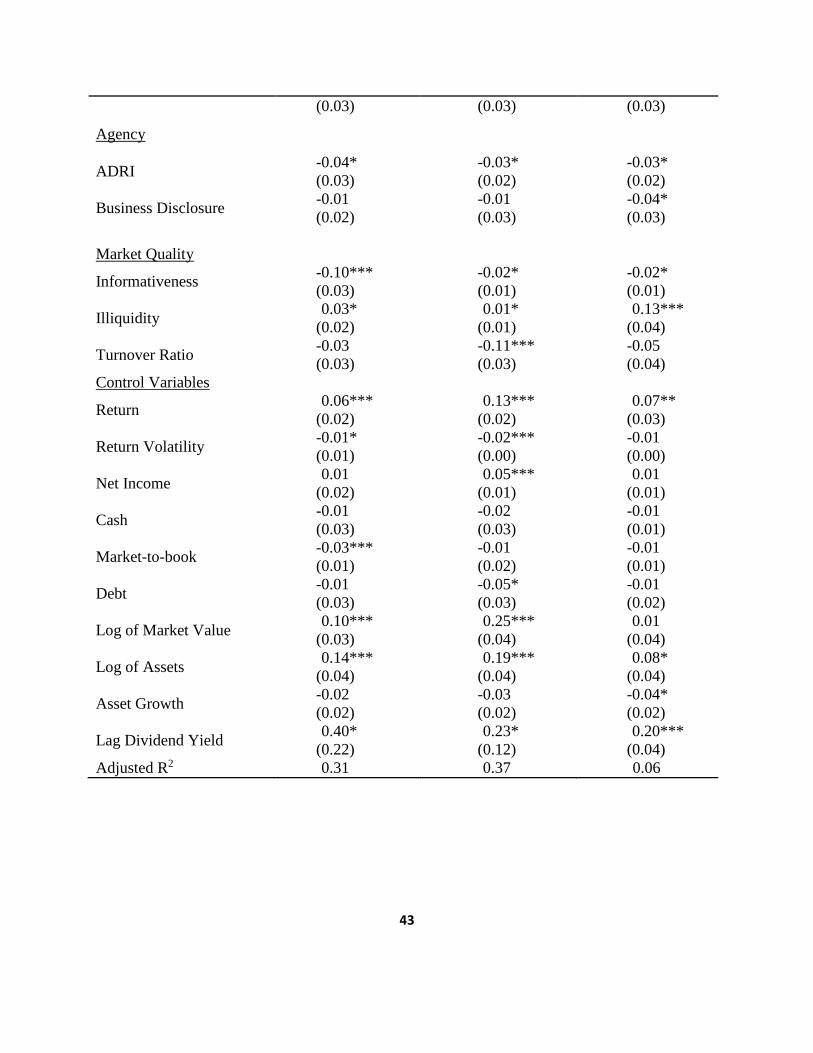
43
(0.03) (0.03) (0.03)
Agency
ADRI -0.04*
(0.03)
-0.03*
(0.02)
-0.03*
(0.02)
Business Disclosure -0.01
(0.02)
-0.01
(0.03)
-0.04*
(0.03)
Market Quality
Informativeness -0.10***
(0.03)
-0.02*
(0.01)
-0.02*
(0.01)
Illiquidity 0.03*
(0.02)
0.01*
(0.01)
0.13***
(0.04)
Turnover Ratio -0.03
(0.03)
-0.11***
(0.03)
-0.05
(0.04)
Control Variables
Return 0.06***
(0.02)
0.13***
(0.02)
0.07**
(0.03)
Return Volatility -0.01*
(0.01)
-0.02***
(0.00)
-0.01
(0.00)
Net Income 0.01
(0.02)
0.05***
(0.01)
0.01
(0.01)
Cash -0.01
(0.03)
-0.02
(0.03)
-0.01
(0.01)
Market-to-book -0.03***
(0.01)
-0.01
(0.02)
-0.01
(0.01)
Debt -0.01
(0.03)
-0.05*
(0.03)
-0.01
(0.02)
Log of Market Value 0.10***
(0.03)
0.25***
(0.04)
0.01
(0.04)
Log of Assets 0.14***
(0.04)
0.19***
(0.04)
0.08*
(0.04)
Asset Growth -0.02
(0.02)
-0.03
(0.02)
-0.04*
(0.02)
Lag Dividend Yield 0.40*
(0.22)
0.23*
(0.12)
0.20***
(0.04)
Adjusted R2 0.31 0.37 0.06
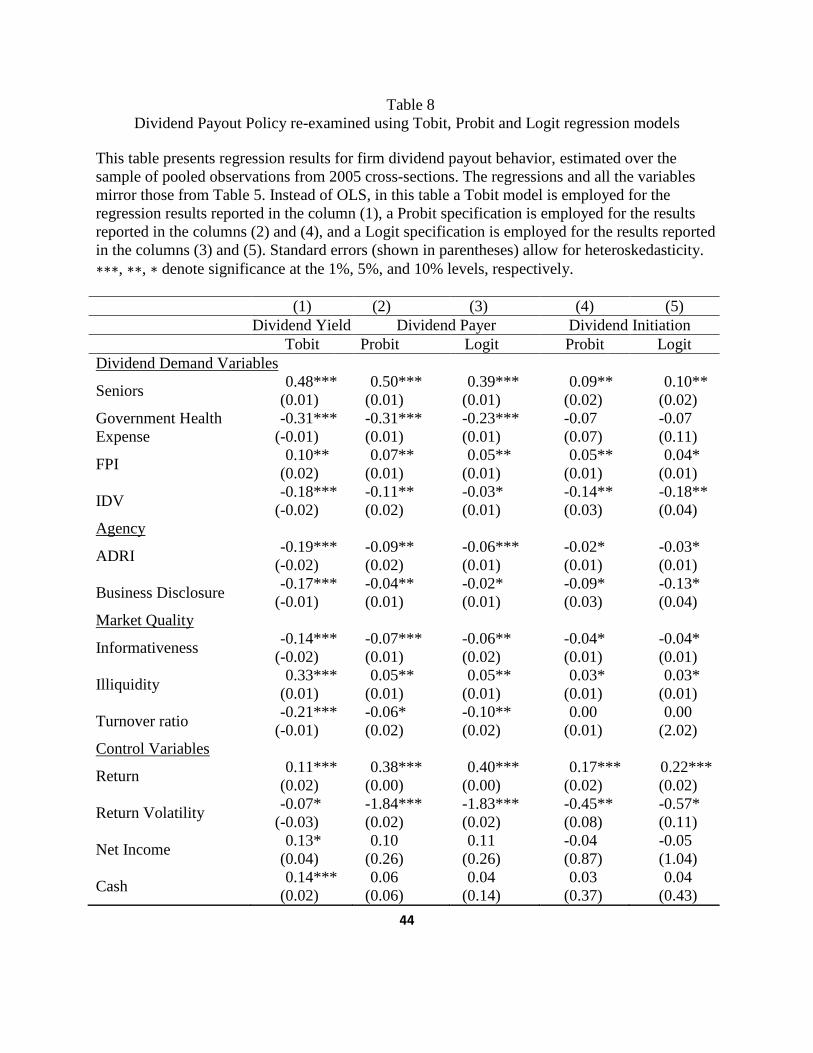
44
Table 8
Dividend Payout Policy re-examined using Tobit, Probit and Logit regression models
This table presents regression results for firm dividend payout behavior, estimated over the
sample of pooled observations from 2005 cross-sections. The regressions and all the variables
mirror those from Table 5. Instead of OLS, in this table a Tobit model is employed for the
regression results reported in the column (1), a Probit specification is employed for the results
reported in the columns (2) and (4), and a Logit specification is employed for the results reported
in the columns (3) and (5). Standard errors (shown in parentheses) allow for heteroskedasticity.
∗∗∗, ∗∗, ∗ denote significance at the 1%, 5%, and 10% levels, respectively.
(1) (2) (3) (4) (5)
Dividend Yield Dividend Payer Dividend Initiation
Tobit Probit Logit Probit Logit
Dividend Demand Variables
Seniors 0.48***
(0.01)
0.50***
(0.01)
0.39***
(0.01)
0.09**
(0.02)
0.10**
(0.02)
Government Health
Expense
-0.31***
(-0.01)
-0.31***
(0.01)
-0.23***
(0.01)
-0.07
(0.07)
-0.07
(0.11)
FPI 0.10**
(0.02)
0.07**
(0.01)
0.05**
(0.01)
0.05**
(0.01)
0.04*
(0.01)
IDV -0.18***
(-0.02)
-0.11**
(0.02)
-0.03*
(0.01)
-0.14**
(0.03)
-0.18**
(0.04)
Agency
ADRI -0.19***
(-0.02)
-0.09**
(0.02)
-0.06***
(0.01)
-0.02*
(0.01)
-0.03*
(0.01)
Business Disclosure -0.17***
(-0.01)
-0.04**
(0.01)
-0.02*
(0.01)
-0.09*
(0.03)
-0.13*
(0.04)
Market Quality
Informativeness -0.14***
(-0.02)
-0.07***
(0.01)
-0.06**
(0.02)
-0.04*
(0.01)
-0.04*
(0.01)
Illiquidity 0.33***
(0.01)
0.05**
(0.01)
0.05**
(0.01)
0.03*
(0.01)
0.03*
(0.01)
Turnover ratio -0.21***
(-0.01)
-0.06*
(0.02)
-0.10**
(0.02)
0.00
(0.01)
0.00
(2.02)
Control Variables
Return 0.11***
(0.02)
0.38***
(0.00)
0.40***
(0.00)
0.17***
(0.02)
0.22***
(0.02)
Return Volatility -0.07*
(-0.03)
-1.84***
(0.02)
-1.83***
(0.02)
-0.45**
(0.08)
-0.57*
(0.11)
Net Income 0.13*
(0.04)
0.10
(0.26)
0.11
(0.26)
-0.04
(0.87)
-0.05
(1.04)
Cash 0.14***
(0.02)
0.06
(0.06)
0.04
(0.14)
0.03
(0.37)
0.04
(0.43)
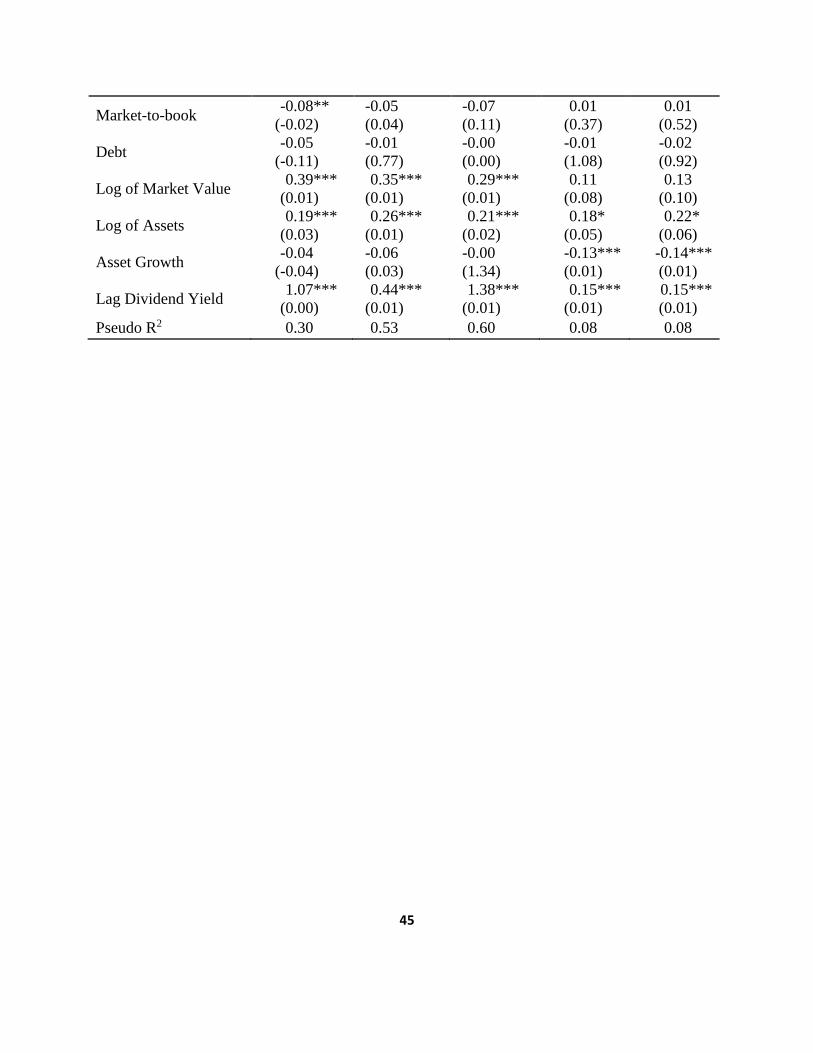
45
Market-to-book -0.08**
(-0.02)
-0.05
(0.04)
-0.07
(0.11)
0.01
(0.37)
0.01
(0.52)
Debt -0.05
(-0.11)
-0.01
(0.77)
-0.00
(0.00)
-0.01
(1.08)
-0.02
(0.92)
Log of Market Value 0.39***
(0.01)
0.35***
(0.01)
0.29***
(0.01)
0.11
(0.08)
0.13
(0.10)
Log of Assets 0.19***
(0.03)
0.26***
(0.01)
0.21***
(0.02)
0.18*
(0.05)
0.22*
(0.06)
Asset Growth -0.04
(-0.04)
-0.06
(0.03)
-0.00
(1.34)
-0.13***
(0.01)
-0.14***
(0.01)
Lag Dividend Yield 1.07***
(0.00)
0.44***
(0.01)
1.38***
(0.01)
0.15***
(0.01)
0.15***
(0.01)
Pseudo R2 0.30 0.53 0.60 0.08 0.08
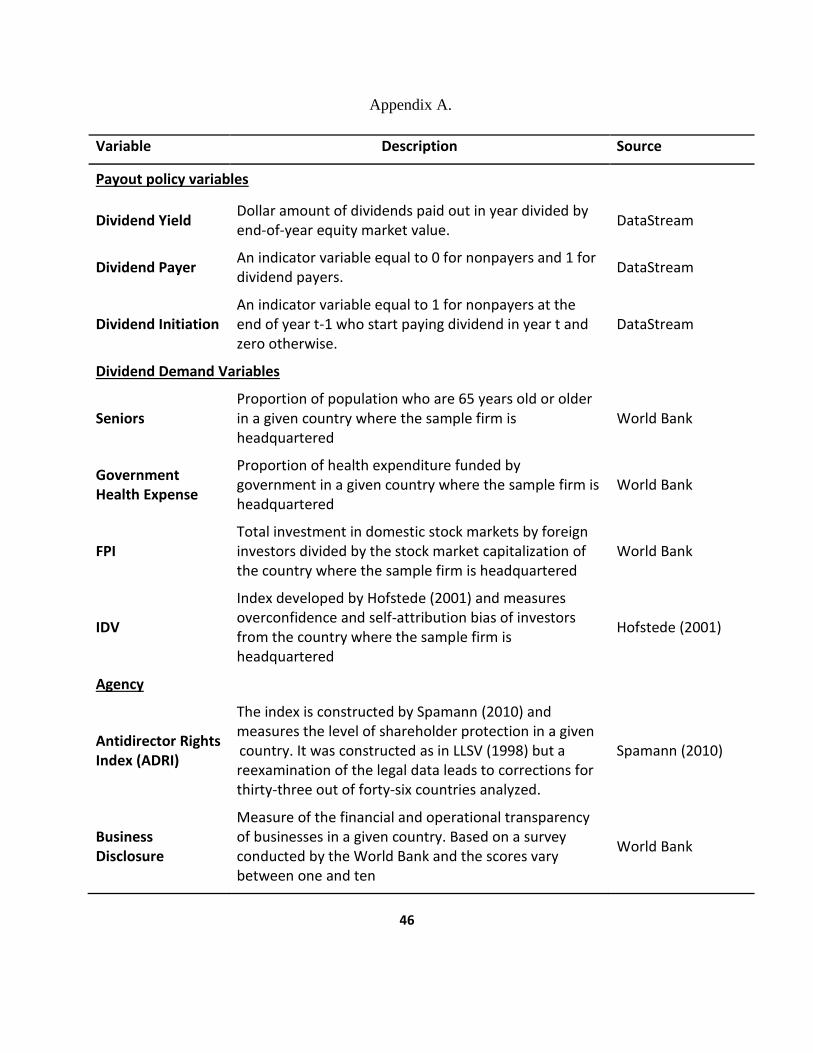
46
Appendix A.
Variable Description Source
Payout policy variables
Dividend Yield Dollar amount of dividends paid out in year divided by end-of-year equity market value.
DataStream
Dividend Payer An indicator variable equal to 0 for nonpayers and 1 for dividend payers.
DataStream
Dividend Initiation An indicator variable equal to 1 for nonpayers at the end of year t-1 who start paying dividend in year t and zero otherwise.
DataStream
Dividend Demand Variables
Seniors Proportion of population who are 65 years old or older in a given country where the sample firm is headquartered
World Bank
Government Health Expense
Proportion of health expenditure funded by government in a given country where the sample firm is headquartered
World Bank
FPI Total investment in domestic stock markets by foreign investors divided by the stock market capitalization of the country where the sample firm is headquartered
World Bank
IDV
Index developed by Hofstede (2001) and measures overconfidence and self-attribution bias of investors from the country where the sample firm is headquartered
Hofstede (2001)
Agency
Antidirector Rights Index (ADRI)
The index is constructed by Spamann (2010) and measures the level of shareholder protection in a given country. It was constructed as in LLSV (1998) but a reexamination of the legal data leads to corrections for thirty-three out of forty-six countries analyzed.
Spamann (2010)
Business Disclosure
Measure of the financial and operational transparency of businesses in a given country. Based on a survey conducted by the World Bank and the scores vary between one and ten
World Bank
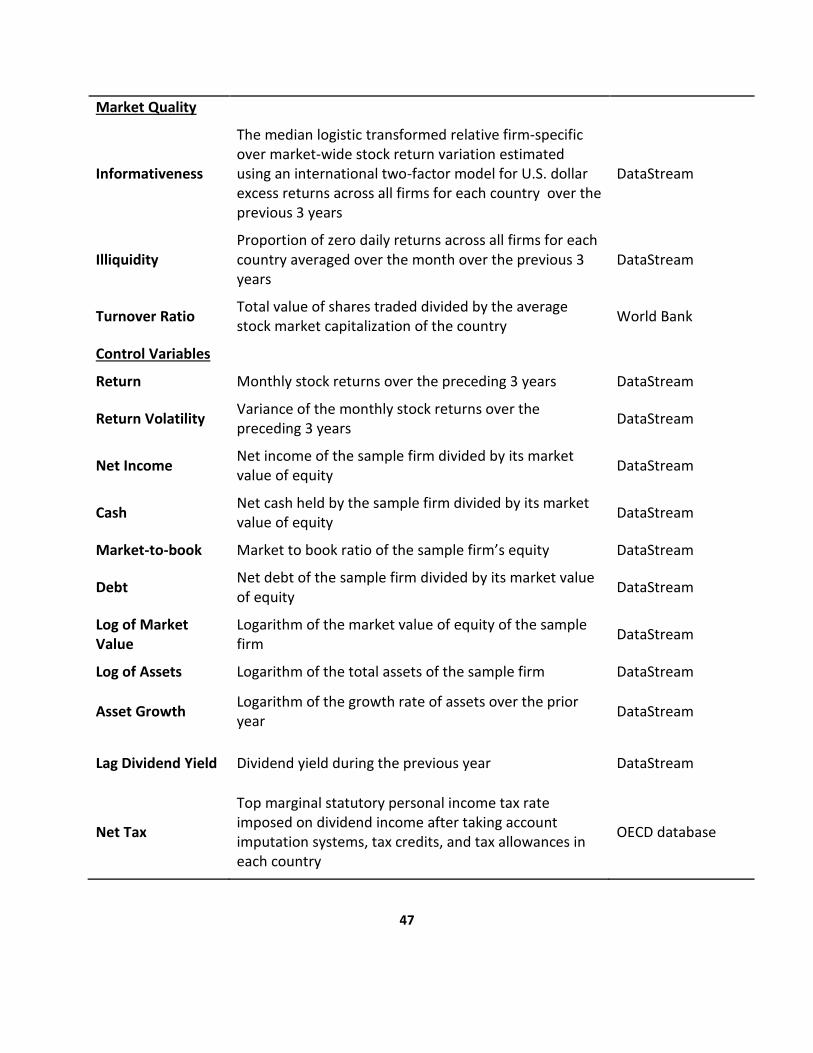
47
Market Quality
Informativeness
The median logistic transformed relative firm-specific over market-wide stock return variation estimated using an international two-factor model for U.S. dollar excess returns across all firms for each country over the previous 3 years
DataStream
Illiquidity Proportion of zero daily returns across all firms for each country averaged over the month over the previous 3 years
DataStream
Turnover Ratio Total value of shares traded divided by the average stock market capitalization of the country
World Bank
Control Variables
Return Monthly stock returns over the preceding 3 years DataStream
Return Volatility Variance of the monthly stock returns over the preceding 3 years
DataStream
Net Income Net income of the sample firm divided by its market value of equity
DataStream
Cash Net cash held by the sample firm divided by its market value of equity
DataStream
Market-to-book Market to book ratio of the sample firm’s equity DataStream
Debt Net debt of the sample firm divided by its market value of equity
DataStream
Log of Market Value
Logarithm of the market value of equity of the sample firm
DataStream
Log of Assets Logarithm of the total assets of the sample firm DataStream
Asset Growth Logarithm of the growth rate of assets over the prior year
DataStream
Lag Dividend Yield Dividend yield during the previous year DataStream
Net Tax
Top marginal statutory personal income tax rate imposed on dividend income after taking account imputation systems, tax credits, and tax allowances in each country
OECD database