dividend payout policy: a study on indian banking … · the results clearly indicate that current...
TRANSCRIPT

IOSR Journal of Business and Management (IOSR-JBM)
e-ISSN: 2278-487X, p-ISSN: 2319-7668. Volume 19, Issue 9. Ver. IV. (September. 2017), PP 43-65
www.iosrjournals.org
DOI: 10.9790/487X-1909044365 www.iosrjournals.org 43 | Page
Dividend Payout Policy: A Study on Indian Banking Industry
*Nusrathunnisa
1, Dr. R. Duraipandian
2
1(Department of Finance, Alliance University – School of Business, India)
2(Department of Finance, PESIT – South Campus, India)
Corresponding Author: Nusrathunnisa1
Abstract: In corporate finance one of the most important policies is dividend policy not only to the company
but also to the shareholders, the consumers, the workers, regulatory bodies and the government. Dividend
decisions are important as other financial decisions depend on it. The present paper represents dividend
payment pattern in Indian banking industry. The paper discusses the variables which determine the dividend
policy of Indianbanks and conclude that academic researcherscannot state a theoretical optimal dividend policy
that simultaneously fits all banks due to various factors. The objective of the present study is to determine the
trend of dividend payments of sample banking companiesin India.This study is based on a sample of 21banks in
Indian banking sector for the period 2006 to 2015.The researchers used various statistical tools such as Mean,
Standard Deviation, Coefficient of Variation, and ANOVA. The analysis concludes that banking companies
belonging to the same industry adopted a different dividend policies among themselves.
Keywords: Dividend, dividend payout ratio, banking companies.
----------------------------------------------------------------------------------------------------------------------------- ----------
Date of Submission: 01-09-2017 Date of acceptance: 13-09-2017
----------------------------------------------------------------------------------------------------------------------------- ----------
I. Introduction:
Dividend decisions are recognized as centrally important because of increasingly significant role of the
finances in the firm’s overall growth strategy. The objective of the finance manager should be to find out an
optimal dividend policy that will enhance value of the firm. It is often argued that the share prices of a firm tend
to be reduced whenever there is a reduction in the dividend payments. With a view to measuring the ability and
efficiency of a particular company in particular and industry in general over a period of time, dividend policy of
a business is considered as the statistical yardstick, a measure or standard used for comparison. As the
reasonable amount of profit is ploughed back in the business, retained earnings is also considered as the main
source of creating shareholders’ wealth and important factor for the growth of the business. Retention of profit
in the business is also a vital source of finance on which no return is to be given.
II. Review Of Literature: The firm value is independent of its dividend policy according to Modigliani and Miller (1961),
because it is determined by selecting optimal investments. Thus a firm dividend policy does not influence the
wealth of shareholder. The theory of the bird in the hand was presented by Gordon and Walter (1963), according
to this theory because of minimum risk investors will always prefer dividends over capital gains. Thus
researchers are puzzled by the question, “whether shareholder’s value is affected by dividend policy” for many
years.
Some studies have found that firm value is not influenced by the increase or decrease in dividend
payout, whereas some studies found that dividend payout affect firm value.
A survey was conducted by Farrelly, Baker, and Edelman (1985) in which they found that according
to the view of managers there is an optimal level of dividend payouts, and firms influenced by dividend payouts.
The same results were found by Baker and Powell (1999) in a survey that firm value and wealth of shareholder
is affected by dividend policy. The future profitability of firms is assessed by the information regarding the
announcements of Cash dividends. George and Kumudha (2006) in their study on dividend policy with
reference to Lintner’s model bring out that current earnings play a significant role in deciding the dividend
policy. The results clearly indicate that current year’s dividend per share is positively related to current years
earning per share and previous year dividend per share (lagged dividend) with correlation coefficient of 0.654
and 0.657 respectively. In Indian Context, a few studies have analyzed the dividend behavior of corporate firms.
B S Bodla, Karam Pal and Jasvir S Sura (2007) re-examined the applicability of Lintner’s (1956) dividend
policy in banking sector in India. The results indicate that the major determinants of current dividend are lagged
dividend and the current earnings in case of both Public Sector Banks and Private Banks. Azhagaiah and
Sabaripriya (2008), analyzed the impact of dividend payout on shareholders’ wealth in organic and in-organic
chemical firms in India and proved that the wealth of the shareholders’ was greatly influenced mainly by five

Dividend Payout Policy: A Study on Indian Banking Industry
DOI: 10.9790/487X-1909044365 www.iosrjournals.org 44 | Page
variables viz., growth in sales, improvement of profit margin, capital investment decision, capital structure
decision and cost of capital. There was a significant impact of dividend payout on shareholders’ wealth in
organic chemical firms, while the shareholders wealth was not influenced by dividend payout as far as the
organic chemical firms are concerned. Olandipupo and Okafor (2011), focused on parties controlling
shareholders’ wealth maximization and the ways it affects the firm’s performance. The data used for the study
were collected from the Nigerian stock exchange and the annual reports of six sample firms from food / tobacco
and subsector for 20 years. The firm size (FS) and retained earnings (RE) had positive relationship and their
impact was proved statistically significant on the shareholders’ fund, while dividend payment had negative
relationship with the SW. However, turnover and retained earnings were of more significance in controlling the
shareholders’ wealth than the dividend payout. Devaki and Kamalaveni (2012), examined the influence of
shareholding pattern of the Indian corporate hotels. Fixed effect firm model estimation revealed that there was a
positive association between lagged dividend, earnings, debt-equity ratio, sales, size, age of the firm and
institutional shareholding. Gulet al. (2012), examined the influence of DP on SW of 75 listed firms in Karachi
stock exchange. The study found that the difference in average market value relative to book value of equity was
highly significant for dividend paying firms and dividend non-paying firms. Lagged market value of equity had
a significant impact on the market price per share; however, retained earnings had insignificant influence on the
market price of equity as far as the dividend paying firms are concerned and there was a significant influence of
DP on SW. Onwumereet al. (2012), attempted to study the links between the firms’ financial structure and the
objective of the firms in maximizing shareholders’ wealth using three value maximization indicators viz., net
profit margin, dividend per share and current ratio. The study revealed that outsiders’ fund was positive and did
not have significant impact on the dividend per share and current ratio; outsiders’ fund had negative and
significant impact on the net profit margin. Atiyet (2012), result showed that growth, profitability, financial debt
and size of the firm had significant impact on shareholders’ wealth. Uwuigbeet al. (2012) studied the
relationship between financial performance and dividend payout among the listed firms in Nigeria for a period
of five years i.e. 2005-2010 and found that there was a significant positive association between the performance
of firms and the dividend payout; ownership structure and firm’s size on dividend payout of the firms. Bawa
and Kaur (2013) results showed that in the long run, shareholders’ wealth of dividend paying IT firms had
increased significantly when compared to the non-dividend paying IT firms. Chidinmaet al. (2013), found that
earnings per share and market price per share had significant impact on SW; a high dividend payout increases
the market value of shares and thus, the shareholders’ value. Tahir and Raja (2014), results showed a
correlation between predictor variables and response variable for all the firms. Oil and gas industry of Pakistan
paid dividend on regular basis but there was uncertainty in stock market due to which holding period returns
were not efficient because share price of firms were not stable and fluctuation took place in firms and the study
proved that dividend payout ratio had insignificant relationship with holding period yield. Salman (2013) study
showed that DPS, EPS, Lagged MPS, and Lagged PER had significant positive relationship with shareholders
wealth. Kumaresan (2014), focused on top ten firms under hotel and travel sectors in Sri Lanka during the
period from 2008 to 2012 and found that there was a positive relationship between return on equity (ROE),
dividend per share (DPS) and dividend payout ratio (DPO) and shareholders’ wealth (SW) of the selected firms
under hotel and travel sectors in Sri Lanka and the study also proved that there was a negative relationship
between retention ratio and shareholders’ wealth.
III. Research Methodology:
3.1 Objectives of the Study:
I. To identify the dividend policies followed by banks in Indian banking sector.
II. To analyse the dividend trend of constituent banks in Indian banking sector.
3.2 Sample and Period of study
The analysis has been done by taking sample of 21 public and private banks, which are the constituents
of Indian banking industry respectively. Only those banks have been included in the analysis that have earned
profits and corresponding to that declared dividends. All those observations where the companies either have
not declared any dividend or incurred losses have been eliminated.The sample period undertaken for study is
from the year 2006 to 2015. The period of 10 years usually covers a business cycle. Therefore the period chosen
covers a complete business cycle i.e. both recessionary and booming phases of the sector. This would highlight
whether the dividend payment patterns vary or remain consistent during boom and recession.
3.3 Sources of Data
The research is empirical in nature and makes use of secondary data. The study is focused on Indian
Banking Sector. The data has been sourced from Bloomberg database. Further information has been collected
from CMIE (Centre for Monitoring Indian Economy) reports, RBI ( Reserve Bank of India) bulletin, Annual
Reports of Banks.
Dividend Payout Policy: A Study on Indian Banking Industry
DOI: 10.9790/487X-1909044365 www.iosrjournals.org 45 | Page
3.4 Hypothesis:
H0: There is no significant difference between actual and trend values of dividend payout among the selected
banks during the study period.
H1: There is significant difference between actual and trend values of dividend payout among the selected
players during the study period.
3.5 Statistical tools used:
For the conduct of the study various models have been developed. This section discusses these models and
various tools and techniques used to carry out the research.
Following statistical techniques have been applied for carrying out the study:
1. The Arithmetic Mean (X)
2. Coefficient of Variation (CV
3. Trend Analysis
4. Analysis of Variance (ANOVA)
IV. Analysis And Interpretation: Table 1: Actual and Trend values of Dividend Payout (In Percentage) ofAllahabad Bank (2006 to 2015)
BANK YEAR DPR TREND VALUES
(Yc=a+bx)
TREND INDICES It=
(Yt/Y0)x100
Allahabad Bank 2006 24.97 21.00 100.00
2007 17.66 20.49 70.72
2008 15.77 19.98 63.16
2009 16.53 19.47 66.19
2010 23.40 18.96 93.69
2011 19.93 18.45 79.79
2012 16.13 17.94 64.60
2013 24.76 17.43 99.13
2014 13.53 16.92 54.19
2015 14.35 16.41 57.46
Mean 18.70 S.D. 4.30
C.V. 22.97
Yc= 21.51193 - 0.51058X (X- in Units of years and Yc – in Percentage of Dividend Payout)
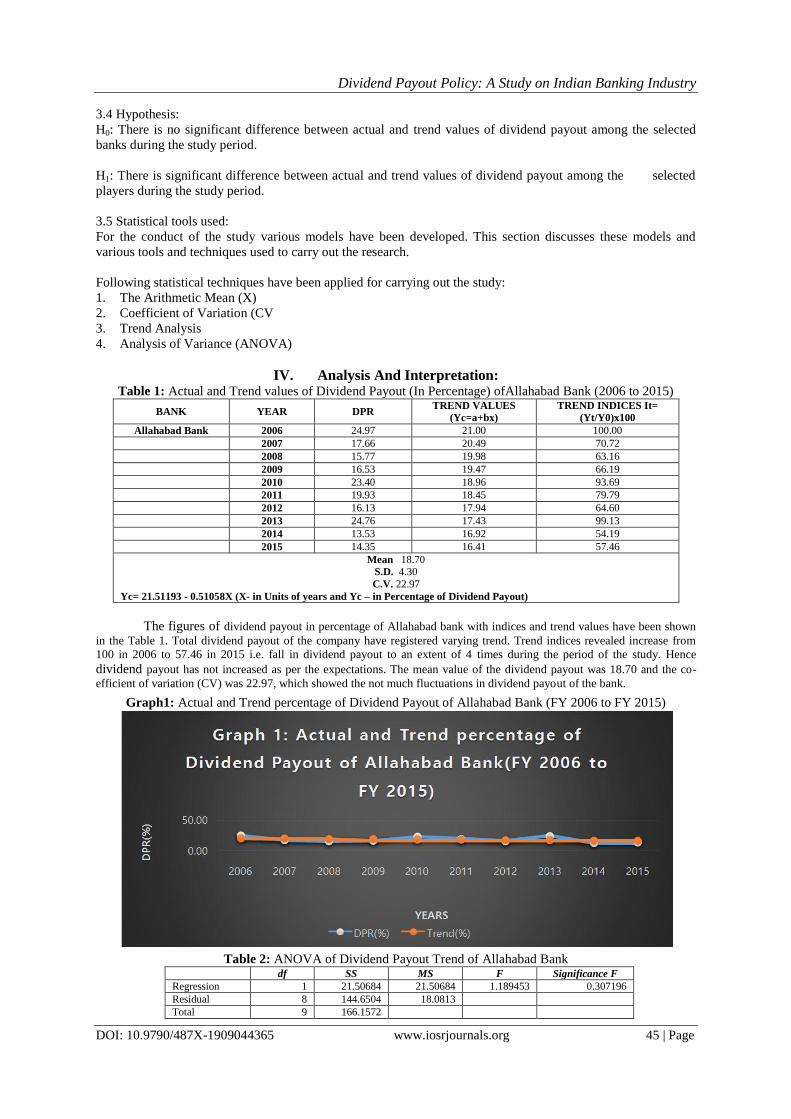
The figures of dividend payout in percentage of Allahabad bank with indices and trend values have been shown
in the Table 1. Total dividend payout of the company have registered varying trend. Trend indices revealed increase from
100 in 2006 to 57.46 in 2015 i.e. fall in dividend payout to an extent of 4 times during the period of the study. Hence
dividend payout has not increased as per the expectations. The mean value of the dividend payout was 18.70 and the co-
efficient of variation (CV) was 22.97, which showed the not much fluctuations in dividend payout of the bank.
Graph1: Actual and Trend percentage of Dividend Payout of Allahabad Bank (FY 2006 to FY 2015)
Table 2: ANOVA of Dividend Payout Trend of Allahabad Bank df SS MS F Significance F
Regression 1 21.50684 21.50684 1.189453 0.307196
Residual 8 144.6504 18.0813
Total 9 166.1572

Dividend Payout Policy: A Study on Indian Banking Industry
DOI: 10.9790/487X-1909044365 www.iosrjournals.org 46 | Page
From Table 2, it is clear that the calculated value of ‘F’ is 1.189453, which is less than the table value
of ‘F’ (5.987378) at 5% level. Therefore, null hypothesis is accepted and alternate hypothesis is rejected. This proves that
the difference between actual and trend values of dividend payout during the study period was not significant. Further, the
fitted linear regression is significant and hence it can be used for the prediction of dividend payout.
Table 3 Actual and Trend values of Dividend Payout (In Percentage) ofAndhra Bank (2006 to 2015) BANK YEAR DPR TREND VALUES
(Yc=a+bx)
TREND INDICES It=
(Yt/Y0)x100
Andhra Bank 2006 83.99 61.07 100.00
2007 34.15 55.77 40.66
2008 33.29 50.47 39.63
2009 33.27 45.17 39.61
2010 84.93 39.87 101.12
2011 24.53 34.57 29.20
2012 23.15 29.27 27.56
2013 21.78 23.97 25.93
2014 14.74 18.67 17.55
2015 18.39 13.37 21.89
Mean 37.22
S.D. 25.74
C.V. 69.15
Yc= 66.37231 – 5.30052X (X- in Units of years and Yc – in Percentage of Dividend Payout)
The figures of Dividend payout in percentage of Andhra Bank with indices and trend values have been
shown in the Table 3. Total Dividend payout of the bank have registered a falling trend from 83.99 percentage
to 18.39 percentage throughout the period of the study from 2006 to 2015. Trend indices revealed decrease from
100 in 2006 to 21 percent in 2015 during the period of the study. Actual dividend payout was in par with the
trend values as revealed in Graph 2. The mean value of the dividend payout was 37.22 and the co-efficient of
variation (CV) was 69.15 that showed high fluctuations dividend payout of the bank.
Graph 2: Actual and Trend percentage of Dividend Payout of Andhra Bank(FY 2006 to FY 2015)
Table 4 ANOVA of Dividend Payout Trend of Andhra Bank df SS MS F Significance F
Regression 1 2317.884 2317.884 5.08981 0.054054
Residual 8 3643.175 455.3969
Total 9 5961.059
From Table 5.4, it is clear that the calculated value of ‘F’ is 5.08981, which is closely equal to the table
value of ‘F’ (5.987378) at 5% level. Therefore, null hypothesis is rejected and alternate hypothesis is accepted.
This proves that the difference between actual and trend values of dividend payout during the study period were
significant. Further, the fitted linear regression is significant and hence it can be used for the prediction of
dividend payout.

Dividend Payout Policy: A Study on Indian Banking Industry
DOI: 10.9790/487X-1909044365 www.iosrjournals.org 47 | Page
Table 5.5 Actual and Trend values of Dividend Payout (In Percentage) ofBank of Baroda (2006 to 2015)
BANK YEAR DPR TREND VALUES
(Yc=a+bx)
TREND INDICES It=
(Yt/Y0)x100
Bank of Baroda 2006 22.96 20.74 100.00
2007 22.36 20.61 97.42
2008 22.02 20.49 95.92
2009 16.09 20.36 70.08
2010 20.39 20.24 88.81
2011 16.99 20.12 74.02
2012 15.48 19.99 67.42
2013 22.06 19.87 96.08
2014 21.67 19.74 94.40
2015 21.77 19.62 94.85
Mean 20.18
S.D. 2.85 C.V. 14.13
Yc= 20.86289 – 0.12452X (X- in Units of years and Yc – in Percentage of Dividend Payout)
The figures of dividend payout in percentage of Bank of Baroda with indices and trend values have
been shown in the Table 5. Total dividend payout of the company have shown stable trend. Trend indices
revealed stable payout from 100 in 2006 to 94.85 in 2015. The mean value of the dividend payout was 20.18 and
the co-efficient of variation (CV) was 14.13, which showed the not much fluctuations in dividend payout.
Graph 3: Actual and Trend percentage of Dividend Payout of Bank of Baroda (FY 2006 to FY 2015)
Table 6 ANOVA of Dividend Payout Trend of Bank of Baroda df SS MS F Significance F
Regression 1 1.279277 1.279277 0.142281 0.715833
Residual 8 71.92947 8.991184
Total 9 73.20875
From Table 6, it is clear that the calculated value of ‘F’ is 0.142281, which is less than the table value
of ‘F’ (5.987378) at 5% level. Therefore, null hypothesis is accepted and alternate hypothesis is rejected. This
proves that the difference between actual and trend values of dividend payout during the study period were not significant.
Further, the fitted linear regression is significant and hence it can be used for the prediction of dividend payout.
Table 7 Actual and Trend values of Dividend Payout (In Percentage) ofBank of India (2006 to 2015) BANK YEAR DPR TREND VALUES
(Yc=a+bx)
TREND INDICES It=
(Yt/Y0)x100
Bank of India 2006 20.43 17.59 100.00
2007 15.40 17.60 75.35
2008 12.54 17.62 61.37
2009 15.92 17.64 77.91
2010 23.98 17.66 117.38
2011 17.48 17.67 85.52
2012 17.10 17.69 83.69
2013 24.72 17.71 120.98
2014 12.57 17.73 61.53
2015 16.52 17.75 80.83
Mean 17.67 S.D. 4.21
C.V. 23.83
Yc= 17.56883 + 0.017682X (X- in Units of years and Yc – in Percentage of Dividend Payout)

Dividend Payout Policy: A Study on Indian Banking Industry
DOI: 10.9790/487X-1909044365 www.iosrjournals.org 48 | Page
The figures of dividend payout in percentage of Bank of India with indices and trend values have been
shown in the Table 7. Total dividend payout of the company have registered stable trend. Trend indices revealed
increase from 100 in 2006 to 80.83 in 2015 i.e. not much difference in dividend payout during the period of the
study. The mean value of the dividend payout was 17.67 and the co-efficient of variation (CV) was 23.83, which
showed the not much fluctuations in dividend payout of the company.
Graph 4: Actual and Trend percentage of Dividend Payout of Bank of India(FY 2006 to FY 2015)
Table8 ANOVA of Dividend Payout Trend of Bank of India
df SS MS F Significance F
Regression 1 0.025795 0.025795 0.001294 0.972181
Residual 8 159.4136 19.92671
Total 9 159.4394
From Table 8, it is clear that the calculated value of ‘F’ is 0.001294, which is less than the table value
of ‘F’ (5.987378) at 5% level. Therefore, null hypothesis is accepted and alternate hypothesis is rejected. This
proves that the difference between actual and trend values of dividend payout during the study period was not
significant. Further, the fitted linear regression is significant and hence it can be used for the prediction of
dividend payout.
Table 9 Actual and Trend values of Dividend Payout (In Percentage) ofBank of Maharashtra (2006 to 2015) BANK YEAR DPR TREND VALUES
(Yc=a+bx)
TREND INDICES It=
(Yt/Y0)x100
Bank of Maharashtra 2006 32.91 44.77 100.00
2007 31.55 42.99 95.88
2008 26.10 41.20 79.32
2009 17.14 39.42 52.09
2010 133.23 37.63 404.85
2011 37.61 35.85 114.30
2012 29.69 34.06 90.23
2013 19.78 32.28 60.11
2014 21.05 30.49 63.97
2015 18.31 28.71 55.63
Mean 36.74
S.D. 34.60
C.V. 94.17
Yc= 46.556 – 1.78493X (X- in Units of years and Yc – in Percentage of Dividend Payout)
The figures of Dividend payout in percentage of Bank of Maharashtra with indices and trend values
have been shown in the Table 9. Total Dividend payout of the bank have shown varying trend from 32.91
percentage to increase by 133.23 percentage and falling to 18.31 percentage at different periods from 2006 to
2015. Trend indices revealed decrease from 100 in 2006 to 55 percent in 2015 during the period of the study.
Actual dividend payout was comparatively different with the trend values as revealed in Graph 5. The mean
value of the dividend payout was 36.74 and the co-efficient of variation (CV) was 94.17 that showed high
fluctuations dividend payout of the company.

Dividend Payout Policy: A Study on Indian Banking Industry
DOI: 10.9790/487X-1909044365 www.iosrjournals.org 49 | Page
Graph 5: Actual and Trend percentage of Dividend Payout of Bank of Maharashtra(FY 2006 to FY 2015)
Table 10 ANOVA of Dividend Payout Trend of Bank of Maharashtra df SS MS F Significance F
Regression 1 262.8425 262.8425 0.200054 0.666539
Residual 8 10510.87 1313.859
Total 9 10773.71
From Table 10, it is clear that the calculated value of ‘F’ is 0.200054, which is less than the table value
of ‘F’ (5.987378) at 5% level. Therefore, null hypothesis is accepted and alternate hypothesis is rejected. This
proves that the difference between actual and trend values of dividend payout during the study period was not significant.
Further, the fitted linear regression is significant and hence it can be used for the prediction of dividend payout.
Table 11 Actual and Trend values of Dividend Payout (In Percentage) ofCanara Bank (2006 to 2015) BANK YEAR DPR TREND VALUES
(Yc=a+bx)
TREND INDICES It=
(Yt/Y0)x100
Canara Bank 2006 78.31 658.44 100.00
2007 2,077.35 565.12 2652.80
2008 101.66 471.80 129.82
2009 28.72 378.48 36.68
2010 14.79 285.16 18.88
2011 12.08 191.85 15.43
2012 14.58 98.53 18.62
2013 19.40 5.21 24.77
2014 19.29 -88.11 24.63
2015 18.88 -181.43 24.12
Mean 238.51
S.D. 646.83
C.V. 271.20
Yc= 751.7603 – 93.3191X (X- in Units of years and Yc – in Percentage of Dividend Payout)
The figures of Dividend payout in percentage of Canara Bank with indices and trend values have been
shown in the Table 11. Total Dividend payout of the bank have registered a falling trend from 78.31 percentage
to 18.88 percentage throughout the period of the study from 2006 to 2015. Trend indices revealed decrease from
100 in 2006 to 24.12 percent in 2015 during the period of the study. Actual dividend payout was in par with the
trend values as revealed in Graph 6. The mean value of the dividend payout was 238.51 and the co-efficient of
variation (CV) was 271.20 that showed high fluctuations dividend payout of the company
Graph 6: Actual and Trend percentage of Dividend Payout of Canara Bank(FY 2006 to FY 2015)
Dividend Payout Policy: A Study on Indian Banking Industry
DOI: 10.9790/487X-1909044365 www.iosrjournals.org 50 | Page
Table 12 ANOVA of Dividend Payout Trend of Canara Bank df SS MS F Significance F
Regression 1 718447 718447 1.886277 0.206878
Residual 8 3047048 380881
Total 9 3765495
From Table 12, it is clear that the calculated value of ‘F’ is 1.1886277, which is less than the table
value of ‘F’ (5.987378) at 5% level. Therefore, null hypothesis is accepted and alternate hypothesis is rejected. This proves
that the difference between actual and trend values of dividend payout during the study period was not significant. Further,
the fitted linear regression is significant and hence it can be used for the prediction of dividend payout.
Table 13 Actual and Trend values of Dividend Payout (In Percentage) ofCorporation Bank (2006 to 2015) BANK YEAR DPR TREND VALUES
(Yc=a+bx)
TREND INDICES It=
(Yt/Y0)x100
Corporation Bank 2006 22.67 22.49 100.00
2007 25.01 22.16 110.34
2008 20.07 21.83 88.55
2009 20.47 21.50 90.31
2010 20.03 21.16 88.39
2011 20.86 20.83 92.04
2012 20.37 20.50 89.87
2013 20.13 20.17 88.82
2014 19.89 19.84 87.77
2015 20.47 19.51 90.32
Mean 21.00 S.D. 1.62
C.V. 7.71
Yc= 22.82204 – 0.33167X (X- in Units of years and Yc – in Percentage of Dividend Payout)
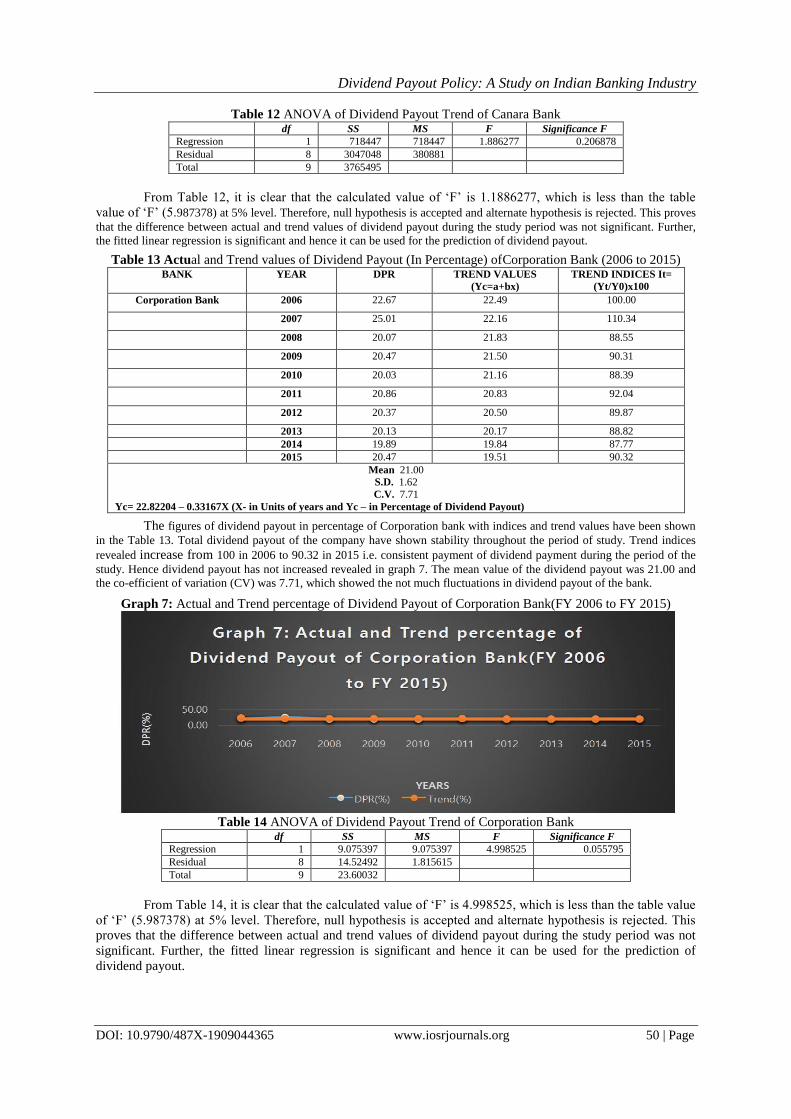
The figures of dividend payout in percentage of Corporation bank with indices and trend values have been shown
in the Table 13. Total dividend payout of the company have shown stability throughout the period of study. Trend indices
revealed increase from 100 in 2006 to 90.32 in 2015 i.e. consistent payment of dividend payment during the period of the
study. Hence dividend payout has not increased revealed in graph 7. The mean value of the dividend payout was 21.00 and
the co-efficient of variation (CV) was 7.71, which showed the not much fluctuations in dividend payout of the bank.
Graph 7: Actual and Trend percentage of Dividend Payout of Corporation Bank(FY 2006 to FY 2015)
Table 14 ANOVA of Dividend Payout Trend of Corporation Bank
df SS MS F Significance F
Regression 1 9.075397 9.075397 4.998525 0.055795
Residual 8 14.52492 1.815615
Total 9 23.60032
From Table 14, it is clear that the calculated value of ‘F’ is 4.998525, which is less than the table value
of ‘F’ (5.987378) at 5% level. Therefore, null hypothesis is accepted and alternate hypothesis is rejected. This
proves that the difference between actual and trend values of dividend payout during the study period was not
significant. Further, the fitted linear regression is significant and hence it can be used for the prediction of
dividend payout.

Dividend Payout Policy: A Study on Indian Banking Industry
DOI: 10.9790/487X-1909044365 www.iosrjournals.org 51 | Page
Table 15 Actual and Trend values of Dividend Payout (In Percentage) ofCity Union Bank (2006 to 2015) BANK YEAR DPR TREND VALUES
(Yc=a+bx)
TREND INDICES It=
(Yt/Y0)x100
City Union Bank 2006 15.73 17.52 100.00
2007 19.65 17.20 124.94
2008 19.64 16.87 124.86
2009 16.01 16.55 101.79
2010 14.57 16.23 92.61
2011 12.73 15.90 80.94
2012 15.64 15.58 99.43
2013 16.61 15.26 105.62
2014 13.45 14.93 85.53
2015 16.63 14.61 105.75
Mean 16.07
S.D. 2.28 C.V. 14.18
Yc= 17.84325 – 0.32322 X (X- in Units of years and Yc – in Percentage of Dividend Payout)
The figures of dividend payout in percentage of City Union bank with indices and trend values have
been shown in the Table 15. Total dividend payout of the company have registered stable trend. Trend indices revealed
increase from 100 in 2006 to 105.75 in 2015 i.e. increase in dividend payout during the period of the study. The mean value
of the dividend payout was 16.07 and the co-efficient of variation (CV) was 14.18, which showed the not much fluctuations
in dividend payout of the bank.
Graph 8: Actual and Trend percentage of Dividend Payout of City Union Bank (FY 2006 to FY 2015)
Table 16 ANOVA of Dividend Payout Trend of City Union Bank df SS MS F Significance F
Regression 1 8.619012 8.619012 1.808984 0.215512
Residual 8 38.11649 4.764561
Total 9 46.7355
From Table 16, it is clear that the calculated value of ‘F’ is 1.808984, which is less than the table value
of ‘F’ (5.987378) at 5% level. Therefore, null hypothesis is accepted and alternate hypothesis is rejected. This
proves that the difference between actual and trend values of dividend payout during the study period was not significant.
Further, the fitted linear regression is significant and hence it can be used for the prediction of dividend payout.
Table 17 Actual and Trend values of Dividend Payout (In Percentage) ofFederal Bank (2006 to 2015) BANK YEAR DPR TREND VALUES
(Yc=a+bx)
TREND INDICES It=
(Yt/Y0)x100
Federal Bank 2006 13.31 15.45 100.00
2007 11.70 16.11 87.91
2008 19.00 16.77 142.80
2009 18.12 17.43 136.18
2010 19.45 18.08 146.19
2011 26.13 18.74 196.37
2012 20.42 19.40 153.51
2013 18.06 20.06 135.70
2014 20.13 20.71 151.30
2015 17.82 21.37 133.92
Mean 18.41
S.D. 3.94
C.V. 21.40
Yc= 14.79468 + 0.657809X (X- in Units of years and Yc – in Percentage of Dividend Payout)

Dividend Payout Policy: A Study on Indian Banking Industry
DOI: 10.9790/487X-1909044365 www.iosrjournals.org 52 | Page
The figures of dividend payout in percentage of Federal bank with indices and trend values have been
shown in the Table 17. Total dividend payout of the company have registered increase trend. Trend indices
revealed increase from 100 in 2006 to 133.92 in 2015 i.e. increase in dividend payout to an extent of 0.3 times
during the period of the study. The mean value of the dividend payout was 18.41 and the co-efficient of
variation (CV) was 21.40, which showed the not much fluctuations in dividend payout of the company.
Graph 9: Actual and Trend percentage of Dividend Payout of Federal Bank(FY 2006 to FY 2015)
Table 18 ANOVA of Dividend Payout Trend of Federal Bank
df SS MS F Significance F
Regression 1 35.69885 35.69885 2.745963 0.13609
Residual 8 104.0039 13.00049 Total 9 139.7027
From Table 18, it is clear that the calculated value of ‘F’ is 2.745963, which is less than the table value
of ‘F’ (5.987378) at 5% level. Therefore, null hypothesis is accepted and alternate hypothesis is rejected. This
proves that the difference between actual and trend values of dividend payout during the study period was not
significant. Further, the fitted linear regression is significant and hence it can be used for the prediction of
dividend payout.
Table 19 Actual and Trend values of Dividend Payout (In Percentage) ofHDFC Bank (2006 to 2015) BANK YEAR DPR TREND VALUES
(Yc=a+bx)
TREND INDICES It=
(Yt/Y0)x100
HDFC 2006 19.54 19.25 100.00
2007 19.42 19.20 99.43
2008 18.89 19.14 96.67
2009 18.92 19.09 96.84
2010 18.30 19.03 93.66
2011 19.24 18.98 98.46
2012 19.14 18.93 97.98
2013 19.06 18.87 97.58
2014 18.80 18.82 96.20
2015 18.76 18.76 96.02
Mean 19.01
S.D. 0.36
C.V. 1.89
Yc= 19.30345 – 0.05402 X (X- in Units of years and Yc – in Percentage of Dividend Payout)
The figures of dividend payout in percentage of HDFC bank with indices and trend values have been
shown in the Table 19. Total dividend payout of the company have shown stability throughout the period of
study. Trend indices revealed increase from 100 in 2006 to 96.02 in 2015 i.e. consistent payment of dividend
payment during the period of the study. Hence dividend payout has not increased revealed in graph 10. The
mean value of the dividend payout was 19.01 and the co-efficient of variation (CV) was 1.89, which showed the
slight variation in dividend payout of the bank.

Dividend Payout Policy: A Study on Indian Banking Industry
DOI: 10.9790/487X-1909044365 www.iosrjournals.org 53 | Page
Graph 10: Actual and Trend percentage of Dividend Payout of HDFC Bank(FY 2006 to FY 2015)
Table 20 ANOVA of Dividend Payout Trend of HDFC Bank df SS MS F Significance F
Regression 1 0.240765 0.240765 2.094904 0.185815
Residual 8 0.919432 0.114929
Total 9 1.160198
From Table20, it is clear that the calculated value of ‘F’ is 2.094904, which is less than the table value
of ‘F’ (5.987378) at 5% level. Therefore, null hypothesis is accepted and alternate hypothesis is rejected. This
proves that the difference between actual and trend values of dividend payout during the study period was not
significant. Further, the fitted linear regression is significant and hence it can be used for the prediction of
dividend payout.
Table 21 Actual and Trend values of Dividend Payout (In Percentage) ofICICI Bank (2006 to 2015) BANK YEAR DPR TREND VALUES
(Yc=a+bx)
TREND INDICES It=
(Yt/Y0)x100
ICICI Bank 2006 31.38 34.70 100.00
2007 32.91 33.35 104.89
2008 36.13 32.00 115.14
2009 34.24 30.66 109.11
2010 28.65 29.31 91.30
2011 26.46 27.97 84.35
2012 24.89 26.62 79.32
2013 24.02 25.28 76.57
2014 24.06 23.93 76.67
2015 23.67 22.58 75.44
Mean 28.64
S.D. 4.70
C.V. 16.42
Yc= 36.04233 – 1.3459X (X- in Units of years and Yc – in Percentage of Dividend Payout)
The figures of dividend payout in percentage of ICICI bank with indices and trend values have been
shown in the Table 21. Total dividend payout of the company have registered falling trend. Trend indices
revealed increase from 100 in 2006 to 75.44 in 2015 i.e. fall in dividend payout to an extent of 0.25 times during
the period of the study. Hence dividend payout has not increased as per the expectations. The mean value of the
dividend payout was 28.64 and the co-efficient of variation (CV) was 16.42, which showed the not much
fluctuations in dividend payout.

Dividend Payout Policy: A Study on Indian Banking Industry
DOI: 10.9790/487X-1909044365 www.iosrjournals.org 54 | Page
Graph 11: Actual and Trend percentage of Dividend Payout of ICICI Bank(FY 2006 to FY 2015)
Table 22 ANOVA of Dividend Payout Trend of ICICI Bank df SS MS F Significance F
Regression 1 149.4435 149.4435 24.16266 0.001171
Residual 8 49.47915 6.184894
Total 9 198.9226
From Table 22, it is clear that the calculated value of ‘F’ is 24.16266, which is more than the table
value of ‘F’ (5.987378) at 5% level of significance. Therefore, null hypothesis is rejected and alternate
hypothesis is accepted. This proves that the difference between actual and trend values of dividend payout
during the study period was significant. Further, the fitted linear regression is significant and hence it can be
used for the prediction of dividend payout.
Table 23 Actual and Trend values of Dividend Payout (In Percentage) ofKotak Mahindra Bank (2006 to 2015) BANK YEAR DPR TREND VALUES
(Yc=a+bx)
TREND INDICES It=
(Yt/Y0)x100
Kotak Mahindra Bank 2006 2.67 3.29 100.00
2007 4.25 3.19 159.30
2008 2.61 3.08 97.89
2009 3.98 2.98 149.22
2010 2.27 2.87 85.12
2011 2.35 2.77 88.30
2012 2.43 2.66 91.08
2013 2.39 2.56 89.76
2014 2.56 2.45 95.98
2015 2.69 2.35 101.07
Mean 2.82
S.D. 0.70 C.V. 24.76
Yc= 3.393755 – 0.10431X (X- in Units of years and Yc – in Percentage of Dividend Payout)
The figures of dividend payout in percentage of Kotak Mahindra bank with indices and trend values
have been shown in the Table 23. Total dividend payout of the company have shown stability throughout the
period of study. Trend indices revealed increase from 100 in 2006 to 101.07 in 2015 i.e. consistent payment of
dividend payment during the period of the study. Hence dividend payout has not increased revealed in graph 12.
The mean value of the dividend payout was 2.82 and the co-efficient of variation (CV) was 24.76, which
showed slight fluctuations in dividend payout of the bank.

Dividend Payout Policy: A Study on Indian Banking Industry
DOI: 10.9790/487X-1909044365 www.iosrjournals.org 55 | Page
Graph 12: Actual and Trend percentage of Dividend Payout of Kotak Mahindra Bank (FY 2006 to FY 2015)
Table 24 ANOVA of Dividend Payout Trend of Kotak Mahindra Bank df SS MS F Significance F
Regression 1 0.897585 0.897585 2.058091 0.189312
Residual 8 3.488999 0.436125 Total 9 4.386584
From Table 24, it is clear that the calculated value of ‘F’ is 2.058091, which is less than the table value
of ‘F’ (5.987378) at 5% level. Therefore, null hypothesis is accepted and alternate hypothesis is rejected. This
proves that the difference between actual and trend values of dividend payout during the study period was not
significant. Further, the fitted linear regression is significant and hence it can be used for the prediction of
dividend payout.
Table 25 Actual and Trend values of Dividend Payout (In Percentage) ofKarurVysya Bank (2006 to 2015) BANK YEAR DPR TREND VALUES
(Yc=a+bx)
TREND INDICES It=
(Yt/Y0)x100
KarurVysya Bank 2006 51.29 51.61 100.00
2007 86.62 48.38 168.87
2008 31.08 45.15 60.59
2009 27.45 41.92 53.52
2010 19.44 38.69 37.90
2011 30.95 35.46 60.34
2012 29.91 32.23 58.31
2013 27.27 29.00 53.16
2014 32.59 25.77 63.53
2015 34.12 22.54 66.52
Mean 37.07 S.D. 19.18
C.V. 51.73
Yc= 54.83553 – 3.2299X (X- in Units of years and Yc – in Percentage of Dividend Payout)
The figures of Dividend payout in percentage of KarurVysya Bank with indices and trend values have
been shown in the Table 25. Total Dividend payout of the bank have registered a falling trend from 51.29
percentage to 34.12 percentage throughout the period of the study from 2006 to 2015. Trend indices revealed
decrease from 100 in 2006 to 66.52 percent in 2015 during the period of the study. Actual dividend payout was
in par with the trend values as revealed in Graph 13. The mean value of the dividend payout was 37.07 and the
co-efficient of variation (CV) was 51.73 that showed high fluctuations dividend payout of the bank.

Dividend Payout Policy: A Study on Indian Banking Industry
DOI: 10.9790/487X-1909044365 www.iosrjournals.org 56 | Page
Graph 13: Actual and Trend percentage of Dividend Payout of KarurVysyaBank(FY 2006 to FY 2015)
Table 26 ANOVA of Dividend Payout Trend of KarurVysya Bank df SS MS F Significance F
Regression 1 860.6598 860.6598 2.810754 0.132159
Residual 8 2449.619 306.2024
Total 9 3310.279
From Table26, it is clear that the calculated value of ‘F’ is 2.810754, which is less than the table value
of ‘F’ (5.987378) at 5% level. Therefore, null hypothesis is accepted and alternate hypothesis is rejected. This
proves that the difference between actual and trend values of dividend payout during the study period was not
significant. Further, the fitted linear regression is significant and hence it can be used for the prediction of
dividend payout.
Table 27 Actual and Trend values of Dividend Payout (In Percentage) ofLakshmi Vilas Bank (2006 to 2015) BANK YEAR DPR TREND VALUES
(Yc=a+bx)
TREND INDICES It=
(Yt/Y0)x100
Lakshmi Vilas Bank 2006 21.73 21.03 100.00
2007 19.42 20.55 89.37
2008 28.95 20.07 133.21
2009 21.02 19.59 96.73
2010 19.08 19.11 87.78
2011 24.11 18.63 110.92
2012 31.90 18.14 146.77
2013 31.95 17.66 147.03
2014 16.35 17.18 75.25
2015 27.09 16.70 124.67
Mean 24.16
S.D. 5.55
C.V. 22.97
Yc = 21.51381 – 0.48146X (X- in Units of years and Yc – in Percentage of Dividend Payout)
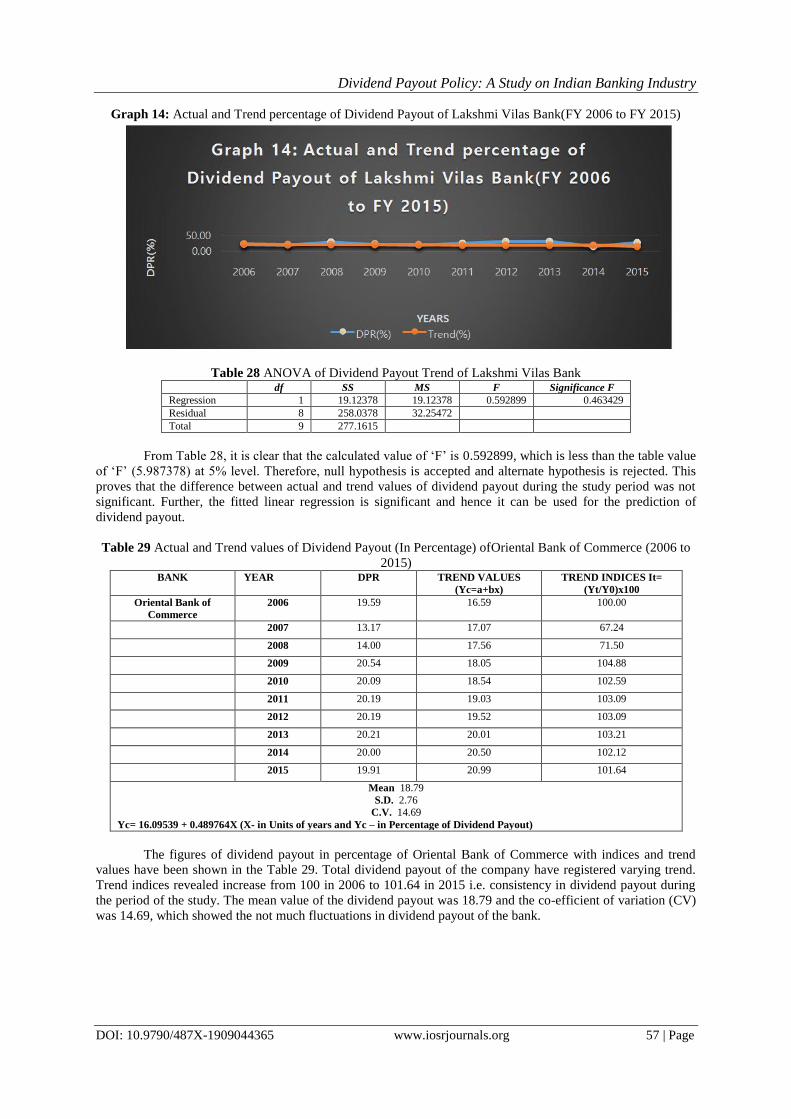
The figures of dividend payout in percentage of Lakshmi Vilas bank with indices and trend values have
been shown in the Table 27. Total dividend payout of the company have registered increase trend. Trend indices
revealed increase from 100 in 2006 to 124.67 in 2015 i.e. increase in dividend payout during the period of the
study. The mean value of the dividend payout was 24.16 and the co-efficient of variation (CV) was 22.97, which
showed the not much fluctuations in dividend payout of the bank.
Dividend Payout Policy: A Study on Indian Banking Industry
DOI: 10.9790/487X-1909044365 www.iosrjournals.org 57 | Page
Graph 14: Actual and Trend percentage of Dividend Payout of Lakshmi Vilas Bank(FY 2006 to FY 2015)
Table 28 ANOVA of Dividend Payout Trend of Lakshmi Vilas Bank df SS MS F Significance F
Regression 1 19.12378 19.12378 0.592899 0.463429
Residual 8 258.0378 32.25472 Total 9 277.1615
From Table 28, it is clear that the calculated value of ‘F’ is 0.592899, which is less than the table value
of ‘F’ (5.987378) at 5% level. Therefore, null hypothesis is accepted and alternate hypothesis is rejected. This
proves that the difference between actual and trend values of dividend payout during the study period was not
significant. Further, the fitted linear regression is significant and hence it can be used for the prediction of
dividend payout.
Table 29 Actual and Trend values of Dividend Payout (In Percentage) ofOriental Bank of Commerce (2006 to
2015) BANK YEAR DPR TREND VALUES
(Yc=a+bx)
TREND INDICES It=
(Yt/Y0)x100
Oriental Bank of
Commerce
2006 19.59 16.59 100.00
2007 13.17 17.07 67.24
2008 14.00 17.56 71.50
2009 20.54 18.05 104.88
2010 20.09 18.54 102.59
2011 20.19 19.03 103.09
2012 20.19 19.52 103.09
2013 20.21 20.01 103.21
2014 20.00 20.50 102.12
2015 19.91 20.99 101.64
Mean 18.79
S.D. 2.76
C.V. 14.69
Yc= 16.09539 + 0.489764X (X- in Units of years and Yc – in Percentage of Dividend Payout)
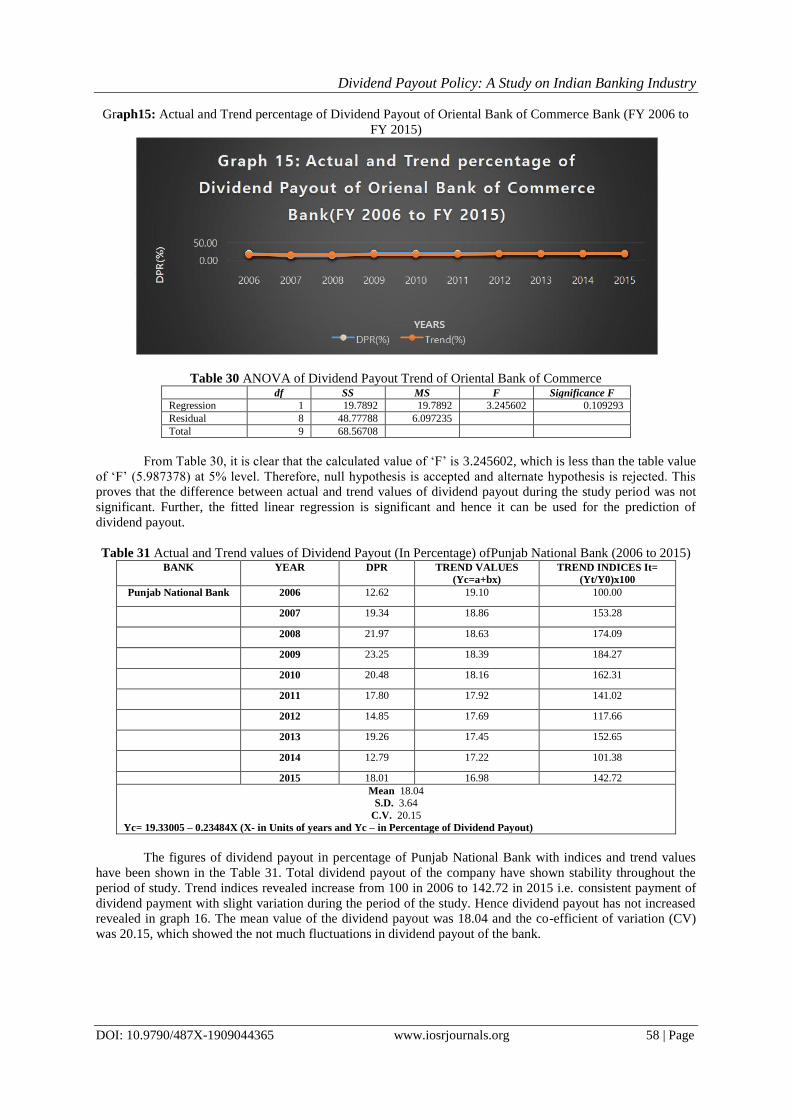
The figures of dividend payout in percentage of Oriental Bank of Commerce with indices and trend
values have been shown in the Table 29. Total dividend payout of the company have registered varying trend.
Trend indices revealed increase from 100 in 2006 to 101.64 in 2015 i.e. consistency in dividend payout during
the period of the study. The mean value of the dividend payout was 18.79 and the co-efficient of variation (CV)
was 14.69, which showed the not much fluctuations in dividend payout of the bank.
Dividend Payout Policy: A Study on Indian Banking Industry
DOI: 10.9790/487X-1909044365 www.iosrjournals.org 58 | Page
Graph15: Actual and Trend percentage of Dividend Payout of Oriental Bank of Commerce Bank (FY 2006 to
FY 2015)
Table 30 ANOVA of Dividend Payout Trend of Oriental Bank of Commerce df SS MS F Significance F
Regression 1 19.7892 19.7892 3.245602 0.109293
Residual 8 48.77788 6.097235
Total 9 68.56708
From Table 30, it is clear that the calculated value of ‘F’ is 3.245602, which is less than the table value
of ‘F’ (5.987378) at 5% level. Therefore, null hypothesis is accepted and alternate hypothesis is rejected. This
proves that the difference between actual and trend values of dividend payout during the study period was not
significant. Further, the fitted linear regression is significant and hence it can be used for the prediction of
dividend payout.
Table 31 Actual and Trend values of Dividend Payout (In Percentage) ofPunjab National Bank (2006 to 2015) BANK YEAR DPR TREND VALUES
(Yc=a+bx)
TREND INDICES It=
(Yt/Y0)x100
Punjab National Bank 2006 12.62 19.10 100.00
2007 19.34 18.86 153.28
2008 21.97 18.63 174.09
2009 23.25 18.39 184.27
2010 20.48 18.16 162.31
2011 17.80 17.92 141.02
2012 14.85 17.69 117.66
2013 19.26 17.45 152.65
2014 12.79 17.22 101.38
2015 18.01 16.98 142.72
Mean 18.04 S.D. 3.64
C.V. 20.15
Yc= 19.33005 – 0.23484X (X- in Units of years and Yc – in Percentage of Dividend Payout)
The figures of dividend payout in percentage of Punjab National Bank with indices and trend values
have been shown in the Table 31. Total dividend payout of the company have shown stability throughout the
period of study. Trend indices revealed increase from 100 in 2006 to 142.72 in 2015 i.e. consistent payment of
dividend payment with slight variation during the period of the study. Hence dividend payout has not increased
revealed in graph 16. The mean value of the dividend payout was 18.04 and the co-efficient of variation (CV)
was 20.15, which showed the not much fluctuations in dividend payout of the bank.

Dividend Payout Policy: A Study on Indian Banking Industry
DOI: 10.9790/487X-1909044365 www.iosrjournals.org 59 | Page
Graph 16: Actual and Trend percentage of Dividend Payout of Punjab National Bank(FY 2006 to FY 2015)
Table 32 ANOVA of Dividend Payout Trend of Punjab National Bank df SS MS F Significance F
Regression 1 4.549884 4.549884 0.318215 0.588144
Residual 8 114.3852 14.29815 Total 9 118.9351
From Table 32, it is clear that the calculated value of ‘F’ is 0.318215, which is less than the table value
of ‘F’ (5.987378) at 5% level. Therefore, null hypothesis is accepted and alternate hypothesis is rejected. This
proves that the difference between actual and trend values of dividend payout during the study period was not
significant. Further, the fitted linear regression is significant and hence it can be used for the prediction of
dividend payout.
Table 33 Actual and Trend values of Dividend Payout (In Percentage) ofState Bank of Bikaner & Jaipur (2006
to 2015) BANK YEAR DPR TREND VALUES
(Yc=a+bx)
TREND INDICES It=
(Yt/Y0)x100
State Bank of Bikaner
& Jaipur
2006 22.41 18.90 100.00
2007 16.35 18.28 72.97
2008 15.87 17.66 70.83
2009 14.87 17.04 66.37
2010 15.82 16.42 70.59
2011 18.23 15.80 81.33
2012 15.57 15.18 69.47
2013 15.43 14.56 68.87
2014 13.68 13.95 61.05
2015 12.89 13.33 57.50
Mean 16.11
S.D. 2.64
C.V. 16.41
Yc= 19.51465 – 0.61881X (X- in Units of years and Yc – in Percentage of Dividend Payout)
The figures of dividend payout in percentage of State Bank of Bikaner and Jaipur with indices and
trend values have been shown in the Table 33. Total dividend payout of the company have registered falling
trend. Trend indices revealed increase from 100 in 2006 to 57.50 in 2015 i.e. fall in dividend payout to an extent
of 0.5 times during the period of the study. Hence dividend payout has not increased as per the expectations.
The mean value of the dividend payout was 16.11 and the co-efficient of variation (CV) was 16.41, which
showed the not much fluctuations in dividend payout of the company.

Dividend Payout Policy: A Study on Indian Banking Industry
DOI: 10.9790/487X-1909044365 www.iosrjournals.org 60 | Page
Graph 17: Actual and Trend percentage of Dividend Payout of State Bank of BJ(FY 2006 to FY 2015)
Table 34 ANOVA of Dividend Payout Trend of State Bank of Bikaner & Jaipur df SS MS F Significance F
Regression 1 31.59103 31.59103 8.06382 0.021822
Residual 8 31.34101 3.917626
Total 9 62.93204
From Table 34, it is clear that the calculated value of ‘F’ is 8.06382, which is more than the table value
of ‘F’ (5.987378) at 5% level of significance. Therefore, null hypothesis is rejected and alternate hypothesis is
accepted. This proves that the difference between actual and trend values of dividend payout during the study
period was significant. Further, the fitted linear regression is significant and hence it can be used for the
prediction of dividend payout.
Table 35 Actual and Trend values of Dividend Payout (In Percentage) ofState Bank of India (2006 to 2015) BANK YEAR DPR TREND VALUES
(Yc=a+bx)
TREND INDICES It=
(Yt/Y0)x100
State Bank of India 2006 13.32 13.58 100.00
2007 10.24 13.94 76.87
2008 15.15 14.31 113.71
2009 16.81 14.67 126.13
2010 16.23 15.03 121.82
2011 17.83 15.39 133.81
2012 15.31 15.76 114.89
2013 15.84 16.12 118.92
2014 15.80 16.48 118.60
2015 15.58 16.84 116.95
Mean 15.21
S.D. 2.10
C.V. 13.79
Yc= 13.21849 + 0.362485X (X- in Units of years and Yc – in Percentage of Dividend Payout)
The figures of dividend payout in percentage of State Bank of India with indices and trend values have
been shown in the Table35. Total dividend payout of the company have shown stability throughout the period of
study. Trend indices revealed increase from 100 in 2006 to 116.95 in 2015 i.e. consistent payment of dividend
payment during the period of the study. Hence dividend payout has not increased revealed in graph 18. The
mean value of the dividend payout was 15.21 and the co-efficient of variation (CV) was 13.79, which showed
the not much fluctuations in dividend payout of the bank.

Dividend Payout Policy: A Study on Indian Banking Industry
DOI: 10.9790/487X-1909044365 www.iosrjournals.org 61 | Page
Graph 18: Actual and Trend percentage of Dividend Payout of State Bank of India (FY 2006 to FY 2015)
Table 36 ANOVA of Dividend Payout Trend of State Bank of India df SS MS F Significance F
Regression 1 10.8401 10.8401 3.016491 0.120629
Residual 8 28.7489 3.593612
Total 9 39.58899
From Table36, it is clear that the calculated value of ‘F’ is 3.016491, which is less than the table value
of ‘F’ (5.987378) at 5% level. Therefore, null hypothesis is accepted and alternate hypothesis is rejected. This
proves that the difference between actual and trend values of dividend payout during the study period was not
significant. Further, the fitted linear regression is significant and hence it can be used for the prediction of
dividend payout.
Table 37 Actual and Trend values of Dividend Payout (In Percentage) ofState Bank of Mysore (2006 to 2015) BANK YEAR DPR TREND VALUES
(Yc=a+bx)
TREND INDICES It=
(Yt/Y0)x100
State Bank of Mysore 2006 14.95 13.94 100.00
2007 14.44 13.22 96.62
2008 11.29 12.49 75.52
2009 10.69 11.76 71.47
2010 8.08 11.03 54.02
2011 9.35 10.31 62.53
2012 12.68 9.58 84.80
2013 12.93 8.85 86.52
2014 5.25 8.13 35.13
2015 7.05 7.40 47.14
Mean 10.67 S.D. 3.22
C.V. 30.14
Yc= 14.67085 – 0.72731X (X- in Units of years and Yc – in Percentage of Dividend Payout)
The figures of dividend payout in percentage of State Bank of Mysore with indices and trend values
have been shown in the Table 37. Total dividend payout of the company have registered falling trend. Trend
indices revealed increase from 100 in 2006 to 47.14 in 2015 i.e. fall in dividend payout to an extent of 0.5 times
during the period of the study. Hence dividend payout has not increased as per the expectations. The mean value
of the dividend payout was 10.67 and the co-efficient of variation (CV) was 30.14, which showed the not much
fluctuations in dividend payout of the company.

Dividend Payout Policy: A Study on Indian Banking Industry
DOI: 10.9790/487X-1909044365 www.iosrjournals.org 62 | Page
Graph19: Actual and Trend percentage of Dividend Payout of State Bank of Mysore FY 2006 to FY 2015)
Table 38 ANOVA of Dividend Payout Trend of State Bank of Mysore
df SS MS F Significance F
Regression 1 43.6404 43.6404 7.06347 0.028908
Residual 8 49.42658 6.178323
Total 9 93.06698
From Table 38, it is clear that the calculated value of ‘F’ is 7.06347, which is more than the table value
of ‘F’ (5.987378) at 5% level of significance. Therefore, null hypothesis is rejected and alternate hypothesis is
accepted. This proves that the difference between actual and trend values of dividend payout during the study
period was significant. Further, the fitted linear regression is significant and hence it can be used for the
prediction of dividend payout.
Table 39 Actual and Trend values of Dividend Payout (In Percentage) ofState Bank of Travancore BANK YEAR DPR TREND VALUES
(Yc=a+bx)
TREND INDICES It=
(Yt/Y0)x100
State Bank of Travancore 2006 19.33 16.34 100.00
2007 15.32 15.62 79.28
2008 12.95 14.90 67.00
2009 10.69 14.18 55.32
2010 11.69 13.46 60.49
2011 12.37 12.73 63.98
2012 17.63 12.01 91.22
2013 16.26 11.29 84.12
2014 4.11 10.57 21.25
2015 10.60 9.85 54.82
Mean 13.09 S.D. 4.34
C.V. 33.16
Yc= 17.06417 – 0.7217X (X- in Units of years and Yc – in Percentage of Dividend Payout)
The figures of dividend payout in percentage of State Bank of Travancore with indices and trend values
have been shown in the Table 39. Total dividend payout of the company have registered falling trend. Trend
indices revealed increase from 100 in 2006 to 54.82 in 2015 i.e. fall in dividend payout to an extent of 0.4 times
during the period of the study. Hence dividend payout has not increased as per the expectations. The mean value
of the dividend payout was 13.09 and the co-efficient of variation (CV) was 33.16, which showed the not much
fluctuations in dividend payout of the company.

Dividend Payout Policy: A Study on Indian Banking Industry
DOI: 10.9790/487X-1909044365 www.iosrjournals.org 63 | Page
Graph 20: Actual and Trend percentage of Dividend Payout of State Bank of Travancore(FY 2006 to FY 2015)
Table 40 ANOVA of Dividend Payout Trend of State Bank of Travancore
df SS MS F Significance F
Regression 1 42.96963 42.96963 2.71177 0.138226
Residual 8 126.7648 15.84561
Total 9 169.7345
From Table 5.40, it is clear that the calculated value of ‘F’ is 2.71177, which is less than the table value
of ‘F’ (5.987378) at 5% level. Therefore, null hypothesis is accepted and alternate hypothesis is rejected. This
proves that the difference between actual and trend values of dividend payout during the study period was not
significant. Further, the fitted linear regression is significant and hence it can be used for the prediction of
dividend payout.
Table 41 Actual and Trend values of Dividend Payout (In Percentage) ofSouth Indian Bank (2006 to 2015) BANK YEAR DPR TREND VALUES
(Yc=a+bx)
TREND INDICES It=
(Yt/Y0)x100
South Indian Bank 2006 24.90 18.64 100.00
2007 16.91 18.92 67.90
2008 17.89 19.20 71.85
2009 17.41 19.48 69.92
2010 19.34 19.75 77.67
2011 19.31 20.03 77.57
2012 16.95 20.31 68.10
2013 18.68 20.59 75.03
2014 21.19 20.87 85.09
2015 26.37 21.14 105.92
Mean 19.89
S.D. 3.31
C.V. 16.63
Yc = 18.36723 + 0.277544X (X- in Units of years and Yc – in Percentage of Dividend Payout)
The figures of dividend payout in percentage of South Indian Bank with indices and trend values have
been shown in the Table.41. Total dividend payout of the company have shown stability throughout the period
of study. Trend indices revealed increase from 100 in 2006 to 105.92 in 2015 i.e. consistent payment of
dividend payment during the period of the study. Hence dividend payout has not increased revealed in graph 21.
The mean value of the dividend payout was 19.89 and the co-efficient of variation (CV) was 16.63, which
showed the not much fluctuations in dividend payout of the bank.

Dividend Payout Policy: A Study on Indian Banking Industry
DOI: 10.9790/487X-1909044365 www.iosrjournals.org 64 | Page
Graph 21: Actual and Trend percentage of Dividend Payout of South Indian Bank (FY 2006 to FY 2015)
Table 42 ANOVA of Dividend Payout Trend of South Indian Bank df SS MS F Significance F
Regression 1 6.355015 6.355015 0.551462 0.478956
Residual 8 92.19147 11.52393
Total 9 98.54648
From Table 42, it is clear that the calculated value of ‘F’ is 0.551462, which is less than the table value
of ‘F’ (5.987378) at 5% level. Therefore, null hypothesis is accepted and alternate hypothesis is rejected. This
proves that the difference between actual and trend values of dividend payout during the study period was not
significant. Further, the fitted linear regression is significant and hence it can be used for the prediction of
dividend payout.
V. Conclusion:
Corporate Financial Managers view dividend decision as important and relevant decision. However any
advice offered to managers on how to set their dividend policies must be made at the firm-specific level. These
Corporate Financial managers must examine how the various market frictions affect their firms, as well as their
current claimholders, to arrive at optimal dividend policies for their firms.
Banking system plays a very important role in the economics life of the nation. The health of the
economy is closely related to the soundness of its banking system. Private commercial bank in Bangladesh is
now an essential part of our economics system. Shareholders are the owners of the joint stock company.
Generally the company distributes a portion of its earnings to the shareholders. The part of the earnings which is
distributed among the shareholders is called dividend. Dividend policy determines how much of a company’s
earnings will be paid to the shareholders and how much will be retained. The return on a shareholder’s
investment comprise the dividends receive and the capital gain or loss during the period of share are held.
Therefore, a dividend is an important element of shareholder’s return.
References: [1]. Atiyet. B, The impact of financing decision on the shareholders’ value creation. Journal of Business Studies 4(1),2012, 44-63.
[2]. Azhagaiah, R., and N. Sabaripriya, The impact of dividend policy on shareholders’ wealth,International Research Journal of
Finance and Economics,20, 2008: 180-7. [3]. B S Bodla, Karam Pal and Jasvir S Sura, Examining Application of Lintners' Dividend Model in Indian Banking Industry,
IJBM,200740-59 [4]. Baker. H.K, Dividend Policy issues in regulated and unregulated firms: a managerial perspective,Managerial Finance, Vol.25 No.6,
1999, 1-19.
[5]. Baker, H.K., Farrelly, G.E. and Edelman, R.B., A survey of management views on dividend policy.Financial Management. vol. 14 No. 3, 1007-34.
[6]. Bawa, S. K., and P. Kaur, Impact of dividend policy on shareholders’ wealth: An empirical analysis of Indian information
technology sector,Asia Pacific Finance and Accounting Review 1(3),2013, 17 – 24. [7]. Black, Fischer “The Dividend Puzzle”, The Journal of Portfolio Management, Winter, 1976, 634-639.
[8]. Chidinma, O., S. C. Okaro., and V. C. Pius, Shareholders value and firms dividend policy: Evidence from public firms in Nigeria.
Research Journal of Management Science 2(12), 2013, 26-8. [9]. Devaki, S., and D. Kamalaveni, Shareholding patterns and dividend payout: An empirical analysis in Indian corporate hotels.
International Journal of Multidisciplinary Research 2(1),2012, 49-63.
[10]. George,Roje and Kumudha, A, A Study on Dividend Policy of Hindustan Construction Co. Ltd. with Special Reference to Lintner Model.Synergy. January. Vol. 4. No. 1,2006, 86-96.

Dividend Payout Policy: A Study on Indian Banking Industry
DOI: 10.9790/487X-1909044365 www.iosrjournals.org 65 | Page
[11]. Gul, S., M. Sajid, N. Razzaq, M. Iqbal, and M. Bila khan, The relationship between dividend policy and shareholders’ wealth,
Economic and Finance Review 2(2), 2012, 55-9
[12]. Kumaresan, S, Impact of dividend policy on shareholders’ wealth: A study of listed firms in hotels and travels sector of Srilanka, International Journal of Technological Exploration and Learning 3(1),2014, 349-52.
[13]. Olandipupo, A. O., and C. O. Okafor, Control of share wealth maximization in Nigeria, Journal of Business System Governance
and Ethics 6(1), 2011, 19-24. [14]. Onwumere, J., G. Ibe and O. Frank, Does the use of outsiders’ fund enhance shareholders’ wealth: Evidence from Nigeria, Journal
of Finance and Investment Analysis 1(1), 2012,173-97.
[15]. Salman, M, Effect of dividend policy on shareholders’ wealth: A study of sugar industry in Pakistan, Global Journal of Management and Business Research Finance 13(7), 2013, 47-54.
[16]. Tahir, A., and N. Raja, The impact of dividend policy on shareholders’ wealth, International Journal of Business and Management
16 (1), 2014,24-33. [17]. Uwuigbe, U., J. Jafaru and A. Ajayi, Dividend policy and firm performance: A study of listed firms in Nigeria, Accounting and
Management Information Systems 11(3), 2012, 442-54.
IOSR Journal of Business and Management (IOSR-JBM) is UGC approved Journal with Sl.
No. 4481, Journal no. 46879.
Nusrathunnisa. “Dividend Payout Policy: A Study on Indian Banking Industry.” IOSR Journal
of Business and Management (IOSR-JBM) , vol. 19, no. 9, 2017, pp. 43–65.