division of chemical engineering characterization...
TRANSCRIPT

LICENTIATE T H E S I S
Department of Civil, Environmental and Natural Resources EngineeringDivision of Chemical Engineering Characterization of Iron Ore Green Pellets
by Scanning Electron Microscopy and X-ray Microtomography
Iftekhar Uddin Bhuiyan
ISSN: 1402-1757 ISBN 978-91-7439-231-9
Luleå University of Technology 2011
Iftekhar Uddin B
huiyan Characterization of Iron O
re Green Pellets by Scanning E
lectron Microscopy and X
-ray Microtom
ography
ISSN: 1402-1757 ISBN 978-91-7439-XXX-X Se i listan och fyll i siffror där kryssen är
Cover pageCover page


Characterization of Iron Ore Green Pellets by Scanning Electron Microscopy and X-ray Microtomography
Iftekhar Uddin Bhuiyan
Licentiate Thesis in Chemical Technology Department of Civil, Environmental and Natural Resources Engineering
Luleå University of Technology SE-971 87 Luleå
Sweden
April 2011

Printed by Universitetstryckeriet, Luleå 2011
ISSN: 1402-1757 ISBN 978-91-7439-231-9
Luleå 2011
www.ltu.se
Cover illustration: Entrapped air bubbles in different regions of a wet iron ore green pellet observed by cryo-SEM.

Abstract Cryogenic scanning electron microscopy (cryo-SEM), image analysis (IA) of SEM
micrographs and X-ray microtomography (XMT) were used to obtain new information
about the morphology of iron ore green pellets in this work.
Cryo-SEM and freeze fracturing was used to observe entrapped air bubbles and
arrangement of particles around the bubbles and in the matrix of wet green pellets. The
observations of samples prepared by plunge and unidirectional freezing indicate that
unidirectional freezing facilitates the observation of entrapped bubbles with minimum
formation of artifacts, whereas plunge freezing enables observation of the degree of water
filling at the outer surface of wet pellets with minimum amount of artifacts. It was also
observed in the wet pellets that the size of the water domains in the matrix is quite small and
the finer grains are mixed with coarser grains resulting in a denser matrix, whereas no fine
grains were observed in the vicinity of the air bubbles.
Two types of pellets prepared with and without addition of extra flotation reagent prior to
balling were studied using IA and XMT. IA of scanning electron micrographs of epoxy
impregnated pellets was used to separate bubble porosity from packing porosity and to
quantify the former. The individual SEM micrographs acquired by a backscattered electron
detector were reconstructed to provide the entire two-dimensional (2D) sections of the
pellets. The 2D data obtained by IA were unfolded to three-dimensional (3D) by stereology
and relatively good agreement with XMT data was observed. The size and amount of air
bubbles could be quantified with both techniques. The addition of extra flotation reagent
was found to increase the number of entrapped air bubbles and slightly decrease the median
bubble diameter. The additional entrapped air bubbles due to the addition of extra flotation
reagent was shown to be responsible for the difference in total porosity observed by
mercury porosimetry between the two types of pellets.
Mercury intrusion porosimetry (MIP) is shown in this work to produce inappropriate
results with regard to the porosity due to bubble entrapment, it only provides values for total
porosity and the throat size distribution of the porosity.
In summary, this work has shown that cryo-SEM, IA of SEM micrographs and XMT are
powerful and very useful methods for characterization of the morphology of iron ore green
pellets.
i

Keywords: SEM; cryo-SEM; Stereology; Iron ore; Green pellets; Agglomeration; Image
analysis; Porosity; Air bubbles; Mercury porosimetry; X-ray tomography.
ii
Acknowledgements This work has been carried out in the Chemical Technology research subject at Luleå
University of Technology in Sweden within the Agricola Research Center - Multi-
component Mineral System (ARC-MMS). The work has been economically funded by the
Swedish Governmental Agency for Innovation Systems (VINNOVA) and the mining
companies LKAB and New Boliden.
First of all, I would like to express my utmost gratitude to my supervisors Prof. Jonas
Hedlund and Dr. Johanne Mouzon for their continuous guidance, advices, encouragement,
support and valuable discussions through out the work.
I am sincerely grateful to Dr. Seija Forsmo at LKAB for her valuable advice from
industrial perspective and for organizing sample preparation in LKAB.
I would like to thank Dr. Fredrik Forsberg and Prof. Mikael Sjödahl at the division of
Experimental Mechanics at Luleå University of Technology, for a fruitful collaboration in
X-ray microtomography and many helpful discussions.
My profound gratitude goes to Prof. Oleg Antzutkin and all the research fellows in ARC-
MMS for their fruitful discussion in the regular meetings.
I express my gratitude to LKAB numerous personnel for their assistance during micro-
balling and sample preparation for SEM, specially Magnus Andersson and Ulf Fredriksson
for polishing and carbon evaporation respectively.
I thank Johnny Grahn from Engineering Materials division for his assistance during SEM
experiment. Ulf Nordström from the division of mineral processing is acknowledged for his
assistance in particle size distribution measurement by laser diffraction. Sven Karlsson
(Swerea, Sweden) is acknowledged for the help in mercury porosimetry.
I would like to thank all of my colleagues at the division of Chemical engineering, for
making the time very enjoyable and for creating a positive and constructive atmosphere.
Thanks also go to Sazzad, Juwel and numerous friends in the Luleå University of
Technology.
At last, but not least, I would like to give my special thanks to my parents, brothers
(Mofakker and Mahtab) and loving Sarah for all the never-ending love and support from
thousands of kilometers away.
iii

iv

List of Papers The thesis is based on the following papers:
I. Cryo-SEM method for the observation of entrapped bubbles and degree of water
filling in large wet powder compacts.
J. Mouzon, I. U. Bhuiyan, S. P. E. Forsmo, and J. Hedlund
Published online in Journal of Microscopy
II. Quantitative image analysis of bubble cavities in iron ore green pellets.
I. U. Bhuiyan, J. Mouzon, S. P. E. Forsmo, and J. Hedlund
Manuscript submitted to Powder Technology
III. Quantitative 3D analysis of bubble cavities in iron ore pellets by X-ray
microtomography.
J. Mouzon, I. U. Bhuiyan, F. Forsberg, S. P. E. Forsmo, M. Sjödahl, and J. Hedlund
Manuscript
v

vi

Contents Abstract................................................................................................................................................i
Acknowledgements ...........................................................................................................................iii
List of Papers......................................................................................................................................v
Introduction........................................................................................................................................1
Scope of the present work .................................................................................................................2
Background ........................................................................................................................................3
Preparation of iron ore pellets..........................................................................................................3
Iron ore green pellet microstructure.................................................................................................3
Techniques to characterize porosity.................................................................................................4
Mercury porosimetry....................................................................................................................4
Scanning Electron Microscopy (SEM) ........................................................................................5
Sample preparation for SEM analysis .........................................................................................6
Image analysis..............................................................................................................................6
Stereology ....................................................................................................................................7
X - ray tomography......................................................................................................................8
Experimental ....................................................................................................................................11
Materials.........................................................................................................................................11
Preparation of green pellets............................................................................................................11
Cryogenic Scanning Electron Microscopy (Cryo-SEM) ...............................................................11
Freezing of wet pellets ...............................................................................................................11
Polishing of frozen pellets..........................................................................................................12
Fracturing and Transfer..............................................................................................................12
Imaging ......................................................................................................................................13
Scanning Electron Microscopy (SEM) image analysis..................................................................13
Epoxy embedding and polishing................................................................................................13
Imaging, image processing and analysis....................................................................................13
Stereology ......................................................................................................................................17
X-ray microtomography (XMT) ....................................................................................................17
Mercury porosimetry......................................................................................................................18
Results and Discussion.....................................................................................................................21
Observations of wet and frozen iron ore green pellets (Article I) .................................................21
Air bubbles observed by plunge freezing ..................................................................................21
Air bubbles observed by unidirectional freezing .......................................................................22
vii

Microstructure at the outer surface of the wet pellets................................................................23
Matrix among the air bubbles ....................................................................................................24
Spatial distribution of porosity.......................................................................................................25
2D image analysis (Article II)....................................................................................................25
Stereological unfolding (Article II)............................................................................................26
X-ray microtomography (XMT) (Article III) ............................................................................27
Mercury porosimetry (Article II) ...............................................................................................29
Comparison ................................................................................................................................30
Conclusions .......................................................................................................................................33
Future work......................................................................................................................................35
Bibliography .....................................................................................................................................37
viii
Introduction Iron ore fines are agglomerated into green pellets by first mixing magnetite concentrates,
water, additives and binder, i.e. bentonite. Pellets are formed in a balling drum or disk and
then the green pellets are dried and indurated in straight grate or grate kiln plant prior to
transport to steelmaking plants [1].
Magnetite is the main ore constitute in the Kiruna ore deposits in the northernmost part of
Sweden. The ore contains apatite and this gangue mineral is separated from magnetite
particles in order to reduce the phosphorus content to an acceptable level for blast furnace
feed. The separation is carried out in LKAB flotation plant with a fatty acid based flotation
collector reagent.
The main constituent of iron ore green pellet is mineral and pores that both play important
role in controlling the final pellets properties. The space among the mineral grains may be
termed as packing porosity and the space due to entrapped air bubbles may be termed as
bubble porosity. Both pore structures are important characteristics of iron ore green pellets
that affect permeability and durability of the pellets and need to be quantified in terms of
morphology i.e. shape, size and arrangement [2-5].
Air bubbles may be entrapped during balling of green pellets. The entrapped air bubbles
may act as crack initiators and may eventually deteriorate the compressive strength of the
green pellets [6]. However, air bubble incorporation and their mechanical effects in iron ore
green pellets are not well known.
Characterization of porosity in green pellets can be carried out by pycnometry and mercury
porosimetry [7]. With both techniques, only total porosity can be determined but the
characterization of pore morphology remains unexplored. Moreover, mercury is not
environmentally viable and due to the fact, several companies have already closed mercury
porosimetry.
Reports on quantification or visualization of entrapped air bubbles in iron ore pellets are
scarce. Forsmo et al. [6] have reported SEM images of air bubbles in iron ore pellets, but no
quantification was carried out. However, some works for other materials like cement and
concrete [8, 9], dairy products [10] and lungs [11] have been published. Therefore, a
suitable technique is needed for the characterization of entrapped air bubbles in terms of
size, number and morphology.
1
Cryogenic scanning electron microscopy (Cryo-SEM) and freeze fracturing is an attractive
technique for the studies of internal structure of water containing samples. In the present
work, this technique was used for the first time for studies of air bubbles in frozen wet iron
ore green pellets. Furthermore, scanning electron microscopy and image analysis of the
micrographs of dried green pellets was used for quantitative analysis of porosity in iron ore
green pellets for the first time in the present work. Two types of pellets were analyzed;
pellets prepared directly from iron ore concentrate and pellets prepared after addition of
extra flotation collector reagent prior to balling. In the present work, the 2D data obtained
by image analysis was also unfolded to 3D by stereology. X-ray microtomography (XMT),
on the other hand, is an advanced non-destructive technique that provides unique 3D
internal structural information and pore structure [12], pore network [13, 14], crack [15],
foam [16], sintering [17, 18], air-water interfaces [19], air voids [20], etc. have widely
studied in several research fields such as materials science, environmental science and
bioscience. In the present work, the porosity of the two types of iron ore green pellets was
studied by XMT and the results are presented for the first time in this thesis. The results
were compared with both mercury porosimetry results and the 3D results obtained by image
analysis of SEM micrographs.
Scope of the present work The scope of the present work is to for the first time apply cryogenic scanning electron
microscopy, image analysis of scanning electron micrographs and X-ray microtomography
for analysis of iron ore green pellets to obtain new information about the morphology.
Special attention has been paid on quantitative analysis of air bubbles in iron ore green
pellets.
2

Background
Preparation of iron ore pellets
Iron ore pellets are one of the main feeds for blast furnaces and direct reduction processes
in the steel and iron making industries. Iron ore fines can not be directly fed to the blast
furnace as the fines would blow away with the high gas flow rate. The most convenient way
of making blast furnace feed is agglomeration of iron ore concentrate.
Prior to agglomeration, iron ores are grinded and enriched to iron ore concentrate in order
to achieve the required chemical composition and particles size distribution. The ore deposit
in Kiruna, Sweden, is rich in magnetite and the magnetite is separated from gangue
minerals, i.e. apatite, by gravity separation and/or magnetic separation followed by flotation.
The agglomeration is started by making a slurry of magnetite concentrate and additives. The
next step is preparing green pellets by balling. The balling is carried out in large balling
drums or disks using water and bentonite as a binder. The green pellets are screened to a
size fraction of 9 to 12.5 mm in diameter for induration [21]. The under-size fraction is
returned to the balling drums as seeds. The over-size fraction is usually crushed and
returned to the balling drums. The agglomerates formed by this way are known as green
pellets.
The wet iron ore green pellets are then dried, oxidized (in case magnetite raw material is
used) and sintered in an induration machine [22]. In order to obtain good quality of iron ore
pellets, the produced green balls should have suitable properties. The production of high
strength green pellets with appropriate size is essential so that pellets do not break down
during drying, oxidation and sintering on the pellet bed. Finally, the sintered iron ore pellets
are transported to steelmaking plants.
Iron ore green pellet microstructure
The pellet consists of particles with a broad particle size distribution and smaller particles
are mixed among the large particles, which results in a denser pellet structure. Therefore, a
network of pores in between the particles will remain after water removal. In the present
work, these pores will be referred to as open pores or packing porosity. In addition, air may
be included in the pellets as isolated and relatively large cavities, which are spherical in
shape [6]. These pores are referred to as bubble porosity in the present work.
3

Techniques to characterize porosity
There are several techniques that can be used to characterize porosity. The most widely
used techniques to determine porosity are mercury intrusion porosimetry, water absorption,
helium pycnometry and image analysis. A comparison of these methods, together with their
advantages and limitations, is given below:
1. Mercury porosimetry was a widely used and straightforward technique for porous
materials. It detects open porosity with precision but provides lower net porosity because of
its inability to penetrate closed porosity. Pore size distribution measured by mercury
porosimetry does not include bubble porosity and the technique is inappropriate for such
kind of measurements [23].
2. Water absorption is another inexpensive and simple method but does not provide results
with good degree of reliability [24].
3. If the density of the materials is known, helium pycnometry can be used to determine
open porosity and closed porosity but cannot be used to measure pore diameters or pore size
distribution.
4. Image analysis can be carried out on microscopy [25] or X-ray [26] images etc. and can
be used to quantify both open and closed porosity. With image processing, image analysis
can distinguish between packing porosity and bubble porosity. It allows the determination
of pore size distribution and pore morphology but the results are influenced by the limited
spatial resolution of the images.
In the present work, mercury porosimetry, image analysis of Scanning Electron
Microscopy (SEM) micrographs and X-ray micro-computed tomography were explored and
will therefore be discussed briefly below.
Mercury porosimetry
Mercury porosimetry was once recognized as one of the most important methods available
for the characterization of the pore structure of a variety of porous materials with pore sizes
ranging from 0.003 to 360 µm. However, of environmental reasons, the technique is seldom
used nowadays. The method relays on using mercury as non-wetting fluid with an applied
pressure to measure the pore size distribution of a porous solid. In mercury porosimetry,
mercury is continuously forced into an evacuated sample of the porous medium. A plot of
the amount of the intruded mercury versus the applied pressure provides the so called
4
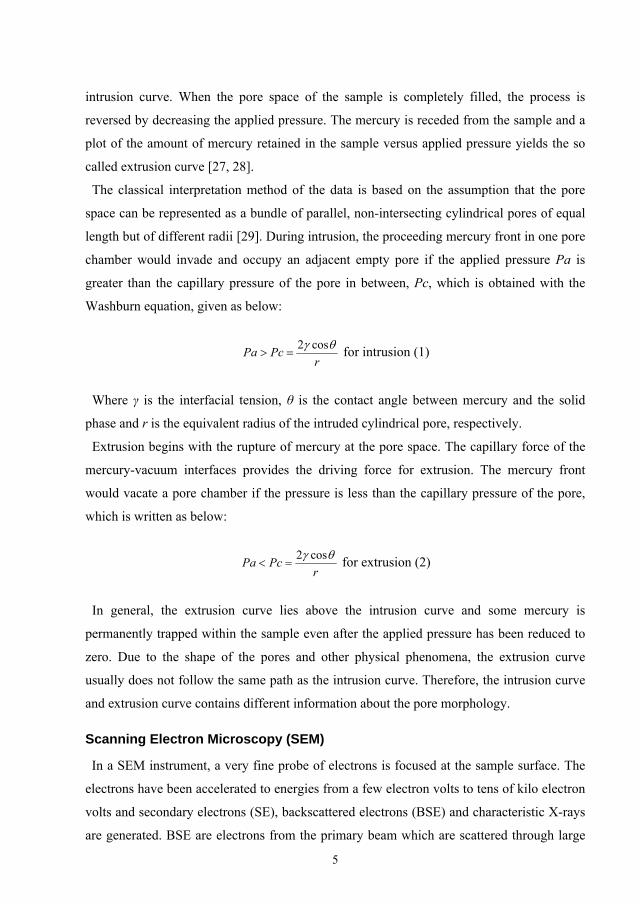
intrusion curve. When the pore space of the sample is completely filled, the process is
reversed by decreasing the applied pressure. The mercury is receded from the sample and a
plot of the amount of mercury retained in the sample versus applied pressure yields the so
called extrusion curve [27, 28].
The classical interpretation method of the data is based on the assumption that the pore
space can be represented as a bundle of parallel, non-intersecting cylindrical pores of equal
length but of different radii [29]. During intrusion, the proceeding mercury front in one pore
chamber would invade and occupy an adjacent empty pore if the applied pressure Pa is
greater than the capillary pressure of the pore in between, Pc, which is obtained with the
Washburn equation, given as below:
rPcPa θγ cos2
=> for intrusion (1)
Where γ is the interfacial tension, θ is the contact angle between mercury and the solid
phase and r is the equivalent radius of the intruded cylindrical pore, respectively.
Extrusion begins with the rupture of mercury at the pore space. The capillary force of the
mercury-vacuum interfaces provides the driving force for extrusion. The mercury front
would vacate a pore chamber if the pressure is less than the capillary pressure of the pore,
which is written as below:
rPcPa θγ cos2
=< for extrusion (2)
In general, the extrusion curve lies above the intrusion curve and some mercury is
permanently trapped within the sample even after the applied pressure has been reduced to
zero. Due to the shape of the pores and other physical phenomena, the extrusion curve
usually does not follow the same path as the intrusion curve. Therefore, the intrusion curve
and extrusion curve contains different information about the pore morphology.
Scanning Electron Microscopy (SEM)
In a SEM instrument, a very fine probe of electrons is focused at the sample surface. The
electrons have been accelerated to energies from a few electron volts to tens of kilo electron
volts and secondary electrons (SE), backscattered electrons (BSE) and characteristic X-rays
are generated. BSE are electrons from the primary beam which are scattered through large
5

angles from a volume within the sample. The volume depends on the energy of the primary
electrons, the properties of the material, and the signal itself. The detected signal is
generated from a part of the interaction volume known as the sampling or information
volume. In a SEM instrument, the electron beam is scanned over the sample surface and the
BSE signal is recorded at each location. A complete image is formed by a raster scan of the
beam through the sample. The information within an image is carried by the intensities of
the BSE signal which is stored in the image as intensities of individual pixels. In a typical
image acquisition system, each pixel can have one of 28 = 256 discrete values or gray levels,
from 0 to 255.
Sample preparation for SEM analysis
Sample preparation and instrument settings must be selected in a manner to arrive at
consistent data. For BSE imaging, samples should be prepared with care so that features are
not damaged or altered. Epoxy impregnation and polishing must be evaluated to ensure that
the techniques do not damage the surface of the sample. The technique ordinarily involves
intrusion of epoxy resin under vacuum. Penetration of the resin to sufficient depths is
sometimes difficult. Removing some materials prior to impregnation can aid penetration of
the resin to the area of interest. Then the impregnated sample is polished to achieve a
smooth polished surface for BSE imaging.
One technique that is used with cryogenic-SEM (cryo-SEM) for analysis of air inclusion
involves grinding and then polishing the surface of the sample in cryogenic environment,
for instance liquid nitrogen, in order to mitigate artifact formation. Cryo-SEM is an
important technique for imaging liquid containing sample without removing water and any
volatile material. During the sample preparation and transferring the sample to the
microscope, it is often exposed to moisture in the atmosphere and accumulates frost [30].
Spatial care is needed to reduce this problem.
Image analysis
To extract and quantify features of interest in digital images involve image processing,
feature recognition, and data interpretation. Successful image analysis needs an
understanding of both the nature of the signal used to generate the image and the properties
of the sample. Therefore, the initial step in image analysis is image acquisition. Although
images can be formed from a number of sources, scanning electron microscopes (SEM) is
6
one of the more widely used instrument types. When using SEM instrument, signal sources
typically consist of secondary electrons, backscattered electrons, and characteristic X-rays
as mentioned earlier. Of these, the BSE signal generally give the greatest utility for its
atomic number contrast imaging feature [31]. When a set of images are acquired randomly
from a cross-section of a sample, sample representativity becomes questionable. Stitching
together all the images in the cross-section and analysis of the complete cross-section of the
sample reduce this problem and was therefore used in the present work.
Before analyzing pore parameters of iron ore pellet, image pre-processing is required to
convert a SEM image to a binary image. A suitable threshold value must be chosen, which
convert a gray level image to a binary image. The next step is to perform morphological
operation and labeling the pores. Morphological operation involves closing or opening
operation with structuring elements [32]. An opening operation consists of erosion followed
by dilation and closing is the reverse of the opening operation. These operations smooth
irregular borders and remove or fill in isolated pixels or lines [33]. The final steps in image
analysis involve the identification of individual features, for instance pores, and the
extraction of quantitative information.
The 2D data obtained by image analysis of SEM images of cross sections are not directly
related to the three-dimensional (3D) structure. Stereological relationships provide a set of
tools that can relate the 2D data to important parameters of the actual 3D structure.
Stereology
Stereology means the ‘‘knowledge of space’’. It is the science of the geometrical
relationships between a real 3D structure and the corresponding 2D images of that structure
[34]. The most intensive use of stereology has been in conjunction with microscope images,
which includes light microscopes (conventional and confocal), electron microscopes and
other types. The basic methods are however equally appropriate for studies at microscopic
and well accepted in biological, medical, materials and mathematical sciences. The
procedure is an extrapolation to three dimensions estimation of volume density, surface
density, volume to surface ratio, number of object per unit volume (for instance, pore), etc.
which, is based on geometric probabilities and statistics.
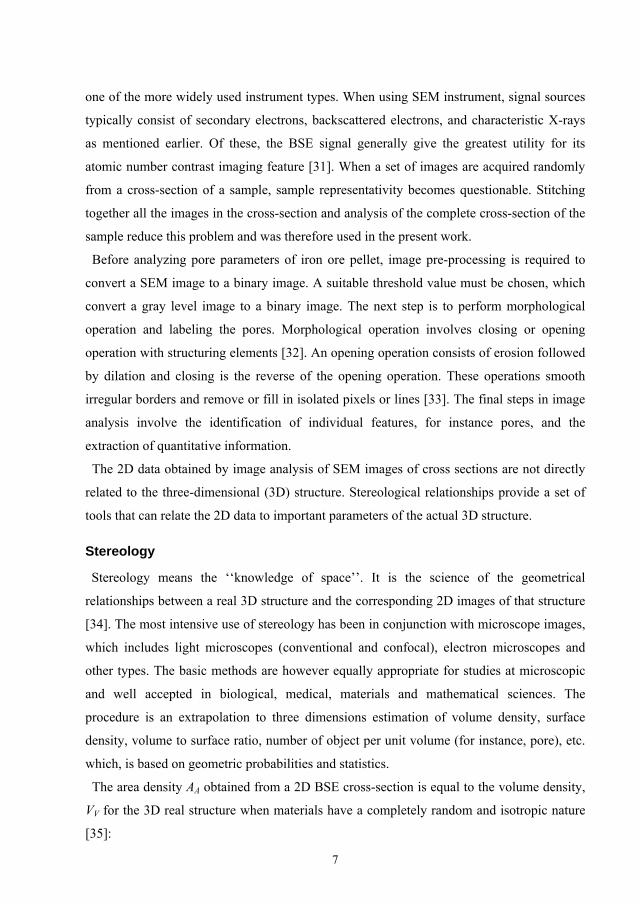
The area density AA obtained from a 2D BSE cross-section is equal to the volume density,
VV for the 3D real structure when materials have a completely random and isotropic nature
[35]:
7

AV AV = (3)
Saltykov has shown the fundamental stereological formula for surface density, SV which is
proportional to the length of profiles boundary per unit area [36]. The relationship is written
as below:
AV BSπ4
= (4)
Where BBA is the boundary length of the profile per unit area on a typical plane section.
The procedures for reconstructing a pore size distribution by unfolding a measured profile
size distribution yield biased results as spherical shape geometry is assumed. Profiles of a
certain size class i may be derived from all spheres of size class j. The number of profiles of
size class i is derived from pores of size class j is given by:
( ) ( )∑=
⎥⎦⎤
⎢⎣⎡ −−−−Δ=
k
ijVA ijijjNiN 2222 1)()( (5)
Where Δ is the class interval, the distribution NA(i) is known quantity and NV(j) is unknown
quantity. The value of NV(j) for each jth class of pore size can be estimated [37-39] from:
( ) ( ) (iNjijN A
k
jiV ∑
=⎟⎠⎞
⎜⎝⎛Δ
= ,1 α ) (6)
The values of the α(i, j) coefficient are tabulated in Weibel [36].
X - ray tomography
X-ray tomography is a non-destructive technique that employs X-rays and allows for the
formation of a 3D image of the interior of a material. This image shows different
microstructural features including for instance phases, inclusions, cracks and pores.
Tomography is derived from Greek word ‘tomos’ meaning sections. Therefore, tomography
is sometimes referred to as sectional imaging or slice imaging. Tomography consists of
algorithms that utilize the sensed data to construct an image that represents slices of the
object. X-ray microtomography (XMT) is a type of X-ray tomography but used for small
8
scale imaging and the basic principle is same as the medical computed tomography (CT)
scan.
In X-ray tomography, X-rays from a strong polychromatic source transfers through an
object and it is recorded with a solid-state X-ray detector positioned behind the sample. The
X-ray intensity is determined continuously as the sample is rotated by small angular
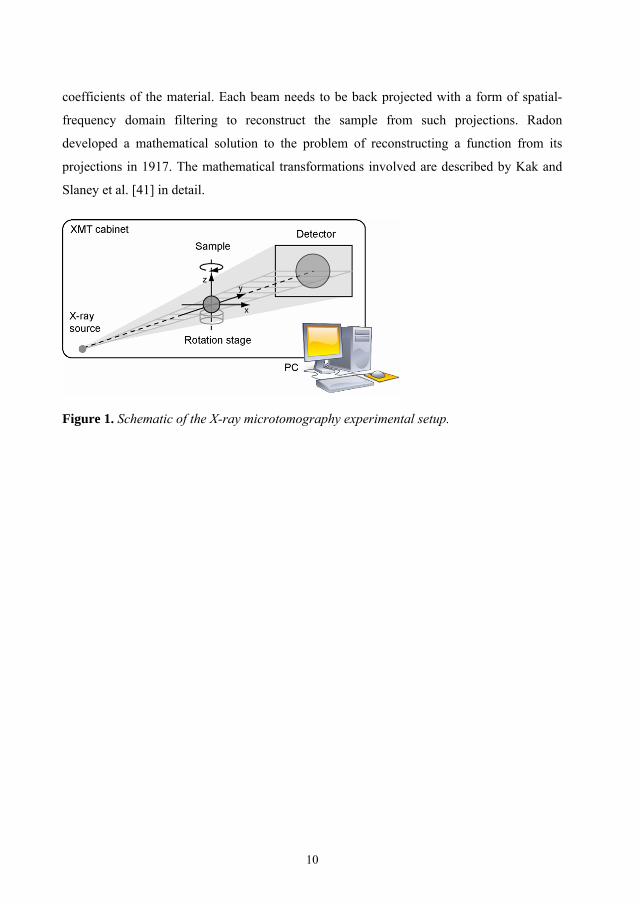
increments and the data are stored in a computer. A typical X-ray tomography set-up is
shown schematically in Figure 1. The data from these transmitted X-rays are utilized to
determine the X-ray attenuation coefficient through the material by applying the Beer–
Lambert law using a filtered back projection algorithm [40]. The presence of pores results in
regions within the material where the attenuation coefficient is very low.
In X-ray tomography, the X-ray photons generated by the source, travel along a straight
line until they are absorbed or scattered and eventually collected by the detector. According
to Beer's Law, the intensity of the beam I for an infinitesimal body satisfies the linear
relation as below:
μ−=dLdI
I1 (7)
When a beam of mono-energetic photons with energy E0 and intensity I0 passes through a
homogenous absorber of thickness L, the intensity can be written as:
( )LEZeII 0,,
0ρμ−= (8)
If the absorber is not homogenous, the linear attenuation coefficient (μ) is a space-variant
function dependent on the distribution of material in the sample being investigated. The
intensity between successive blocks of different materials can be shown by simple
integration and that is:
( )∫=
− dLEZeII 0,,
0ρμ (9)
The linear attenuation coefficient of photons depends on the energy of the photon, and the
density (ρ) and atomic number of the material (Z) located between the source and the
detector. Several projections can be generated in different directions for digital
reconstruction where each projection is created by a set of line integrals of the attenuation
9
coefficients of the material. Each beam needs to be back projected with a form of spatial-
frequency domain filtering to reconstruct the sample from such projections. Radon
developed a mathematical solution to the problem of reconstructing a function from its
projections in 1917. The mathematical transformations involved are described by Kak and
Slaney et al. [41] in detail.
Figure 1. Schematic of the X-ray microtomography experimental setup.
10

Experimental
Materials
The magnetite concentrate was provided by Luossavaara-Kiirunavaara AB (LKAB). The
concentrate had a particle size of 85% -45 µm and the mean particle size measured by laser
diffraction was 30 µm. The typical chemical composition of the concentrate was 71% Fe,
0.6% SiO2 and 0.018% P. The specific surface area of the particles measured by BET
method was 0.511 m2g-1 [42]. The flotation collector reagent used in the work described in
Articles II and III is an anionic collector consisting of a main collector, a co-collector and a
foam regulator where 95-98% is surface active compounds and 2-5% is organic compounds
i.e. maleic acid and glycol derivates.
Preparation of green pellets
The iron ore green pellets were prepared following the micro-balling procedure described
by Forsmo [42]. Pellet feed was prepared by mixing 7 kg of the magnetite concentrate with
0.5% bentonite (Milos, Greece) in a laboratory mixer (Eirich R02, Germany) and the
moisture content was adjusted between 8.2 to 9.4% during the mixing. Seeds with a size of
3.5 to 5 mm were prepared by spreading the feeds from the mixture in a 0.8 m drum rotating
at a speed of 37 rpm, while tempered water was sprayed to initiate the growth of
agglomerates. In the next step, 150 g of seeds were returned to the drum rotating at a speed
of 47 rpm. The seeds were grown to green pellets by adding feed and spraying water in the
drum. The green pellets formed by this micro-balling procedure were screened to a size of
10 to 12.5 mm. Several batches of green pellets were prepared and wet pellets were used for
cryo-SEM study (Article I). In one batch of pellets, 60 gram flotation collector reagent per
ton of magnetite concentrate was mixed to the feed prior to balling and pellets were formed
without addition of flotation collector reagent in another batch. The pellet batch made with
the additional flotation collector reagent are denoted as FLOT and the other batch is denoted
as REF, respectively (Articles II and III).
Cryogenic Scanning Electron Microscopy (Cryo-SEM)
Freezing of wet pellets
The pellets were frozen after completion of balling using the following two methods:
11

(1) Plunge freezing: pellets were directly after micro-balling immersed and stored in liquid
nitrogen.
(2) Unidirectional freezing: Liquid nitrogen was fed continuously to one end of the pellet
directly after micro-balling. After a couple of minutes, complete freezing was indicated by
the rise of liquid cryogen to the top of the pellet along its surface.
All pellets frozen in this manner were subsequently stored in liquid nitrogen.
Polishing of frozen pellets
The size of the spherical pellets was reduced before fracturing and SEM observations.
Slices with parallel faces containing an equatorial plane and with a thickness of 3 mm were
prepared. There are several techniques available to polish samples for cryo-SEM
observation [43, 44]. In the present work, the samples were polished in liquid nitrogen by
grinding on a SiC paper using a laboratory grinding machine (Labopol-5, Struers A/S,
Ballerup, Denmark) (Article I).
Fracturing and Transfer
A low-cost device shown in Figure 2 was designed to carry out fracturing and transferring
of the thick samples without frost deposition on the fractured surface. The sample (1) was
first mounted in the sample holder (2) by clamping it by vice jaws of copper (3), which were
tightened using a screw (4). The device is also comprised of a steel gate (5) and a movable
aluminum barrier (6). The sample was mounted under continuous immersion in liquid
nitrogen.
The sample was fractured and inserted in the SEM instrument as described in detail in
Article I. The method is cheap, fast, and efficient and the whole procedure is completed
within one and a half minute.
12

Figure 2. Schematic drawing of the fracturing and transfer device: (1) sample; (2) sample
holder; (3) vice jaws; (4) vice screw; (5) gate; (6) movable barrier.
Imaging
The microstructure of the fractured surfaces was recorded using a low vacuum scanning
electron microscope (JSM- 6460lv, Japanese Electron Optics Limited (JEOL), Tokyo,
Japan) equipped with a W filament and a cold-stage (C1003, Gatan, Inc.). During
investigation, the temperature of the cold-stage was kept below –170°C. The microscope
was operated at 15 kV in low vacuum mode (37 Pa) and back-scattered electrons were used
for imaging.
Scanning Electron Microscopy (SEM) image analysis
Epoxy embedding and polishing
Three dried pellets from the FLOT and REF batches were mounted in epoxy resin (Struers
EpoFix) using vacuum impregnation. The epoxy impregnation was improved by removing a
few millimeters of the pellets by grinding prior to embedding. Metallographic polishing was
performed in a semi automated Struers polishing machine using 9 µm, 3 µm and 1 µm
diamond suspensions with corresponding polishing plates consecutively until the cross
section propagated close to the center of the pellets.
Imaging, image processing and analysis
Images were recorded using the backscattered electron (BSE) compositional signal with an
accelerating voltage of 15 kV. Each image was recorded with a resolution of 960 pixels by
12
3
4
5
6
13

1280 pixels resulting in 1.0 pixel per 1.0 µm. Images were acquired manually in a sequential
order without overlapping and the entire cross-section of each pellet was captured. These
SEM micrographs were utilized for the quantitative image analysis and the steps are
described below.
1. The acquired images (about 120 for each sample) were stitched together to a single
image using the function “montage” in the image processing toolbox in Matlab R2009a. The
assembled cross-sections of one pellet from the FLOT and REF series are shown in Figure
3(a) and (b), respectively. Figure 3(c) and (d) show the corresponding cross-section after
image processing where white represents pores. To better illustrate the different steps of
image processing described below, Figure 4 shows an enlargement of the area delimited in
red in Figure 3(a).
2. Median filtering was performed to remove extreme pixel values from the image (Figure
4(a)).
3. The histogram of the cross-section of the pellet shown in Figure 3(a), delimited in red, is
presented in Figure 5. An optimum threshold value was determined from this histogram by
trial and error and the result is illustrated by the binary image shown in Figure 4(b). The
optimum threshold value was 71.5 and indicated by a dashed line in Figure 5.
4. The image contains artifacts like floating grains and bubbles from epoxy impregnation
in the pores (Figure 4(b)). Those artifacts were eliminated using Matlab function ‘imfill’
and the complemented image is shown in Figure 4(c) where white represents pores.
5. Next step was morphological opening, i.e. an erosion step followed by dilation where
disk-shaped structuring element of 10 pixels in radius was employed, to isolate the bubbles,
see figure 4(d).
14

Figure 3. Iron ore pellet cross-sections of: (a) FLOT as assembled; (b) REF as assembled;
(c) FLOT after image processing; (d) REF after image processing. The area delimited in
red in (a) is enlarged in Figure 4. The scale bar in each image corresponds to 1 mm.
6. A number of parameters were measured in the images shown in Figure 3(c) and Figure
3(d) utilizing image analysis. A Matlab code was developed to count and label individual
pore profiles with corresponding area and equivalent diameter of a circle with the same area
using Matlab function ‘regionprops’.
15
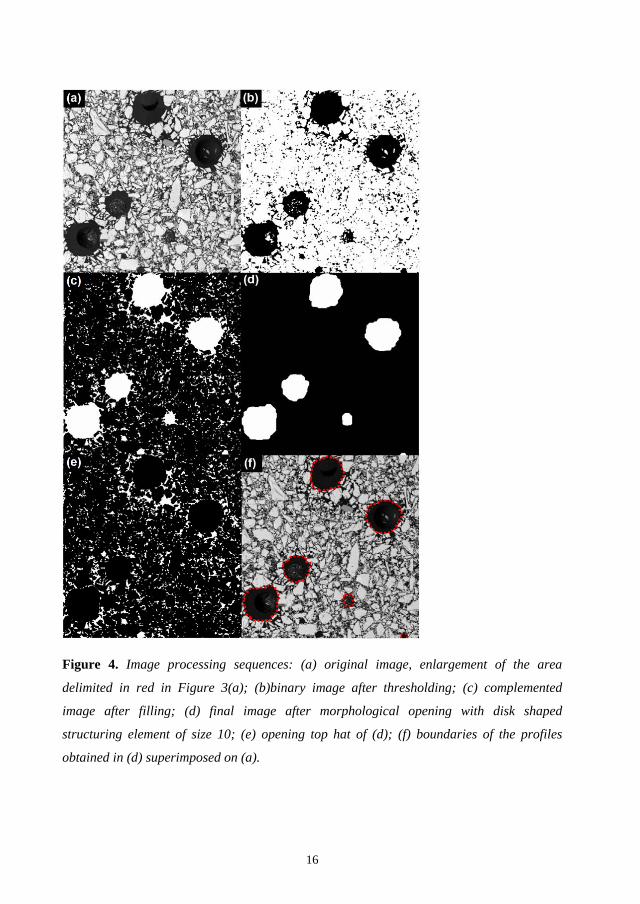
Figure 4. Image processing sequences: (a) original image, enlargement of the area
delimited in red in Figure 3(a); (b)binary image after thresholding; (c) complemented
image after filling; (d) final image after morphological opening with disk shaped
structuring element of size 10; (e) opening top hat of (d); (f) boundaries of the profiles
obtained in (d) superimposed on (a).
16

Figure 5. Image histogram of the area delimited in red in Figure 3(a).
Stereology
The 2D data obtained by image analysis were unfolded to 3D data using stereology. In a
first step, the total pore area density for each size class was converted to area numerical
density (number of pores per unit area) by dividing each value with the equivalent area of a
circle corresponding to the average equivalent diameter of the size class. Subsequently, the
Wicksell-Saltykov [36, 45] unfolding procedure was followed to calculate the volume
numerical density (number of pores per unit volume). Finally, this set of data was converted
to total pore volume density by multiplying the volume numerical density by the volume of
a sphere derived from the equivalent diameter of each size class and the cumulative curves
were plotted.
X-ray microtomography (XMT)
The iron ore pellets were imaged using a Nanotom X-ray microtomograph (GE Sensing &
Inspection Technologies, GmbH). The X-ray tube voltage and current were 110 kV and 110
µA, respectively. The source to object and source to detector distances was 25.00 mm and
200.00 mm, respectively, resulting in a magnification factor of eight. The tomographic
reconstruction was carried out using a cone beam filtered back projection algorithm and the
voxel size was 11.87 µm and 12.50 µm for FLOT and REF, respectively.
The image processing was carried out using the Matlab image processing toolbox. The
reconstructed volume data comprised 1060 slices (tif-files), each with the dimension
17
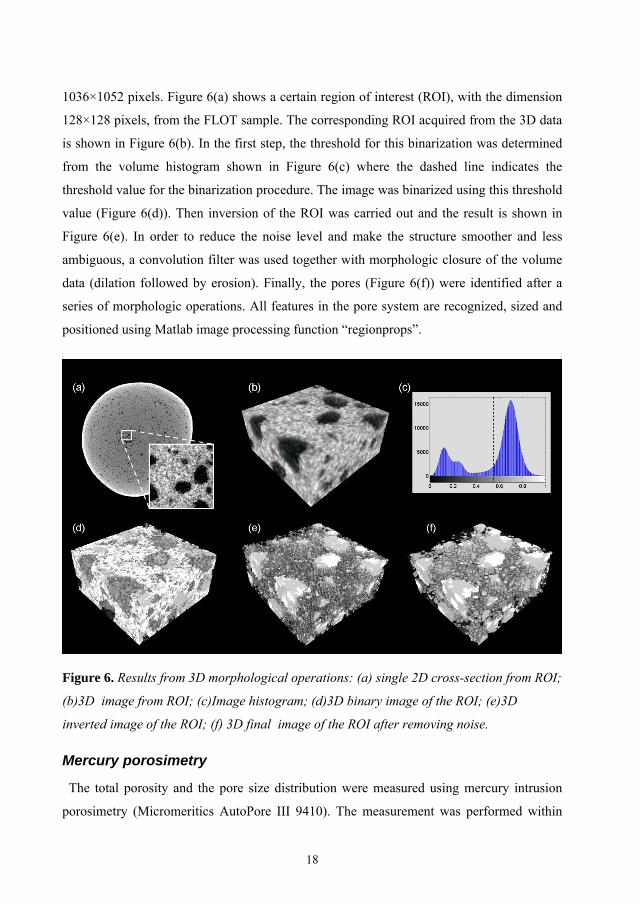
1036×1052 pixels. Figure 6(a) shows a certain region of interest (ROI), with the dimension
128×128 pixels, from the FLOT sample. The corresponding ROI acquired from the 3D data
is shown in Figure 6(b). In the first step, the threshold for this binarization was determined
from the volume histogram shown in Figure 6(c) where the dashed line indicates the
threshold value for the binarization procedure. The image was binarized using this threshold
value (Figure 6(d)). Then inversion of the ROI was carried out and the result is shown in
Figure 6(e). In order to reduce the noise level and make the structure smoother and less
ambiguous, a convolution filter was used together with morphologic closure of the volume
data (dilation followed by erosion). Finally, the pores (Figure 6(f)) were identified after a
series of morphologic operations. All features in the pore system are recognized, sized and
positioned using Matlab image processing function “regionprops”.
Figure 6. Results from 3D morphological operations: (a) single 2D cross-section from ROI;
(b)3D image from ROI; (c)Image histogram; (d)3D binary image of the ROI; (e)3D
inverted image of the ROI; (f) 3D final image of the ROI after removing noise.
Mercury porosimetry
The total porosity and the pore size distribution were measured using mercury intrusion
porosimetry (Micromeritics AutoPore III 9410). The measurement was performed within
18

the pore diameter interval 360 μm ≥φ≥ 0.003 μm. For evaluation of data, the surface tension
and the contact angle of mercury were set to 485 mN/m and 130°, respectively.
19

20

Results and Discussion
Observations of wet and frozen iron ore green pellets (Article I)
Air bubbles observed by plunge freezing
Three different regions were identified in the wet and frozen pellet sections prepared by
plunge freezing. Figure 7(a) reveals the location of the three regions (1, 2 and 3) in the
pellets. The entrapped air bubble shown in Figure 7(b) was observed close to the outer
surface of the pellet (region 1) and the bubble was not filled with frozen water. This region
reached a depth of about 2 mm. However, the bubble was completely filled with frozen
water (Figure 7(d)) in the core of the pellet (region 3). In between, a transition region
(region 2) was found, where the air bubble was partially filled with water as shown in
Figure 7(c). In this region, the water content of the bubble gradually increased as region 3
was approached. It demonstrates that plunge freezing is not appropriate to study air bubbles
in wet pellets. The ice that first crystallizes all around the sample builds a solid shell and the
water remaining in the interior of the pellet is likely forced into the bubbles because of the
larger volume occupied by ice than liquid water [46]. The hydrostatic pressure building up
results in penetration of water into the air bubbles and forces gas entrapped in the bubbles to
escape through cracks or grain boundaries.
21

Figure 7. Schematic drawing illustrating the different regions observed in samples
prepared by plunge freezing (a) and images of typical air bubbles observed in: region 1 (b),
region 2 (c) and region 3 (d).
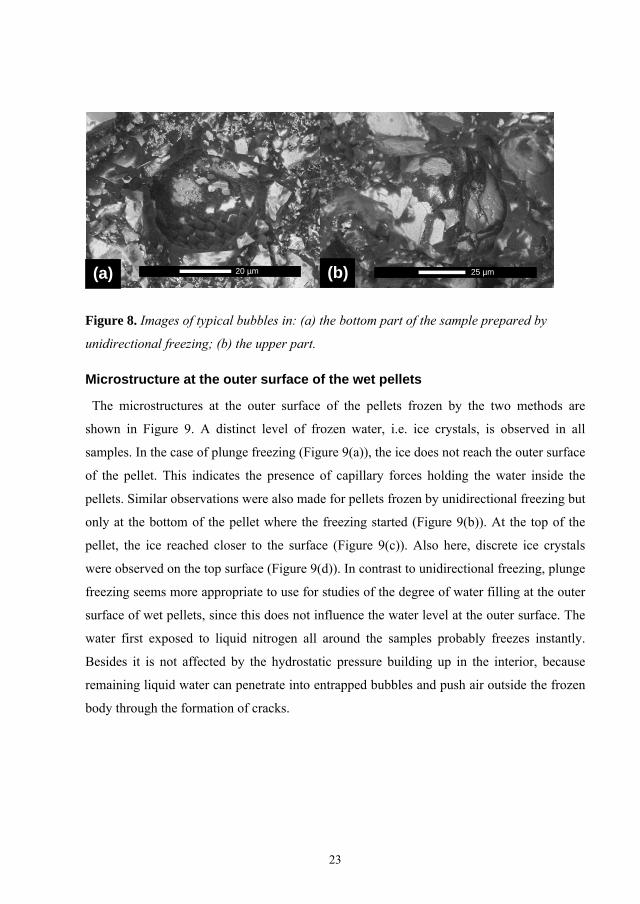
Air bubbles observed by unidirectional freezing
All bubbles were empty of frozen water and appeared similar throughout the entire sample
that had been frozen by unidirectional freezing, as shown in Figure 8(a) and (b). In contrast
to plunge freezing, unidirectional freezing did not cause any filling of the bubbles with
water, likely because no shell of ice is formed around the sample, which shows the potential
of this method for studying entrapped air bubbles in wet and frozen pellets. It is also
observed that the bubbles are surrounded by large iron ore particles oriented with a flat
surface parallel to the air/ice interface. A layer of fine particles was also present at the
air/ice interface in all bubbles and interestingly, throughout all samples, the space between
the large iron ore particles in the direct vicinity of the bubbles was not filled with finer
particles as in the remaining matrix, as observed in Figure 7(b) and 8.
25 µm
(a) (b)
(1)
(3)
(2)
(c) (d)
50 µm 25 µm
22
25 µm (a) 20 µm (b)
Figure 8. Images of typical bubbles in: (a) the bottom part of the sample prepared by
unidirectional freezing; (b) the upper part.
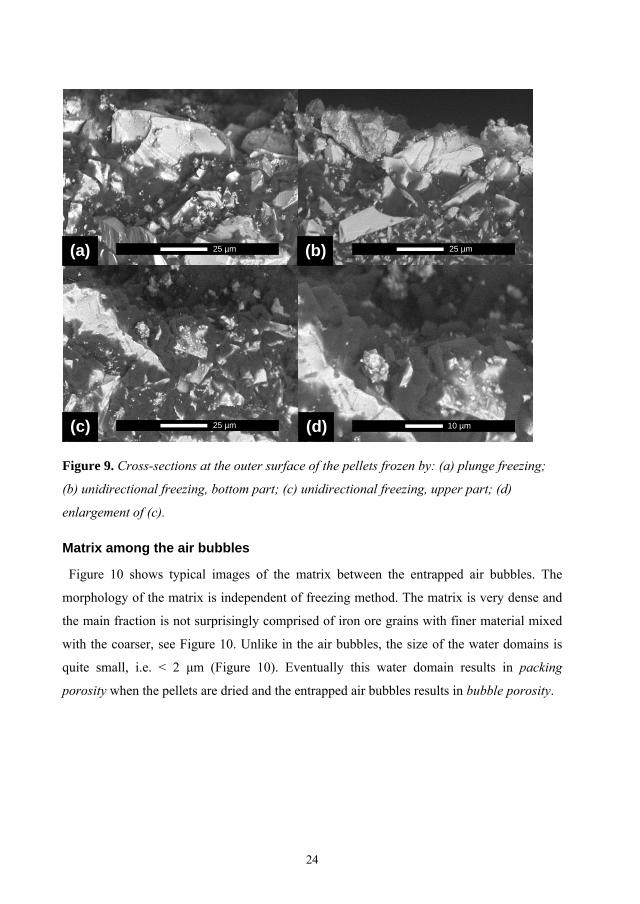
Microstructure at the outer surface of the wet pellets
The microstructures at the outer surface of the pellets frozen by the two methods are
shown in Figure 9. A distinct level of frozen water, i.e. ice crystals, is observed in all
samples. In the case of plunge freezing (Figure 9(a)), the ice does not reach the outer surface
of the pellet. This indicates the presence of capillary forces holding the water inside the
pellets. Similar observations were also made for pellets frozen by unidirectional freezing but
only at the bottom of the pellet where the freezing started (Figure 9(b)). At the top of the
pellet, the ice reached closer to the surface (Figure 9(c)). Also here, discrete ice crystals
were observed on the top surface (Figure 9(d)). In contrast to unidirectional freezing, plunge
freezing seems more appropriate to use for studies of the degree of water filling at the outer
surface of wet pellets, since this does not influence the water level at the outer surface. The
water first exposed to liquid nitrogen all around the samples probably freezes instantly.
Besides it is not affected by the hydrostatic pressure building up in the interior, because
remaining liquid water can penetrate into entrapped bubbles and push air outside the frozen
body through the formation of cracks.
23
(a) (b)25 µm 25 µm
(c) (d)25 µm 10 µm
Figure 9. Cross-sections at the outer surface of the pellets frozen by: (a) plunge freezing;
(b) unidirectional freezing, bottom part; (c) unidirectional freezing, upper part; (d)
enlargement of (c).
Matrix among the air bubbles
Figure 10 shows typical images of the matrix between the entrapped air bubbles. The
morphology of the matrix is independent of freezing method. The matrix is very dense and
the main fraction is not surprisingly comprised of iron ore grains with finer material mixed
with the coarser, see Figure 10. Unlike in the air bubbles, the size of the water domains is
quite small, i.e. < 2 μm (Figure 10). Eventually this water domain results in packing
porosity when the pellets are dried and the entrapped air bubbles results in bubble porosity.
24

Figure 10. Typical image of the matrix between the air bubbles, independent of freezing
method.
Spatial distribution of porosity
2D image analysis (Article II)
Figure 4(d) shows the binary image finally obtained after image processing of the original
image shown in Figure 4(a). Image opening was carried out using a disk-shaped structuring
element of 10 pixels or 10 µm in radius (strel10). The corresponding opening top hat, i.e.
pore profiles removed by the opening operation, is shown in Figure 4(e). The remaining
pore profiles after this operation is shown by red dashed boundary in figure 4(f). The
efficiency of this method to isolate the interior pore profiles due to the bubbles is clearly
observed by comparing figure 4(e) and (f). Of course, all pore profiles smaller than the size
of the structuring element (20 µm) were removed. The pore profiles that were removed
comprised of packing porosity smaller than 20 µm and a few bubbles smaller than 20 µm.
In Figure 11(a) and (b), the total pore profile area density is shown for the REF and FLOT
series, respectively, after averaging of the three pellets in each series. The data after the
strel10 operation (labeled as original) indicate a single population in both cases, which
corresponds to the bubble porosity. The log normal functions, represented with a red curve,
fit the distribution very well. In order to compensate for the absence of pore profiles < 20
µm, the values below 30 µm of the log normal curves were distributed by following a linear
extrapolation to zero (indicated by blue points).
25

Figure 11. Total pore area density data for: (a) REF and (b) FLOT.
Stereological unfolding (Article II)
Figure 12 shows the cumulative pore volume density after unfolding by stereology the
REF and FLOT series, respectively. In both cases, the curves derived from the log normal
fitted data with or without linear extrapolation show slightly higher values than those
derived from the original data. Assuming that the curves obtained from the log normal fitted
data with linear extrapolation are representative of the bubble porosity only, the median
diameter, d50, of bubbles in pellets of REF and FLOT type are 102 µm and 88 µm,
respectively.
Figure 12. Cumulative pore volume density data for: (a) REF and (b) FLOT.
26

27
X-ray microtomography (XMT) (Article III)
The resolution limit for XMT was 12.5 µm and the lack of spatial resolution in the XMT
based analysis can be interpreted as an effective filter that filtrates the packing porosity,
resulting only the bubble porosity. In order to compare SEM image analysis results obtained
by stereological unfolding of 2D SEM cross-sections, eight individual reconstructed 2D
cross-sections were analyzed first by XMT from the center region of the pellet of type REF
with an intermediate distance of 500 µm. The stereological unfolding was applied to the 2D
data similarly as used for SEM data, starting with log normal fitting of the total pore profile
area density followed by linear extrapolation to zero for the values below 30 µm. Figure
13(a) shows the pore volume density distributions of the data obtained by X-ray
microtomography (3D XMT), unfolding of the X-ray microtomography 2D cross-sections
(unfolded 2D XMT) and unfolding of the SEM cross-sections (unfolded 2D SEM). The
peak heights were normalized to make comparison possible, since the size classes were
different between the techniques. All the three curves show excellent agreement for large
equivalent diameters as expected but differ for smaller values because of the difference in
resolution.
Figure 13. Comparison of the data obtained by X-ray microtomography (3D XMT),
unfolding of the X-ray microtomography 2D cross-sections (unfolded 2D XMT) and
unfolding of the SEM cross-sections (unfolded 2D SEM): (a) pore volume density; (b)
cumulative pore volume density.
The corresponding cumulative pore volume density distributions are shown in Figure
13(b). The XMT distributions are slightly shifted towards large pore volume density values
because a few bubbles above 300 µm were observed in the pellet analyzed by XMT and not
in the pellet observed by SEM. Slightly higher total bubble porosity is obtained by
unfolding data from SEM images. A total bubble porosity of 2.6% is observed by XMT
while 2.8% is obtained by stereological unfolding of SEM images. The median diameter,
d50, of bubbles is 112 µm and 102 µm by XMT and SEM, respectively.
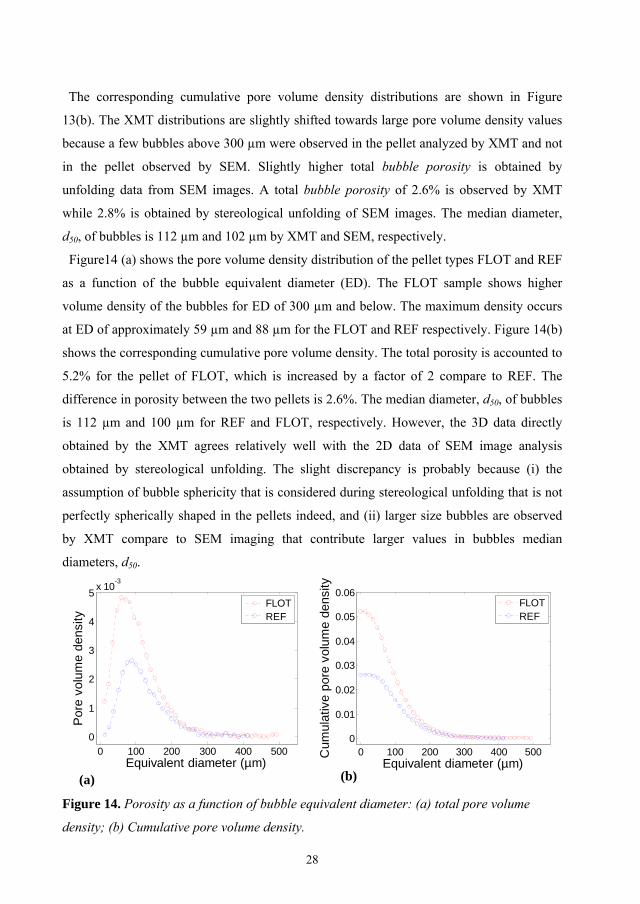
Figure14 (a) shows the pore volume density distribution of the pellet types FLOT and REF
as a function of the bubble equivalent diameter (ED). The FLOT sample shows higher
volume density of the bubbles for ED of 300 µm and below. The maximum density occurs
at ED of approximately 59 µm and 88 µm for the FLOT and REF respectively. Figure 14(b)
shows the corresponding cumulative pore volume density. The total porosity is accounted to
5.2% for the pellet of FLOT, which is increased by a factor of 2 compare to REF. The
difference in porosity between the two pellets is 2.6%. The median diameter, d50, of bubbles
is 112 µm and 100 µm for REF and FLOT, respectively. However, the 3D data directly
obtained by the XMT agrees relatively well with the 2D data of SEM image analysis
obtained by stereological unfolding. The slight discrepancy is probably because (i) the
assumption of bubble sphericity that is considered during stereological unfolding that is not
perfectly spherically shaped in the pellets indeed, and (ii) larger size bubbles are observed
by XMT compare to SEM imaging that contribute larger values in bubbles median
diameters, d50.
Figure 14. Porosity as a function of bubble equivalent diameter: (a) total pore volume
density; (b) Cumulative pore volume density.
0 100 200 300 400 5000
0.01
0.02
0.03
0.04
0.05
0.06
Equivalent diameter (µm)
Cum
ulat
ive
pore
vol
ume
dens
ity
FLOTREF
0 100 200 300 400
5 x 10⁻³
5000
1
2
3
4
Equivalent diameter (µm)
Por
e vo
lum
e de
nsity
FLOTREF
(b) (a)
28
29
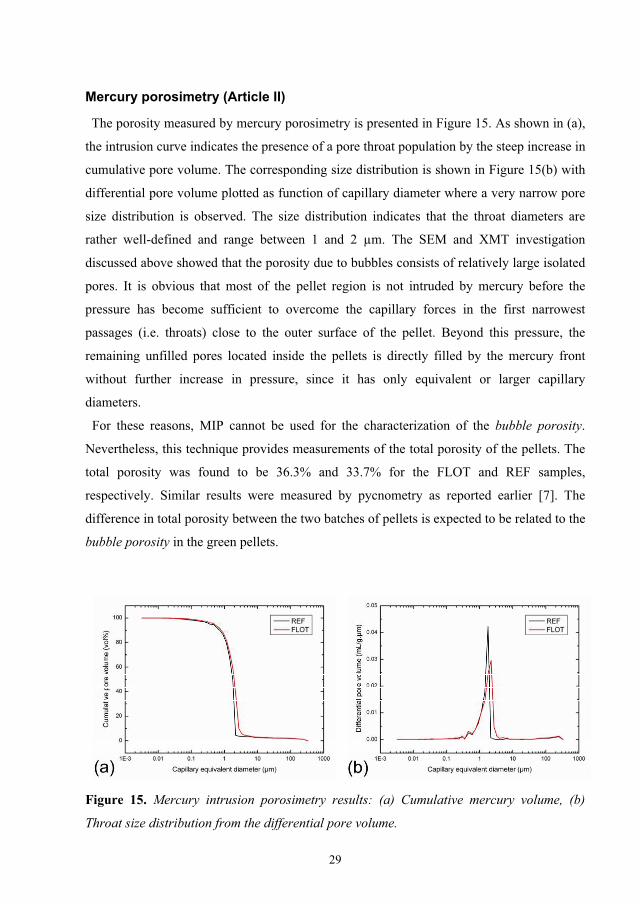
Mercury porosimetry (Article II)
The porosity measured by mercury porosimetry is presented in Figure 15. As shown in (a),
the intrusion curve indicates the presence of a pore throat population by the steep increase in
cumulative pore volume. The corresponding size distribution is shown in Figure 15(b) with
differential pore volume plotted as function of capillary diameter where a very narrow pore
size distribution is observed. The size distribution indicates that the throat diameters are
rather well-defined and range between 1 and 2 µm. The SEM and XMT investigation
discussed above showed that the porosity due to bubbles consists of relatively large isolated
pores. It is obvious that most of the pellet region is not intruded by mercury before the
pressure has become sufficient to overcome the capillary forces in the first narrowest
passages (i.e. throats) close to the outer surface of the pellet. Beyond this pressure, the
remaining unfilled pores located inside the pellets is directly filled by the mercury front
without further increase in pressure, since it has only equivalent or larger capillary
diameters.
For these reasons, MIP cannot be used for the characterization of the bubble porosity.
Nevertheless, this technique provides measurements of the total porosity of the pellets. The
total porosity was found to be 36.3% and 33.7% for the FLOT and REF samples,
respectively. Similar results were measured by pycnometry as reported earlier [7]. The
difference in total porosity between the two batches of pellets is expected to be related to the
bubble porosity in the green pellets.
Figure 15. Mercury intrusion porosimetry results: (a) Cumulative mercury volume, (b)
Throat size distribution from the differential pore volume.

Comparison
Table 1 shows the total porosity determined by MIP and pycnometry for the two types of
samples and the results are similar. The absolute difference of the total porosity between
FLOT and REF measured by MIP is 2.6%. The difference in total porosity is expected to be
the amount of bubbles. However, MIP or pycnometry alone can not ascertain pore structure
in a sample without direct microstructural visualization.
The porosity determined by image analysis (strel10) corresponding to the bubbles,
amounts to 2.84 and 6.68% of the REF and FLOT pellets, respectively. The ratio
(FLOT/REF) in bubble porosity between the two types is as high as 2.4, which illustrates
that image analysis of SEM micrographs is a powerful tool to pick up the difference
between the two pellet types. Naturally, the ratio of total porosity (FLOT/REF) measured by
MIP and pycnometry is close to 1.The absolute difference in bubble porosity between the
two series is 3.8%, which is comparable to the absolute difference in total porosity between
the two pellet types measured by MIP and pycnometry. It is thus likely that the absolute
difference in total porosity measured by MIP and pycnometry is mainly caused by
differences in bubble porosity and the packing porosity is almost constant for the two pellet
types.
The porosity determined by XMT complements the results with the above mentioned
techniques. XMT shows bubble porosity of 2.62 and 5.21% of the REF and FLOT pellets,
respectively (Table 1). The absolute difference in bubble porosity between the two series of
pellets is 2.6%, which is comparable to the absolute difference in total porosity between the
two pellet types measured by MIP and pycnometry. The absolute difference of bubble
porosity for the two types of samples is also comparable to SEM image analysis data.
Again, the ratio in bubble porosity between the FLOT and REF is as high as two, which
illustrates that XMT is a powerful tool to show the difference between the two pellet types.
Therefore, we can now ascertain that it is mainly the difference in the amount of porosity
caused by bubbles which is causing the porosity difference reported earlier [6] in the pellets
balled with or without additional flotation reagent.
Finally, the average total number of bubbles was compared between the two series. This
was achieved by using the volume numerical density obtained by the strel10 operation and
after unfolding of the raw area numerical density data. The addition of extra flotation
reagent was found to increase the numbers of bubbles by a factor of 3.4. Similar result was
30

also found by the XMT where the number of bubbles with the size > 20 µm was 3.1 times
higher in the pellets which were balled with additional flotation reagent. As a curiosity, it is
worth mentioning that the total number of bubbles with the size > 20 µm is about a hundred
thousand in a pellet of type REF, obtained by the XMT.
Table 1. Porosity measured by mercury porosimetry, pycnometery and image analysis Porosity REF
(%) FLOT (%)
Absolute difference (%)
Ratio (FLOT/REF)
Total porosity measured by mercury porosimetry
33.7 36.3 2.6 1.1
Total porosity measured by pycnometry [7]
33.3 36.2 2.9 1.1
Bubble porosity determined by image analysis (log normal+extrapol)
2.84 6.68 3.8 2.4
Bubble porosity determined by XMT 2.62 5.21 2.6 2.0
31

32

Conclusions Cryo-SEM and freeze fracturing was successfully used to characterize wet iron ore green
pellets. Two different freezing methods: plunge freezing and unidirectional freezing were
used in order to observe entrapped air bubbles, particle arrangement around the bubbles as
well as in the matrix and the degree of water filling at the outer surface.
The results indicate that unidirectional freezing facilitates observation of entrapped
bubbles with minimum formation of artifacts, whereas plunge freezing enables
characterization of the degree of water filling at the outer surface of the wet pellets. It is also
observed that the size of the water domains in the matrix of wet pellets is quite small and
that fine grains are mixed between coarser grains resulting in a denser matrix.
Morphological image analysis of SEM micrographs of epoxy impregnated pellets is shown
to be an efficient technique useful for characterization of bubble porosity and packing
porosity and for quantification of the former. When extra flotation reagent was added prior
to balling, the bubble porosity increased by a factor of 2.4 and the median bubble diameter
was decreased slightly.
The 2D data obtained from image analysis of SEM micrographs was unfolded to 3D data
by stereology and compared with 3D XMT data. Relative good agreement between the two
methods was obtained.
The additional entrapped air bubbles due to the addition of extra flotation collector reagent
are found to be responsible for the difference in total porosity between the two series.
Mercury porosimetry was found to provide values for total porosity and the throat size
distribution of the porosity but not suited for characterization of the porosity due to bubble
entrapment.
33

34
Future work Suggestions for future work are given below:
• More advanced image analysis of SEM micrographs may provide information about
packing porosity in iron ore pellets and the morphology in the vicinity of air bubbles.
• The beneficial influence of viscous binders such as bentonite is well known but their
influence is not fully understood in agglomeration. The binding effectiveness of the
bentonite is probably related to the distribution of bentonite in the water phase between
magnetite particles. Cryo-SEM, that allows direct observation of the microstructures of
wet agglomerate, may provide information for better understanding of how bentonite
acts as a binder. In addition, high resolution SEM images of dried green pellets may
provide additional information.
• Microtomography using synchrotron X-rays provides submicron resolution and may be
useful for further high resolution studies of the 3D microstructure in the pellets.
• Atomic Force Microscopy may provide additional information about the interaction
between bentonite and iron oxide and may be a good complement for microtomography
data.
35

36
Bibliography 1. Meyer, K., Pelletizing of iron ores 1980, Berlin: Springer-Verlag.
2. Sportel, H., Influence of pore saturation on compressive strength of green iron ore
pellets. Ironmaking & steelmaking, 1997. 24(3): p. 221-223.
3. Sundarmurti, N. S., and Rao, V., Thermal conductivity and diffusivity of iron ore
pellet having low porosity. ISIJ international, 2002. 42(7): p. 800-802.
4. Sharma, T., Swelling of Iron-ore Pellets Under Nonisothermal Condition. ISIJ
international, 1994. 34(12): p. 960-963.
5. Yang, Y. H., Fundamental mechanisms of pore formation in iron ore sinter and
pellets. ISIJ international, 1991. 31(5): p. 468-477.
6. Forsmo, S. P. E., Forsmo, S. E., Bjoerkman, B. M. T., and Samskog, P. O., Studies
on the influence of a flotation collector reagent on iron ore green pellet properties.
Powder technology, 2008. 182(3): p. 444-452.
7. Forsmo, S., and Vuori, J. P., The determination of porosity in iron ore green pellets
by packing in silica sand. Powder technology, 2005. 159(2): p. 71-77.
8. Corr, D. J., Juenger, M. C. G, Monteiro, P. J. M., and Bastacky, J., Investigating
entrained air voids and Portland cement hydration with low-temperature scanning
electron microscopy. Cement and Concrete Composites, 2004. 26(8): p. 1007-1012.
9. Rashed, A. I., and Williamson, R. B., Microstructure of Entrianed Air Voids in
Concrete .1. Journal of Materials Research, 1991. 6(9): p. 2004-2012.
10. Smith, A., Goff, H., and Kakuda, Y., Whipped cream structure measured by
quantitative stereology. Journal of Dairy Science, 1999. 82(8): p. 1635-1642.
11. Bastacky, J. and Goerke, J., Pores of Kohn are Filled in Normal Lungs - Low-
Temperature Scanning Electron-Microscopy. Journal of Applied Physiology, 1992.
73(1): p. 88-95.
12. Promentilla, M., Characterizing the 3D pore structure of hardened cement paste with
synchrotron microtomography. Journal of advanced concrete technology, 2008. 6(2):
p. 273-286.
13. Al-Raoush, R., Extraction of physically realistic pore network properties from three-
dimensional synchrotron X-ray microtomography images of unconsolidated porous
media systems. Journal of hydrology, 2005. 300(1-4): p. 44-64.
37

14. Kilfeather, A., and Meer, J. J. M. V. D. R., Pore size, shape and connectivity in tills
and their relationship to deformation processes. Quaternary science reviews, 2008.
27(3-4): p. 250-266.
15. Morgeneyer, T. F., Starink, M. J., and Sinclair, I., Evolution of voids during ductile
crack propagation in an aluminium alloy sheet toughness test studied by synchrotron
radiation computed tomography. Acta Materialia, 2008. 56(8): p. 1671-1679.
16. Peth, S., Three-dimensional quantification of intra-aggregate pore-space features
using synchrotron-radiation-based microtomography. Soil Science Society of
America Journal, 2008. 72(4): p. 897-907.
17. Vagnon, A., 3D statistical analysis of a copper powder sintering observed in situ by
synchrotron microtomography. Acta Materialia, 2008. 56(5): p. 1084-1093.
18. Bernard, D., 3D quantification of pore scale geometrical changes using synchrotron
computed microtomography. Oil and Gas Science and Technology Revue De
Linstitut Francias Du Petrole, 2005. 60(5): p. 747-762.
19. Costanza-Robinson, M. S., Harrold, K. H., and Lieb-Lappen, R. M., X-ray
microtomography determination of air-water interfacial area-water saturation
relationships in sandy porous media. Environmental Science & Technology, 2008.
42(8): p. 2949-2956.
20. Masad, E., Jandhyala, V. K., Dasgupta, N., Somadevan , N., and Shashidhar, N.,
Characterization of air void distribution in asphalt mixes using x-ray computed
tomography. Journal of Materials in Civil Engineering, 2002. 14(2): p. 122-129.
21. Dwarapudi, S., Devi, T. U., Rao, S. M., and Ranjan, M., Influence of pellet size on
quality and microstructure of iron ore pellets. ISIJ international, 2008. 48(6): p. 768-
776.
22. Jaroslav, S., and Růžičková, Z., Pelletization of fines. Developments in mineral
processing 7. 1988 New York: Elsevier Science Publishing Company, Inc.
23. Diamond, S., Mercury porosimetry - An inappropriate method for the measurement
of pore size distributions in cement-based materials. Cement and Concrete Research,
2000. 30(10): p. 1517-1525.
24. Andreola, F., Techniques used to determine porosity. American Ceramic Society
bulletin, 2000. 79(7): p. 49.
38
25. Ziel, R., Haus, A., and Tulke, A., Quantification of the pore size distribution
(porosity profiles) in microfiltration membranes by SEM, TEM and computer image
analysis. Journal of membrane science, 2008. 323(2): p. 241-246.
26. Mendoza, F., Verbovena, P., Ho, Q. T., Kerckhofsb, G., Weversb, M., and Nicolaïa,
B., Multifractal properties of pore-size distribution in apple tissue using X-ray
imaging. Journal of Food Engineering. 99(2): p. 206-215.
27. Lapidus, G. R., Lane, A. M., NG, K. M., and Conner, W. C., Interpretation of
mercury porosimetry data using a pore-throat network model. Chemical Engineering
Communications, 1985. 38(1-2): p. 33-56.
28. Ioannidis, M. A., A mercury porosimeter for investigating capillary phenomena and
microdisplacement mechanisms in capillary networks. Journal of colloid and
interface science, 1991. 143(1): p. 22.
29. Drake, L. C., and Ritter, H. L., Macropore-Size Distributions in Some Typical
Porous Substances. Ind. Eng. Chem. Anal. Ed., 1945. 17 (12): p. 787–791.
30. Iyer, R., Arunagirinathan, M. A., Prabhu, C. S., and Bellare, J., An improved
specimen loader for cryo-scanning electron microscopy. Scanning, 2005. 27(3): p.
141-146.
31. Zhao, H., Quantitative backscattered electron analysis of cement paste. Cement and
Concrete Research, 1992. 22(4): p. 695.
32. She, F. H., Tung, K. L., and Kong, L. X., Calculation of effective pore diameters in
porous filtration membranes with image analysis. Robotics and Computer-Integrated
Manufacturing, 2008. 24(3): p. 427-434.
33. Faes, A., Hessler-Wyser, A., Presvytes, D., Vayenas, C. G., and Van Herle, J.,
Nickel-Zirconia Anode Degradation and Triple Phase Boundary Quantification from
Microstructural Analysis. Fuel Cells, 2009. 9(6): p. 841-851.
34. Weibel, E. R., Stereological methods: practical methods for biological morphometry.
Vol. 1. 1980, London: Academic Press. 415pp.
35. Underwood, E. E., Quantitative stereology. 1970: Addision-Wesley Publishing
Company, Reading, Mass. 274P
36. Weibel, E. R., Stereological Methods: Theoretical foundations. Vol. 2. 1980,
London: Academic Press. 340 pp.
39

37. Susan, D., Stereological analysis of spherical particles: Experimental assessment
and comparison to laser diffraction. Metallurgical and materials transactions. A,
Physical metallurgy and materials science, 2005. 36(9): p. 2481.
38. Rayaprolu, D. B., Comparison of discrete particle sectioning correction methods
based on section diameter and area. Metallography, 1982. 15(2): p. 193.
39. Lewis, H. D., Particle size distribution by area analysis: modifications and
extensions of the Saltykov method. Metallography, 1973. 6(2): p. 93.
40. Feldkamp, L. A., Davis, L. C., and Kress, J. W., Practical cone-beam algorithm. J.
Opt. Soc. Am. A 1984. 1(6): p. 612-619.
41. Kak, A. C. and Slaney, M., Principles of computerized tomographic imaging. 1988,
New York: IEEE Press. 344 pp.
42. Forsmo, S. P. E., Influence of green pellet properties on pelletizing of magnetite iron
ore. Ph.D. Thesis, in Department of Chemical Engineering and Geosciences. 2007,
Luleå University of Technology: Luleå. p. 106.
43. Wu, D. X. Y., Lee, C. Y. C., Widdicombe, J. H., Phil, D., and Bastacky, J.,
Ultrastructure of tracheal surface liquid: Low-temperature scanning electron
microscopy. Scanning, 1996. 18(8): p. 589-592.
44. Nijsse, J., and Van Aelst, A. C., Cryo-planing for cryo-scanning electron
microscopy. Scanning, 1999. 21(6): p. 372-378.
45. Wicksell, S. D., The Corpuscle Problem: A Mathematical Study of a Biometric
Problem. Biometrika 1925. Vol. 17(1/2 ): p. 84-99.
46. Fletcher, N. H., The Chemical Physics of Ice. 1970: Cambridge University Press,
Cambridge, UK.
40
Article I
Cryo-SEM method for the observation of entrapped bubbles
and degree of water filling in large wet powder compacts. J. Mouzon, I. U. Bhuiyan, S. P. E. Forsmo, and J. Hedlund
Published online in Journal of Microscopy
DOI:10.1111/j.1365-2818.2010.03458.x

Journal of Microscopy, 2010 doi: 10.1111/j.1365-2818.2010.03458.x
Received 1 June 2010; accepted 15 September 2010
Cryo-SEM method for the observation of entrapped bubblesand degree of water filling in large wet powder compacts
J . M O U Z O N ∗, I . U . B H U I Y A N ∗, S . P . E . F O R S M O†& J . H E D L U N D ∗∗Division of Chemical Engineering, Lulea University of Technology, Lulea, Sweden
†LKAB, Research and Development, Malmberget, Sweden
Key words. Bubble, cryo-machining, cryo-SEM, freezing, green pellet, iron ore.
Summary
There are generally two problems associated with cryogenicscanning electron microscopy (cryo-SEM) observations oflarge wet powder compacts. First, because water cannot bevitrified in such samples, formation of artefacts is unavoidable.Second, large frozen samples are difficult to fracture butalso to machine into regular pieces which fit in standardholders, especially if made of hard materials like ceramics. Inthis article, we first describe a simple method for planninghard cryo-samples and a low-cost technique for cryo-fracture and transfer of large specimens. Subsequently, afterapplying the entire procedure to green pellets of iron oreproduced by balling, we compare the influence of plunge- andunidirectional freezing on large entrapped bubbles throughoutthe samples as well as the degree of water filling at theouter surface of the pellets. By carefully investigating thepresence of artefacts in large areas of the samples and bycontrolling the orientation of the sample during freezingand preparation, we demonstrate that unidirectional freezingenables the observation of large entrapped bubbles withminimum formation of artefacts, whereas plunge freezing ispreferable for the characterization of the degree of water fillingat the outer surface of wet powder compacts. The minimumformation of artefacts was due to the high packing density ofthe iron ore particles in the matrix.
Introduction
Ceramic green bodies produced by casting techniques (Maoet al., 2008), wet granules formed by high-shear mixing(Saleh et al., 2005), wet iron ore pellets produced in ballingprocesses (Forsmo et al., 2006) and hydrated cement formedby moulding of concrete (Poellmann et al., 2000) are all
Correspondence to: J. Mouzon, Division of Chemical Engineering, Lulea University
of Technology, 971 87 Lulea, Sweden. Tel: +46920491960; fax: +46920491199;
e-mail: [email protected]
examples of divided solids shaped and compacted in anaqueous matrix. These techniques require mechanical mixingof the solids and water, which usually results in entrapmentof air as air bubbles. Upon drying entrapped bubbles result inlarge cavities, which seriously reduce the strength of sinteredceramics (Takao et al., 2000), dried green iron pellets (Forsmoet al., 2008) or cured concrete (Cross et al., 2001).
Therefore, a reliable method is needed for thecharacterization of large bubbles in terms of morphology, size,number and location in wet compacts in order to understandand mitigate their formation. The scarcity of bubbles requiresthe characterization of regions large enough to be consideredas representative, i.e. in the centimetre range, because bubbleslarger than 100 µm are frequently encountered (Forsmo et al.,2008).
In the case of wet agglomeration, another microstucturalparameter of importance is the water level in capillaries at thesurface of the granules. In such process, it is the degree of waterfilling that imparts most of the strength to the wet granules(Iveson et al., 2001). Hence, direct observation of the waterlevel in capillaries would further improve understanding ofgranulation processes.
The objectives stated above imply resolving the interfacesbetween water, air and solid. Such information can obviouslynot be retrieved on dry samples.
In this respect, cryogenic scanning electron microscopyand freeze fracturing are attractive techniques because theyallow direct observation of cross-sections of frozen samples.However, complete vitrification of water during freezing isnecessary to prevent artefacts caused by the crystallizationof ice such as redistribution of fluid or mechanical damage.Current methods like plunge freezing in a cryogen andhigh-pressure freezing only enable to vitrify samples with amaximum thickness of 20 and 600 µm, respectively (Galwayet al., 1995). Thus, formation of artefacts is inevitable if largersamples are to be frozen. In addition, slicing of wet compactsis not realistic and might cause water redistribution. For thisreason, suitable methods for sample preparation to study large
C© 2010 The AuthorsJournal of Microscopy C© 2010 Royal Microscopical Society
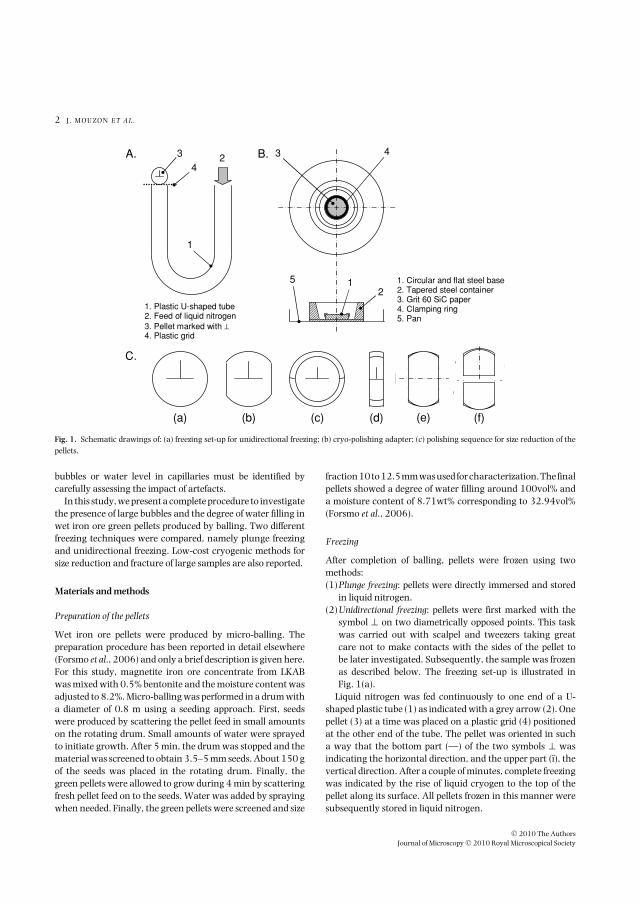
2 J . M O U Z O N E T A L .
Fig. 1. Schematic drawings of: (a) freezing set-up for unidirectional freezing; (b) cryo-polishing adapter; (c) polishing sequence for size reduction of thepellets.
bubbles or water level in capillaries must be identified bycarefully assessing the impact of artefacts.
In this study, we present a complete procedure to investigatethe presence of large bubbles and the degree of water filling inwet iron ore green pellets produced by balling. Two differentfreezing techniques were compared, namely plunge freezingand unidirectional freezing. Low-cost cryogenic methods forsize reduction and fracture of large samples are also reported.
Materials and methods
Preparation of the pellets
Wet iron ore pellets were produced by micro-balling. Thepreparation procedure has been reported in detail elsewhere(Forsmo et al., 2006) and only a brief description is given here.For this study, magnetite iron ore concentrate from LKABwas mixed with 0.5% bentonite and the moisture content wasadjusted to 8.2%. Micro-balling was performed in a drum witha diameter of 0.8 m using a seeding approach. First, seedswere produced by scattering the pellet feed in small amountson the rotating drum. Small amounts of water were sprayedto initiate growth. After 5 min, the drum was stopped and thematerial was screened to obtain 3.5–5 mm seeds. About 150 gof the seeds was placed in the rotating drum. Finally, thegreen pellets were allowed to grow during 4 min by scatteringfresh pellet feed on to the seeds. Water was added by sprayingwhen needed. Finally, the green pellets were screened and size
fraction 10 to 12.5 mm was used for characterization. The finalpellets showed a degree of water filling around 100vol% anda moisture content of 8.71wt% corresponding to 32.94vol%(Forsmo et al., 2006).
Freezing
After completion of balling, pellets were frozen using twomethods:(1)Plunge freezing: pellets were directly immersed and stored
in liquid nitrogen.(2)Unidirectional freezing: pellets were first marked with the
symbol ⊥ on two diametrically opposed points. This taskwas carried out with scalpel and tweezers taking greatcare not to make contacts with the sides of the pellet tobe later investigated. Subsequently, the sample was frozenas described below. The freezing set-up is illustrated inFig. 1(a).
Liquid nitrogen was fed continuously to one end of a U-shaped plastic tube (1) as indicated with a grey arrow (2). Onepellet (3) at a time was placed on a plastic grid (4) positionedat the other end of the tube. The pellet was oriented in sucha way that the bottom part (—) of the two symbols ⊥ wasindicating the horizontal direction, and the upper part (ı), thevertical direction. After a couple of minutes, complete freezingwas indicated by the rise of liquid cryogen to the top of thepellet along its surface. All pellets frozen in this manner weresubsequently stored in liquid nitrogen.
C© 2010 The AuthorsJournal of Microscopy C© 2010 Royal Microscopical Society
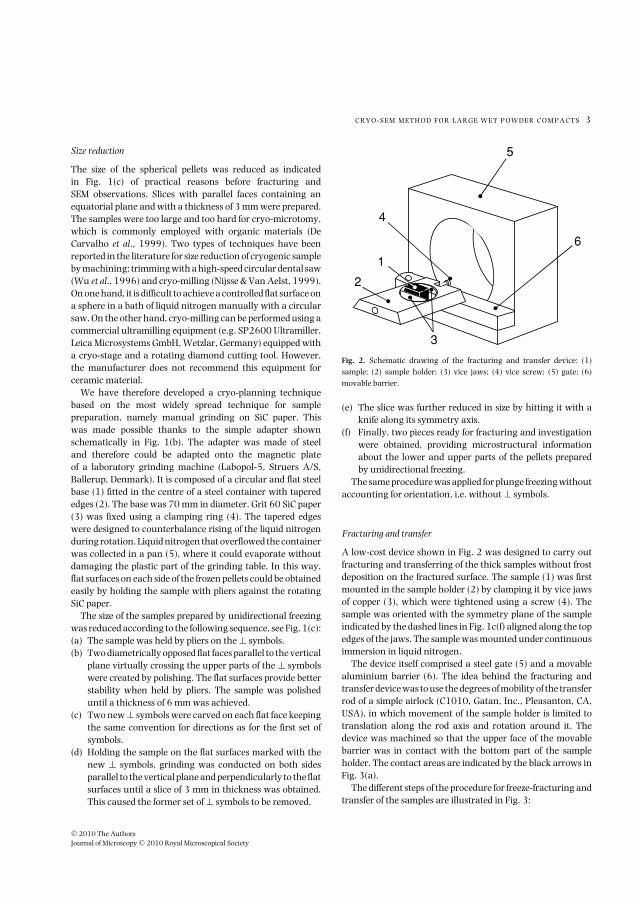
C R Y O - S E M M E T H O D F O R L A R G E W E T P O W D E R C O M P A C T S 3
Size reduction
The size of the spherical pellets was reduced as indicatedin Fig. 1(c) of practical reasons before fracturing andSEM observations. Slices with parallel faces containing anequatorial plane and with a thickness of 3 mm were prepared.The samples were too large and too hard for cryo-microtomy,which is commonly employed with organic materials (DeCarvalho et al., 1999). Two types of techniques have beenreported in the literature for size reduction of cryogenic sampleby machining; trimming with a high-speed circular dental saw(Wu et al., 1996) and cryo-milling (Nijsse & Van Aelst, 1999).On one hand, it is difficult to achieve a controlled flat surface ona sphere in a bath of liquid nitrogen manually with a circularsaw. On the other hand, cryo-milling can be performed using acommercial ultramilling equipment (e.g. SP2600 Ultramiller,Leica Microsystems GmbH, Wetzlar, Germany) equipped witha cryo-stage and a rotating diamond cutting tool. However,the manufacturer does not recommend this equipment forceramic material.
We have therefore developed a cryo-planning techniquebased on the most widely spread technique for samplepreparation, namely manual grinding on SiC paper. Thiswas made possible thanks to the simple adapter shownschematically in Fig. 1(b). The adapter was made of steeland therefore could be adapted onto the magnetic plateof a laboratory grinding machine (Labopol-5, Struers A/S,Ballerup, Denmark). It is composed of a circular and flat steelbase (1) fitted in the centre of a steel container with taperededges (2). The base was 70 mm in diameter. Grit 60 SiC paper(3) was fixed using a clamping ring (4). The tapered edgeswere designed to counterbalance rising of the liquid nitrogenduring rotation. Liquid nitrogen that overflowed the containerwas collected in a pan (5), where it could evaporate withoutdamaging the plastic part of the grinding table. In this way,flat surfaces on each side of the frozen pellets could be obtainedeasily by holding the sample with pliers against the rotatingSiC paper.
The size of the samples prepared by unidirectional freezingwas reduced according to the following sequence, see Fig. 1(c):(a) The sample was held by pliers on the ⊥ symbols.(b) Two diametrically opposed flat faces parallel to the vertical
plane virtually crossing the upper parts of the ⊥ symbolswere created by polishing. The flat surfaces provide betterstability when held by pliers. The sample was polisheduntil a thickness of 6 mm was achieved.
(c) Two new ⊥ symbols were carved on each flat face keepingthe same convention for directions as for the first set ofsymbols.
(d) Holding the sample on the flat surfaces marked with thenew ⊥ symbols, grinding was conducted on both sidesparallel to the vertical plane and perpendicularly to the flatsurfaces until a slice of 3 mm in thickness was obtained.This caused the former set of ⊥ symbols to be removed.
Fig. 2. Schematic drawing of the fracturing and transfer device: (1)sample; (2) sample holder; (3) vice jaws; (4) vice screw; (5) gate; (6)movable barrier.
(e) The slice was further reduced in size by hitting it with aknife along its symmetry axis.
(f) Finally, two pieces ready for fracturing and investigationwere obtained, providing microstructural informationabout the lower and upper parts of the pellets preparedby unidirectional freezing.
The same procedure was applied for plunge freezing withoutaccounting for orientation, i.e. without ⊥ symbols.
Fracturing and transfer
A low-cost device shown in Fig. 2 was designed to carry outfracturing and transferring of the thick samples without frostdeposition on the fractured surface. The sample (1) was firstmounted in the sample holder (2) by clamping it by vice jawsof copper (3), which were tightened using a screw (4). Thesample was oriented with the symmetry plane of the sampleindicated by the dashed lines in Fig. 1c(f) aligned along the topedges of the jaws. The sample was mounted under continuousimmersion in liquid nitrogen.
The device itself comprised a steel gate (5) and a movablealuminium barrier (6). The idea behind the fracturing andtransfer device was to use the degrees of mobility of the transferrod of a simple airlock (C1010, Gatan, Inc., Pleasanton, CA,USA), in which movement of the sample holder is limited totranslation along the rod axis and rotation around it. Thedevice was machined so that the upper face of the movablebarrier was in contact with the bottom part of the sampleholder. The contact areas are indicated by the black arrows inFig. 3(a).
The different steps of the procedure for freeze-fracturing andtransfer of the samples are illustrated in Fig. 3:
C© 2010 The AuthorsJournal of Microscopy C© 2010 Royal Microscopical Society

4 J . M O U Z O N E T A L .
Fig. 3. Schematic drawing illustrating the fracturing and transfer procedure.
(a) First, the fracturing and transfer device was pre-cooledin liquid nitrogen. After venting the airlock with drynitrogen, it was quickly introduced in the back of theairlock in front of the ball valve. Directly thereafter, thetransfer rod with the sample was fitted onto the airlockand vacuum was switched on.
(b) The sample was rotated upside down and pushed towardsthe aluminium barrier.
(c) The sample was fractured with a single hit with a hammeron the knob at the end of the transfer rod.
(d) After pulling out and turning back the sample, the ballvalve was open and the sample pushed into the gate untilthe rod made contact with the barrier.
(e) At this stage, the sample was rotated 90◦.(f) By pulling out the transfer rod, the pivoted sample was
able to open the movable barrier.(g) Once the barrier opened, the sample was rotated back to
horizontal position.(h) Finally, the sample was transferred through the gate to
the SEM chamber.The method presented herein is simple, cheap, fast and
efficient. The pre-cooled device acts as a cold trap and helps toquickly reach the vacuum required to open the airlock. Thevacuum in the airlock results in low heat transfer and no frostdeposition on the fractured surface. The whole procedure is
completed within one and a half minute. The method facilitatesfracturing of thick brittle samples. In fact, we managed tofracture 6-mm-thick samples, and only the size of the sampleholder limited the thickness of the sample that could behandled. Because one of the jaws can rotate freely, completelyparallel flat faces of the samples are not necessary. The jawsalso increase the contact area, which allows for cool thermaltransfer.
Imaging
The microstructure of the fractured surfaces was recordedusing a low vacuum scanning electron microscope (JSM-6460lv, Japanese Electron Optics Limited, Tokyo, Japan)equipped with a W filament and a cold-stage (C1003, Gatan,Inc.). During investigation, the temperature of the cold-stagewas kept below –170◦C. The microscope was operated at15 kV in low vacuum mode (37 Pa) and back-scatteredelectrons were used for imaging.
Results
Spherical cavities in samples prepared by plunge freezing
By careful observation of several thin sections of sampleswhich were prepared by plunge freezing, three regions
C© 2010 The AuthorsJournal of Microscopy C© 2010 Royal Microscopical Society

C R Y O - S E M M E T H O D F O R L A R G E W E T P O W D E R C O M P A C T S 5
Fig. 4. Schematic drawing illustrating the different regions observed in samples prepared by plunge freezing (a) and images of typical cavities observedin: region 1 (b), region 2 (c) and region 3(d). The dashed line in (b) indicates the boundary between two regions with different fines concentration.
with different microstructural properties could be identified.Figure 4(a) indicates the location of the three regions (1, 2 and3) in the samples. Empty cavities corresponding to entrappedair bubbles (Fig. 4b) were observed close to the outer surfaceof the pellets (region 1). This region reached a depth of about2 mm. The cavities were completely filled with water (Fig. 4d)in the core of the pellets (region 3). In between, a transitionregion (region 2) was found, where the cavities were partiallyfilled with water as shown in Fig. 4(c). In this region, thewater content of the cavities gradually increased as region 3was approached.
It is worth noting that a layer of fine particles is present atthe air/ice interface in the micrographs of Fig. 4. Interestingly,throughout all samples the space between the large iron oreparticles in the direct vicinity of the cavities was not filled withfiner material as in the rest of the matrix, as clearly observedon the right-hand side of Fig. 4(b).
Observation of the matrix
Figure 5 shows typical images of the matrix betweenthe spherical cavities. The morphology of the matrix is
independent of freezing method. The matrix is very dense andthe main fraction is not surprisingly comprised iron ore grainswith finer material mixed with coarser material, see Fig. 5(a).Unlike in the spherical cavities, the size of the water domainsis quite small, i.e. <2 µm (Fig. 5a). Occasionally, columnarstructures of iron ore grains and water were observed inregions of low packing density (Fig. 5b).
Spherical cavities in samples prepared by unidirectional freezing
All cavities were empty and appeared similar throughoutthe entire sample that had been frozen by unidirectionalfreezing, as shown in Fig. 6(a) and (b). Nearly spherical cavitiessurrounded by large iron ore particles oriented with a flatsurface parallel to the air/ice interface were the most typicalfeatures observed. As in the sample that had been preparedby plunge freezing, a layer of fine particles was also present atthe interface air/ice in all cavities and there was a lack of finematerials in the direct vicinity of the cavities.
In addition, discrete ice crystals inside the cavities wereobserved at the surface of the cavity that was at thelowest temperature, i.e. at the bottom surface of cavities for
C© 2010 The AuthorsJournal of Microscopy C© 2010 Royal Microscopical Society

6 J . M O U Z O N E T A L .
Fig. 5. Typical images of the matrix between the spherical cavities, independent of freezing method (a) and columnar structure in a region of low packingdensity (b).
unidirectional freezing (see Fig. 6a) and at the surface closestto the exterior of the pellet for plunge freezing. However, thesecrystals were only encountered in the first two thirds of thepellets that had been unidirectionally frozen. On average, therewere more crystals in each bubble at the bottom of the pellet,i.e. the region which was frozen first. The quantity of crystalsdecreased gradually from this region up to two thirds of thediameter where they disappeared. Such crystals were alsofound to lie on the top outer surface of the pellet.
Observation of the cross-section close to the outer surface of thepellet
Figure 7 shows cross-sections at the outer surface of the pelletsfrozen by the two methods. A distinct level of frozen water, i.e.ice crystals, is observed on all samples. In the case of plungefreezing (Fig. 7a), the ice does not reach the outer surface of the
pellet. This indicates the presence of capillary forces holdingthe water inside the pellets. Similar observations were madealso for pellets frozen by unidirectional freezing but only at thebottom of the pellet (Fig. 7b). At the top of the pellet, the icereached closer to the surface (Fig. 7c). Also here, discrete icecrystals were observed on the top surface (Fig. 7d).
Discussion
Spherical cavities related to entrapped bubbles but completelyfilled with water have been already reported for cement inliterature (Mehta et al., 1994; Corr et al., 2002). However, itcould never really be ascertained whether these observationswere artefacts or not.
Our work clearly demonstrates that plunge freezing is notappropriate to study large cavities in large wet compactswhen water cannot be completely vitrified. The ice that first
Fig. 6. Images of typical cavities in: (a) the bottom part of the sample prepared by unidirectional freezing; (b) the upper part.
C© 2010 The AuthorsJournal of Microscopy C© 2010 Royal Microscopical Society

C R Y O - S E M M E T H O D F O R L A R G E W E T P O W D E R C O M P A C T S 7
Fig. 7. Cross-sections at the outer surface of the pellets frozen by: (a) plunge freezing; (b) unidirectional freezing, bottom part; (c) unidirectional freezing,upper part; (d) enlargement of (c).
crystallizes all around the sample builds a solid shell and thewater remaining in the interior of the pellet is forced intothe cavities because of the larger volume occupied by icethan liquid water (Fletcher, 1970). The hydrostatic pressurebuilding up results in penetration of water into the sphericalcavities and forces gas entrapped in the bubbles to escapethrough cracks or grain boundaries.
By contrast, unidirectional freezing did not cause any fillingof the bubbles with water, likely because no shell of ice is formedaround the sample, which shows the potential of this methodfor studying large cavities in wet compacts which cannot bevitrified because of size requirements.
Nevertheless, plunge freezing may be more appropriate tostudy the degree of water filling at the outer surface of wetcompacts, because this method seems not to affect the waterlevel at the outer surface. This stems from the fact that waterfirst exposed to liquid nitrogen all around the samples instantlyfreezes. Besides it is not affected by the hydrostatic pressurebuilding up in the interior, because remaining liquid watercan penetrate into entrapped bubbles and push air outside thefrozen body through the formation of cracks.
The columnar structure of ice encountered in the matrixmay be an artefact caused by segregation of the iron oregrains to the grain boundaries of the growing ice crystals inregions of low packing density, a well-known phenomenonoccurring in the process of freeze-casting (Deville, 2008).In the micrographs shown in Figs 4 and 6, the very fineparticles located at the interface between air and ice andobserved in all cavities may also have been moved to theair/water interface by segregation due to the growth of icecrystals. However, no fine particles were found to be segregatedat the boundaries between ice grains in the matrix closeto the interface (i.e. no columnar segregation), which waslikely to occur if these particles had been dispersed in waterbefore freezing. Therefore, these fine particles might have beenfloating at the surface of water from the start.
Because they were found to lie on this layer of fine particlesand also on the faces of large iron ore particles inside cavities,the discrete ice crystals were likely formed after completefreezing around the cavities and as a result of a criticaltemperature gradient. The ice crystals probably grew as aresult of vapour deposition of moisture at the location with
C© 2010 The AuthorsJournal of Microscopy C© 2010 Royal Microscopical Society

8 J . M O U Z O N E T A L .
lowest temperature. This process did probably not occur to thesame extent in the part of the pellets that were cooled moreslowly (the upper part of the unidirectionally frozen pelletand most of the pellet prepared by plunge freezing), due toa more homogeneous temperature throughout the cavitiesor the formation of cracks, which exposed more surface fordeposition.
Finally, it must be noted that the method presented inthis work should perform satisfactorily for any wet powdercompact exhibiting low columnar segregation during freezing,which is limited by high packing density of the solid particlesand large particle size.
Acknowledgements
The Swedish Governmental Agency for Innovation Systems(Vinnova) together with the mining companies LKAB andBoliden are acknowledged for financially supporting this work.
References
Corr, D.J., Monteiro, P.J.M. & Bastacky, J. (2002) Microscopiccharacterization of ice morphology in entrained air voids. ACI Mater. J.99, 190–195.
Cross, W.M., Duke, E.F., Kellar, J.J. & Johnston D.P. (2001) Scanningelectron microscopy and other techniques to investigate low-strengthconcrete. Transp. Res. Rec. 1775, 10–16.
De Carvalho, M.L.M., Van Aelst, A.N C., Van Eck, J.W. & Hoekstra, F.A.(1999) Pre-harvest stress cracks in maize (Zea mays L.) kernels ascharacterized by visual, X-ray and low temperature scanning electronmicroscopical analysis: effect on kernel quality. Seed Sci. Res. 9, 227–236.
Deville, S. (2008) Freeze-casting of porous ceramics: a review of currentachievements and issues. Adv. Eng. Mater. 10, 155–169.
Fletcher, N.H. (1970) The Chemical Physics of Ice. Cambridge UniversityPress, Cambridge, UK.
Forsmo, S.P.E., Apelqvist, A.J., Bjorkman, B.M.T. & Samskog P.-O. (2006)Binding mechanisms in wet iron ore green pellets with a bentonitebinder. Powder Technol. 169, 147–158.
Forsmo, S.P.E., Forsmo, S.-E., Bjorkman, B.M.T. & Samskog, P.-O. (2008)Studies on the influence of a flotation collector reagent on iron ore greenpellet properties. Powder Technol. 182, 444–452.
Galway, M.E., Heckman, J.W., Hyde, G.J. & Fowke, L.C. (1995) Advancesin high-pressure and plunge-freezing. Method Cell Biol. 49, 3–19.
Iveson, S.M., Litster, J.D., Hapgood, K. & Ennis, B.J. (2001) Nucleation,growth and breakage phenomena in agitated wet granulationprocesses: a review. Powder Technol. 117, 3–39.
Mao, X., Shimai, S., Dong, M. & Wang, S. (2008) Gelcasting andpressureless sintering of translucent alumina ceramics. J. Am. Ceram.Soc. 91, 1700–1702.
Mehta, S., Jones, R., & Caveny, B. (1994) Cryogenics with cementmicroscopy redefines cement behaviour. Oil Gas J. 92, 47–53.
Nijsse, J. & Van Aelst, A.C. (1999) Cryo-planing for cryo-scanning electronmicroscopy. Scanning 21, 372–378.
Poellmann, H., Goeske, J. & Pankau, H.G. (2000) Application of cryo-transfer scanning electron microscopy for investigation of cementhydration and cementitious systems. Twenty-second InternationalConference of Cement Microscopy, pp. 310–331, International CementMicroscopy Association, Montreal, Quebec, Canada.
Saleh, K., Vialatte L. & Guigon P. (2005) Wet granulation in a batch highshear mixer. Chem. Eng. Sci. 60, 3763–3775.
Takao, Y., Hotta, T., Nakahira, K., Naito, M., Shinohara, N., Okumiya,M. & Uematsu, K. (2000) Processing defects and their relevance tostrength in alumina ceramics made by slip casting. J. Eur. Ceram. Soc.20, 389–395.
Wu, D.X., Lee, C.Y., Widdicombe, J.H. & Bastacky, J. (1996)Ultrastructure of tracheal surface liquid: low-temperature scanningelectron microscopy. Scanning 18, 589–592.
C© 2010 The AuthorsJournal of Microscopy C© 2010 Royal Microscopical Society

Article II
Quantitative image analysis of bubble cavities in iron ore
green pellets. I. U. Bhuiyan, J. Mouzon, S. P. E. Forsmo, and J. Hedlund
Manuscript submitted to Powder Technology

Quantitative image analysis of bubble cavities in iron ore green pellets
I. U. Bhuiyana*, J. Mouzona, S. P. E. Forsmob, J. Hedlunda
a Chemical Technology, Luleå University of Technology, SE-971 87 Luleå, Sweden bLKAB, R & D, SE-983 81 Malmberget, Sweden
* Correspondence to: [email protected]; Tel: +46 920 492861 Abstract Scanning electron microscopy and image analysis was used for quantitative analysis of bubble cavities in iron ore green pellets. Two types of pellets prepared with and without addition of flotation reagent prior to balling were studied. The bubble cavity porosity amounted to 2.8% in the pellets prepared without addition of flotation reagent prior to balling. When flotation reagent was added prior to balling, the bubble cavity porosity increased by a factor of 2.4 and the median bubble diameter was decreased slightly. It was also shown that mercury intrusion porosimetry is not suitable for determination of the distribution of bubble cavities. Finally, our data suggested that the difference in total porosity determined by mercury intrusion porosimetry and pycnometry between the two types of pellets was due to the bubble cavities. Keywords: porosity, air bubbles, image analysis, green pellet, stereology, SEM 1. Introduction Iron ore pellets are one of the main feed sources for blast furnaces or direct reduction processes for steel and iron making industries. Iron ore fines are agglomerated into green pellets by first mixing magnetite concentrate, water, additives and binder, i.e. bentonite. In the next step, green pellets are formed in a balling drum or disk and then the pellets are dried and indurate in straight grate or grate kiln plants to form the final pellet product [1, 2]. The properties of green pellets depend on the constituent minerals, chemical composition, particle size distribution, moisture content, binder type and dosage and additives. Porosity and pore structure are important features of green pellets that affect permeability and durability of the final pellets. Thermal conductivity and diffusivity increase with porosity up to a certain level, but beyond this level, both conductivity and diffusivity decrease [3]. Oxidation time of magnetite is reported to be shorter with increasing porosity [4]. Therefore, controlling porosity in green pellets, both for quality assessment and development purposes, is of importance to the iron ore pelletizing industry. One particular type of porosity is that introduced by bubble entrapment. This phenomenon causes the formation of large spherical cavities after drying and was found to be enhanced with increasing amount of the flotation collector reagent employed during separation of apatite from magnetite [5]. Air bubbles might also become entrapped by moistened particle or sprayed water during balling in the rotating drum. The resulting entrapped bubbles can act as crack initiators and deteriorate the compressive strength of the green pellets. Hence, quantitative data related to this fraction of porosity would be valuable. Measurement of the total porosity in green pellets can be carried out by a combination of gas displacement pycnometry and analysis of the envelope density with silica sand [6] or by mercury porosimetry. The latter technique can in addition give information about the size distribution of the pore throats and under certain circumstances of the pore chambers using the intrusion and extrusion
measurements, respectively [7, 8]. However, mercury is not environmentally viable and many companies have given up this characterization technique. Image analysis of SEM micrographs may be used for quantitative determination of morphological features in iron ore pellets. However, the porosity of iron ore green pellets after drying is complex and has two different origins: the continuous porosity between the grains packed during balling and large cavities caused by bubble entrapment as discussed above. If one wants to quantitatively determine the latter by image analysis, the two types of porosity must be distinguished. Since morphological opening is useful to smooth irregular borders and fill or remove isolated pixels from images [9, 10], it has a strong potential to isolate the large individual cavities from the smaller voids of the continuous porosity. In the present work, we show for the first time how image analysis of scanning electron micrographs can be used for quantitative determination of bubble cavities in iron ore pellets. Pellets prepared with and without addition of flotation reagent prior to balling were characterized and the results were compared with mercury porosimetry and pycnometry data. 2. Materials and methods 2.1 Materials Magnetite concentrate enriched by flotation was collected from the Kiruna concentrating plant, Sweden. The concentrate was stored in barrels for several years prior to pelletization. As a binder, bentonite was used. The used flotation collector reagent is an anionic collector consisting of a main collector, co-collector and foam regulator and contains 95-98% surface active compounds and 2-5% maleic acid and glycol derivates. 2.2 Micro-balling of iron ore green pellets Green pellets were prepared by micro balling as described in detail by Forsmo [11]. In short, the pellet feed was prepared by mixing 7 kg of magnetite concentrate with 0.5% bentonite in a laboratory mixer (Eirich R02, Germany) and the moisture content was adjusted to 9.4% during mixing. Directly after mixing, seeds with a size of 3.5 to 5 mm were prepared by spreading some of the feed in a 0.8 m drum rotating at a speed of 37 rpm while tempered water was sprayed to initiate growth of agglomerates. In the next step, 150 g of seeds were returned to the drum, now rotating at a speed of 47 rpm. The seeds were grown to green pellets by successively adding feed and spraying water in the drum. The final moisture content was 9.2% and green pellets with a size between 10 to 12.5 mm were selected by screening. Two batches of green pellets were prepared. In one batch, no flotation collector reagent was added to the feed. In the other batch, 60g/t of flotation reagent was added to the feed prior to pelletization. The pellet batch made with addition of flotation collector reagent is denoted FLOT, while the other batch used as a reference, in which no flotation reagent was added, is denoted REF in the following. The samples were dried overnight at 105°C. 2.3 Sample preparation for SEM imaging of the cross section Three dried pellets from each batch were mounted in low viscosity epoxy resin (Struers EpoFix) using vacuum impregnation prior to SEM observation. In order to improve epoxy impregnation of the core of the pellets, slightly less than half of each dry pellet was removed by manual grinding prior to embedding. Metallographic polishing was carried out in a semi automated polishing machine using 9 µm, 3 µm and 1 µm diamond suspensions consecutively. Polishing was carried out in such a way that the polished surface propagated close to the center the original pellet. 2.4 Image Acquisition Images were acquired by scanning electron microscopy (JSM-6460lv, JEOL, Japan) utilizing the backscattered electron compositional (BEC) signal at 15 kV and 100X magnification. Each image
2

was recorded with a resolution of 960 pixels by 1280 pixels, resulting in 1.0 pixel per 1.0 µm. Images were acquired manually with virtually no overlapping and the entire cross-section of each pellet was captured. This was achieved by first calibrating scan rotation and lateral displacement for the particular instrumental conditions e.g. operating voltage, focus, working distance and magnification. To minimize the intensity gradient in the images, the polished section of the pellet was kept parallel to the backscattered electron detector. Similar levels of brightness and contrast were maintained for each image acquisition by adjusting the dynamic range of the gray levels (0, 255) of the histogram if necessary. 2.5 Image Processing Stitching The acquired images of the entire cross-section of each pellet for each sample, about 120 images in total, were assembled together into a single image using the “montage” function in the image processing toolbox in Matlab R2009a. Fig.1(a) and 1(b) show the assembled cross-sections of one pellet in the FLOT and REF series, respectively. Fig.1(c) and (d) show the corresponding cross-sections after image processing. In these images, white represents pores. To better illustrate the different steps of image processing described below, Fig.2 shows an enlargement of the area delimited in red in Fig.1(a). Noise reduction The microstructure shown in Fig.2(a) is subjected to artifacts (e.g. noise from the microscope detector, floating grains in the pores and formation of bubbles during epoxy impregnation) which must be eliminated before pore structure analysis. Median filtering was performed to remove extreme pixel values from the image. Thresholding A typical histogram of the cross-section of the pellet shown in Fig.1(a) is presented in Fig.3. It corresponds to the area delimited in red. The first peak at low gray scale values is due to the dark epoxy, which fills the pores, and the second, at high gray scale values, corresponds to magnetite. Silicates result in gray levels located in between both peaks. The threshold value was determined by trial and error until all pore regions were converted to black and the mineral regions to white, as shown in Fig.2(b). The optimum threshold value was 71.5 and this value is indicated by a dashed line in Fig.3. Complementation and filling The binary image obtained after thresholding contains floating grains inside the pores, see Fig.2(b). The floating grains were removed using the Matlab function ‘imfill’ and the result is illustrated in Fig.2(c). Morphological opening Next step was morphological opening, i.e. an erosion step followed by dilation. A disk-shaped structuring element of 10 pixels in radius was employed. The final binary image is shown in Fig.2(d).
3

2.3.4 Image Analysis After cutting and polishing a pellet, only profiles of the randomly sectioned pores are visible on the two dimensional flat cross-section. A number of parameters of these profiles were measured in the images shown in Fig.1(c) and Fig.1(d) utilizing image analysis. A Matlab code was developed to count and label individual pore profiles with corresponding area and equivalent diameter of a circle with the same area using the Matlab function ‘regionprops’. The 2D data obtained by image analysis were unfolded to three dimensional data using stereology assuming a spherical shape for the pores. In a first step, the total pore profile area density for each size class was converted to area numerical density (number of pore profiles per unit area) by dividing each value with the equivalent area of a circle corresponding to the average equivalent diameter of the size class. Subsequently, the Wicksell-Saltykov [12, 13] unfolding procedure was followed to calculate the volume numerical density (number of spherical pores per unit volume). Finally, this set of data was converted to total pore volume density by multiplying the volume numerical density by the volume of a sphere derived from the equivalent diameter of each size class and the cumulative curves were plotted. 2.4 Mercury Intrusion Porosimetry The total porosity and the throat and cavity size distribution were investigated by mercury intrusion porosimetry (MIP, Micromeritics AutoPore III 9410). The measurements were performed within the pore diameter interval 360 μm ≥φ≥ 0.003 μm. For evaluation of the data, the surface tension and the contact angle of mercury were set to 485 mN/m and 130°, respectively. 2.5 Particle Size Distribution by Laser Diffraction Green iron ore pellets were dispersed in deionised water by magnetic stirring followed by treatment using ultrasound for 60 seconds. The particle size distribution was subsequently measured by laser diffraction using a Cilas Granulometer 1064. 3. Results and discussion 3.1 Microstructural description of the pellets The particle size distribution measured by laser diffraction of the dispersed pellet is shown in Fig.4. Nearly 90 vol% of the particles is larger than 5 µm. These particles constitute most of the pellet microstructure shown in Fig.2(a). Before analyzing the data obtained by mercury porosimetry and image processing, it is important to depict the main characteristics of the two kinds of porosity that are observed:
1. The packing porosity forms a continuous network of relatively small (< 20 µm) cavities connected by throats at different scales and ranges over a large scale in size, from the narrowest spaces between two particles for the throats up to cavities caused by accidental packing of 3 to 4 of the largest particles (50 to 100 µm according to laser diffraction data shown in Fig.4). It is noteworthy that the throats have to be narrow at least in one direction, but can extend on larger distances in the other two.
2. The additional porosity due to bubble cavities consists of relatively large isolated cavities, which are rather spherical in shape. Deviation of spherical shape was sometimes observed and may have been caused by mechanical deformation of the pellet and more rarely upon coagulation of several bubbles. The cavities are connected to the continuous packing porosity and can therefore be considered as pore chambers. In our previous work [14], the bubble cavities were typically found to be > 20 µm, which justifies the use of a structuring element of this size in diameter in order to remove the packing porosity, see below.
4

3.2 Mercury porosimetry The mercury porosimetry results are presented in Fig.5. As shown in Fig.5(a), the intrusion curve indicates the presence of a pore throat population with very narrow size distribution by the steep increase in cumulative pore volume. The corresponding size distribution is shown in Fig.5(b) with differential pore volume plotted as function of capillary diameter. The size distribution indicates that the throat diameters are rather well-defined and range between 1 and 2 µm. Considering the microstructural description above, it is obvious that most of the pellet is not intruded by mercury before the pressure has become sufficient to overcome the capillary forces in the first narrowest passages (i.e. throats) close to the outer surface of the pellet. Beyond this pressure the remaining unfilled porosity located inside the pellets on the other side of the passages is directly filled by the mercury front without further increase in pressure, since it has only equivalent or larger capillary diameters. Exactly the same results were obtained when the first millimeter around the pellets was removed prior to measurement. For these reasons, our results show that mercury intrusion porosimetry cannot be used for characterization of the size of bubble cavities. Nevertheless, this technique provides estimates of the total porosity of the pellets and the results are given in Table 1. The total porosity was 36.3% and 33.7% for the FLOT and REF samples, respectively. Similar total porosities measured by pycnometry have been reported earlier [6] and are also given in Table 1. The absolute difference in total porosity of 2.6% between the two batches of pellets is expected to be related to the amount of bubble cavities in the green pellets as discussed below. 3.3 Image analysis Fig.2(d) shows the binary image finally obtained after image processing of the original image shown in Fig.2(a). Image opening was carried out using a disk-shaped structuring element of 10 pixels or 10 µm in radius (strel10). The corresponding opening top hat (i.e. porosity removed by the opening operation) and the boundaries of the remaining pore profiles after the operation are shown in Fig.2(e) and Fig.2(f), respectively. By examining both figures, it is clear that this method was quite effective to isolate the interior of the bubble cavities. Of course, all pore profiles smaller than the size of the structuring element (20 µm) were removed. These profiles correspond mostly to the packing porosity but also to the smallest profiles produced by each size class of bubble cavities. In Fig.6(a) and Fig.6(b), the total pore profile area density is shown for the REF and FLOT series, respectively, after averaging of three pellets in each series. The raw data after the opening operation (labeled as original) indicate a single population in both cases, which corresponds to the bubble cavities. Log normal functions, represented with red curves, fit the distributions very well. This fitting was necessary because of the lack of statistical data to obtain continuous distributions without secondary maxima, which prevent the calculation of negative values by the unfolding procedure. In order to compensate for the absence of pore profiles < 20 µm, the values below 30 µm of the log normal curves were distributed by following a linear extrapolation to zero. The new points are indicated in blue. Fig.7 shows the cumulative pore volume density after unfolding by stereology the REF and FLOT series, respectively. In both cases, the curves derived from the log normal fitted data with or without linear extrapolation are only shifted slightly higher than those derived from the original dataset. Assuming that the curves obtained from the log normal fitted data with linear extrapolation are representative of the bubble cavity population only, the median diameter, d50, of bubble cavities in pellets of REF and FLOT type are 102 µm and 88 µm, respectively.
5
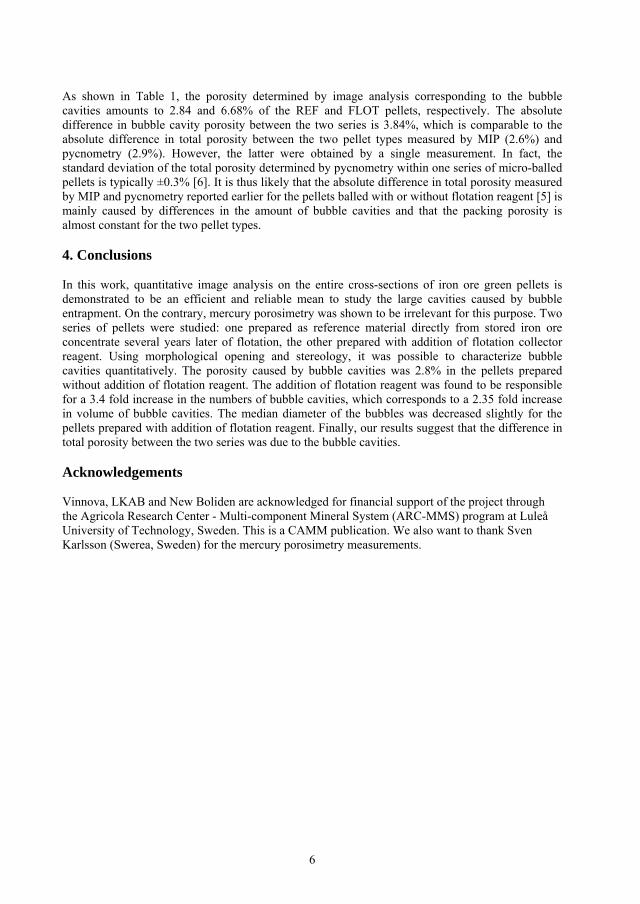
As shown in Table 1, the porosity determined by image analysis corresponding to the bubble cavities amounts to 2.84 and 6.68% of the REF and FLOT pellets, respectively. The absolute difference in bubble cavity porosity between the two series is 3.84%, which is comparable to the absolute difference in total porosity between the two pellet types measured by MIP (2.6%) and pycnometry (2.9%). However, the latter were obtained by a single measurement. In fact, the standard deviation of the total porosity determined by pycnometry within one series of micro-balled pellets is typically ±0.3% [6]. It is thus likely that the absolute difference in total porosity measured by MIP and pycnometry reported earlier for the pellets balled with or without flotation reagent [5] is mainly caused by differences in the amount of bubble cavities and that the packing porosity is almost constant for the two pellet types. 4. Conclusions In this work, quantitative image analysis on the entire cross-sections of iron ore green pellets is demonstrated to be an efficient and reliable mean to study the large cavities caused by bubble entrapment. On the contrary, mercury porosimetry was shown to be irrelevant for this purpose. Two series of pellets were studied: one prepared as reference material directly from stored iron ore concentrate several years later of flotation, the other prepared with addition of flotation collector reagent. Using morphological opening and stereology, it was possible to characterize bubble cavities quantitatively. The porosity caused by bubble cavities was 2.8% in the pellets prepared without addition of flotation reagent. The addition of flotation reagent was found to be responsible for a 3.4 fold increase in the numbers of bubble cavities, which corresponds to a 2.35 fold increase in volume of bubble cavities. The median diameter of the bubbles was decreased slightly for the pellets prepared with addition of flotation reagent. Finally, our results suggest that the difference in total porosity between the two series was due to the bubble cavities. Acknowledgements Vinnova, LKAB and New Boliden are acknowledged for financial support of the project through the Agricola Research Center - Multi-component Mineral System (ARC-MMS) program at Luleå University of Technology, Sweden. This is a CAMM publication. We also want to thank Sven Karlsson (Swerea, Sweden) for the mercury porosimetry measurements.
6

References 1. Meyer, K., Pelletizing of iron ores 1980, Berlin: Springer-Verlag. 2. Jaroslav, S. and Růžičková, Z., Pelletization of fines. Developments in mineral processing 7.
1988 New York: Elsevier Science Publishing Company, Inc. 3. Sundarmurti, N. S. and Rao, V., Thermal conductivity and diffusivity of iron ore pellet
having low porosity. ISIJ international, 2002. 42(7): p. 800-802. 4. Forsmo, S. P. E., Forsmo, S. E., Samskog, P. O., and Bjorkman, B. M. T. Mechanisms in oxidation and sintering of magnetite iron ore green pellets. Powder
technology, 2008. 183(2): p. 247-259. 5. Forsmo, S. P. E., Forsmo, S. E., Bjoerkman, B. M. T., and Samskog, P. O.,
Studies on the influence of a flotation collector reagent on iron ore green pellet properties. Powder technology, 2008. 182(3): p. 444-452.
6. Forsmo, S. P. E. and Vuori, J. P., The determination of porosity in iron ore green pellets by packing in silica sand. Powder technology, 2005. 159(2): p. 71-77.
7. Lapidus, G. R., Lane, A. M., NG, K. M., and Conner, W. C., Interpretation of Mercury Porosimetry Data Using a Pore-throat Network Model. Chemical Engineering Communications, 1985. 38(1-2): p. 33-56.
8. Klobes, P., Riesemeier, H., Meyer, K., Goebbels, J., and Hellmuth, K. H., Rock porosity determination by combination of X-ray computerized tomography with mercury porosimetry. Fresenius Journal of Analytical Chemistry, 1997. 357(5): p. 543-547.
9. Deshpande, S., Kulkarni, A., Sampath, S., and Herman, H., Application of image analysis for characterization of porosity in thermal spray coatings and correlation with small angle neutron scattering. Surface & Coatings Technology, 2004. 187(1): p. 6-16.
10. Faes, A., Hessler-Wyser, A., Presvytes, D., Vayenas, C. G., and Van Herle, J., Nickel-Zirconia Anode Degradation and Triple Phase Boundary Quantification from Microstructural Analysis. Fuel Cells, 2009. 9(6): p. 841-851.
11. Forsmo, S. P. E., Influence of green pellet properties on pelletizing of magnetite iron ore. Doctoral Dessertation, in Department of Chemical Engineering and Geosciences. 2007, Luleå University of Technology: Luleå, Sweden. p. 106.
12. Wicksell, S. D., The Corpuscle Problem: A Mathematical Study of a Biometric Problem. Biometrika 1925. Vol. 17(1/2 ): p. 84-99.
13. Weibel, E. R., Stereological Methods: Theoretical foundations. Vol. 2. 1980, London: Academic Press. 340 pp.
14. Mouzon, J., Bhuiyan, I. U., Forsmo, S. P. E., and Hedlund, J., Cryo-SEM Method for the Observation of Entrapped Bubbles and Degree of Water Filling in Large Wet Powder Compacts. Journal of Microscopy-Oxford, 2010.
7

List of figures Fig. 1. Iron ore pellet cross-sections of: (a) FLOT as assembled; (b) REF as assembled; (c) FLOT after image processing; (d) REF after image processing. The area delimited in red in (a) is enlarged in Fig.2. The scalebar in each image corresponds to 1 mm. Fig. 2. Image processing sequence: (a) original image, enlargement of the area delimited in red in Fig.1(a); (b) after thresholding; (c) complemented image after filling; (d) final image after morphological opening with structuring element 10; (e) opening top hat of (d); (f) boundaries of the profiles obtained in (d) superimposed on (a). Fig. 3. Image histogram of the area delimited in red in Fig.(a). Fig. 4. Particle size distribution measured by laser diffraction. Fig. 5. Mercury intrusion porosimetry results: (a) Cumulative mercury volume, (b) Throat size distribution from the differential pore volume. Fig. 6. Total pore area density data for: (a) REF and (b) FLOT. Fig. 7. Cumulative pore volume density data for: (a) REF and (b) FLOT.
8

List of tables Table 1. Porosities measured by mercury porosimetry, pycnometry and image analysis.
9
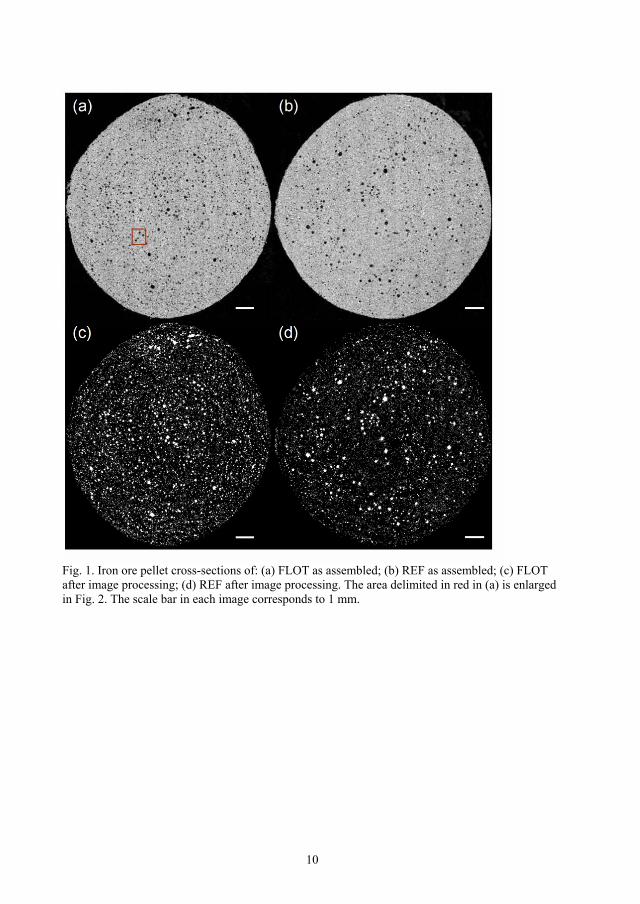
Fig. 1. Iron ore pellet cross-sections of: (a) FLOT as assembled; (b) REF as assembled; (c) FLOT after image processing; (d) REF after image processing. The area delimited in red in (a) is enlarged in Fig. 2. The scale bar in each image corresponds to 1 mm.
10
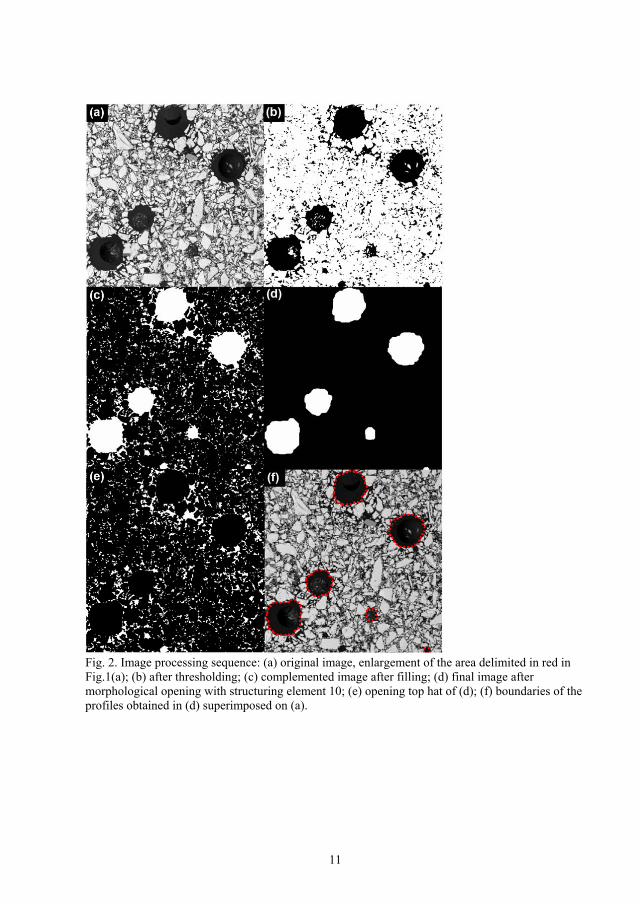
Fig. 2. Image processing sequence: (a) original image, enlargement of the area delimited in red in Fig.1(a); (b) after thresholding; (c) complemented image after filling; (d) final image after morphological opening with structuring element 10; (e) opening top hat of (d); (f) boundaries of the profiles obtained in (d) superimposed on (a).
11

Fig. 3. Image histogram of the area delimited in red in Fig.1(a).
12
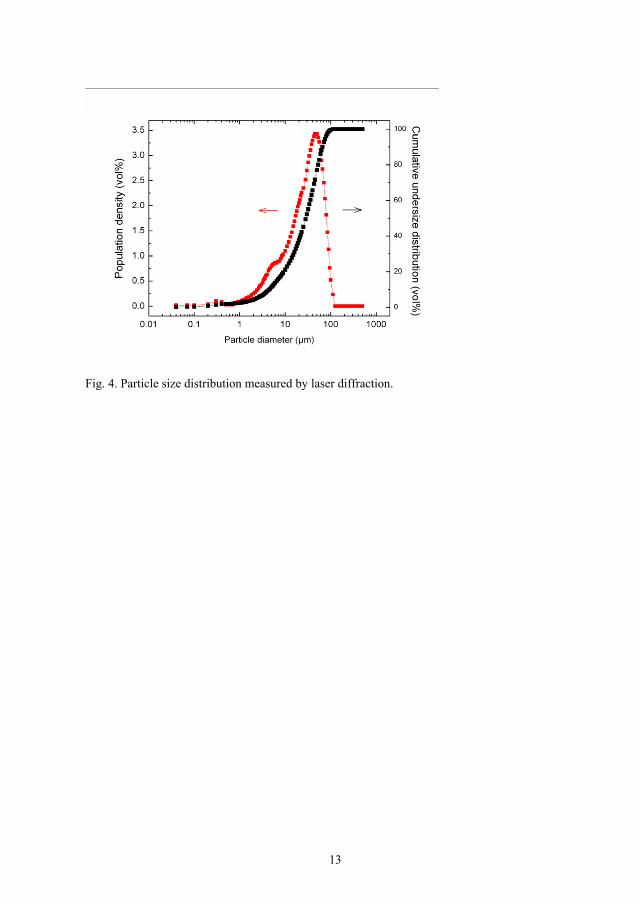
Fig. 4. Particle size distribution measured by laser diffraction.
13
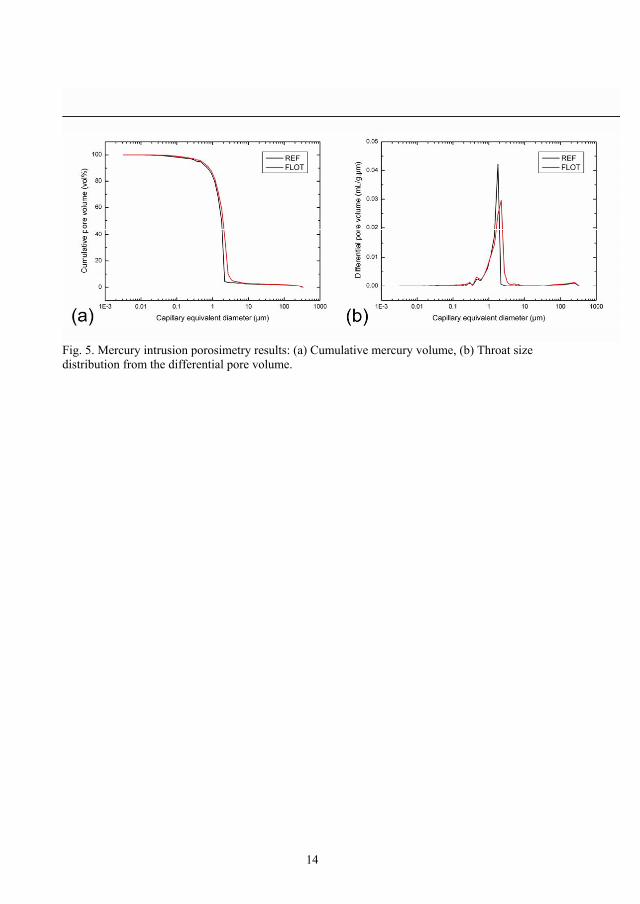
Fig. 5. Mercury intrusion porosimetry results: (a) Cumulative mercury volume, (b) Throat size distribution from the differential pore volume.
14

Fig. 6. Total pore profile area density data for: (a) REF and (b) FLOT.
Fig. 7. Cumulative pore volume density data for: (a) REF and (b) FLOT.
15

Table1. Porosities measured by mercury porosimetry, pycnometry and image analysis. Porosity REF (%) FLOT (%) Absolute
difference (%) Total porosity measured by Mercury Intrusion Porosimetry
33.7 36.3 2.6
Total porosity measured by Pycnometry
34.0 36.9 2.9
Bubble cavity porosity determined using image analysis (log norm + extrapol)
2.84 6.68 3.84
16
Article III
Quantitative 3D analysis of bubble cavities in iron ore pellets
by X-ray microtomography. J. Mouzon, I. U. Bhuiyan, F. Forsberg, S. P. E. Forsmo, M. Sjödahl, and
J. Hedlund
Manuscript

Quantitative 3D analysis of bubble cavities in iron ore pellets by X-ray microtomography. J. Mouzona, I. U. Bhuiyana, F. Forsbergb, S. P. E. Forsmoc, M. Sjödahlb, J. Hedlunda
a Division of Chemical Engineering, Luleå University of Technology, SE-971 87 Luleå, Sweden.
b Division of Experimental Mechanics, Luleå University of Technology, SE-971 87 Luleå, Sweden.
c LKAB, R&D, SE-983 81 Malmberget, Sweden.
Abstract X-ray microtomography was used for quantitative 3D analysis of bubble cavities in iron ore pellets. A suitable threshold for binarization of the X-ray microtomography data was identified by comparing with 2D data obtained by image analysis of scanning electron micrographs. It was shown that X-ray microtomography was efficient for quantitative determination of bubble cavities larger than 10 µm. A total bubble cavity porosity of 2.6% was observed by this method, which compares very well with the 2.8% obtained by image analysis and unfolding of 2D SEM data to 3D data. Keywords: porosity, air bubbles, image analysis, green pellet, X-ray tomography, SEM 1. Introduction Iron ore green pellets are prepared by balling a mixture of iron ore concentrate, water, additives and bentonite. After balling, the green pellets are sintered to achieve sufficient strength needed in the transportation chain and in iron-making. Porosity and pore structure are important features of the green pellets that also will affect the permeability and durability of the final pellets. The pellet must have suitable mass and heat transfer properties for the pelletizing processes and these properties are dependent of the porosity of the pellet [1]. The oxidation time of magnetite pellets during induration is also influenced by the porosity [2]. One particular type of porosity is that emanating from introduction of air bubbles in the pellet during balling. The bubbles may act as crack initiators and deteriorate the compressive strength of the green pellets. The amount of air bubbles has been shown to be related to the amount of the flotation collector reagent employed during separation of apatite from magnetite [3]. Therefore, good tools for characterization of porosity of pellets are of great importance to the iron industry. We have shown that scanning electron microscopy and image analysis can be used for quantitative analysis of bubble cavities in iron ore green pellets [4]. However, this method relies on stereological principles to estimate 3D data from the 2D raw data. One assumption that was made was that the bubble cavities were spherical. Deviation from perfect sphericity might lead to appreciable errors. One technique with the potential to overcome this drawback is X-ray microtomography (XMT). This method is non-destructive and used for imaging of internal structures in materials, based on the density distribution in the material microstructure. The technique directly provides three-dimensional information and has become an important and popular tool in material science [5, 6]. It is a rather straightforward technique, since it does not require any contact with or preparation of the sample. This together with the ability to produce full three dimensional images of the material microstructure have made it popular for material characterization based on image processing. For example, the technique has been applied to various granular materials [7-9], wood [10] and metallic

structures [11]. In geosciences, it has been applied to different types of rock [12-14], minerals [15-19] and iron ore samples [20, 21]. In the present work, we compare 3D data generated by stereological unfolding of 2D data obtained by scanning electron micrographs and 3D data obtained by X-ray microtomography for quantitative determination of bubble cavities in iron ore pellets. 2. Materials and methods 2.1 Micro-balling of iron ore green pellets Green pellets were prepared by micro balling as described in detail by Forsmo [22]. In short, the pellet feed was prepared by mixing 7 kg of magnetite concentrate with 0.5% bentonite in a laboratory mixer (Eirich R02, Germany) and the moisture content was adjusted to 9.4% during mixing. Directly after mixing, seeds with a size of 3.5 to 5 mm were prepared by spreading some of the feed in a 0.8 m drum rotating at a speed of 37 rpm while tempered water was sprayed to initiate growth of agglomerates. In the next step, 150 g of seeds were returned to the drum, now rotating at a speed of 47 rpm. The seeds were grown to green pellets by successively adding feed and spraying water in the drum. The final moisture content was 9.2% and green pellets with a size between 10 to 12.5 mm were selected by screening. The samples were dried overnight at 105°C. 2.3 Recording of scanning electron micrographs The procedure is described in detail elsewhere [4] and is only summarized here. Three dried pellets were mounted in epoxy resin and prepared by polishing. Images were acquired manually by scanning electron microscopy (SEM, JSM-6460lv, JEOL, Japan) with virtually no overlapping and the entire cross-section of each pellet was captured. The acquired images of the entire cross-section of each pellet for each sample were stitched together into a single image and processed to reduce noise. The images were subsequently binarized to convert all pore regions to black and the mineral regions to white. Next step was morphological opening, i.e. an erosion step followed by dilation. A disk-shaped structuring element of 10 pixels in radius was employed. 2.4 Image analysis of scanning electron micrographs and unfolding to 3D data The individual 2D pore profiles were counted and labeled with corresponding area and equivalent diameter of a circle of the same area utilizing image analysis. The 2D data obtained by image analysis were unfolded to three dimensional data using stereology assuming a spherical shape for the pores. In a first step, a log normal function was fitted to the distribution of the pore profile area density and the values below 30 µm were distributed by following a linear extrapolation to zero. The new distribution of the pore profile area density was converted to area numerical density (number of pore profiles per unit area) by dividing each value with the equivalent area of a circle corresponding to the average equivalent diameter of the size class. Subsequently, the Wicksell-Saltykov [23, 24] unfolding procedure was followed to calculate the volume numerical density (number of spherical pores per unit volume). Finally, this set of data was converted to pore volume density by multiplying the volume numerical density by the volume of a sphere derived from the equivalent diameter of each size class and the cumulative curves were plotted. 2.5 X-ray microtomography X-ray microtomography (XMT) is based on the same principles as medical CT. A schematic sketch is shown in Fig.1. A certain number of X-ray projections are acquired at different angles of the scanned object and reconstructed into a density map describing a cross-section of the object. Microtomography is designed for imaging of small samples and the X-ray source and detector are generally fixed while the imaged sample is rotated.
2
X-ray microtomograpy data of a whole iron ore pellet from the same batch used for the SEM investigation was imaged using a commercial Nanotom (GE Sensing & Inspection Technologies GmbH) tomograph. During each scan, a total number of 1440 X-ray projections, 2240 x 2304 pixels in size and 16 bit dynamic range, were captured at equal angles, as the sample made one full rotation. The X-ray tube voltage and current were 110 kV and 110 µA, respectively. The “source to object” and “source to detector” distances were 25.00 mm and 200.00 mm, respectively, resulting in a magnification factor of eight. The tomographic reconstruction was carried out using a cone beam filtered back projection algorithm [25, 26]. The reconstructed volume was of size 1036 x 1052 x 1060 voxels, with an isotropic voxel size of 12.50 µm. It should be noted that the resolution could be increased by investigating a smaller part of the pellet. As for the image analysis method based on SEM images, the image processing was carried out in the Matlab environment, with the software extension “Image processing toolbox”. The reconstructed volume data was imported as an image stack containing 1060 slices (tif-files), each with the dimension 1036 x 1052 pixels. Beam hardening artifacts were corrected and noise filtered, with a 3 x 3 x 3 gaussian filter. Subsequently, a binary representation of the volume data was formed by thresholding. All features in the pore system were recognized and sized using an image processing function in Matlab called “regionprops”. This function is also used to determine the volume of the iron ore pellet itself. From each volume size measurement an equivalent diameter is calculated, which is carried out under the assumption that the pellets and the pores are spherical in shape. Two-dimensional cross-sections for comparison with SEM were generated by rotating the sample around the z-axis in steps of 22.5°. In this way, 8 independent cross-sections were produced. The images were binarized by thresholding and stereological unfolding was also applied to the data in a similar fashion to as used for SEM data, starting with log normal fitting of the total pore profile area density followed by linear extrapolation to zero for the values below 30 µm. Circular and spherical shapes were assumed for the pore profiles and bubble cavities, respectively. The so-called Wicksell matrix of coefficients was used in this case to take into account the fact that the tomography data were not presented as discrete functions as a function of size classes but as continuous functions varying by the resolution of one voxel between two values. In contrast, the so-called Saltykov matrix of coefficients was employed for unfolding the SEM data and by considering the values corresponding to each mid-size class (i.e. the Cruz-Orive approach [24]). 3. Results and discussion Fig.2 shows entire cross-sections of two different pellets of the same batch obtained by stitching of SEM images (a) and X-ray microtomography (b). At the level of magnification, very few differences can be observed. However, by examining enlargement of these images for a horizontal field of view of 573 µm, the difference in resolution between the two methods is evident. The stitched SEM image in Fig.2(c) has a pixel size of 1 µm, while it is 12.5 µm in the image shown in Fig.2(d) obtained by X-ray microtomography. The histograms corresponding to Fig.2(c) and Fig.2(b) are shown in Fig.3(a) and Fig.3(b), respectively. The atomic contrast obtained from the back-scattered detector used for SEM imaging, the resulting histogram shows two well-defined peaks: one corresponding to epoxy (i.e. porosity) at low gray scale values, the other corresponding to iron ore at high gray scale values. Therefore, thresholding is straightforward and the optimum threshold is indicated by the dashed red line in Fig.3(a). However, the histogram of the X-ray microtomography data only exhibit one peak and it corresponds to iron ore. The values corresponding to the fraction of porosity which can be resolved
3
(the largest pores, i.e. the largest bubble cavities) continuously decay towards lower gray scale pixel values. This results in difficulties to determine a suitable threshold for binarization. Nevertheless, the data obtained by both methods is comparable if bubble cavities with diameters between 10 and 164 µm are considered. Fig. 4 shows cumulative total pore profile area density as a function of cavity diameter obtained by SEM and for various threshold values of the X-ray microtomography data, ranging from 48 to 54% of the 256 gray levels. The figure illustrates that X-ray microtomography data is fitted to SEM data by a threshold value of 50% of the gray level. Fig.5(a) shows the pore volume density distributions of the data obtained by X-ray microtomography, unfolding of the X-ray microtomography 2D cross-sections (unfolded 2D XMT) and unfolding of the SEM cross-sections (unfolded 2D SEM). The X-ray microtomography data were obtained for a threshold value of 50% of the gray level. The peak heights were normalized to make comparison possible, since the size classes were different between the techniques. All individual curves show similar peak distribution, which justifies the use of a log normal distribution before unfolding of 2D data. The 2D SEM and 3D XMT data show excellent agreement for large equivalent diameters as expected but differ for smaller values because of the difference in resolution. The corresponding cumulative pore volume density distributions are shown in Fig.5(b). The XMT distributions are slightly shifted towards large pore volume density values because a few large bubble cavities above 300 µm were observed in the pellet investigated by XMT and not in the pellet observed by SEM. Larger total porosity values are obtained by unfolding data from SEM images, since it picks up smaller bubble cavities thanks to the better resolution. All in all, XMT was found to be relatively efficient to gain quantitative data about bubble cavities. A total bubble cavity porosity of 2.6% was observed by this method, which compares very well with the 2.8% obtained by stereological unfolding of SEM images, especially when considering that some of the smallest cavities are not detected by XMT. Moreover, the median diameter, d50, of bubble cavities was found to be 112 µm and 102 µm by XMT and SEM, respectively. Again, the agreement is very good, especially when considering that a few larger cavities were detected by XMT and not by SEM. Unfolding of the two-dimensional data obtained by X-ray tomography (unfolded 2D XMT) agrees relatively well with the three-dimensional data directly obtained by this technique (3D XMT). The difference in total porosity is only due to the slight discrepancies in the pore volume distribution presented in Fig.5(a), which is probably because the bubble cavities are not perfectly spherically shaped. It is noteworthy that the calibration method of the XMT data proposed herein would even be more efficient if performed on a large numbers of pellets and if both techniques were applied to the same pellets, which is possible since XMT is non-destructive. Finally, this approach might also be used to correct stereological unfolding for non-ideal sphericity by calibrating the green curve by the black curve in Fig.5(b). 4. Conclusions A commercial X-ray microtomography instrument was successfully used for quantitative 3D analysis of bubble cavities in iron ore pellets. A threshold value for binarization of the X-ray microtomography data was identified by comparing with 2D data obtained by image analysis of scanning electron micrographs. X-ray microtomography was efficient for quantitative determination of bubble cavities larger than 10 µm. The resolution of the instrument can be increased by analyzing
4

a smaller part of the sample. A total bubble cavity porosity of 2.6% was observed by this method, which compares very well with the 2.8% obtained by image analysis and unfolding of 2D SEM data to 3D data. The median diameter of the bubble cavities determined by X-ray microtomography is very similar to that determined by SEM. Acknowledgements Vinnova, LKAB and New Boliden are acknowledged for financial support of the project through the Agricola Research Center - Multi-component Mineral System (ARC-MMS) program at Luleå University of Technology, Sweden. This is a CAMM publication. Furthermore, the authors would like to thank Dr André Egbert and co-workers at Phoenix X-ray/ GE Sensing & Inspection Technologies GmbH for carrying out the microtomography scans and supplying us with reconstructions of the samples.
5
References 1. Sundarmurti, N. S., and Rao, V., Thermal conductivity and diffusivity of iron ore pellet
having low porosity. ISIJ international, 2002. 42(7): p. 800-802. 2. Forsmo, S. P. E., Forsmo, S. E., Samskog, P. O., and Bjorkman, B. M. T., Mechanisms in
oxidation and sintering of magnetite iron ore green pellets. Powder technology, 2008. 183(2): p. 247-259.
3. Forsmo, S. P. E., Forsmo, S. E., Bjoerkman, B. M. T., and Samskog, P. O., Studies on the influence of a flotation collector reagent on iron ore green pellet properties. Powder technology, 2008. 182(3): p. 444-452.
4. Bhuiyan, I. U., Mouzon, J., Forsmo, S. P. E., and J. Hedlund, Quantitative image analysis of bubble cavities in iron ore green pellets. Manuscript submitted to Powder Technology.
5. Salvo, L., Cloetens, P., Maire, E., Zabler, S., Blandin, J. J., Buffiere, J. Y., Ludwig, W., Boller, E., Bellet, D., and Josserond, C., X-ray micro-tomography an attractive characterisation technique in materials science. Nuclear Instruments & Methods in Physics Research Section B-Beam Interactions with Materials and Atoms, 2003. 200: p. 273-286.
6. Stock, S. R., Recent advances in X-ray microtomography applied to materials. International Materials Reviews, 2008. 53(3): p. 129-181.
7. Seidler, G. T., Martinez, G., Seeley, L. H., Kim, K. H., Behne, E. A., and Zaranek, S., Granule-by-granule reconstruction of a sandpile from x-ray microtomography data. Physical Review E, 2000. 62(6): p. 8175-8181.
8. Forsberg, F., and Siviour, C. R., 3D deformation and strain analysis in compacted sugar using X-ray microtomography and digital volume correlation. Measurement science & technology, 2009. 20: p. 095703.
9. Richard, P., Philippe, P., Barbe, F., Bourles, S., Thibault, X., and Bideau, D., Analysis by X-ray microtomography of a granular packing undergoing compaction. Physical Review E, 2003. 68(2): p. 4.
10. Steppe, K., Cnudde, V., Girard, C., Lemeur, R., Cnudde, J. P., and Jacobs, P., Use of X-ray computed microtomography for non-invasive determination of wood anatomical characteristics. Journal of Structural Biology, 2004. 148(1): p. 11-21.
11. Elmoutaouakkil, A., 2D and 3D characterization of metal foams using x-ray tomography. Advanced engineering materials, 2002. 4(10): p. 803.
12. Bugani, S., Camaiti, M., Luciano, M., Casteele, E. V., and Janssens, K., Investigation on porosity changes of Lecce stone due to conservation treatments by means of x-ray nano- and improved micro-computed tomography: preliminary results. X-Ray Spectrometry, 2007. 36(5): p. 316-320.
13. Prodanovic, M., Lindquist, W. B., and Seright, R. S., 3D microtomographic study of fluid displacement in rock cores. in Computational Methods in Water Resources XV Conference. 2004.
14. Appoloni, C. R., Fernandes, C. P., and Rodrigues, C. R. O., X-ray microtomography study of a sandstone reservoir rock. Nuclear instruments & methods in physics research. Section B, Beam interactions with materials and atoms, 2007. 580(1): p. 629.
15. Lin, C. L., and Miller, J. D., Cone beam X-ray microtomography for three-dimensional liberation analysis in the 21st century. International Journal of Mineral Processing, 1996. 47(1-2): p. 61-73.
16. Van Geet, M., Volckaert, G., and Roels, S., The use of microfocus X-ray computed tomography in characterising the hydration of a clay pellet/powder mixture. Applied Clay Science, 2005. 29(2): p. 73-87.
17. Lin, C. L., and Miller, J. D., Cone beam X-ray microtomography - a new facility for three-dimensional analysis of multiphase materials. Minerals & Metallurgical Processing, 2002. 19(2): p. 65-71.
6
18. Jerram, D. A., and Higgins, M. D., 3D analysis of rock textures: Quantifying igneous microstructures. Elements, 2007. 3(4): p. 239-245.
19. Jerram, D. A., Mock, A., Davis, G. R., Field, M., and Brown, R. J., 3D crystal size distributions: A case study on quantifying olivine populations in kimberlites. Lithos, 2009. 112: p. 223-235.
20. Wu, A. X., Yang, B. H., Xi, Y., and Jiang, H. C., Pore structure of ore granular media by computerized tomography image processing. Journal of Central South University of Technology, 2007. 14(2): p. 220-224.
21. Shatokha, V., Korobeynikov, I., Maire, E., Grémillard, L., and Adrien, J., Iron ore sinter porosity characterisation with application of 3D X-ray tomography. Ironmaking & Steelmaking, 2010. 37(5): p. 313-319.
22. Forsmo, S. P. E., Influence of green pellet properties on pelletizing of magnetite iron ore, Ph.D. Thesis, in Department of Chemical Engineering and Geosciences. 2007, Luleå University of Technology, Luleå, Sweden. p. 106.
23. Wicksell, S. D., The Corpuscle Problem: A Mathematical Study of a Biometric Problem. Biometrika 1925. Vol. 17(1/2 ): p. 84-99.
24. Weibel, E. R., Stereological Methods: Theoretical foundations. Vol. 2. 1980, London: Academic Press. 340 pp.
25. Kak, A. C., and Slaney, M., Principles of computerized tomographic imaging. 1988, New York: IEEE Press. 344 pp.
26. Feldkamp, L. A., Davis, L. C., and Kress, J. W., Practical cone-beam algorithm. J. Opt. Soc. Am. A 1984. 1(6): p. 612-619.
7

List of figures Fig. 1. Schematic of the X-ray microtomography experimental setup. Fig. 2. Iron ore pellet cross-section: (a) by stitching of SEM images; (b) X-ray microtomography. The scale bar in each image corresponds to 1 mm. (c) enlargement of (a) and (d) enlargement of (b) with a horizontal field of view of 573 µm. Fig. 3. Image histogram of: (a) the SEM image in Fig.2(c); (b) the pellet cross-section obtained by X-ray microtomography in Fig.2(b). Fig. 4. Comparison of the cumulative total pore profile area density curves obtained by image analysis of SEM images and binarization of the microtomography cross-sections with different threshold values. Fig. 5. Comparison of the data obtained by X-ray microtomography (3D XMT), unfolding of the X-ray microtomography 2D cross-sections (unfolded 2D XMT) and unfolding of the SEM cross-sections (unfolded 2D SEM): (a) pore volume density; (b) cumulative pore volume density. The XMT data were obtained for a threshold value of 50% of the gray level.
8

Fig. 1. Schematic of the X-ray microtomography experimental setup.
9

(d)
(b)(a)
(c) (d)(d)
(b)(b)(a)(a)
(c)(c)
Fig. 2. Iron ore pellet cross-section: (a) by stitching of SEM images; (b) X-ray microtomography. The scale bar in each image corresponds to 1 mm. (c) enlargement of (a) and (d) enlargement of (b) with a horizontal field of view of 573 µm.
10
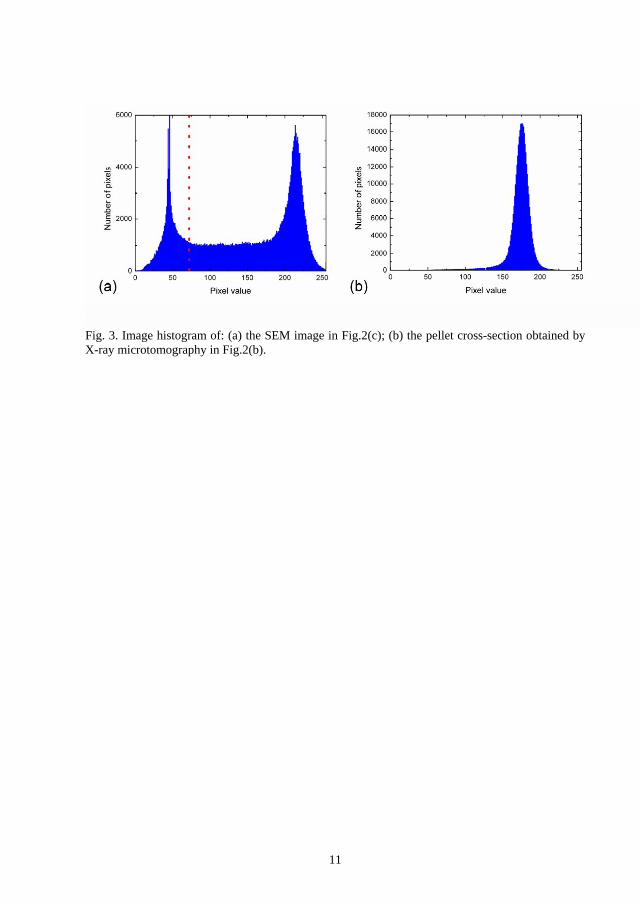
Fig. 3. Image histogram of: (a) the SEM image in Fig.2(c); (b) the pellet cross-section obtained by X-ray microtomography in Fig.2(b).
11

Fig. 4. Comparison of the cumulative total pore profile area density curves obtained by image analysis of SEM images and binarization of the microtomography cross-sections with different threshold values.
12
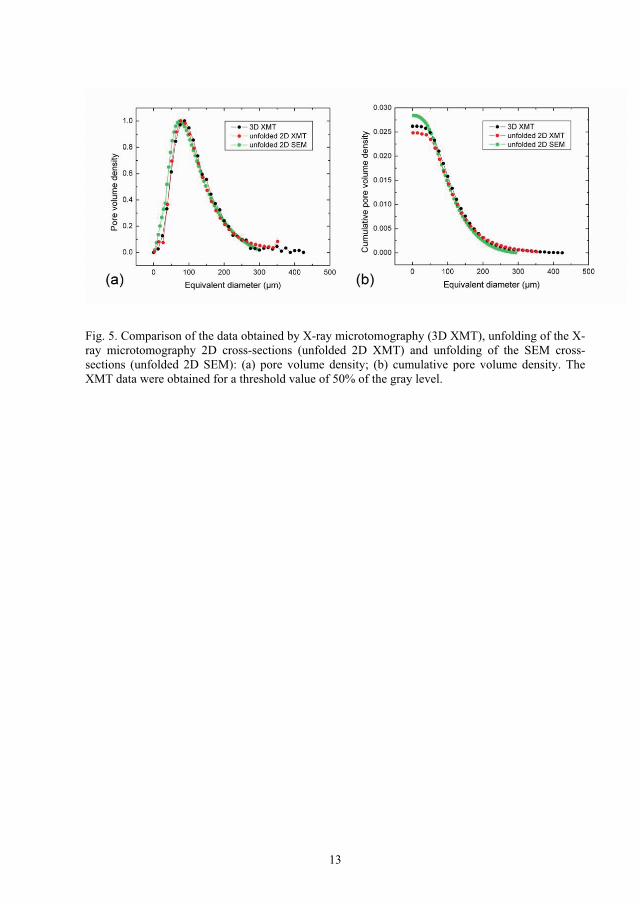
13
Fig. 5. Comparison of the data obtained by X-ray microtomography (3D XMT), unfolding of the X-ray microtomography 2D cross-sections (unfolded 2D XMT) and unfolding of the SEM cross-sections (unfolded 2D SEM): (a) pore volume density; (b) cumulative pore volume density. The XMT data were obtained for a threshold value of 50% of the gray level.


