division of costs in graphs and figures
TRANSCRIPT

Division of Costs in Graphs and Figures
This slideshow includes central information on the financing and division of costs of the earnings-related pension system 3.3.2017
2FINNISH CENTRE FOR PENSIONS
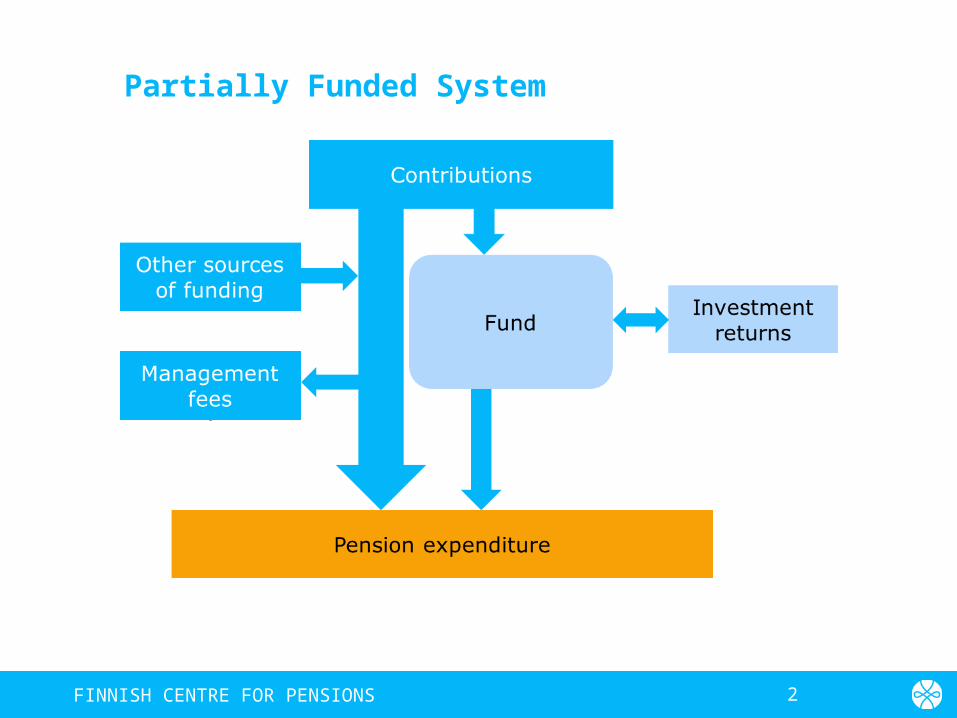
Partially Funded System

3FINNISH CENTRE FOR PENSIONS
Partial Funding of Pensions Under the Employees Pensions Act and the Seafarers’ Pensions Act

4FINNISH CENTRE FOR PENSIONS
Financing of Pensions in Finland

5FINNISH CENTRE FOR PENSIONS
Last pension provider pays all pension components

6FINNISH CENTRE FOR PENSIONS
Division of Costs of Earnings-related Pensions

7FINNISH CENTRE FOR PENSIONS
Money Flow of Earnings-related Pensions in 2015, EUR billion

8FINNISH CENTRE FOR PENSIONS
TyEL and MEL Pensions in Payment in 2001–2015

9FINNISH CENTRE FOR PENSIONS
Pension Expenditure Under YEL and State’s Share in 1990–2015
10FINNISH CENTRE FOR PENSIONS
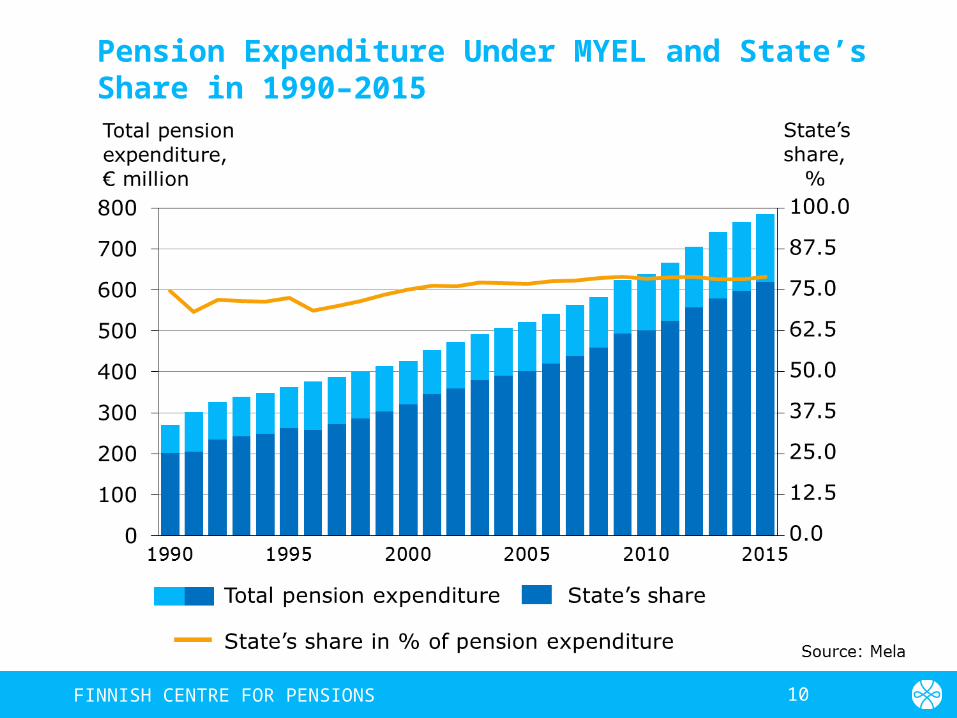
Pension Expenditure Under MYEL and State’s Share in 1990–2015

11FINNISH CENTRE FOR PENSIONS
Pension Components Paid Based on Unpaid Periods in 2006–2015

12FINNISH CENTRE FOR PENSIONS
Benefits Paid Based on VEKL in 2006–2015
13FINNISH CENTRE FOR PENSIONS
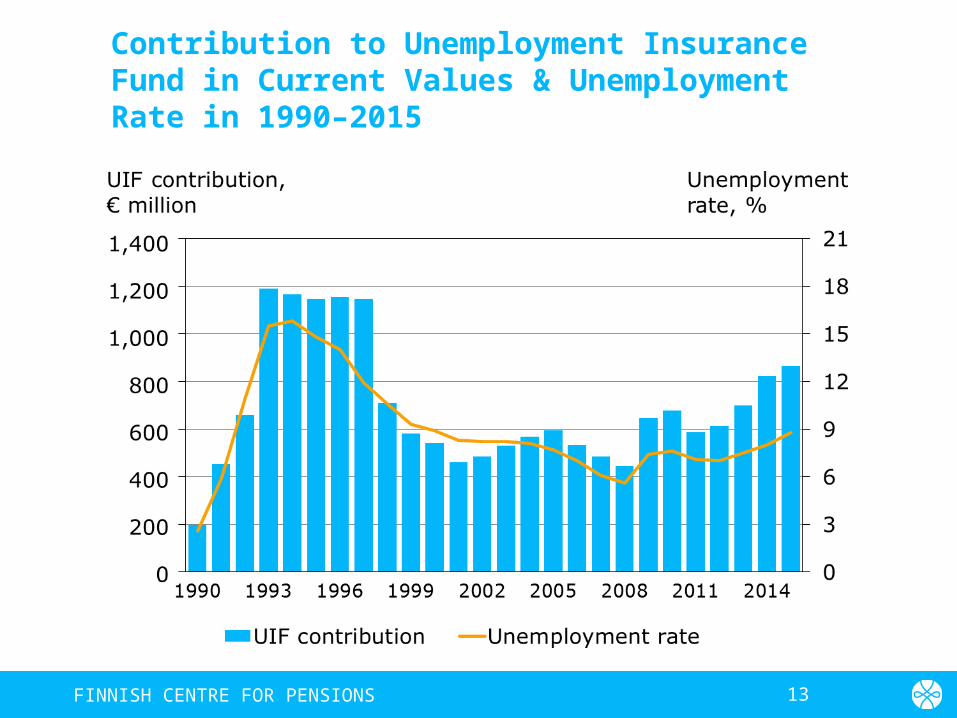
Contribution to Unemployment Insurance Fund in Current Values & Unemployment Rate in 1990–2015

14FINNISH CENTRE FOR PENSIONS
Pension Assets Under TyEL And MEL by Division of Costs 2007–2015, per 31. Dec.

15FINNISH CENTRE FOR PENSIONS
TyEL and MEL Insurance Contribution per Type of Pension Insurance Provider in 2017

16FINNISH CENTRE FOR PENSIONS
Earnings-related pension contribution rates in 2017

17FINNISH CENTRE FOR PENSIONS
Average TyEL Contribution Components of Employer Insured in an Earnings-related Pension Insurance Company in 2017

18FINNISH CENTRE FOR PENSIONS
Average TEL-/TyEL contribution in 1962–2017