division of medicaid office of the governor state of ... · state of mississippi . drug utilization...
TRANSCRIPT

Division of Medicaid Office of the Governor
State of Mississippi Drug Utilization Review (DUR) Board Meeting
January 21, 2016 at 2:00pm
Woolfolk Building, Room 117
Jackson, MS
Prepared by:

Drug Utilization Review Board
Allison Bell, Pharm.D. University of MS School of Pharmacy 2500 North State St. Jackson, MS 39216 Term Expires: June 30, 2018
Bobby Proctor, M.D. Laurel Family Clinic 1440 Jefferson St. Laurel, MS 39440 Term Expires: June 30, 2016
James R. “Beau” Cox, Pharm.D. (Co-Chair) Tara Pharmacy 110 Metroplex Blvd., Suite H Pearl, MS 39208 Term Expires: June 30, 2016
Janet Ricks, D.O. UMMC, Family Medicine 2500 North State Street Jackson, MS 39216 Term Expires: June 30, 2018
Logan Davis, Pharm.D., MBA Vital Care, Inc. 1170 NE Industrial Park Rd Meridian, MS 39301 Term Expires: June 30, 2016
Sue H. Simmons, M.D. Maben Medical Clinic 49 Turner St. Maben, MS 39750 Term Expires: June 30, 2018
Antoinette M. Hubble, M.D. McComb Children's Clinic 300 Rawls Dr. Ste 100 McComb, MS 39648 Term Expires: June 30, 2017
Dennis Smith, R.Ph. (Chair) Polk's Discount Pharmacy 1031 Star Rd Brandon, MS 39042 Term Expires: June 30, 2017
Cherise McIntosh, Pharm.D. UMC Dept of Pharmacy 2500 North State St. Jackson, MS 39216 Term Expires: June 30, 2017
Cynthia Undesser, M.D. MS Children's Home Services 402 Wesley Ave Jackson, MS 39202 Term Expires: June 30, 2017
Jason Parham, M.D. UMMC Department of Medicine 2500 North State Street Jackson, MS 39216 Term Expires: June 30, 2016
Pearl Wales, Pharm.D. Be Jay PE Pharmacy 1668 West Peace Street Canton, MS 39047 Term Expires: June 30, 2018
2016 DUR Board Meeting Dates
January 21, 2016 July 21, 2016 April 14, 2016 September 29, 2016
Mississippi Division of Medicaid DUR Board Packet (Ver:3) – January 2016 - Page 1

As with any analysis, great efforts are made to ensure that the information reported in this document is accurate. The most recent administrative claims data available are being used at the time the reports are generated, which includes the most recent adjudication history. As a result, values may vary between reporting periods and between DUR Board meetings, reflecting updated reversals and claims adjustments.
Unless otherwise indicated, all MS-DUR analyses are conducted for the entire Mississippi Medicaid program including beneficiaries receiving services through the Medicaid fee-for-service (FFS) and the two Mississippi Medicaid Coordinated Care Organizations (CCOs). When dollar figures are reported, the reported dollar figures represent reimbursement amounts paid to providers and are not representative of final Medicaid costs after rebates. Any reported enrollment data presented are unofficial and are only for general information purposes for the DUR Board.
Please refer to the Mississippi Division of Medicaid website for the current official universal preferred drug list (PDL).
http://www.medicaid.ms.gov/providers/pharmacy/preferred-drug-list/
Mississippi Division of Medicaid DUR Board Packet (Ver:3) – January 2016 - Page 2

MISSISSIPPI DIVISION OF MEDICAID OFFICE OF THE GOVERNOR
DRUG UTILIZATION REVIEW BOARD AGENDA
January 21, 2016
Welcome Dennis Smith, R.Ph. (Chair)
Old Business Dennis Smith, R.Ph. (Chair) Approval of November 2015 Meeting Minutes page 5
Resource Utilization Review (Hardwick) Enrollment Statistics page 11 Pharmacy Utilization Statistics page 11 Top 10 Drug Categories by Amount Paid page 12 Top 10 Drug Categories by Number of Claims page 13 Top 10 Generic Molecules by Change in Amount Paid page 14 Top 10 Generic Molecules by Change in Amount Paid Excluding Factor Products page 16 Top 10 Generic Molecules by Change in Number of Claims page 18 Top 15 Products by Change in Amount Paid Per Prescription page 21 Top 15 Products by Change in Amount Paid Per Prescription Excluding Factor Products page 23
Pharmacy Program Update Judith P. Clark, R.Ph. Sara (Cindy) Noble, Pharm.D., M.Ph.
Feedback and Discussion from the Board
New Business Provider Feedback and Discussion
Hemophilia and Pain Management – Dr. Spencer Sullivan, Assistant Professor of Pediatrics and Medicine Division of Pediatric Hematology/Oncology at UMC
Special Analysis Projects Utilization of Tramadol in Children Age 17 and Younger (Hardwick) page 26 Metabolic Monitoring for Children Taking Antipsychotics (Banahan) page 31 High Morphine Equivalent Daily Dosing (MEDD) and Doctor Shopping Educational Initiatives (Banahan) page 37 CDC Proposed Guidelines for Prescribing of Opioids for Chronic Pain and Planned Review of Opioid Use Related DUR Actions (Banahan) page 41 CMS Medicaid Program Integrity Education (Banahan) page 48
Appendices A. California Educational Report: Antipsychotic Use in Children page 51 B. CMS bulletin on changes to Core Measure Set page 58 C. California Education Report: Morphine Equivalent Daily Dosing to Prevent Opioid Overuse page 61 D. CDC Guideline for Prescribing Opioids for Chronic Pain - List of Recommendations page 69 E. Article about Oklahoma Medicaid Actions to Control Opioid Use page 72 Next Meeting Information Dennis Smith, R.Ph. (Chair)
Mississippi Division of Medicaid DUR Board Packet (Ver:3) – January 2016 - Page 3

DUR Board Meeting Minutes
Mississippi Division of Medicaid DUR Board Packet (Ver:3) – January 2016 - Page 4

MISSISSIPPI DIVISION OF MEDICAID DRUG UTILIZATION REVIEW (DUR) BOARD
MINUTES OF THE November 5, 2015 MEETING
DUR Board Members: Feb
2014 May 2014
Aug 2014
Nov 2014
Feb 2015
May 2015
Aug 2015
Nov 2015
Allison Bell, Pharm.D. James R. “Beau” Cox, Pharm.D. Logan Davis, Pharm.D. Antoinette M. Hubble, M.D. Cherise McIntosh, Pharm.D. Jason Parham, M.D. Bobby Proctor, M.D. Janet Ricks, D.O. Sue Simmons, M.D. Dennis Smith, R.Ph. (Chair) Cynthia Undesser, M.D. Pearl Wales, Pharm.D.
TOTAL PRESENT 12 7 11 6 9 10 9 10 Dr. McIntosh joined the meeting at 2:13 during old business discussion. Also Present:
DOM Staff: Judith Clark, R.Ph., Director, DOM Office of Pharmacy; Terri Kirby, R.Ph., DOM Clinical Pharmacist; Cindy Noble, Pharm.D., MPH, DOM DUR Coordinator;
MS-DUR Staff: Ben Banahan, Ph.D., MS-DUR Project Director; Shannon Hardwick, R.Ph., MS-DUR Clinical Director
Xerox Staff: Leslie Leon, Pharm.D. Coordinated Care Organization Staff: Conor Smith, R.Ph., Magnolia Michael Todaro, Pharm D., Magnolia
Visitors: Andrea McNeal, DOM Program Integrity; Beth Roberts, DOM Program Integrity; Tamiko Young, DOM Program Integrity; Carmen Robinson, DOM Program Integrity; Bernadette Parks, DOM Program Integrity; Sajani Bast, AstraZeneca; Jeff Knappen, Allergan; Rachel Thomas, Otsuka Call to Order: Mr. Dennis Smith, Chairman of the Board, called the meeting to order at 2:00 pm. Introduction of New DUR Board Members Ms. Judith Clark welcomed new members and conducted introductions.
Mississippi Division of Medicaid DUR Board Packet (Ver:3) – January 2016 - Page 5

Old Business: The motion for approval of the minutes was made by Dr. Hubble and seconded by Dr. Proctor received unanimous approval. Dr. Banahan provided feedback to the board about actions taken from previous board recommendations. During the August meeting, MS-DUR presented information on Synagis utilization during the 2014-15 season and indicated that MS-DUR was working on an outcomes based report. Due to the small sample size and limitations in identifying at risk children using claims data it was determined that an outcomes analysis could not be completed. In September 2015 the DUR Board recommended that the Pharmacy &Therapeutics (P&T) Committee change triazolam and methadone to non-preferred status on the MS DOM preferred drug list. The P&T Committee approved this recommendation and MS-DUR conducted an educational mailing to notify prescribers of the change. Dr. Banahan reviewed other educational mailings currently in progress that address high morphine equivalent doses and doctor shopping, adherence to chronic medications, metabolic monitoring related to antipsychotic use in children, and ADHD treatment follow-up care in children. The recent update to the Cough and Cold Quick List was mailed to high utilization prescribers of these products. Dr. Noble updated the board on the clinical edit and the manual prior authorization (PA) process being implemented when a third antipsychotic is prescribed. Resource Utilization Review: Dr. Banahan stated that the analysis of utilization among Fee-For-Service (FFS) and the two Coordinated Care Organizations (CCOs) noted no major exceptions. The Board was asked for recommendations regarding a value amount to use for high cost prescriptions in order to separate these high cost products from other products in the resource reports. After discussion, Mr. Smith recommended a cut off of $1500 per claim. Ms. Clark asked that MS-DUR begin with carving out hemophilia factor and to add the number of claims and number of unique beneficiaries in the top product reports. Pharmacy Program Update: Ms. Clark suggested that the DUR Board consider adopting a procedure which would allow for the co-chair to be mentored by the current DUR Board chair. This would allow for succession planning provided that the term limits of the co-chair allow this member’s participation after the next election. Dr. McIntosh made a motion that Mr. Smith remain as chair and Dr. Wales be co-chair. The motion was seconded by Dr. Hubble and passed unanimously. Ms. Clark reviewed major items related to pharmacy that will be included in the December Provider Bulletin. A major update in the Universal Preferred Drug List (UPDL) will become effective January 1, 2016. Additionally, Division of Medicaid (DOM) will add varicella vaccine to the adult vaccines covered through pharmacy services on January 1, 2016. Feedback and Discussion from the Board Mr. Smith asked that MS-DUR consider a review of respiratory care agents and impact due to guideline changes for short-acting and long-acting beta agonists that occurred in April 2015. Dr. Hubble reported it has been difficult getting Pulmicort for infants less than 12 months of age since it is not an FDA approved indication. She noted that it is the only agent with nebulizer. Ms. Clark asked the board about problems with opiate use and the need for DOM to reconsider current parameters and recommendations for “lock-in” program regarding beneficiaries utilizing multiple pharmacies and
Mississippi Division of Medicaid DUR Board Packet (Ver:3) – January 2016 - Page 6

prescribers for opiates. Drs. Proctor and Rick reported that pain management contracts require patients to use only one pharmacy except in emergency situations. It was reported that pain management clinics monitor the use of multiple pharmacies closely. Several members of the Board commented that five pharmacies was too many for patients to be allowed to use for opiates prior to being “locked-in”. Members from the DUR Board expressed a strong belief that use of one pharmacy was sufficient for beneficiaries in lock-in for suspicious use of opiates, with the understanding that special circumstances will require the use of a second pharmacy occasionally. New Business: Jadenu / Exjade Utilization and Costs Dr. Banahan provided an overview of the MS-DUR analysis of Jadenu and Exjade utilization and costs. Results indicated that utilization of deferasirox has increased significantly with the introduction of Jadenu but there was no indication of inappropriate use. The Board concurred with the recommendation that MS-DUR continue to monitor use of these products to see where utilization levels off but no action was needed at this time. Daraprim Price Increase and Utilization Dr. Banahan reported that when Turing Pharmaceuticals bought Daraprim from Impax Laboratories in August 2015, the company immediately raised the price of one pill from $13.50 to $750. As a result of this action, MS-DUR conducted an analysis of Daraprim utilization and the estimated impact of the price increase to DOM. Results indicated that current utilization is appropriate and although the price increase will result in a major increase in the amount DOM pays to pharmacies for Daraprim therapy, the net impact on DOM may be an actual reduction in net cost due to mandatory Federal rebate guidelines. The Board agreed that no actions were needed at this time. Changes in Mental Health Medication Use Among Children Transitioning From Fee-for-Service (FFS) to Coordinated Care Organizations (CCOs) Dr. Banahan informed the board that during the August 2015 P&T Committee meeting a committee member expressed concerns that children were not being allowed to remain on multiple stimulants when transitioning to coordinated care organizations (CCOs). Results of an analysis conducted by MS-DUR indicated that no systematic changes were occurring in the number of agents children were taking before and after transitioning to CCOs. Exceptions Monitoring Criteria Recommendations Dr. Banahan introduced the six new exceptions monitoring criteria that were being proposed. All criteria are based on recent warnings or updates from the Food and Drug Administration.
1. Concomitant administration of Stribild (elvitegravir, cobicistat, emtricitabine, tenofovir disoproxil fumarate) with anticonvulsant medications - carbamazepine, phenobarbital, and phenytoin.
2. Concomitant administration of Etopophos (etoposide phosphate) with antiepileptic medications.
3. Use of Daytrana (methylphenidate transdermal system) in patients with chemical leukoderma. 4. Co-administration of ACE inhibitors and mTOR inhibitors leading to increased risk of
angioedema. 5. Concomitant use of PDE5 Inhibitors and mTOR inhibitors leading to increased risk of
hypotension. 6. Proglycem (diazoxide) Capsules and Oral Suspension use in neonates and infants.
Mississippi Division of Medicaid DUR Board Packet (Ver:3) – January 2016 - Page 7

Dr. Hubble made a motion that the six new exceptions be approved as a group. The motion was seconded by Dr. Proctor and passed unanimously. Next Meeting Information: Ms. Clark explained that the 2016 schedule for DUR meetings is somewhat different than in the past years due to DOM’s desire for the DUR meeting to be conducted prior to the P&T Committee. This would allow DUR Board recommendations to be shared with the P&T Committee during the same quarter. Mr. Smith announced that the next meeting date is January 21, 2016 at 2:00p.m. He thanked everyone for their attendance at the DUR Board meeting. Mr. Smith stated that there was good discussion surrounding the agenda and wished everyone a happy holiday. The meeting adjourned at 3:25 pm. Submitted, Evidence-Based DUR Initiative, MS-DUR
Mississippi Division of Medicaid DUR Board Packet (Ver:3) – January 2016 - Page 8

PUBLIC MEETING NOTICES
Mississippi Division of Medicaid DUR Board Packet (Ver:3) – January 2016 - Page 9

Resource Utilizaton Review
Mississippi Division of Medicaid DUR Board Packet (Ver:3) – January 2016 - Page 10
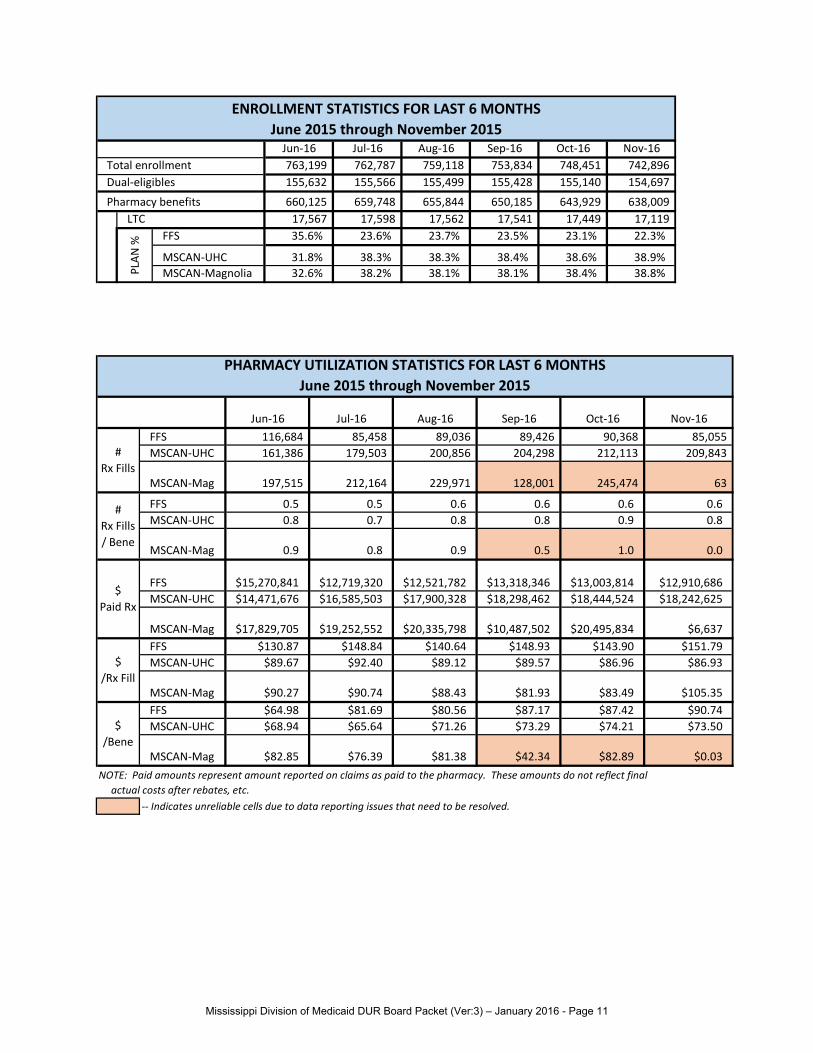
Jun-16 Jul-16 Aug-16 Sep-16 Oct-16 Nov-16763,199 762,787 759,118 753,834 748,451 742,896 155,632 155,566 155,499 155,428 155,140 154,697
660,125 659,748 655,844 650,185 643,929 638,009 17,567 17,598 17,562 17,541 17,449 17,119
FFS 35.6% 23.6% 23.7% 23.5% 23.1% 22.3%
MSCAN-UHC 31.8% 38.3% 38.3% 38.4% 38.6% 38.9%MSCAN-Magnolia 32.6% 38.2% 38.1% 38.1% 38.4% 38.8%
ENROLLMENT STATISTICS FOR LAST 6 MONTHSJune 2015 through November 2015
PLAN
%
Total enrollmentDual-eligibles
Pharmacy benefitsLTC
Jun-16 Jul-16 Aug-16 Sep-16 Oct-16 Nov-16FFS 116,684 85,458 89,036 89,426 90,368 85,055 MSCAN-UHC 161,386 179,503 200,856 204,298 212,113 209,843
MSCAN-Mag 197,515 212,164 229,971 128,001 245,474 63
FFS 0.5 0.5 0.6 0.6 0.6 0.6MSCAN-UHC 0.8 0.7 0.8 0.8 0.9 0.8
MSCAN-Mag 0.9 0.8 0.9 0.5 1.0 0.0
FFS $15,270,841 $12,719,320 $12,521,782 $13,318,346 $13,003,814 $12,910,686MSCAN-UHC $14,471,676 $16,585,503 $17,900,328 $18,298,462 $18,444,524 $18,242,625
MSCAN-Mag $17,829,705 $19,252,552 $20,335,798 $10,487,502 $20,495,834 $6,637FFS $130.87 $148.84 $140.64 $148.93 $143.90 $151.79MSCAN-UHC $89.67 $92.40 $89.12 $89.57 $86.96 $86.93
MSCAN-Mag $90.27 $90.74 $88.43 $81.93 $83.49 $105.35FFS $64.98 $81.69 $80.56 $87.17 $87.42 $90.74MSCAN-UHC $68.94 $65.64 $71.26 $73.29 $74.21 $73.50
MSCAN-Mag $82.85 $76.39 $81.38 $42.34 $82.89 $0.03
-- Indicates unreliable cells due to data reporting issues that need to be resolved.
NOTE: Paid amounts represent amount reported on claims as paid to the pharmacy. These amounts do not reflect final actual costs after rebates, etc.
# Rx Fills
# Rx Fills / Bene
$ Paid Rx
$/Rx Fill
$/Bene
PHARMACY UTILIZATION STATISTICS FOR LAST 6 MONTHSJune 2015 through November 2015
Mississippi Division of Medicaid DUR Board Packet (Ver:3) – January 2016 - Page 11
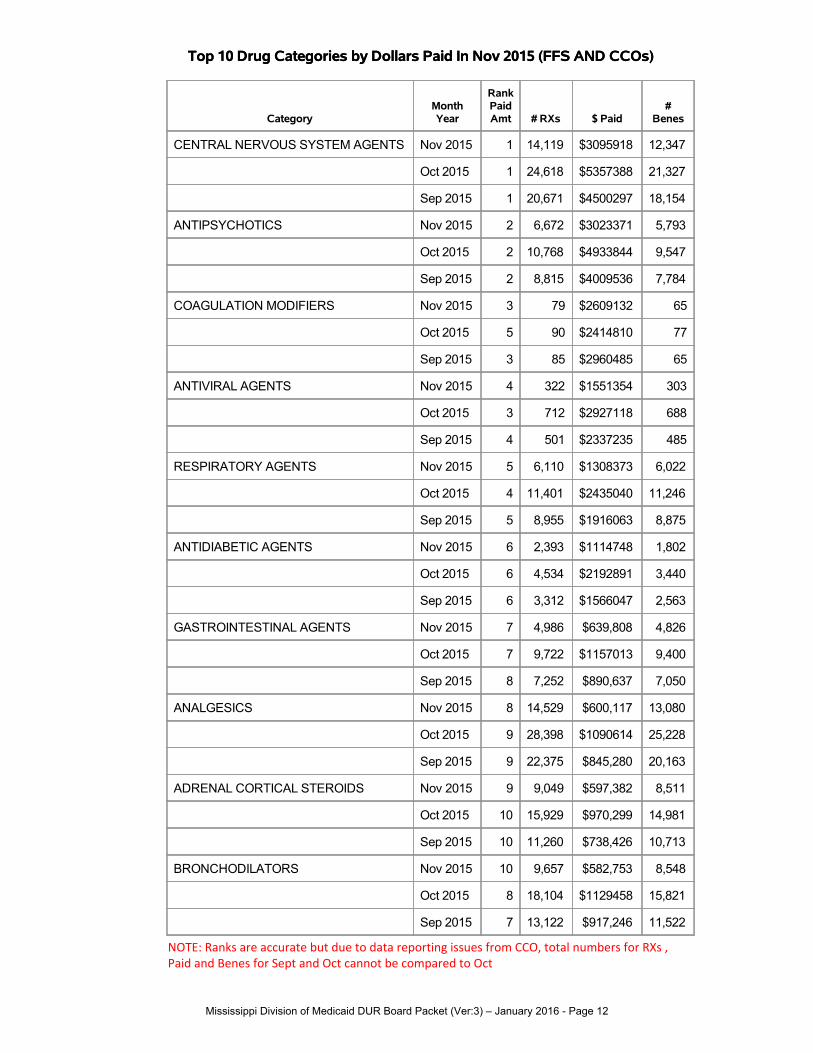
Top 10 Drug Categories by Dollars Paid In Nov 2015 (FFS AND CCOs)Top 10 Drug Categories by Dollars Paid In Nov 2015 (FFS AND CCOs)
CategoryMonthYear
RankPaidAmt # RXs $ Paid
#Benes
CENTRAL NERVOUS SYSTEM AGENTS Nov 2015 1 14,119 $3095918 12,347
Oct 2015 1 24,618 $5357388 21,327
Sep 2015 1 20,671 $4500297 18,154
ANTIPSYCHOTICS Nov 2015 2 6,672 $3023371 5,793
Oct 2015 2 10,768 $4933844 9,547
Sep 2015 2 8,815 $4009536 7,784
COAGULATION MODIFIERS Nov 2015 3 79 $2609132 65
Oct 2015 5 90 $2414810 77
Sep 2015 3 85 $2960485 65
ANTIVIRAL AGENTS Nov 2015 4 322 $1551354 303
Oct 2015 3 712 $2927118 688
Sep 2015 4 501 $2337235 485
RESPIRATORY AGENTS Nov 2015 5 6,110 $1308373 6,022
Oct 2015 4 11,401 $2435040 11,246
Sep 2015 5 8,955 $1916063 8,875
ANTIDIABETIC AGENTS Nov 2015 6 2,393 $1114748 1,802
Oct 2015 6 4,534 $2192891 3,440
Sep 2015 6 3,312 $1566047 2,563
GASTROINTESTINAL AGENTS Nov 2015 7 4,986 $639,808 4,826
Oct 2015 7 9,722 $1157013 9,400
Sep 2015 8 7,252 $890,637 7,050
ANALGESICS Nov 2015 8 14,529 $600,117 13,080
Oct 2015 9 28,398 $1090614 25,228
Sep 2015 9 22,375 $845,280 20,163
ADRENAL CORTICAL STEROIDS Nov 2015 9 9,049 $597,382 8,511
Oct 2015 10 15,929 $970,299 14,981
Sep 2015 10 11,260 $738,426 10,713
BRONCHODILATORS Nov 2015 10 9,657 $582,753 8,548
Oct 2015 8 18,104 $1129458 15,821
Sep 2015 7 13,122 $917,246 11,522
NOTE: Ranks are accurate but due to data reporting issues from CCO, total numbers for RXs , Paid and Benes for Sept and Oct cannot be compared to Oct
Mississippi Division of Medicaid DUR Board Packet (Ver:3) – January 2016 - Page 12

Top 10 Drug Categories by Number of Claims In Nov 2015 (FFS AND CCOs)Top 10 Drug Categories by Number of Claims In Nov 2015 (FFS AND CCOs)
CategoryMonthYear
RankVolume # RXs $ Paid
#Benes
ANALGESICS Nov 2015 1 14,529 $600,117 13,080
Oct 2015 1 28,398 $1090614 25,228
Sep 2015 1 22,375 $845,280 20,163
CENTRAL NERVOUS SYSTEM AGENTS Nov 2015 2 14,119 $3095918 12,347
Oct 2015 2 24,618 $5357388 21,327
Sep 2015 2 20,671 $4500297 18,154
RESPIRATORY AGENTS Nov 2015 3 10,912 $231,957 10,490
Oct 2015 3 21,261 $445,479 20,308
Sep 2015 3 16,508 $347,151 15,923
PENICILLINS Nov 2015 4 10,636 $111,577 10,411
Oct 2015 4 18,821 $198,021 18,452
Sep 2015 4 14,013 $145,459 13,804
BRONCHODILATORS Nov 2015 5 9,657 $582,753 8,548
Oct 2015 5 18,104 $1129458 15,821
Sep 2015 5 13,122 $917,246 11,522
ADRENAL CORTICAL STEROIDS Nov 2015 6 9,049 $597,382 8,511
Oct 2015 6 15,929 $970,299 14,981
Sep 2015 7 11,260 $738,426 10,713
MACROLIDE DERIVATIVES Nov 2015 7 8,916 $319,119 8,713
Oct 2015 8 15,350 $516,865 14,955
Sep 2015 8 10,567 $374,294 10,373
ANALGESICS Nov 2015 8 7,393 $120,235 7,162
Oct 2015 7 15,422 $250,096 14,810
Sep 2015 6 12,374 $197,088 12,044
ANTIPSYCHOTICS Nov 2015 9 6,672 $3023371 5,793
Oct 2015 11 10,768 $4933844 9,547
Sep 2015 10 8,815 $4009536 7,784
RESPIRATORY AGENTS Nov 2015 10 6,110 $1308373 6,022
Oct 2015 9 11,401 $2435040 11,246
Sep 2015 9 8,955 $1916063 8,875
NOTE: Ranks are accurate but due to data reporting issues from CCO, total numbers for RXs , Paid and Benes for Sept and Oct cannot be compared to Oct
Mississippi Division of Medicaid DUR Board Packet (Ver:3) – January 2016 - Page 13

* NOTE: Magnolia claims are not included due to data reporting problems.
Top 10 Drug Molecules by Change in Amount Paid From Sep 2015 TO Nov 2015 (FFS and UHC*)
* NOTE: Magnolia claims are not included due to data reporting problems.
Top 10 Drug Molecules by Change in Amount Paid From Sep 2015 TO Nov 2015 (FFS and UHC*)
Drug MoleculeSep 2015
$ PaidOct 2015
$ PaidNov 2015
$ PaidSep 2015# Claims
Oct 2015# Claims
Nov 2015# Claims
Sep 2015# Benes
Oct 2015# Benes
Nov 2015# Benes
Palivizumab / Immune Globulins $0 $107,790 $214,728 0 41 89 0 39 76
-------Synagis $0 $109,264 $214,728 0 42 89 0 40 76
Cefdinir / Third GenerationCephalosporins
$176,935 $219,612 $242,334 2,176 2,721 2,974 2,156 2,683 2,932
-------Cefdinir $258,581 $376,096 $242,334 3,228 4,720 2,974 3,194 4,639 2,932
Budesonide / Glucocorticoids $440,034 $450,083 $503,814 980 1,061 1,145 963 1,044 1,122
-------Pulmicort Respules $587,827 $764,764 $484,784 1,250 1,713 1,045 1,235 1,689 1,024
-------Pulmicort Flexhaler $28,734 $37,022 $17,404 161 209 98 161 207 98
-------Budesonide $6,573 $6,746 $1,627 11 12 2 11 12 2
-------Uceris $1,550 $0 $0 1 0 0 1 0 0
Leuprolide / AntineoplasticHormones
$35,013 $55,281 $95,941 11 16 25 11 16 25
-------Lupron Depot-Ped $34,630 $67,199 $67,378 7 14 13 7 14 13
-------Lupron Depot $17,516 $18,885 $25,197 8 8 10 8 8 10
-------Eligard $0 $2,605 $2,866 0 1 1 0 1 1
-------Leuprolide Acetate $0 $1,490 $500 0 1 1 0 1 1
Azithromycin / Macrolides $201,254 $245,657 $258,743 6,652 7,866 8,374 6,550 7,727 8,203
-------Azithromycin $225,984 $342,101 $206,384 6,988 10,494 6,048 6,897 10,259 5,941
-------Azithromycin 5 Day DosePack
$59,569 $83,166 $48,433 2,691 3,723 2,175 2,664 3,663 2,137
-------Azithromycin 3 Day DosePack
$4,680 $5,551 $3,927 188 218 151 184 213 149
Oseltamivir / NeuraminidaseInhibitors
$47,819 $72,121 $89,010 258 381 460 257 379 460
Mississippi Division of Medicaid DUR Board Packet (Ver:3) – January 2016 - Page 14

* NOTE: Magnolia claims are not included due to data reporting problems.
Top 10 Drug Molecules by Change in Amount Paid From Sep 2015 TO Nov 2015 (FFS and UHC*)
Drug MoleculeSep 2015
$ PaidOct 2015
$ PaidNov 2015
$ PaidSep 2015# Claims
Oct 2015# Claims
Nov 2015# Claims
Sep 2015# Benes
Oct 2015# Benes
Nov 2015# Benes
-------Tamiflu $72,603 $128,608 $89,010 395 679 460 394 676 460
Amoxicillin-Clavulanate /Beta-Lactamase Inhibitors
$221,849 $243,612 $262,029 3,567 3,959 4,178 3,517 3,908 4,125
-------Amoxicillin-Clavulanate $321,883 $434,292 $261,710 5,315 7,285 4,175 5,245 7,176 4,122
-------Amoxicillin-Clavulanate Er $509 $2,255 $437 7 19 4 7 19 4
-------Augmentin $1,179 $0 $0 1 0 0 1 0 0
Canakinumab / InterleukinInhibitors
$0 $33,912 $34,112 0 1 2 0 1 2
-------Ilaris $16,958 $50,870 $34,112 1 2 2 1 2 2
Dasabuvir/Ombitasvir/Paritaprevir/Ritonavir / AntiviralCombinations
$0 $0 $29,329 0 0 1 0 0 1
-------Viekira Pak $0 $0 $29,329 0 0 1 0 0 1
Albuterol / AdrenergicBronchodilators
$414,719 $452,749 $441,967 8,383 9,370 9,360 7,356 8,306 8,319
-------Albuterol Sulfate $163,557 $257,573 $145,933 4,961 7,706 4,420 4,842 7,445 4,292
-------Ventolin Hfa $211,197 $277,706 $142,660 3,931 5,137 2,658 3,847 4,996 2,596
-------Proventil Hfa $121,565 $149,760 $76,725 1,566 1,941 989 1,544 1,906 976
-------Proair Hfa $120,580 $160,427 $76,598 2,004 2,689 1,285 1,985 2,631 1,262
-------Albuterol $112 $158 $102 10 12 9 10 12 9
-------Albuterol ExtendedRelease
$81 $323 $0 1 4 0 1 4 0
Mississippi Division of Medicaid DUR Board Packet (Ver:3) – January 2016 - Page 15

* NOTE: Magnolia claims are not included due to data reporting problems.
Top 10 Drug Molecules by Change in Amount Paid From Sep 2015 TO Nov 2015 With Factor Excluded (FFS and UHC*)
* NOTE: Magnolia claims are not included due to data reporting problems.
Top 10 Drug Molecules by Change in Amount Paid From Sep 2015 TO Nov 2015 With Factor Excluded (FFS and UHC*)
Drug MoleculeSep 2015
$ PaidOct 2015
$ PaidNov 2015
$ PaidSep 2015# Claims
Oct 2015# Claims
Nov 2015# Claims
Sep 2015# Benes
Oct 2015# Benes
Nov 2015# Benes
Palivizumab / Immune Globulins $0 $107,790 $214,728 0 41 89 0 39 76
-------Synagis $0 $109,264 $214,728 0 42 89 0 40 76
Cefdinir / Third GenerationCephalosporins
$176,935 $219,612 $242,334 2,176 2,721 2,974 2,156 2,683 2,932
-------Cefdinir $258,581 $376,096 $242,334 3,228 4,720 2,974 3,194 4,639 2,932
Budesonide / Glucocorticoids $440,034 $450,083 $503,814 980 1,061 1,145 963 1,044 1,122
-------Pulmicort Respules $587,827 $764,764 $484,784 1,250 1,713 1,045 1,235 1,689 1,024
-------Pulmicort Flexhaler $28,734 $37,022 $17,404 161 209 98 161 207 98
-------Budesonide $6,573 $6,746 $1,627 11 12 2 11 12 2
-------Uceris $1,550 $0 $0 1 0 0 1 0 0
Leuprolide / AntineoplasticHormones
$35,013 $55,281 $95,941 11 16 25 11 16 25
-------Lupron Depot-Ped $34,630 $67,199 $67,378 7 14 13 7 14 13
-------Lupron Depot $17,516 $18,885 $25,197 8 8 10 8 8 10
-------Eligard $0 $2,605 $2,866 0 1 1 0 1 1
-------Leuprolide Acetate $0 $1,490 $500 0 1 1 0 1 1
Azithromycin / Macrolides $201,254 $245,657 $258,743 6,652 7,866 8,374 6,550 7,727 8,203
-------Azithromycin $225,984 $342,101 $206,384 6,988 10,494 6,048 6,897 10,259 5,941
-------Azithromycin 5 Day DosePack
$59,569 $83,166 $48,433 2,691 3,723 2,175 2,664 3,663 2,137
-------Azithromycin 3 Day DosePack
$4,680 $5,551 $3,927 188 218 151 184 213 149
Oseltamivir / NeuraminidaseInhibitors
$47,819 $72,121 $89,010 258 381 460 257 379 460
Mississippi Division of Medicaid DUR Board Packet (Ver:3) – January 2016 - Page 16

* NOTE: Magnolia claims are not included due to data reporting problems.
Top 10 Drug Molecules by Change in Amount Paid From Sep 2015 TO Nov 2015 With Factor Excluded (FFS and UHC*)
Drug MoleculeSep 2015
$ PaidOct 2015
$ PaidNov 2015
$ PaidSep 2015# Claims
Oct 2015# Claims
Nov 2015# Claims
Sep 2015# Benes
Oct 2015# Benes
Nov 2015# Benes
-------Tamiflu $72,603 $128,608 $89,010 395 679 460 394 676 460
Amoxicillin-Clavulanate /Beta-Lactamase Inhibitors
$221,849 $243,612 $262,029 3,567 3,959 4,178 3,517 3,908 4,125
-------Amoxicillin-Clavulanate $321,883 $434,292 $261,710 5,315 7,285 4,175 5,245 7,176 4,122
-------Amoxicillin-Clavulanate Er $509 $2,255 $437 7 19 4 7 19 4
-------Augmentin $1,179 $0 $0 1 0 0 1 0 0
Canakinumab / InterleukinInhibitors
$0 $33,912 $34,112 0 1 2 0 1 2
-------Ilaris $16,958 $50,870 $34,112 1 2 2 1 2 2
Dasabuvir/Ombitasvir/Paritaprevir/Ritonavir / AntiviralCombinations
$0 $0 $29,329 0 0 1 0 0 1
-------Viekira Pak $0 $0 $29,329 0 0 1 0 0 1
Albuterol / AdrenergicBronchodilators
$414,719 $452,749 $441,967 8,383 9,370 9,360 7,356 8,306 8,319
-------Albuterol Sulfate $163,557 $257,573 $145,933 4,961 7,706 4,420 4,842 7,445 4,292
-------Ventolin Hfa $211,197 $277,706 $142,660 3,931 5,137 2,658 3,847 4,996 2,596
-------Proventil Hfa $121,565 $149,760 $76,725 1,566 1,941 989 1,544 1,906 976
-------Proair Hfa $120,580 $160,427 $76,598 2,004 2,689 1,285 1,985 2,631 1,262
-------Albuterol $112 $158 $102 10 12 9 10 12 9
-------Albuterol ExtendedRelease
$81 $323 $0 1 4 0 1 4 0
Mississippi Division of Medicaid DUR Board Packet (Ver:3) – January 2016 - Page 17

* NOTE: Magnolia claims are not included due to data reporting problems.
Top 10 Drug Molecules by Change in Number of Claims From Sep 2015 To Nov 2015 (FFS and UHC*)
* NOTE: Magnolia claims are not included due to data reporting problems.
Top 10 Drug Molecules by Change in Number of Claims From Sep 2015 To Nov 2015 (FFS and UHC*)
Drug MoleculeSep 2015
$ PaidOct 2015
$ PaidNov 2015
$ Paid
Sep2015
# ClaimsOct 2015# Claims
Nov2015
# ClaimsSep 2015# Benes
Oct 2015# Benes
Nov 2015# Benes
Azithromycin / Macrolides $201,254 $245,657 $258,743 6,652 7,866 8,374 6,550 7,727 8,203
-------Azithromycin $225,984 $342,101 $206,384 6,988 10,494 6,048 6,897 10,259 5,941
-------Azithromycin 5 Day DosePack
$59,569 $83,166 $48,433 2,691 3,723 2,175 2,664 3,663 2,137
-------Azithromycin 3 Day DosePack
$4,680 $5,551 $3,927 188 218 151 184 213 149
Amoxicillin / Aminopenicillins $95,478 $106,020 $110,699 9,262 10,132 10,565 9,098 9,954 10,345
-------Amoxicillin $143,474 $195,233 $110,573 13,938 18,708 10,566 13,730 18,344 10,346
-------Moxatag $0 $0 $158 0 0 1 0 0 1
Prednisolone / Glucocorticoids $50,243 $63,995 $65,287 3,380 4,293 4,499 3,317 4,195 4,389
-------Prednisolone SodiumPhosphate
$34,805 $51,412 $32,181 2,351 3,593 2,170 2,327 3,525 2,134
-------Prednisolone $35,770 $54,352 $30,108 2,676 4,167 2,313 2,645 4,083 2,278
-------Prednisolone SodiumPhosphate Odt
$2,686 $5,419 $2,998 15 19 16 15 18 16
-------Veripred 20 $22 $513 $0 1 11 0 1 11 0
Albuterol / AdrenergicBronchodilators
$414,719 $452,749 $441,967 8,383 9,370 9,360 7,356 8,306 8,319
-------Albuterol Sulfate $163,557 $257,573 $145,933 4,961 7,706 4,420 4,842 7,445 4,292
-------Ventolin Hfa $211,197 $277,706 $142,660 3,931 5,137 2,658 3,847 4,996 2,596
-------Proventil Hfa $121,565 $149,760 $76,725 1,566 1,941 989 1,544 1,906 976
-------Proair Hfa $120,580 $160,427 $76,598 2,004 2,689 1,285 1,985 2,631 1,262
-------Albuterol $112 $158 $102 10 12 9 10 12 9
Mississippi Division of Medicaid DUR Board Packet (Ver:3) – January 2016 - Page 18

* NOTE: Magnolia claims are not included due to data reporting problems.
Top 10 Drug Molecules by Change in Number of Claims From Sep 2015 To Nov 2015 (FFS and UHC*)
Drug MoleculeSep 2015
$ PaidOct 2015
$ PaidNov 2015
$ Paid
Sep2015
# ClaimsOct 2015# Claims
Nov2015
# ClaimsSep 2015# Benes
Oct 2015# Benes
Nov 2015# Benes
-------Albuterol ExtendedRelease
$81 $323 $0 1 4 0 1 4 0
Cefdinir / Third GenerationCephalosporins
$176,935 $219,612 $242,334 2,176 2,721 2,974 2,156 2,683 2,932
-------Cefdinir $258,581 $376,096 $242,334 3,228 4,720 2,974 3,194 4,639 2,932
Amoxicillin-Clavulanate /Beta-Lactamase Inhibitors
$221,849 $243,612 $262,029 3,567 3,959 4,178 3,517 3,908 4,125
-------Amoxicillin-Clavulanate $321,883 $434,292 $261,710 5,315 7,285 4,175 5,245 7,176 4,122
-------Amoxicillin-Clavulanate Er $509 $2,255 $437 7 19 4 7 19 4
-------Augmentin $1,179 $0 $0 1 0 0 1 0 0
Codeine-Guaifenesin / UpperRespiratory Combinations
$8,377 $11,069 $13,022 575 760 890 570 754 880
-------Cheratussin Ac $5,699 $9,343 $6,643 400 655 457 398 648 452
-------CodeinePhosphate-Guaifenesin
$4,974 $6,404 $4,951 337 423 329 332 417 325
-------Guaiatussin Ac $1,174 $2,220 $1,286 84 158 93 83 157 93
-------Iophen-C Nr $228 $279 $142 16 19 11 16 19 11
-------Virtussin Ac $614 $1,404 $0 59 139 0 59 135 0
Permethrin Topical / TopicalAnti-Infectives
$24,040 $45,742 $44,933 240 461 453 226 425 416
-------Permethrin $29,079 $52,169 $44,933 294 530 453 278 490 416
Cetirizine / Antihistamines $132,315 $140,802 $136,657 6,004 6,358 6,216 5,933 6,287 6,125
-------Cetirizine Hydrochloride $201,665 $263,163 $136,609 9,119 11,900 6,212 9,044 11,732 6,121
-------All Day Allergy $321 $435 $48 30 44 4 30 44 4
Mississippi Division of Medicaid DUR Board Packet (Ver:3) – January 2016 - Page 19

* NOTE: Magnolia claims are not included due to data reporting problems.
Top 10 Drug Molecules by Change in Number of Claims From Sep 2015 To Nov 2015 (FFS and UHC*)
Drug MoleculeSep 2015
$ PaidOct 2015
$ PaidNov 2015
$ Paid
Sep2015
# ClaimsOct 2015# Claims
Nov2015
# ClaimsSep 2015# Benes
Oct 2015# Benes
Nov 2015# Benes
Prednisone / Glucocorticoids $9,316 $9,372 $9,807 1,757 1,872 1,965 1,719 1,823 1,907
-------Prednisone $13,488 $16,989 $9,807 2,608 3,448 1,965 2,562 3,356 1,907
Mississippi Division of Medicaid DUR Board Packet (Ver:3) – January 2016 - Page 20

* NOTE: Magnolia claims are not included due to data reporting problems.
Top 15 Drug Products by Change in Amount Paid Per Prescription Sep 2015 To Nov 2015 (FFS and UHC*)
* NOTE: Magnolia claims are not included due to data reporting problems.
Top 15 Drug Products by Change in Amount Paid Per Prescription Sep 2015 To Nov 2015 (FFS and UHC*)
Drug ProductTherapeutic Category
Sep 2015$ Paid
Oct 2015$ Paid
Nov 2015$ Paid
Sep2015
# ClaimsOct 2015# Claims
Nov2015
# Claims
Sep 2015Paid
Per Rx
Oct 2015Paid
Per Rx
Nov 2015Paid
Per Rx
Feiba Nf - Powder ForInjection / Factor For BleedingDisorders
$1,358,177
$1,321,467
$1,263,701
9 7 7 $150,909 $188,781 $180,529
Kuvan 100 Mg Tablet,Dispersible / MiscellaneousMetabolic Agents
$4,156 $66,448 $25,955 1 4 1 $4,156 $16,612 $25,955
Actimmune 2000000 Intl Units/0.5 MlSolution / Interferons
$42,005 $83,977 $41,973 2 3 1 $21,002 $27,992 $41,973
Alphanate - Powder ForInjection / Factor For BleedingDisorders
$67,507 $158,564 $98,026 2 3 2 $33,754 $52,855 $49,013
Neupogen 480 Mcg/1.6 MlSolution / Colony Stimulating Factors
$5,146 $0 $18,522 1 0 1 $5,146 . $18,522
Kalydeco 150 Mg Tablet / CftrPotentiators
$75,916 $101,154 $25,238 4 5 1 $18,979 $20,231 $25,238
Enoxaparin Sodium 100 Mg/MlSolution / Heparins
$350 $10,316 $2,972 1 4 1 $350 $2,579 $2,972
Orenitram 1 Mg Tablet, ExtendedRelease / Agents For PulmonaryHypertension
$4,943 $4,943 $7,414 1 1 1 $4,943 $4,943 $7,414
Imbruvica 140 MgCapsule / Multikinase Inhibitors
$8,986 $43,120 $22,882 1 4 2 $8,986 $10,780 $11,441
Gleevec 100 Mg Tablet / Bcr-AblTyrosine Kinase Inhibitors
$33,812 $45,598 $39,658 8 7 6 $4,226 $6,514 $6,610
Revatio 10 Mg/MlSuspension / Agents For PulmonaryHypertension
$7,061 $10,581 $5,778 2 2 1 $3,531 $5,291 $5,778
Hizentra 20% Solution / ImmuneGlobulins
$3,699 $1,537 $17,137 3 2 5 $1,233 $768 $3,427
Mississippi Division of Medicaid DUR Board Packet (Ver:3) – January 2016 - Page 21

* NOTE: Magnolia claims are not included due to data reporting problems.
Top 15 Drug Products by Change in Amount Paid Per Prescription Sep 2015 To Nov 2015 (FFS and UHC*)
Drug ProductTherapeutic Category
Sep 2015$ Paid
Oct 2015$ Paid
Nov 2015$ Paid
Sep2015
# ClaimsOct 2015# Claims
Nov2015
# Claims
Sep 2015Paid
Per Rx
Oct 2015Paid
Per Rx
Nov 2015Paid
Per Rx
Zenpep 25,000 Units-136,000Units-85,000 Units Delayed ReleaseCapsule / Digestive Enzymes
$9,005 $4,471 $7,551 5 3 2 $1,801 $1,490 $3,776
Humira Pediatric 20 Mg/0.4 MlKit / Tnf Alfa Inhibitors
$10,953 $7,301 $7,301 2 1 1 $5,477 $7,301 $7,301
Nexavar 200 Mg Tablet / Vegf/Vegfr Inhibitors
$24,365 $20,887 $27,845 2 2 2 $12,182 $10,444 $13,923
Mississippi Division of Medicaid DUR Board Packet (Ver:3) – January 2016 - Page 22

* NOTE: Magnolia claims are not included due to data reporting problems.
Top 15 Drug Products by Change in Amount Paid Per Prescription Sep 2015 To Nov 2015 With Factor Excluded (FFS and UHC*)
* NOTE: Magnolia claims are not included due to data reporting problems.
Top 15 Drug Products by Change in Amount Paid Per Prescription Sep 2015 To Nov 2015 With Factor Excluded (FFS and UHC*)
Drug ProductTherapeutic Category
Sep 2015$ Paid
Oct 2015$ Paid
Nov 2015$ Paid
Sep2015
# ClaimsOct 2015# Claims
Nov2015
# Claims
Sep 2015Paid
Per Rx
Oct 2015Paid
Per Rx
Nov 2015Paid
Per Rx
Kuvan 100 Mg Tablet,Dispersible / MiscellaneousMetabolic Agents
$4,156 $66,448 $25,955 1 4 1 $4,156 $16,612 $25,955
Actimmune 2000000 Intl Units/0.5 MlSolution / Interferons
$42,005 $83,977 $41,973 2 3 1 $21,002 $27,992 $41,973
Neupogen 480 Mcg/1.6 MlSolution / Colony Stimulating Factors
$5,146 $0 $18,522 1 0 1 $5,146 . $18,522
Kalydeco 150 Mg Tablet / CftrPotentiators
$75,916 $101,154 $25,238 4 5 1 $18,979 $20,231 $25,238
Enoxaparin Sodium 100 Mg/MlSolution / Heparins
$350 $10,316 $2,972 1 4 1 $350 $2,579 $2,972
Orenitram 1 Mg Tablet, ExtendedRelease / Agents For PulmonaryHypertension
$4,943 $4,943 $7,414 1 1 1 $4,943 $4,943 $7,414
Imbruvica 140 MgCapsule / Multikinase Inhibitors
$8,986 $43,120 $22,882 1 4 2 $8,986 $10,780 $11,441
Gleevec 100 Mg Tablet / Bcr-AblTyrosine Kinase Inhibitors
$33,812 $45,598 $39,658 8 7 6 $4,226 $6,514 $6,610
Revatio 10 Mg/MlSuspension / Agents For PulmonaryHypertension
$7,061 $10,581 $5,778 2 2 1 $3,531 $5,291 $5,778
Hizentra 20% Solution / ImmuneGlobulins
$3,699 $1,537 $17,137 3 2 5 $1,233 $768 $3,427
Zenpep 25,000 Units-136,000Units-85,000 Units Delayed ReleaseCapsule / Digestive Enzymes
$9,005 $4,471 $7,551 5 3 2 $1,801 $1,490 $3,776
Humira Pediatric 20 Mg/0.4 MlKit / Tnf Alfa Inhibitors
$10,953 $7,301 $7,301 2 1 1 $5,477 $7,301 $7,301
Mississippi Division of Medicaid DUR Board Packet (Ver:3) – January 2016 - Page 23

* NOTE: Magnolia claims are not included due to data reporting problems.
Top 15 Drug Products by Change in Amount Paid Per Prescription Sep 2015 To Nov 2015 With Factor Excluded (FFS and UHC*)
Drug ProductTherapeutic Category
Sep 2015$ Paid
Oct 2015$ Paid
Nov 2015$ Paid
Sep2015
# ClaimsOct 2015# Claims
Nov2015
# Claims
Sep 2015Paid
Per Rx
Oct 2015Paid
Per Rx
Nov 2015Paid
Per Rx
Nexavar 200 Mg Tablet / Vegf/Vegfr Inhibitors
$24,365 $20,887 $27,845 2 2 2 $12,182 $10,444 $13,923
Subsys 600 Mcg Spray / NarcoticAnalgesics
$93,805 $62,536 $25,015 4 2 1 $23,451 $31,268 $25,015
Eryped 400 Ethylsuccinate 400 Mg/5Ml Granule ForReconstitution / Macrolides
$3,329 $0 $3,209 2 0 1 $1,665 . $3,209
Mississippi Division of Medicaid DUR Board Packet (Ver:3) – January 2016 - Page 24

New Business
Special Analysis Projects
Mississippi Division of Medicaid DUR Board Packet (Ver:3) – January 2016 - Page 25

UTILIZATION OF TRAMADOL IN CHILDREN AGE 17 AND YOUNGER BACKGROUND
The U.S. Food and Drug Administration (FDA) released a safety notice on September 21, 2015 concerning the use of tramadol in children age 17 and younger. The issue, as summarized by the FDA, is outlined in the excerpt below.
http://www.fda.gov/Safety/MedWatch/SafetyInformation/SafetyAlertsforHumanMedicalProducts/ucm463499.htm
Tramadol is not FDA-approved for use in children age 17 and younger. Although the FDA safety notice refers to children age 17 and younger, indicated age limits vary by formulation and are not consistently listed by the FDA and various compendia. Micromedex® (see box below) reports the following age limits:
• 16 and above - tramadol immediate-release tablets, orally disintegrating tablets, and extended release (RyzoltTM)
• 18 and above - tramadol extended-release (Ultram® ER, ConZip®)
Mississippi Division of Medicaid DUR Board Packet (Ver:3) – January 2016 - Page 26

Clinical Pharmacology (see box below) reports the following age limits: • 16 and above - tramadol extended-release tablets (RyzoltTM) • 17 and above - tramadol immediate-release tablets, orally disintegrating tablets, and
extended-release tablets (RyzoltTM) The Clinical Pharmacology listing mentions RyzoltTM in each reference to extended-release tablets but does not clearly indicate where Ultram® ER or ConZip® are included.
The prescribing information for Ultram® ER states in the dosage and administration section that it is for use in adults (18 years of age and older). The prescribing information for ConZip® also states that safety and efficacy in patients under 18 years of age have not been established and use in the pediatric population is not recommended. In response to the FDA safety notice, MS-DUR has conducted an analysis of tramadol utilization in children. Utilization was examined by age and formulation in order to evaluate use at all of the potential age limits. METHODS A retrospective analysis was conducted using pharmacy claims data from July 2014 – November 2015 from fee-for-service (FFS) and coordinated care organizations (CCOs). All claims were extracted for NDCs related to all tramadol formulations. Age and pharmacy program enrollment was determined for beneficiaries at the time each prescription was filled. Prescriptions were classified as being filled for children below the indicated age if age at time of fill was less than 18 years for Ultram® ER and ConZip® prescriptions and less than 16 years for all other tramadol formulations.
Mississippi Division of Medicaid DUR Board Packet (Ver:3) – January 2016 - Page 27

RESULTS Table 1 shows the number of tramadol prescriptions by formulation and age for each pharmacy program. Generic tramadol and generic acetaminophen/tramadol are the preferred products on the Preferred Drug List (PDL) with branded immediate-release products and all extended-release products being non-preferred. All utilization was for generic products. Tramadol products are included in the product list for the FFS SmartPA Short-acting Narcotics rule but there are no age or product specific edits in place. These data indicate that the CCOs also do not have age edit in place for use of tramadol.
AgeAcetaminophen
/ Tramadol Tramadol Tramadol ER Total5 or less 0 3 0 3
6 - 11 7 77 0 7712 - 15 92 747 0 747
16 30 442 0 44217 48 608 0 608
18 or more 581 7,690 0 7,690
AgeAcetaminophen
/ Tramadol Tramadol Tramadol ER Total5 or less 0 3 0 3
6 - 11 0 40 0 4012 - 15 22 250 0 250
16 15 131 1 13217 14 192 0 192
18 or more 729 21,143 6 21,149
AgeAcetaminophen
/ Tramadol Tramadol Tramadol ER Total5 or less 0 2 0 2
6 - 11 3 12 0 1212 - 15 12 205 0 205
16 7 128 0 12817 19 180 0 180
18 or more 1,755 24,557 15 24,572NOTE: All tramadol use was for generic products.
Magnolia
United Health Care
FFS
TABLE 1: Tramadol Use by Pharmacy Program(July 2014 - November 2015)
The provider types writing Tramadol prescriptions for children below the age for use indicated in Micromedex® are listed in Table 2. The provider types accounting for the largest numbers of prescriptions were Family Practice (MD and NP), Emergency Medicine, Dentists and Orthopedists. Based on the provider types writing these prescriptions, use appears to be primarily pain management for conditions other than surgery to remove tonsils and/or adenoids.
Mississippi Division of Medicaid DUR Board Packet (Ver:3) – January 2016 - Page 28

TotalAverage / Prescriber Total
Average / Beneficiary
DDO-Dentist 57 138 2.4 153 1.1DDO-Pediatrics 2 2 1.0 2 1.0
EMS 1 2 2.0 2 1.0HOSP 1 2 2.0 2 1.0
MD-Anesth 4 5 1.3 5 1.0MD-EM 81 212 2.6 216 1.0MD-FP 93 217 2.3 272 1.3MD-GP 6 8 1.3 8 1.0
MD-Gastro 1 1 1.0 1 1.0MD-Hospit 1 7 7.0 7 1.0
MD-IM 18 30 1.7 32 1.1MD-Neur 6 7 1.2 18 2.6
MD-OB/GYN 16 18 1.1 27 1.5MD-Ortho 36 87 2.4 104 1.2MD-Other 8 13 1.6 24 1.8
MD-Ped 12 22 1.8 36 1.6MD-Psych 2 2 1.0 2 1.0
MD-Rheumj 2 3 1.5 5 1.7MD-Sports 2 9 4.5 10 1.1
MD-Surg 8 8 1.0 10 1.3MD-Urol 5 6 1.2 6 1.0
NP 27 55 2.0 57 1.0NP-FM 85 202 2.4 216 1.1
NP-PCP 2 5 2.5 5 1.0NP-Ped 2 2 1.0 2 1.0
Nurse 3 4 1.3 4 1.0PA 14 30 2.1 33 1.1
PA/APN 1 1 1.0 1 1.0Podiatrist 4 25 6.3 27 1.1
Prov-Other 23 30 1.3 38 1.3
TABLE 2: Tramadol Prescribing for Children Below Indicated Age* by Provider Type
* age < 18 for Ultram ER and ConZip; age < 16 for all other formulations.
Number of ClaimsNumber of Prescribers
Number of Beneficiaries
Provider Type
Mississippi Division of Medicaid DUR Board Packet (Ver:3) – January 2016 - Page 29

CONCLUSIONS AND RECOMMENDATIONS As reported by the FDA, immediate release tramadol, which is the preferred product on the PDL, is being prescribed for use in Mississippi Medicaid beneficiaries who are under the age of 18. The FDA has identified safety concerns about tramadol use in an age 17 and under population. The recommended age limit for immediate-release tramadol is unclear:
• FDA safety notice implies age 18 and above for use • Micromedex® states age 16 and above • Clinical Pharmacology states age 17 and above
MS-DUR presents the following recommendations for consideration by the DUR Board.
1. The DUR Board recommends that DOM add the following age limits to the Universal Preferred Drug List (UPDL).
a. Minimum age limit: 18 years – Ultram® ER, ConZip® b. Minimum age limit: 17 years – all other generic and brand formulations of
tramadol
2. The DUR Board recommends that DOM add these age limits to the SmartPA Short-acting Narcotics rule used for the FFS program.
3. The DUR Board recommends that DOM share these limitations on the use of tramadol with the coordinated care programs to assure constancy in the pharmacy program.
Mississippi Division of Medicaid DUR Board Packet (Ver:3) – January 2016 - Page 30

ANTIPSYCHOTIC QUALITY MEASURES: METABOLIC MONITORING IN CHILDREN TAKING ANTIPSYCHOTICS
BACKGROUND Increasing concerns regarding obesity and diabetes emergence in children and adolescents1 are heightened for youth prescribed antipsychotic medications due to adverse metabolic and other physical effects.2 A multi-year study of youth enrolled in three health maintenance organizations found that exposure to antipsychotics (AP) was associated with a four-fold increased risk of diabetes in the following year, compared to children not prescribed psychotropic medication3. The Children's Health Insurance Program Reauthorization Act of 2009 (CHIPRA) established the Pediatric Quality Measures Program (PQMP), an initiative funded by the Agency for Healthcare Research and Quality (AHRQ) and the Centers for Medicare & Medicaid Services (CMS) to support the development of new measures in child health care. The National Collaborative for Innovation in Quality Measurement (NCINQ) is the group responsible for developing and proposing measures for inclusion in the Child Core Set used in Medicaid programs. The Healthcare Effectiveness Data and Information Set (HEDIS) is a tool used by more than 90 percent of America's health plans to measure performance on important dimensions of care and service. Both of these sources recommend use of quality measures addressing metabolic monitoring in children taking antipsychotics. HEDIS Measure: Metabolic Screening for Children and Adolescents On Antipsychotics. The percentage of children and adolescents 0-17 of age who had two or more antipsychotic prescriptions and had metabolic screening (during the observation period). NCINQ Proposed Measure for inclusion in Child Core Set: Metabolic Screening for Children and Adolescents on Antipsychotics. The percentage of children 0 to 20 years of age taking any antipsychotic medication who had metabolic screening documented during the measurement year. At the November 2014 DUR Board Meeting, MS-DUR presented an analysis that showed that during the period July 2013 to June 2014 only 13% of children and adolescents enrolled in Mississippi Medicaid taking antipsychotic medications had claims documenting blood glucose and cholesterol tests had been performed during the observation year.
1 Eisenmann JC. Secular trends in variables associated with the metabolic syndrome of North American children and adolescents: a review and synthesis. Am J Hum Biol. 2003 Nov-Dec;15(6):786-94. Review. PubMed PMID: 14595870. 2 Pringsheim T, Lam D, Ching H, Patten S. Metabolic and neurological complications of second-generation antipsychotic use in children: a systematic review and meta-analysis of randomized controlled trials. Drug Saf. 2011 Aug 1;34(8):651-68. doi: 10.2165/11592020-000000000-00000. Review. PubMed PMID: 21751826. 3 Andrade S, Lo J, Roblin D, Fouyazi H, Connor D, Penfold R, Chandra M, Reed G, Gurwitz J. (2011) antipsychotic medication use antipsychotic medication use among children and risk of diabetes mellitus. Pediatrics, 128, 1135-1141.
Mississippi Division of Medicaid DUR Board Packet (Ver:3) – January 2016 - Page 31

Unfortunately, since there was no quorum at the November 2014 DUR board meeting, there was no vote and recommendations were tabled until the February 2015 meeting. During the February 2015 meeting, the DUR Board recommended that MS-DUR initiate an educational intervention to notify prescribers of the need for metabolic monitoring, evaluate the impact of the intervention, and report back to the Board for consideration of further actions that might be needed to address this issue. EDUCATIONAL INTERVENTION The educational intervention was conducted from February 2015 through September 2015. The intervention each month consisted of the following actions:
• We identified all beneficiaries under the age of 21 who had a prescription filled for an antipsychotic and determined if they had medical claims for metabolic monitoring within one year prior to the prescription fill.
• Providers were ranked based on the number of their patients who had filled antipsychotic prescriptions during the previous month and had not had medical claims documenting appropriate metabolic monitoring during the previous year.
• The providers with the largest number of patients not receiving monitoring were mailed a letter informing them of the importance of metabolic monitoring and reporting their rates for the prior month and the overall rate for all providers in the state during that month.
• Up to 100 providers were contacted monthly. No provider was contacted more often than once every three months.
Each month, providers were ranked based on their rate of compliance with metabolic monitoring for beneficiaries filling prescriptions that month. The top 100 providers were sent the educational mailing notifying them about the importance of metabolic monitoring and their performance on the quality measure during the previous month. A total of 179 different providers were contacted as part of the intervention. 70% of these providers were contacted more than once. The prescribers contacted during the intervention accounted for more than 80% of the children filling prescriptions for antipsychotics during this time period. EVALUATION Analyses were conducted to evaluate the pre- vs post-intervention period behavior among providers contacted during the intervention. In order to compare pre- and post-educational intervention periods and to measure lab monitoring in a manner similar to what could be detected through prospective DUR, modifications were made in the technical specifications for the quality measures. The quality measure is defined as the percentage of beneficiaries taking an
Mississippi Division of Medicaid DUR Board Packet (Ver:3) – January 2016 - Page 32
antipsychotic at any time during the observation period who have claims for metabolic monitoring anytime during the same observation period. For purposes of the evaluation, the measure was converted into a prospective DUR edit in which each prescription fill was checked to determine if claim(s) for metabolic monitoring were found within a one-year look back period. This criteria was applied to all antipsychotic prescriptions filled for children during the pre and post observation periods. The pre observation period was April – November, 2014 and the post observation period was April – November, 2015. The same months were used for each period to control for any seasonal variations that might occur. For each observation period, beneficiaries with at least one prescription meeting metabolic monitoring criterion were classified as having met the criteria. When calculating physician rates, children were attributed to the prescriber of the last antipsychotic prescription filled during the observation period. Performance rates for prescribers were calculated for each observation period as the percentage of children attributed to the provider who met the metabolic monitoring criteria. This modification in the measurement resulted in higher percentages for obtaining metabolic monitoring than did the technical specifications used in the quality measure. This occurs because there was a full year look-back for every prescription filled because the look-back period included months prior to the beginning of the observation period.
Beneficiaries were included in the analysis if they met all of the following inclusion criteria: • Age < 21 years at time of prescription fill; and • Enrolled in Medicaid at least 3 months during observation period; and • Not dual-enrolled or a resident in a long-term-care facility; and • Had > 3 prescription fills for antipsychotics.
The percent of beneficiaries classified as meeting the metabolic monitoring requirement during each observation period are reported in Table 1, which describes whether they had a visit with the provider prescribing their antipsychotic prescription during the observation period. Overall, the percentage of children taking antipsychotics who had metabolic monitoring did not change significantly between the 2014 and 2015 observation periods. It was assumed that prescribers would most likely wait until the next patient visit to perform metabolic monitoring after receiving the educational letter, therefore, we examined changes in the rates for metabolic monitoring for children having office visits and those not having office visits during the two observation periods. Among children having office visits, a slight increase (+2.9%) in the rate for lipid monitoring was observed.
Mississippi Division of Medicaid DUR Board Packet (Ver:3) – January 2016 - Page 33

# Children on APs
Glucose monitoringa
Lipid monitoringa
Bothlab testsa
2014 5,071 54.2% 32.4% 31.4%2015 4,851 49.5% 32.4% 30.6%
Change 2014 - 2015 -4.7% 0.0% -0.8%2014 2,887 57.1% 34.1% 32.9%2015 2,540 54.3% 37.0% 34.4%
Change 2014 - 2015 -2.8% 2.9% 1.5%2014 2,184 50.5% 30.0% 29.4%2015 2,311 44.2% 27.3% 26.4%
Change 2014 - 2015 -6.3% -2.7% -3.0%
TABLE 1: Percentage of Children Who Are Taking Antipsychotics That Had Metabolic Monitoring Within One Year of a Prescription Fill
by Whether The Child Had a Visit With The AP Prescriber During Observation Period(Prescription fills between April - November 2014 and April - November 2015; FFS and CCOs)
a Monitoring was considered to have occurred if a medical claim containing a procedure code included in the measure technical specifications was found within one year prior to the prescription fill.
NOTE: Includes all beneficiaries with 3+ prescription fills during each period
ALLChildren Taking Antipsychotics
Children WITH Visit During
Observation PeriodChildren
WITHOUT Visit During Observation Period
The rates for children receiving metabolic monitoring by whether the prescribing provider was contacted in the educational initiative or not are shown in Table 2. The educational initiative increased the rate of monitoring among children on antipsychotics prescribed by providers contacted during the intervention by only 1.4%. A decrease was seen in the percentage of children having glucose monitoring. Among prescribers who were not contacted as part of the educational initiative, the percentage of children being prescribed APs that had glucose monitoring went down -7.0% and the percentage having lipid monitoring went down -5.5%. It appears that the initiative had a small beneficial effect among the providers contacted.
# Children on APs
Glucose monitoringb
Lipid monitoringb
Bothlab testsb
2014 2,925 52.0% 31.4% 30.6%2015 3,811 48.5% 32.8% 31.2%
Change 2014 - 2015 -3.5% 1.4% 0.6%2014 780 60.1% 36.5% 35.6%2015 1,040 53.1% 31.0% 28.4%
Change 2014 - 2015 -7.0% -5.5% -7.2%
TABLE 2: Percentage of Children Taking Antipsychotics Having Metabolic Monitoring Within One Year of a Prescription Fill
by Whether The Prescriber Was Contacted During Educational Initiativea
(Prescription fills between April - November 2014 and April - November 2015; FFS and CCOs)
NOTE: Includes all beneficiaries with 3+ prescription fills during each period
Children With PrescribersCONTACTED in 2015
Children With PrescribersNOT CONTACTED in 2015
a Educational intervention letters were mailed from February 2015 - September 2015. 2014 data are reported as baseline information for the contacted providers.b Monitoring was considered to have occurred if a medical claim containing a procedure code included in the measure technical specifications was found within one year of the prescription fill.
Mississippi Division of Medicaid DUR Board Packet (Ver:3) – January 2016 - Page 34

As previously noted, providers are not likely to schedule lab tests until the next patient visit. Table 3 compares provider rates for monitoring by whether the prescriber was contacted as part of the educational initiative and whether the beneficiary had an office visit during the observation period. Comparing the two observation periods in this breakdown provides a method of examining whether provider behaviors actually changed with respect to ordering lab tests during office visits. Performance on monitoring actually decreased among providers not contacted through the educational initiative. Among providers who were contacted the rate of monitoring for lipids increased by 5.2% and the rate for glucose monitoring decreased by 2.4% for beneficiaries who had office visits during the observation periods.
Average # Children / Prescriber
% With Glucose
Monitoringb% With Lipid Monitoringb
% With BothLab Testsb
2014 10.5 52.3% 24.4% 23.9%
2015 7.9 46.8% 19.3% 18.7%Change
2014 - 2015-5.5% -5.1% -5.2%
2014 20.8 53.5% 32.2% 29.6%2015 19.8 51.1% 37.4% 34.4%
Change 2014 - 2015
-2.4% 5.2% 4.8%
2014 14.3 44.6% 25.7% 24.0%2015 16.6 35.8% 21.0% 19.0%
Change 2014 - 2015
-8.8% -4.7% -5.0%
TABLE 3: Prescriber Performance Rates For Metabolic Monitoring by Whether The Prescriber Was Contacted During Educational Initiativea
and Whether Child Visited Prescriber During Observation Period(Prescription fills between April - November 2014 and April - November 2015; FFS and CCOs)
NOTE: Includes all prescribers with ratings in both years based on 2+ beneficiaries
Prescribers NOT CONTACTED in
2015(n = 119)
a Educational intervention letters were mailed from February 2015 - September 2015. 2014 data are reported as baseline information for the contacted providers.b Monitoring was considered to have occurred if a medical claim containing a procedure code included in the measure technical specifications was found within one year of the prescription fill.
Children WITH VISIT
During Observation Period
Prescribers CONTACTED in
2015(n = 111)
Children WITH VISIT
During Observation Period
Children WITHOUT VISIT
During Observation Period
Providers were targeted for contact during the educational initiative based on the number of children they had prescribed APs and their rate of metabolic monitoring. Priority was given to contacting providers with high numbers of children without monitoring. As such, few of the providers with only one or two patients were contacted. As shown in Table 4, providers with only a few children on APs had the lowest rates for metabolic monitoring. These providers do not account for a very large percentage of the children on APs, but do continue to present a problem with respect to metabolic monitoring.
Mississippi Division of Medicaid DUR Board Packet (Ver:3) – January 2016 - Page 35

Number of Prescribers
Total Number
Children on APs
% Children With Glucose Monitoringa
% Children With Lipid
Monitoringa
% Children With BothLab Testsa
1 - 2 473 571 46.7% 14.6% 13.8%3 - 5 106 399 42.1% 19.8% 18.9%
6 - 10 47 341 42.8% 27.4% 23.5%11 - 20 50 717 62.3% 41.4% 39.7%
21+ 95 5,786 56.0% 43.5% 40.4%a Monitoring was considered to have occurred if a medical claim containing a procedure code included in the measure technical specifications was found within one year prior to the prescription fill.
TABLE 4: Prescriber Performance Rates For Metabolic Monitoring by Number of Children Prescribed Antipsychotics During 2015 Observation Period
(Prescription fills between April - November 2015; FFS and CCOs)
Number of Children
Prescribed APs in 2015
CONCLUSION The educational intervention conducted in 2015 appears to have had a small positive effect on metabolic monitoring rates. However, the program did not increase rates as much as would be desired, even among the providers who were contacted. Additional educational actions and/or clinical edits or procedures are needed to adequately address metabolic monitoring in children taking antipsychotics. However, when beneficiaries saw prescribers at their offices, rates for metabolic monitoring were higher. The number of children taking antipsychotics and not having office visits during the 8-month observation periods is a concern and may indicate that increased supervision of beneficiaries taking antipsychotics is needed. Next Steps: In the next few months, DOM and MS-DUR will be participating in a committee of 10 state Medicaid programs selected by the American Drug Utilization Review Society (ADURS) that will meet with representatives from CMS to discuss programs for monitoring antipsychotic use among children. MS-DUR will present findings from this meeting to the DURB at the April 2016 meeting. At this time, MS-DUR seeks input from the DUR Board regarding what might be more effective methods for communicating the importance of metabolic monitoring to providers. A copy of an educational piece used by the California Medicaid is included as Appendix A.
Mississippi Division of Medicaid DUR Board Packet (Ver:3) – January 2016 - Page 36

OPIOID OVERUSE AND ABUSE: HIGH MORPHINE EQUIVALENT DAILY DOSING (MEDD) AND DOCTOR SHOPPING
EDUCATIONAL INITIATIVES BACKGROUND Reports from the Center for Disease Control and Prevention (CDC), the Drug Abuse Warning Network and the National Poison Data System have illustrated that over the last two decades the country has seen a disturbing increase in opioid misuse and abuse.1,2,3,4 The sale of prescription opioid drugs have increased four-fold between 1999-2010.2 As shown in the figure below, overdose deaths involving opioid medications have increased steadily for more than a decade and now exceed deaths involving heroin and cocaine combined.5
The Office of Inspector General (OIG) of the Department of Health and Human Services recommends that states implement steps addressing opioid misuse and diversion. Highlighted in the box below, the OIG’s 2016 Work Plan will focus on state actions taken through drug utilization
1 Centers for Disease Control and Prevention. CDC’s top ten: 5 health achievements in 2013 and 5 health threats in 2014 (December 17, 2013). http://blogs. cdc.gov/cdcworksforyou24-7/2013/12/cdc%e2%80%99s-top-ten-5-health-achievements-in-2013-and-5-health-threats-in-2014/ (accessed 2014 Feb 10).
2 Centers for Disease Control and Prevention. Overdose deaths involving prescription opioids among Medicaid enrollees - Washington, 2004–2007. MMWR. 2009; 58:1171-5.
3 Budnitz DS, Pollock DA, Weidenbach KN et al. National surveillance of emergency department visits for outpatient adverse drug events. JAMA. 2006; 296:1858-66.
4 Hall AJ, Logan JE, Toblin RL et al. Patterns of abuse among unintentional pharmaceutical overdose fatalities. JAMA. 2008; 300:2613-20.
5 Centers for Disease Control and Prevention. Increase in drug and opioid deaths – United States, 2000 - 2014. MMWR. 2016; 64:1378-82.
Mississippi Division of Medicaid DUR Board Packet (Ver:3) – January 2016 - Page 37

review (DUR) programs to address opioid misuse and abuse in state Medicaid.6 Efforts are directed to protect “an expanding Medicaid program from fraud, waste, and abuse.”
The Drug Enforcement Agency (DEA) has also expressed concerns about opioid abuse and has become more aggressive in their enforcement of the Controlled Substances Act. Traditionally, the DEA focused on abuses amongst independent pharmacies, but have recently increased their scrutiny and enforcement to large pharmacy chains, long term care providers, and drug wholesalers.7 In December 2015, the Center for Medicare and Medicaid Services (CMS) sent information to state agencies (Appendix B) announcing updates in the Adult and Child Core Set quality measures. In response to concerns about opioid abuse and overdose, CMS announced the inclusion of the Pharmacy Quality Alliance (PQA) quality measures focused on opioid prescriptions from multiple providers and high dose opioid use (see Table 1).
Measure Sponsor: Measure Name Measure DescriptionPQA: Use of Opioids from Multiple Providers or at High Dosage in Persons Without Cancer: Opioid High Dosage
The proportion (XX out of 1,000) of individuals without cancer receiving a daily dosage of opioids greater than 120mg morphine equivalent dose (MED) for 90 consecutive days or longer.
PQA: Use of Opioids from Multiple Providers or at High Dosage in Persons Without Cancer: Multiple prescribers and multiple pharmacies
The proportion (XX out of 1,000) of individuals without cancer receiving prescriptions for opioids from four (4) or more prescribers AND four (4) or more pharmacies.
PQA: Use of Opioids from Multiple Providers or at High Dosage in Persons Without Cancer: Multiple-provider, high dosage
The proportion (XX out of 1,000) of individuals without cancer receiving prescriptions for opioids greater than 120mg morphine equivalent dose (MED) for 90 consecutive days or longer, AND who received opioid prescriptions from four (4) or more prescribers AND four (4) or more pharmacies.
TABLE 1: Opioid Quality Measures Added to the CMS Adult Core Measurement Sets for 2016
6 OIG Work Plan 2016, p 31. http://oig.hhs.gov/reports-and-publications/archives/workplan/2016/oig-work-plan-2016.pdf
7 Keast SL, Nesser N, Farmer K (2015) Strategies aimed at controlling misuse and abuse of opioid prescription medications in a state Medicaid program: a policymaker’s perspective, The American Journal of Drug and Alcohol Abuse, 41:1, 1-6, DOI: 10.3109/00952990.2014.988339. Available at: http://dx.doi.org/10.3109/00952990.2014.988339
Mississippi Division of Medicaid DUR Board Packet (Ver:3) – January 2016 - Page 38

During the February 2014 DUR Board Meeting the board recommended and approved an educational intervention program to be implemented by MS-DUR based on the quality measures that were being developed by PQA. For the previous 18 months, MS-DUR conducted an analysis of the monthly mailings notifying providers about beneficiaries receiving prescriptions from four or more unique prescribers. The previous educational activity was directed at notifying prescribers when suspected doctor/pharmacy shopping was occurring. This intervention primary addressed possible abuse and safety problems that could occur from lack of coordination among prescribers. When the intervention was implemented, the maximum morphine equivalent daily dose (MEDD) component was not included due to uncertainty within the PQA workgroup about the specific criteria for maximum daily doses. The Mississippi Prescription Drug Monitoring Program (MPMP) was established to help providers, professional boards, and drug enforcement agencies track prescriptions for opioids and other controlled substances. The Board of Medical Licensure required all physicians to be enrolled in the MPMP by December 2013. Last year, the Board of Pharmacy required all pharmacists to be enrolled by December 2015. Providers can use the MPMP to identify potentially inappropriate use by patients when they are considering writing a prescription or when they are requested to fill a prescription for an opiate. Although physicians and pharmacists are required to register, utilization review of Medicaid claims still indicates not all providers are using the MPMP system to detect potential overdose or abuse. As PQA has finalized their opiate related quality measures and CMS has added the measures to the Adult Core Set, MS-DUR proposes a revised educational intervention to address concerns about safety and the potentials for abuse. The Opioid High Dosage measure addresses higher than recommended daily doses of opioids for an extended period of time. The outlier to the first measure in Table 1 would occur when a beneficiary without cancer received a daily dosage of opioids greater than 120mg MEDD for 90 consecutive days or longer. Long-term use of opioids at high doses can contribute to the likelihood of overdose, a major safety concern and extended use at high doses can increase the risk of addiction and subsequent abuse. The Multiple Prescriber and Multiple Pharmacy measure address the concept of “doctor shopping.” The outlier to the second measure in Table 1 would occur when a beneficiary without cancer received prescriptions for opioids from four (4) or more prescribers AND four (4) or more pharmacies. Obtaining prescriptions for opiates from multiple prescribers and utilizing multiple pharmacies is an indicator of potential abuse, especially when the geographical locations of the prescribers and/or pharmacies does not reflect a reasonable utilization pattern. Even when abuse is not occurring, use of multiple prescribers represents a potential safety problem due to the potential for uncoordinated care and an increased risk of overdose. The combined measure using high dosage and multiple providers is a strong indicator of potential abuse and/or a significant safety problem. The outlier to the third measure in Table 1 would occur when a beneficiary without cancer received a daily dosage of opioids greater than 120mg MEDD
Mississippi Division of Medicaid DUR Board Packet (Ver:3) – January 2016 - Page 39

for 90 consecutive days or longer AND the beneficiary received prescriptions for opioids from four (4) or more prescribers AND four (4) or more pharmacies. Exceptions occurring to any of these quality measure concepts are a serious concern. Providers need to be informed when exceptions to these quality measures occur in order to alert them to potential coordination of care issues resulting from multiple providers being involved and increased safety concerns due to high dosages and the potential for addiction/abuse. An important part of the educational intervention needs to be encouraging appropriate use of the MPMP database. RECOMMENDATIONS: In order to more completely address the new Adult Core measures, MS-DUR proposes the following recommendations for the DUR Board:
1. MS-DUR initiates an educational intervention based on the Opioid High Dosage measure. Each month beneficiaries filling an opioid prescription during the previous month will be identified if they exceed the criteria in the first measure during a six-month look back period. ALL prescribers and pharmacies involved in the prescriptions contributing to the exception will be notified.
2. MS-DUR initiates an education intervention based on the Multiple Prescriber and Multiple Pharmacy measure. Each month beneficiaries filling an opioid prescription during the previous month will be identified if they exceed the criteria in the second measure during a six-month look back period. ALL prescribers and pharmacies involved in the prescriptions contributing to the exception will be notified.
3. MS-DUR will conduct a quarterly analysis based on the combined Opioid High Dosage and Multiple Prescriber/Pharmacy measure. Beneficiaries will be identified who exceed the criteria in the third measure and a report will be provided to Medicaid Program Integrity for further investigation and evaluation for DOM consideration for lock-in.
Mississippi Division of Medicaid DUR Board Packet (Ver:3) – January 2016 - Page 40

CDC GUIDELINE FOR PRESCRIBING OPIOIDS FOR CHRONIC PAIN AND DUR ACTIONS: BACKGOUND FOR INITIAL DISCUSSION
BACKGROUND As described in the background section of the previous report on the High Morphine Equivalent Dosing (Med) and Doctor Shopping Educational Initiatives, the Office of Inspector General of the Department of Health and Human Services (OIG) has strongly recommended that steps must be taken to address opioid misuse and diversion. The OIG 2016 Work Plan will focus on state actions taken through drug utilization review (DUR) programs to address opioid misuse and abuse in state Medicaid.1 Efforts are directed to protect “an expanding Medicaid program from fraud, waste, and abuse.”
Various efforts have been underway in Mississippi to address the opioid abuse problem. The Mississippi Prescription Drug Monitoring Program (MPMP) was established to help providers, professional boards and drug enforcement agencies track prescriptions for opioids and other controlled substances. The Board of Medical Licensure required all physicians to be enrolled in the MPMP by December 2013. The Board of Pharmacy required all pharmacists to be enrolled by December 2015. Providers can use the MPMP to identify potentially inappropriate use by patients when they are considering writing a prescription or when they are requested to fill a prescription for an opiate. Mississippi Medicaid uses the MPMP to evaluate potential drug abuse cases, to make decisions about prior authorization (PA) approvals and to make decisions about assigning beneficiaries to the lock-in program. The lock-in program limits which and how many providers and pharmacies a beneficiary can use. Recently, the Centers for Medicare and Medicaid Services (CMS) announced a new tool that allows providers and others to track the number of opioid prescription claims in their communities, counties and states. The tool – The Opioid Heat Map – shows local level data of de-identified Medicare Part D opioid prescription claims, comparing the local area to data across the country
1 OIG Work Plan 2016, p 31. http://oig.hhs.gov/reports-and-publications/archives/workplan/2016/oig-work-plan-2016.pdf
Mississippi Division of Medicaid DUR Board Packet (Ver:3) – January 2016 - Page 41

(https://www.cms.gov/Research-Statistics-Data-and-Systems/Statistics-Trends-and-Reports/Medicare-Provider-Charge-Data/OpioidMap.html). The data currently used in this mapping tool is from 2013 Medicare Part D prescription drug claims. The tool was developed in response to the increasing amount of deaths each year related to drug overdose for both opioid-based pain relievers and from illicit drugs like heroin. CMS noted that in 2013, overdose from prescription opioid pain relievers claimed more than 16,000 lives, with more than 145,000 people dying from these overdoses in the last decade. Two images from the mapping tool show the ratings by state and the statistics for Hinds County with the state and national averages.
Mississippi Division of Medicaid DUR Board Packet (Ver:3) – January 2016 - Page 42

The Centers for Disease Control and Prevention (CDC) released draft Guidelines for Prescribing Opioids for Chronic Pain for public comment, which is due by January 13. The draft guideline summarizes scientific knowledge about the effectiveness and risks of long-term opioid therapy and provides recommendations for when to initiate or continue opioids for chronic pain; opioid selection, dosage, duration, follow-up, and discontinuation; and assessing risk and addressing harms of opioid use. The draft Guideline identifies important gaps in the literature where further research is needed. It is intended to be used by primary care providers who are treating patients with chronic pain (i.e., pain lasting longer than 3 months or past the time of normal tissue healing) in outpatient settings. The draft Guideline is intended to apply to patients aged 18 years of age or older with chronic pain outside of palliative and end-of-life care. The Guideline is not intended to apply to patients in treatment for active cancer. The Guideline is not a federal regulation; adherence to the Guideline will be voluntary. The complete guideline and background materials are available and comments can be provided at:
http://www.regulations.gov/#!documentDetail;D=CDC-2015-0112-0001 The following is an excerpt from the CDC document.
Opioids are commonly prescribed for pain. An estimated 20% of patients presenting to physician offices with non-cancer pain symptoms or pain-related diagnoses (including acute and chronic pain) receive an opioid prescription.2 In 2012, health care providers wrote 259 million prescriptions for opioid pain medication, enough for every adult in the United States to have a bottle of pills.3 Opioid prescriptions per capita increased 7.3% from 2007 to 2012, with opioid prescribing rates increasing more for family practice, general practice, and internal medicine compared with other specialties.4 Rates of opioid prescribing vary greatly across states in ways that cannot be explained by the underlying health status of the population, highlighting the lack of consensus among providers on how to use opioid pain medication.3
Prevention, assessment, and treatment of chronic pain are challenges for health providers and systems. Pain might go unrecognized, and patients can be at risk for inadequate pain treatment, particularly racial and ethnic minorities, women, the elderly, persons with cognitive impairment, and those with cancer and at the end of life.5 Patients should receive appropriate pain treatment based on a careful consideration of the benefits and risks of treatment options. Chronic pain can be the result of an underlying medical disease or condition, injury, medical treatment, inflammation, or an unknown cause5. Estimates of the prevalence of chronic pain vary, but it is clear that the number of persons experiencing chronic pain in the United States is
2 Daubresse M, Chang HY, Yu Y, et al. Ambulatory diagnosis and treatment of nonmalignant pain in the United States, 2000–2010. Med Care 2013;51:870–8.
3 Paulozzi LJ, Mack KA, Hockenberry JM. Vital signs: variation among states in prescribing of opioid pain relievers and benzodiazepines—United States, 2012. MMWR Morb Mortal Wkly Rep 2014;63:563–8.
4 Levy B, Paulozzi L, Mack KA, Jones CM. Trends in opioid analgesic-prescribing rates by specialty, U.S., 2007–2012. Am J Prev Med 2015;49:409–13.
5 Institute of Medicine. Relieving pain in America: a blueprint for transforming prevention, care, education, and research. Washington, DC: The National Academies Press; 2011.
Mississippi Division of Medicaid DUR Board Packet (Ver:3) – January 2016 - Page 43

substantial. The 1999–2002 National Health and Nutrition Examination Survey estimated a prevalence of current widespread or localized pain lasting at least 3 months of 14.6%. 6 The overall prevalence of common, predominantly musculoskeletal pain conditions that can be chronic (e.g., arthritis, rheumatism, chronic back or neck problems, and frequent severe headaches) was estimated at 43% among adults in the United States 7 based on a survey conducted during 2001–2003. Most recently, analysis of data from the 2012 National Health Interview Study revealed an estimated prevalence of daily pain of 11.2%.8 It is hard to estimate the number of persons who could potentially benefit from opioid pain medication long term. Although evidence supports short-term efficacy of opioids for reducing pain and improving function in non-cancer nociceptive and neuropathic pain in trials lasting <16 weeks,9 few studies to assess the long-term benefits of opioids for chronic pain (pain lasting >3 months) with outcomes examined at least 1 year later have been conducted.10 On the basis of data available from health systems, researchers estimate that 9.6 to 11.5 million adults, or approximately 3%–4% of the adult U.S. population, were prescribed long-term opioid therapy in 2005.11 In the past decade, while the death rate for the top leading causes of death such as heart disease and cancer has decreased substantially, the death rate associated with opioid pain medication has increased substantially.12 Since 1999, more than 140,000 persons have died from overdose related to opioid pain medication in the United States.13
More than 16,000 deaths occurred in 2013, four times the number of overdose deaths related to these drugs in 1999. 14 Sales of opioid pain medication have increased in parallel with opioid-related overdose deaths.15 The Drug Abuse Warning Network estimated that >420,000 emergency department visits were related to the misuse or abuse of narcotic pain relievers in 2011, the most recent year for which data are available.16
6 Hardt J, Jacobsen C, Goldberg J, et al. Prevalence of chronic pain in a representative sample in the United States. Pain Med 2008;9:803–12.
7 Tsang A, Von Korff M, Lee S, et al. Common chronic pain conditions in developed and developing countries: gender and age differences and comorbidity with depression-anxiety disorders. J Pain 2008;9:883–91.
8 Nahin RL. Estimates of pain prevalence and severity in adults, United States, 2012. J Pain 2015;16:769–80. 9 Furlan A, Chaparro LE, Irvin E, Mailis-Gagnon A. A comparison between enriched and nonenriched enrollment
randomized withdrawal trials of opioids for chronic noncancer pain. Pain Res Manag 2011;16:337–51. 10 Chou R, Deyo R, Devine B, et al. The effectiveness and risks of long-term opioid treatment of chronic pain. Evidence
Report/Technology Assessment No. 218. AHRQ Publication No. 14-E005- EF. Rockville, MD: Agency for Healthcare Research and Quality; 2014. Available at http://www.effectivehealthcare.ahrq.gov/ehc/products/557/1971/chronic-pain-opioid-treatment- report-141007.pdf2014.
11 Boudreau D, Von Korff M, Rutter CM, et al. Trends in long-term opioid therapy for chronic non- cancer pain. Pharmacoepidemiol Drug Saf 2009;18:1166–75.
12 National Center for Health Statistics. Health, United States, 2014: with special feature on adults aged 55–64. Hyattsville, MD: US Department of Health and Human Services, CDC, National Center for Health Statistics; 2015.
13 CDC. QuickStats: rates of deaths from drug poisoning involving opioid analgesics—United States, 1999–2013. MMWR Morb Mortal Wkly Rep 2015;64:32.
14 CDC. QuickStats: rates of deaths from drug poisoning involving opioid analgesics—United States, 1999–2013. MMWR Morb Mortal Wkly Rep 2015;64:32.
15 CDC. Vital signs: overdoses of prescription opioid pain relievers—United States, 1999–2008. MMWR Morb Mortal Wkly Rep 2011;60:1487–92.
16 Substance Abuse and Mental Health Services Administration. The DAWN report: highlights of the 2011 Drug Abuse Warning Network (DAWN) findings on drug-related emergency department visits. Rockville, MD: US Department of
Mississippi Division of Medicaid DUR Board Packet (Ver:3) – January 2016 - Page 44

Opioid use disorder is a problematic pattern of opioid use leading to clinically significant impairment or distress. In 2013, an estimated 1.9 million persons abused or were dependent on prescription opioid pain medication (based on DSM-IV criteria).17 Having a history of a prescription for an opioid pain medication increases the risk for overdose and opioid use disorder,18, 19, 20 highlighting the value of guidance on safer prescribing practices for providers.
The CDC guidelines have sparked considerable controversy21 with regard to the secrecy surrounding the development process and concerns about overly restricting patients’ access to needed medications. Major recommendations included in the proposed guidelines is provided in Appendix B. Regardless of changes that might result from comments received, the final guidelines will probably be very similar to the proposed guidelines and should have significant impact on criteria that will be used by drug utilization review (DUR) programs. A 2015 article reviewing actions taken by Oklahoma Medicaid’s DUR during the last few years to control opiate use is included in Appendix C.22 Actions taken by Oklahoma Medicaid include:
• quantity limits, • pharmacy lock-in program, • prior authorization program, • step-therapy programs, • prospective drug utilization review, • limit on number of prescriptions, • preferred brand authorization, • age restrictions, and • prescriber contract requirement.
Health and Human Services, Substance Abuse and Mental Health Services Administration, Center for Behavioral Health Statistics and Quality; 2013.
17 Substance Abuse and Mental Health Services Administration. Results from the 2013 National Survey on Drug Use and Health: summary of national findings. Rockville, MD: US Department of Health and Human Services, Substance Abuse and Mental Health Services Administration; 2014.
18 Edlund MJ, Martin BC, Russo JE, et al. The role of opioid prescription in incident opioid abuse and dependence among individuals with chronic noncancer pain. Clin J Pain 2014;30:557–64.
19 Zedler B, Xie L, Wang L, et al. Risk factors for serious prescription opioid-related toxicity or overdose among Veterans Health Administration patients. Pain Med 2014;15:1911–29.
20 Bohnert AS, Valenstein M, Bair MJ, et al. Association between opioid prescribing patterns and opioid overdose-related deaths. JAMA 2011;305:1315–21.
21 Medscape Medical News, December 18, 2015. CDC Opioid Guideline Lands, Controversy Continues, (accessed 12/20/15) http://www.medscape.com/viewarticle/856203.
22 Keast SL, Nesser N, Farmer K (2015) Strategies aimed at controlling misuse and abuse of opioid prescription medications in a state Medicaid program: a policymaker’s perspective, The American Journal of Drug and Alcohol Abuse, 41:1, 1-6, DOI: 10.3109/00952990.2014.988339. Available at: http://dx.doi.org/10.3109/00952990.2014.988339
Mississippi Division of Medicaid DUR Board Packet (Ver:3) – January 2016 - Page 45

ACTION REQUESTED: MS-DUR is providing you this information in preparation of a full review of all Division of Medicaid DUR activities and efforts related to prescribing of opioids, which will take place at the April 2016 meeting. We ask that you review the information included and at the link provided and be prepared to provide feedback and comments as input to guide us in preparing for the April meeting.
Mississippi Division of Medicaid DUR Board Packet (Ver:3) – January 2016 - Page 46

CMS MEDICAID PROGRAM INTEGRITY EDUCATION
The CMS Center for Program Integrity provides educational resources to educate providers, beneficiaries and other stakeholders in promoting best practices and awareness of Medicaid fraud, waste and abuse. Medicaid Provider Integrity Education (MPIE) materials are applicable to providers, beneficiaries, and State managed care plans. MPIE materials include topic-based information in an easy to read format that aid in furthering education efforts of providers, beneficiaries and other Medicaid stakeholders. The information provided is intended to further the education efforts of Medicaid Program Integrity Education, assist providers with being in compliance with their billing and assist in the fight against fraud, waste and abuse. Please visit Medicaid Program Integrity Education - Centers for Medicare & Medicaid Services to access educational booklets, fact sheets and provider checklist resources and tools which promote efforts to prevent Medicaid fraud, waste and improper payments. https://www.cms.gov/Medicare-Medicaid-Coordination/Fraud-Prevention/Medicaid-Integrity-Education/edmic-landing.html
Mississippi Division of Medicaid DUR Board Packet (Ver:3) – January 2016 - Page 47

The Mississippi Division of Medicaid and MS-DUR strongly encourage all providers to take advantage of the educational materials available at this site.
Mississippi Division of Medicaid DUR Board Packet (Ver:3) – January 2016 - Page 48

Appendix
Mississippi Division of Medicaid DUR Board Packet (Ver:3) – January 2016 - Page 49

Table 1 was updated on August 13, 2015 March 31, 2015
Improving the Quality of Care: Antipsychotic Use in Children and Adolescents
Key Points:
Prescribing of antipsychotic medications to children andadolescents is increasing, despite a lack of safety data and a
high risk of neurologic, psychiatric, and metabolic adverse effects.
Antipsychotic medications should be prescribed for a specific clinical indication only whenthe scientific evidence supports the likelihood that benefits will exceed harms. For childrenand adolescents, use of antipsychotic medication for United States Food and DrugAdministration (FDA)-approved indications generally implies more certainty that benefitswill exceed risks, compared to off-label use. Prescribing beyond FDA-approvedindications must be approached cautiously.
No antipsychotics are FDA-approved for patients under three years of age. Only twoolder, first-generation antipsychotics are FDA-approved for patients under five years ofage. FDA-approved indications for children under 10 years of age are very limited,especially among newer, second-generation antipsychotics.
As of October 1, 2014, any use of antipsychotics for Medi-Cal beneficiaries 0 – 17 years ofage requires an approved Treatment Authorization Request (TAR).
Concurrent use of more than one antipsychotic medication is not recommended. Amongall children and adolescents in the Medi-Cal fee-for-service population with at least 90consecutive days of antipsychotic medication treatment, almost 6 percent were taking twoor more antipsychotic medications concurrently for at least 90 consecutive days.
Serious adverse effects are common with antipsychotic medication use, particularly weightgain, dyslipidemia, diabetes, and cardiovascular disease. While both baseline andperiodic metabolic monitoring is recommended, only 37 percent of children andadolescents in the Medi-Cal fee-for-service population had appropriate metabolic testingduring a one-year time period.
Psychosocial care, which includes behavioral interventions, psychological therapies, andskills training, among others, remains the recommended first-line treatment option forchildren and adolescents for nonpsychotic conditions such as attention deficit disorder anddisruptive behaviors. Antipsychotic medications, when prescribed, should be part of acomprehensive, multi-modal plan for coordinated treatment that includes psychosocialcare.
The safest use of antipsychotic medications in children and adolescents requires close,in-person clinical monitoring by prescribers for both clinical response and adverseneurologic, psychiatric, and metabolic effects.
Background Prescribing of antipsychotic medications to children and adolescents has increased rapidly in recent decades, driven by new prescriptions and by longer duration of use.1 The frequency ofprescribing antipsychotics to children and adolescents increased almost fivefold from 1996 – 2002, from 8.6 per 1,000 to 39.4 per 1,000.2 A national study found that prescribing ofatypical antipsychotics increased 62 percent from 2002 – 2007 among children and adolescents enrolled in Medicaid.3
Although some clinical evidence supports the efficacy of antipsychotics in patients under 18 years of age for certain narrowly defined conditions, according to a 2011 report by the Agency for Healthcare Research and Quality (AHRQ), children taking antipsychotic medications receive an
APPENDIX A
Mississippi Division of Medicaid DUR Board Packet (Ver:3) – January 2016 - Page 50

atypical antipsychotic 90 percent of the time, and in the majority of patients the use is for an off-label indication, including attention deficit/hyperactivity disorder (ADHD) and aggressive behavior.4 One study found that in the Medicaid population, more than 3/4 of children and adolescents were taking antipsychotics for an indication that is not FDA approved.5 For reference, current FDA-approved indications for selected antipsychotic medications are listed in Table 1. Table 1. Antipsychotic Medications: FDA-approved Indications for Children and Adolescents
Age (years)
<1 1 – 2 3 – 4 5 6 – 9 10 – 11 12 13 – 17
Second-Generation (Atypical) Antipsychotics
aripiprazole* NONE I,T I,M,T I,M,S,T
asenapine* NONE M
clozapine* NONE iloperidone* NONE lurasidone* NONE olanzapine* NONE D,M D,M,S
paliperidone NONE S
quetiapine* NONE M M,S
risperidone* NONE I I,M I,M,S
ziprasidone* NONE First-Generation (Typical) Antipsychotics
chlorpromazine* NONE B NONE fluphenazine* NONE
haloperidol* NONE H,P,S,T
loxapine* NONE molindone* NONE S
perphenazine* NONE S pimozide NONE T
thioridazine* NONE S
thiothixene* NONE S
trifluoperazine* NONE S
* As of the date of publication of this article, these drugs appear on the Medi-Cal List of Contract Drugs, although some medications have restrictions on manufacturer codes. For current information, use the online Medi-Cal Formulary search tool available at http://www.dhcs.ca.gov/services/Pages/FormularyFile.aspx.
Key:
B Severe behavioral problems marked by combativeness and/or explosive hyperexcitable behavior and short-term treatment of hyperactive children who show excessive motor activity with accompanying conduct disorders
D Acute depressive episodes associated with Bipolar I Disorder (along with fluoxetine)
H Hyperactivity I Irritability associated with autism disorder M Manic or mixed episodes associated with Bipolar I Disorder P Psychosis S Schizophrenia T Tourette’s Syndrome
While antipsychotic medications can be of significant benefit, these drugs also have serious common side effects, including weight gain, hyperprolactinemia, and metabolic disturbance,
Mississippi Division of Medicaid DUR Board Packet (Ver:3) – January 2016 - Page 51
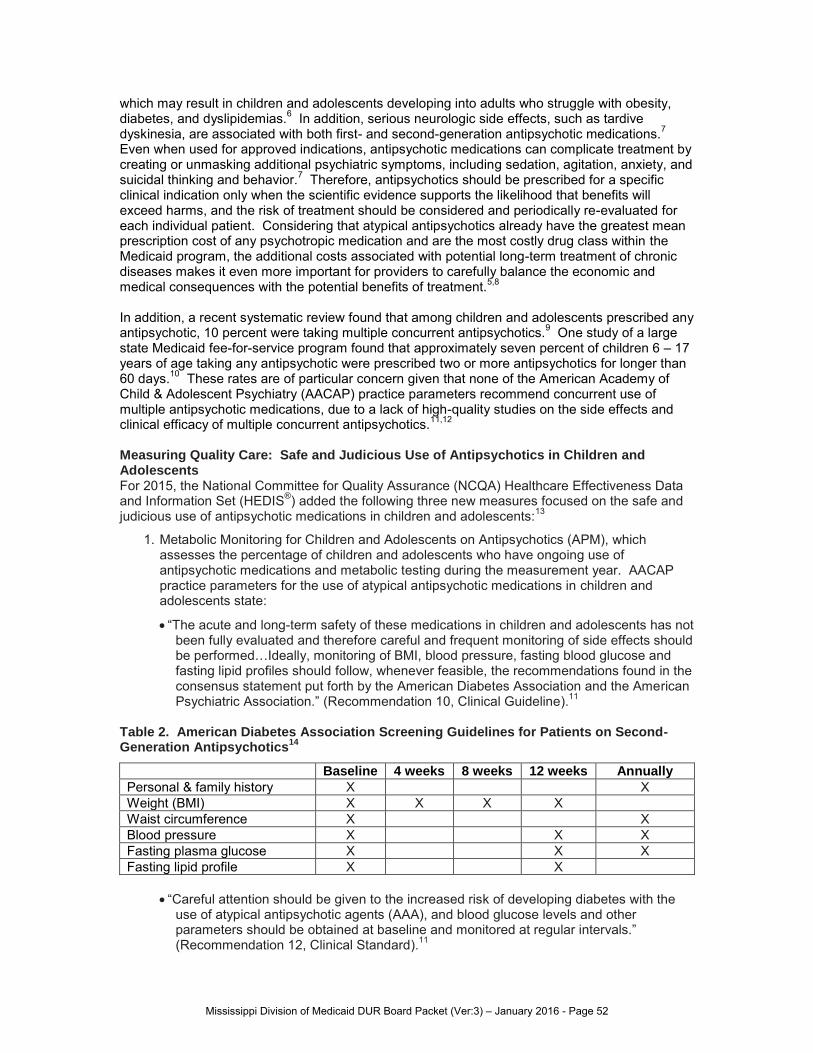
which may result in children and adolescents developing into adults who struggle with obesity, diabetes, and dyslipidemias.6 In addition, serious neurologic side effects, such as tardive dyskinesia, are associated with both first- and second-generation antipsychotic medications.7 Even when used for approved indications, antipsychotic medications can complicate treatment by creating or unmasking additional psychiatric symptoms, including sedation, agitation, anxiety, and suicidal thinking and behavior.7 Therefore, antipsychotics should be prescribed for a specific clinical indication only when the scientific evidence supports the likelihood that benefits will exceed harms, and the risk of treatment should be considered and periodically re-evaluated for each individual patient. Considering that atypical antipsychotics already have the greatest mean prescription cost of any psychotropic medication and are the most costly drug class within the Medicaid program, the additional costs associated with potential long-term treatment of chronic diseases makes it even more important for providers to carefully balance the economic and medical consequences with the potential benefits of treatment.5,8
In addition, a recent systematic review found that among children and adolescents prescribed any antipsychotic, 10 percent were taking multiple concurrent antipsychotics.9 One study of a large state Medicaid fee-for-service program found that approximately seven percent of children 6 – 17 years of age taking any antipsychotic were prescribed two or more antipsychotics for longer than 60 days.10 These rates are of particular concern given that none of the American Academy of Child & Adolescent Psychiatry (AACAP) practice parameters recommend concurrent use of multiple antipsychotic medications, due to a lack of high-quality studies on the side effects and clinical efficacy of multiple concurrent antipsychotics.11,12
Measuring Quality Care: Safe and Judicious Use of Antipsychotics in Children and Adolescents For 2015, the National Committee for Quality Assurance (NCQA) Healthcare Effectiveness Data and Information Set (HEDIS®) added the following three new measures focused on the safe and judicious use of antipsychotic medications in children and adolescents:13
1. Metabolic Monitoring for Children and Adolescents on Antipsychotics (APM), which assesses the percentage of children and adolescents who have ongoing use of antipsychotic medications and metabolic testing during the measurement year. AACAP practice parameters for the use of atypical antipsychotic medications in children and adolescents state:
“The acute and long-term safety of these medications in children and adolescents has not been fully evaluated and therefore careful and frequent monitoring of side effects should be performed…Ideally, monitoring of BMI, blood pressure, fasting blood glucose and fasting lipid profiles should follow, whenever feasible, the recommendations found in the consensus statement put forth by the American Diabetes Association and the American Psychiatric Association.” (Recommendation 10, Clinical Guideline).11
Table 2. American Diabetes Association Screening Guidelines for Patients on Second-Generation Antipsychotics
14
Baseline 4 weeks 8 weeks 12 weeks Annually
Personal & family history X X Weight (BMI) X X X X Waist circumference X X Blood pressure X X X Fasting plasma glucose X X X Fasting lipid profile X X
“Careful attention should be given to the increased risk of developing diabetes with the
use of atypical antipsychotic agents (AAA), and blood glucose levels and other parameters should be obtained at baseline and monitored at regular intervals.” (Recommendation 12, Clinical Standard).11
Mississippi Division of Medicaid DUR Board Packet (Ver:3) – January 2016 - Page 52

“In those patients with significant weight changes and/or a family history indicating high risk, lipid profiles should be obtained at baseline and monitored at regular intervals.” (Recommendation 13, Clinical Guideline).11
2. Use of Multiple Concurrent Antipsychotics in Children and Adolescents (APC), which assesses the percentage of children and adolescents who were taking two or more concurrent antipsychotics for at least 90 days during the measurement year. AACAP practice parameters for the use of atypical antipsychotic medications in children and adolescents state:
“The simultaneous use of multiple AAA has not been studied rigorously and generally should be avoided.” (Recommendation 8, Not Endorsed).11
3. Use of First-line Psychosocial Care for Children and Adolescents on Antipsychotics (APP), which assesses the percentage of children and adolescents who had a new prescription for an antipsychotic medication without a primary indication for it and had documentation of psychosocial care as first-line treatment. AACAP practice parameters for the use of atypical antipsychotic medications in children and adolescents state:
“Prior to the initiation of and during treatment with an AAA, the general guidelines that pertain to the prescription of psychotropic medications should be followed.” (Recommendation 1, Clinical Standard).11
“When selecting any AAA for use in a child or adolescent, the clinician should follow the most current available evidence in the scientific literature.” (Recommendation 2, Clinical Standard).
Medi-Cal Policy Aligns with Clinical Guidelines
Medi-Cal has always required an approved TAR for the use of antipsychotics for non-FDA approved indications, and for any use in children less than 6 years of age. Of note, it was found that requiring an approved TAR for non-FDA approved indications was often difficult to enforce.
Since May 1, 2012, antipsychotic use for Medi-Cal beneficiaries 6 – 17 years of age has been restricted to the use of one antipsychotic, except during titration period and, within this age group, concurrent use of two or more antipsychotics has required an approved TAR.
As of October 1, 2014, any use of antipsychotics for Medi-Cal beneficiaries 0 – 17 years of age requires an approved TAR. For additional information about this policy, a Frequently Asked Questions (FAQ) document is available on the California Department of Health Care Services Pharmacy Benefits Division website at http://www.dhcs.ca.gov/services/Pages/PharmacyBenefits2.aspx.
Antipsychotic Use Among Children and Adolescents in the Medi-Cal Fee-for-Service Population A retrospective cohort study was conducted to evaluate two of the HEDIS performance measures for antipsychotic medication use among children and adolescents (APM and APC) in the Medi-Cal fee-for-service population, using medical and pharmacy claims data. Study population selection criteria were adapted from HEDIS performance indicators and included all Medi-Cal beneficiaries who met the following inclusion criteria:
Continuously eligible beneficiary enrolled in the Medi-Cal fee-for-service program for the duration of the measurement year (October 1, 2013, through September 30, 2014)
1 – 17 years of age as of September 30, 2014
At least one paid pharmacy claim for an antipsychotic medication during the measurement year
Mississippi Division of Medicaid DUR Board Packet (Ver:3) – January 2016 - Page 53

Descriptive statistics were used to summarize beneficiary characteristics and HEDIS rates. Data were stratified into three age groups, per HEDIS specifications. Results A total of 6,688 Medi-Cal fee-for-service beneficiaries met the inclusion criteria, and within this group there were a total of 58,598 paid claims for antipsychotic medications. Demographic characteristics of the beneficiaries are listed in Table 3 including gender and race/ethnicity. Table 3. Demographic Characteristics of the Medi-Cal Fee-for-Service Study Population
1 – 5 years 6 – 11 years 12 – 17 years
Overall Population (n = 6,688) 82 (1%) 2,038 (30%) 4,568 (68%) Gender
Male (n = 4,349; 65%) 61 (74%) 1,409 (69%) 2,879 (63%)
Female (n = 2,339; 35%) 21 (26%) 629 (31%) 1,689 (37%)
Race/Ethnicity White/Caucasian, non-Hispanic (n = 3,173; 47%) 29 (35%) 924 (45%) 2,220 (49%)
All other races/ethnicities (n = 3,515; 53%) 53 (65%) 1,114 (55%) 2,348 (51%)
The study population was almost 2/3 male (n = 4,439; 65%) and almost half of these beneficiaries identified as white/Caucasian race, non-Hispanic ethnicity (n = 3,173; 47%). Overall rates for APM (Table 4) and APC (Table 5), as well as rates stratified by the three age groups are listed below. Of note, for the APM calculation, a total of 675 beneficiaries were excluded as they only had one paid claim for an antipsychotic medication during the measurement year (leaving a denominator of 6,013 beneficiaries) and, for the APC calculation, a total of 1,313 beneficiaries were excluded as they had less than 90 days of continuous antipsychotic medication treatment during the measurement year (leaving a denominator of 5,375 beneficiaries). Table 4. Metabolic Monitoring in Children and Adolescents with ≥2 Paid Claims for Antipsychotic Medications During the Measurement Year (October 1, 2013, through September 30, 2014)
Age Group
Numerator Denominator Percentage of children and adolescents with
≥2 paid claims for antipsychotic
medications and metabolic testing
Children and adolescents with ≥1 test
for both blood glucose/HbA1C and LDL-C/cholesterol
Children and adolescents with ≥2 paid claims for antipsychotic
medications
1 – 5 years 18 68 26.5% 6 – 11 years 575 1,838 31.3% 12 – 17 years 1,653 4,107 40.2% TOTAL 2,246 6,013 37.4%
Although the 37.4 percent figure calculated using HEDIS measure parameters gives the rate at which both tests were completed (blood glucose or HbA1C and LDL-C or cholesterol), individual testing rates were also calculated for the study population. The rate of glucose or Hb1AC monitoring (n = 3,151; 52.4%), was much greater than LDL-C or cholesterol monitoring
Mississippi Division of Medicaid DUR Board Packet (Ver:3) – January 2016 - Page 54

(n = 2,279; 37.9%), suggesting there is an opportunity for outreach to providers, who could raise the metabolic monitoring rate calculated in the HEDIS measure by ordering both tests at the same time. Of note, the HEDIS documentation for this measure included an analysis using the 2008 Medicaid Analytic eXtract (MAX) data files. These data showed an average metabolic monitoring rate across data collected from 11 states of 18.5 percent (range: 4.8 percent – 36.2 percent), more than half the rate found in the Medi-Cal fee-for-service population.13 Table 5. Children and Adolescents on Multiple Concurrent Antipsychotic Medications During the Measurement Year (October 1, 2013, through September 30, 2014)
Age Group
Numerator Denominator Percentage of children and adolescents on ≥2
concurrent antipsychotic medications
Children and adolescents on ≥2
concurrent antipsychotic medications ≥90 consecutive days
Children and adolescents with ≥90 consecutive days of
antipsychotic medication treatment
1 – 5 years 0 53 0.0% 6 – 11 years 61 1,665 3.7% 12 – 17 years 245 3,657 6.7%
TOTAL 306 5375 5.7%
This calculated rate of 5.7 percent of Medi-Cal fee-for-service beneficiaries on multiple concurrent antipsychotic medications is close to the published rates for this measure found in the HEDIS documentation, which used the 2008 MAX data files and found average rate of 6.0 percent across 11 states (range: 2.8 percent – 9.4 percent).13 Within the 306 beneficiaries identified on greater than two concurrent antipsychotic medications for at least 90 consecutive days, concurrent use of aripiprazole, risperidone, and/or quetiapine accounted for 65.4 percent of concurrent antipsychotic medication use, including concurrent use of risperidone-aripiprazole (n = 70), quetiapine-aripiprazole (n = 68), quetiapine-risperidone (n = 62). Clinical Recommendations
Psychosocial care, which includes behavioral interventions, psychological therapies, and skills training, among others, is the recommended first-line treatment option for children and adolescents diagnosed with nonpsychotic conditions such as attention-deficit disorder and disruptive behaviors.
Prior to the initiation of treatment with antipsychotic medication, obtain a personal and family history of diabetes and hyperlipidemia, seizures and cardiac abnormalities, as well as any family history of previous response or adverse events associated with antipsychotic medication.
When prescribed, antipsychotic medications should be part of a comprehensive, multi-modal plan for coordinated treatment that includes psychosocial care.
Antipsychotic dosing should follow the “start low and go slow” approach and seek to find the lowest effective dose. Determination of an appropriate target dose should follow both the current scientific literature and the clinical response of the patient, while also monitoring the patient for side effects and tolerability. Multiple clinical guidelines suggest that higher than approved dosages of antipsychotic medications should be avoided.14
Periodically review the ongoing need for continued therapy with antipsychotic medications.
Mississippi Division of Medicaid DUR Board Packet (Ver:3) – January 2016 - Page 55

Monitor BMI, blood pressure, fasting blood glucose, and fasting lipid profiles according to the recommendations found in the consensus statement put forth by the American Diabetes Association and the American Psychiatric Association.
Periodically review AACAP practice parameters for updated information on the AACAP website at http://www.aacap.org/AACAP/Resources_for_Primary_Care/Practice_Parameters_and_Resource_Centers/Practice_Parameters.aspx.
Review additional prescriber resources developed by the Ohio Psychotropic Medication Quality Improvement Collaborative, including a psychotropic medication contraindications and interactions table, atypical antipsychotics adverse effects table, and a screening and monitoring tool available at their website at http://www.ohiomindsmatter.org/Prescribers_Psychotropic.html.
References
1. Patten SB, Waheed W, Bresee L. A review of pharmacoepidemiologic studies of antipsychotic use in children and adolescents. Canadian Journal of Psychiatry. 2012;57:717–21.
2. Cooper WO, Arbogast PG, Ding H, et al. Trends in prescribing of antipsychotic medications for US children. Ambulatory Pediatrics. 2006;6(2):79–83.
3. Matone M, Localio R, Huang Y-s, et al. The relationship between mental health diagnosis and treatment with second-generation antipsychotics over time: A national study of Medicaid-enrolled children. Health Services Research. 2012;47:1836–60.
4. U.S. Department of Health and Human Services. Agency for Healthcare Research and Quality. (2011, September). Off-Label Use of Atypical Antipsychotics: An Update. (AHRQ Publication No. 11-EHC087-EF). Available at: http://www.effectivehealthcare.ahrq.gov/ehc/products/150/778/CER43_Off-LabelAntipsychotics_20110928.pdf. Accessed: March 10, 2015.
5. Crystal SC, Olfson M, Huang C, et al. Broadened use of atypical antipsychotic drugs: safety, effectiveness, and policy challenges. Health Affairs. 2009;28:770-781.
6. Correll CU, Manu P, Olshanskiy V, et al. Cardiometabolic risk of second-generation antipsychotic medications during first-time use in children and adolescents. JAMA. 2009;302(16): 1765–1773.
7. Centers for Medicare & Medicaid Services, Medicaid Integrity Group. Atypical antipsychotic medications: use in pediatric patients. August 2013. Available at: http://www.cms.gov/Medicare-Medicaid-Coordination/Fraud-Prevention/Medicaid-Integrity-Education/Pharmacy-Education-Materials/Downloads/atyp-antipsych-pediatric-factsheet.pdf. Accessed: March 10, 2015.
8. Martin A and Leslie D. Trends in psychotropic medication costs for children and adolescents, 1997-2000. Arch Pediatr Adolesc Med. 2003 Oct;157(10): 997–1004.
9. Toteja N, Gallego JA, Saito E, et al. Prevalence and correlates of antipsychotic polypharmacy in children and adolescents receiving antipsychotic treatment. Int J Neuropsychopharmacol. 2014 Jul;17(7): 1095-105.
10. Constantine R, Bengtson M, Murphy T, et al. Impact of the Florida Medicaid Prior-Authorization Program on use of antipsychotics by children under age six. Psychiatr Serv. 2012 Dec;63(12): 1257-60.
11. American Academy of Child and Adolescent Psychiatry. Practice Parameter for the Use of Atypical Antipsychotic Medications in Children and Adolescents. Available at: http://www.aacap.org/App_Themes/AACAP/docs/practice_parameters/Atypical_Antipsychotic_Medications_Web.pdf. Accessed: March 10, 2015.
Mississippi Division of Medicaid DUR Board Packet (Ver:3) – January 2016 - Page 56

12. American Academy of Child and Adolescent Psychiatry. Practice parameter for the assessment and treatment of children and adolescents with schizophrenia. J Am Acad Child Adolesc Psychiatry. July 2001;40(7Suppl): 4S–23S.
13. National Committee for Quality Assurance (NCQA). HEDIS 2015, Volume 2 Technical Specifications. Washington, DC: National Committee for Quality Assurance; 2014.
14. American Diabetes Association, American Psychiatric Association, American Association of Clinical Endocrinologists, and the North American Association for the Study of Obesity. Consensus development conference on antipsychotic drugs and obesity and diabetes. Diabetes Care. 2004;27(2): 596-601.
Mississippi Division of Medicaid DUR Board Packet (Ver:3) – January 2016 - Page 57

CMCS Informational Bulletin
DATE: December 11, 2015
FROM: Vikki Wachino Director Center for Medicaid and CHIP Services
SUBJECT: 2016 Updates to the Child and Adult Core Health Care Quality Measurement Sets
This informational bulletin describes the 2016 updates to the core set of children’s health care quality measures for Medicaid and the Children’s Health Insurance Program (CHIP) (Child Core Set) and the core set of health care quality measures for adults enrolled in Medicaid (Adult Core Set).
Background
The Center for Medicaid and CHIP Services (CMCS) has worked with stakeholders to identify two core sets of health care quality measures that can be used to assess the quality of health care provided to children and adults enrolled in Medicaid and CHIP (see http://www.medicaid.gov/medicaid-chip-program-information/by-topics/quality-of-care/quality-of-care-–-performance-measurement.html). The core sets are tools states can use to monitor and improve the quality of health care provided to Medicaid and CHIP enrollees. The goals of this effort are to:
• Encourage national reporting by states on a uniform set of measures; and• Support states in using these measures to drive quality improvement.
Part of implementing an effective “quality measures reporting program” is to periodically reassess the measures that comprise it since many factors, such as changes in clinical guidelines and experiences with reporting and performance rates, may warrant modifying the measure set. In addition, CMCS continues to prioritize working with federal partners to promote quality measurement alignment across programs (e.g., Meaningful Use, Hospital Inpatient Quality Reporting Program, Physician Quality Reporting System) recognizing that this reduces burden on states reporting data to multiple programs and helps to drive quality improvement across payers and programs.
For the 2016 updates to the Child and Adult Core Sets, CMCS, once again, worked with the National Quality Forum’s (NQF) Measure Applications Partnership (MAP),1 a public-private partnership that reviews measures for potential use in federal public reporting, to review and identify ways to improve the core sets. Collaborating with NQF’s MAP process for core set updates promotes measure alignment across CMS since NQF also reviews measures for other CMS reporting programs.
1 http://www.qualityforum.org/Setting_Priorities/Partnership/Measure_Applications_Partnership.aspx
APPENDIX B
Mississippi Division of Medicaid DUR Board Packet (Ver:3) – January 2016 - Page 58

CMCS is encouraged by state reporting on the core measures. For the Child Core Set, fifty states and the District of Columbia voluntarily reported, for federal fiscal year (FFY) 2014, a median of 16 measures. For the Adult Core Set, 34 states reported a median of 17 measures in FFY 2014. Additional information on state reporting and performance on each core set can be found in the forthcoming respective 2015 Annual Report on the Quality of Care for Children in Medicaid and CHIP and the 2015 Annual Report on the Quality of Care for Adults Enrolled in Medicaid . CMCS looks forward to working with states on the core measures reporting for FFY 2015. 2016 Child Core Set Since the release of the initial Child Core Set in 2011, CMCS has collaborated with state Medicaid and CHIP agencies to voluntarily collect, report, and use the measures to drive quality improvements. Section 1139A of the Social Security Act, as amended by Section 401(a) of the Children’s Health Insurance Reauthorization Act (CHIPRA) of 2009, provides that, beginning annually in January 2013, the Secretary shall publish recommended changes to the core measures.2 For the 2016 Child Core Set update, CMCS will add two measures:
• Use of Multiple Concurrent Antipsychotics in Children and Adolescents3 • Audio logical Evaluation no later than 3 months of age4
The addition of these two measures allows CMCS to expand the measurement of quality of care for two populations – children prescribed psychotropic drugs and children at-risk of hearing problems. CMCS also is engaged in a pilot of a reporting process for the child version of the hospital Consumer Assessment of Healthcare Providers and Systems survey (Child HCAHPS)5 in order to determine whether or not to include HCAHPS in a future Child Core Set. This measure was recommended by the 2014 MAP to help address gaps noted in the measure set in three areas: inpatient care; patient experience; and care coordination. Additional information about the 2015 Child Core Set MAP review process and their recommendations to CMCS can be found at: http://medicaid.gov/medicaid-chip-program-information/by-topics/quality-of-care/chipra-initial-core-set-of-childrens-health-care-quality-measures.html. 2016 Adult Core Set In January 2012, CMCS released its initial Adult Core Set. Section 1139B of the Social Security Act, as amended by Section 2701 of the Affordable Care Act, notes that the Secretary shall issue updates to the Adult Core Set beginning in January 2014 and annually thereafter.6, 7
2 The first update was issued via a State Health Official Letter “2013 Children’s Core Set of Health Care Quality Measures,” SHO #13-002. http://www.medicaid.gov/Federal-Policy-Guidance/downloads/SHO-13-002.pdf . The 2014 update was issued via a CMCS Informational Bulletin “2014 Updates to the Child and Adult Core Health Care Quality Measurement Sets.” http://medicaid.gov/Federal-Policy-Guidance/Downloads/CIB-12-19-13.pdf as was the “2015 Updates to the Child and Adult Health Care Quality Measurements Sets.” http://www.medicaid.gov/federal-policy-guidance/downloads/cib-12-30-2014.pdf 3 Measure steward: AHRQ-CMS CHIPRA National Collaborative for Innovation in Quality Measurement (NCINQ), Not NQF Endorsed 4 Measure steward: Centers for Disease Control and Prevention, NQF #1360 5 Measure steward: Center for Quality Improvement and Patient Safety-Agency for Healthcare Research and Quality, NQF#2548 6 The first update was issued via a CMCS Informational Bulletin “2014 Updates to the Child and Adult Core Health Care Quality Measurement Sets.” http://medicaid.gov/Federal-Policy-Guidance/Downloads/CIB-12-19-13.pdf
Mississippi Division of Medicaid DUR Board Packet (Ver:3) – January 2016 - Page 59

For the 2016 Adult Core Set update, CMCS will add two measures:
• Use of Opioids from Multiple Providers at High Dosage in Persons Without Cancer: Opioid High Dosage8
• Diabetes Screening for People With Schizophrenia or Bipolar Disorder Who Are Using Antipsychotic Medications9
The addition of these two measures allows CMCS and states to expand the measurement of quality of care in Medicaid for two population groups – adults with substance use disorders and/or mental health disorders. Additional information about the 2015 Adult Core Set MAP review process and their recommendations to CMCS can be found at: http://www.medicaid.gov/Medicaid-CHIP-Program-Information/By-Topics/Quality-of-Care/Adult-Health-Care-Quality-Measures.html Next Steps The 2016 updates to the Core Sets will take effect in the FFY 2016 reporting cycle, which will begin no later than December 2016. To support states in making these changes, CMCS will release updated technical specifications for both Core Sets in spring 2016 and make them available at: http://www.medicaid.gov/Medicaid-CHIP-Program-Information/By-Topics/Quality-of-Care/Quality-of-Care.html. States with questions or that need further assistance with reporting and quality improvement regarding the Child and Adult Core Sets can submit questions or requests to: [email protected]. If you have questions about this bulletin, please contact Marsha Lillie-Blanton, Children and Adults Health Programs Group, at [email protected].
7 The second update was issued via a CMCS Informational Bulletin “2015 Updates to the Child and Adult Core Health Care Quality Measurement Sets.”http://www.medicaid.gov/federal-policy-guidance/downloads/cib-12-30-2014.pdf 8 Measure steward: Pharmacy Quality Alliance, Not NQF Endorsed 9 Measure steward: NCQA, NQF #1932
Mississippi Division of Medicaid DUR Board Packet (Ver:3) – January 2016 - Page 60

September 30, 2015
Clinical Review: Morphine Equivalent Daily Dose to Prevent Opioid Overuse
Learning Objectives:
Define morphine equivalent daily dose (MEDD) and how it isbeing used to indicate potential dose-related risk for
prescription opioid overdose.
Describe high-risk prescribing of prescription opioids within the Medi-Cal fee-for-serviceprogram.
Summarize best practices for responsible opioid prescribing.
Key Points:
While there is no completely safe dose of opioids, MEDD can be used as an indicator ofpotential dose-related risk for adverse drug reactions, including overdose.
While there are differing opinions as to the maximum MEDD threshold that should triggeradditional action by clinicians, the Medical Board of California (MBC) recommendsproceeding cautiously once the MEDD reaches 80 mg.
In the Medi-Cal fee-for-service population, the vast majority (87%) of paid claims foropioids were well under the 80 mg MEDD threshold recommended by the MBC for ayellow flag warning.
Online MEDD calculators are available to help clinicians determine morphine milligramequivalency. These calculators are not intended for dosage conversion from one productto another, but can be used to assess the comparative potency of opioids using amorphine equivalency standard.
All providers who prescribe opioids need to enroll in and access California’s prescriptiondrug monitoring program, available on the Controlled Substance Utilization Review andEvaluation System (CURES) Web page of the Office of the Attorney General website. Inorder to be most effective, MEDD calculations need to include all opioid prescriptionswritten for a patient, including those written by other providers.
Background Each day in the United States, 46 people die from an overdose of prescription opioid or narcotic pain relievers.1 The Centers for Disease Control and Prevention (CDC) describes the followinggroups as particularly vulnerable to prescription opioid overdose: 1) people who obtain multiple controlled substance prescriptions from multiple providers; 2) those who take high daily dosages of prescription painkillers and those who misuse multiple abuse-prone prescription drugs, especially other CNS depressants, such as benzodiazepines, carisoprodol, or other sedatives; 3) low-income people and those living in rural areas; and 4) people with mental illness and/orthose with a history of substance abuse.2
Morphine Equivalent Daily Dose (MEDD) Recent studies demonstrate that a patient’s cumulative MEDD is an indicator of potential dose-related risk for adverse drug reactions to opioids, including overdose.3,4 The terminology fordaily morphine equivalency may vary depending on the resource used, and may be described as MEDD, morphine equivalent dose (MED), or morphine milligram equivalents (MME). Daily morphine milligram equivalents are used to assess comparative potency, but not to convert a particular opioid dosage from one product to another. The calculation to determine morphine milligram equivalents includes drug strength, quantity, days’ supply and a defined conversion factor unique to each drug. By converting the dose of an opioid to a morphine
APPENDIX C
Mississippi Division of Medicaid DUR Board Packet (Ver:3) – January 2016 - Page 61

equivalent dose, a clinician can determine whether a cumulative daily dose of opioids approaches an amount associated with increased risk. Online calculators are available to estimate MEDD. It should be noted again that these calculators are not intended for dosage conversion from one product to another, but only to assess the comparative potency of opioids. Furthermore, calculated morphine equivalency may vary between tools for certain drugs, depending on the algorithm used. Commonly used websites that offer MEDD calculators include the following:
Washington State Agency Medical Directors’ Group
Prescription Drug Monitoring Program Training and Technical Assistance Center (PDMP TTAC)
The New York City Department of Health and Mental Hygiene Equianalgesic dose ratios are only approximations and do not account for genetic factors, incomplete cross-tolerance between various opioids, and variable pharmacokinetics that may affect relative potency. If used to estimate a conversion, it is recommended that after calculating the appropriate conversion dose, the prescribed dose be reduced by 25 – 50% to assure patient safety.4 Compared with patients receiving an MEDD of 1 – 20 mg, who had a 0.2% annual overdose rate, patients receiving an MEDD of 100 mg or more had almost nine times as much risk of overdose and a 1.8% annual overdose rate as compared to the lowest doses.3 The CDC review of opioid prescribing and overdose found that among patients who are prescribed opioids, an estimated 80% are prescribed low doses (<100 mg MEDD) by a single provider, and these patients account for an estimated 20% of all prescription drug overdoses. Another 10% of patients are prescribed high doses (≥100 mg MEDD) of opioids by single prescribers and account for an estimated 40% of prescription opioid overdoses. The remaining 10% of patients seek care from multiple doctors, are prescribed high daily doses, and account for another 40% of opioid overdoses.5 While there are differing opinions among experts and organizations as to the maximum MEDD threshold that should trigger additional action by clinicians (Table 1), the MBC recommends proceeding cautiously (a yellow flag warning) once the MEDD reaches 80 mg.6 There is no completely safe opioid dose.
Mississippi Division of Medicaid DUR Board Packet (Ver:3) – January 2016 - Page 62

Table 1. Selected Organizations’ MEDD Thresholds and Recommended Actions
Year Organization
MEDD Threshold (mg/day)
Recommended Action at MEDD Threshold
2010 American Academy of Pain Medicine7 >200 Increase frequency and intensity of monitoring
2010 Utah State Clinical Guidelines8 >120 – 200 Increase clinical vigilance 2010 Veterans Affairs/Department of
Defense9 >200 Refer or consult
2010, 2015
Washington State Agency Medical Directors’ Group
4 >120 Consult from pain management
expert 2011 Canadian Guidelines10 >200 Reassess or monitor 2011, 2014
American College of Occupational and Environmental Medicine11
≥50 Follow up frequently; document improved function
2011 New York City Department of Health and Mental Hygiene12
>100 Reassess pain status or consider other approaches
2012 American Society of Interventional Pain Physicians13
>91 Consider pain management consultation
2012 Centers for Medicare and Medicaid Services14
>120 Consider case management
2014 Medical Board of California6 ≥80 Proceed cautiously and consider referral to specialist when higher doses are contemplated
2015 California Division of Workers’ Compensation15
≥80 Increase clinical monitoring, consider specialty referral, attempt to wean to lower dose.
In addition, as of federal fiscal year 2013 (FFY 2013), nine state Medicaid programs reported having an established policy with a recommended maximum MEDD (Table 2).16 Table 2. State Medicaid Drug Use Review (DUR) Programs with Established Recommendations for Maximum MEDD
State
MEDD Threshold (mg/day) Additional Information
Delaware 120 All long-acting opioids require prior authorization. The total dose for all narcotic therapy must be <120 mg MEDD.
Kansas 200 Massachusetts 360 Individual dose limits for each opioid were determined based on
utilization trends. Maine 30 Prior authorization is required for any dose over 30mg;
maximum allowable dose 300 mg Michigan 30 North Carolina 750 Maximum allowable dose Oregon 120 Washington 120 Based on Agency Medical Directors Association Interagency
Guidelines Wyoming 120
Both Massachusetts and Washington have described in detail the impact of implementing an established policy and predetermined maximum MEDD threshold for triggering a detailed patient review.17,18 Massachusetts defined a specific maximum MEDD for oxycodone, fentanyl, morphine,
Mississippi Division of Medicaid DUR Board Packet (Ver:3) – January 2016 - Page 63

and methadone (they selected two standard deviations outside the mean dose noted in their drug utilization review). In addition to requiring prior authorization for the specified dose, a multidisciplinary team including a physician, pharmacist, and behavioral specialist reviewed high-dose utilization profiles every two weeks. The team participated in phone interventions for clarification of prior authorization requests, treatment care plans, or specific restrictions. Over a three-year period (2002 – 2005), the number of unique utilizers decreased by 17.8% (p <0.0001) and the number of claims by 4.1% (p <0.0001).17 Claims for oxycodone decreased by 34.9% and claims for fentanyl decreased by 25%.17
In 2007, the Washington State Agency Medical Directors’ Group, which represents all public payers in Washington, developed a collaborative interagency guideline on opioid dosing (updated in June 2015).4 The guideline recommends that at an MEDD of 120 mg providers must obtain consultation from a pain medicine expert for patients whose pain and function have not substantially improved as a result of opioid treatment. An evaluation of the impact of the guideline was conducted through 2010, and showed the number of prescriptions for Schedule II opioids plateaued during 2006 – 2008, then declined sharply in 2009 and 2010.7 The total number of paid prescriptions for Schedule III opioids had peaked in 1999 (93,550), then declined through 2008 (79,882), 2009 (63,808) and 2010 (52,499).7 The average MEDD among beneficiaries declined from a peak of 144.7 in 2002 to 105 in 2010.18 MEDD in the Medi-Cal Fee-For-Service Population A retrospective cohort study was conducted to calculate the MEDD for all paid pharmacy claims for prescription opioid medications in the Medi-Cal fee-for-service population (dates of service between July 1, 2014, and June 30, 2015). The National Drug Code (NDC), days supply, and drug quantity fields were extracted from Medi-Cal pharmacy claims data and matched (via NDC) to the drug strength and MME conversion factor using the Morphine Equivalent Calculator Tool developed by the PDMP TTAC at Brandeis University, in collaboration with the CDC. The following equation was used to calculate MEDD:
(Drug Strength) x (Drug Quantity) x (MME Conversion Factor)
(Days Supply) All instructions for MEDD calculation were followed using the technical assistance guide provided by the PDMP TTAC.19 An additional analysis was performed on a subset of Medi-Cal fee-for-service beneficiaries who were continuously eligible in the Medi-Cal fee-for-service program between January 1, 2015, and June 30, 2015, and who had at least one paid claim for a prescription opioid medication between April 1, 2015, and June 30, 2015 (the measurement period). Medical and pharmacy claims data were reviewed for all beneficiaries in the study population with a calculated cumulative morphine equivalent dose >120 mg for at least one day during the measurement period. Data fields specifying diagnostic codes and place of service were extracted from medical claims data and were used to identify those beneficiaries in the study population who had a primary or secondary diagnosis of cancer and/or who were receiving hospice care. Descriptive statistics were used to summarize MEDD values and claims data. Data analyses were performed using IBM® SPSS®, version 23.0 (Chicago, IL). Results Between July 1, 2014, and June 30, 2105, a total of 529,681 paid pharmacy claims for prescription opioid medications were filled by a total of 262,017 Medi-Cal fee-for-service beneficiaries. The summary of paid claims exceeding MEDD thresholds of 80 mg, 100 mg, and 120 mg for all paid claims is shown in Table 3. Also shown in Table 3 is the distribution among a subset of paid claims with a days supply >14 days, as over half (56%) of all paid claims for opioids between July 1, 2014, and June 30, 2015, were for a days supply ≤7 days.
Mississippi Division of Medicaid DUR Board Packet (Ver:3) – January 2016 - Page 64

Table 3. Total Paid Claims Exceeding Recommended MEDD Thresholds in the Medi-Cal Fee-For-Service Population (Dates of Service Between July 1, 2014, and June 30, 2015)
Recommended MEDD Thresholds
>80 mg/day >100 mg/day >120 mg/day
Total paid claims (n = 529,681)
71,236 (13.4%) 58,741 (11.1%) 47,769 (9.0%)
Total paid claims >14 days supply (n = 237,106)
62,596 (26.4%) 54,060 (22.8%) 43,865 (18.5%)
The vast majority of paid claims for opioids were well under the 80 mg/day threshold recommended by the MBC for a yellow flag warning (87% of all paid claims and 74% of paid claims >14 days supply). However, during one year there were 47,769 paid claims identified that exceeded 120 mg MEDD. As the CDC identified people who obtain multiple controlled substance prescriptions from multiple providers as one of the high-risk groups for opioid overdose, a summary of the total number of prescribers and pharmacies is shown in Table 4 for all Medi-Cal fee-for-service beneficiaries who had a paid claim for an opioid during that same year. Table 4. Crosstabulation of Total Prescribers and Total Pharmacies for Opioid Paid Claims in the Medi-Cal Fee-For-Service Population (Dates of Service Between July 1, 2014, and June 30, 2015)
Total Utilizing Beneficiaries (n = 262,017)
Total Pharmacies
1 2 3 4 5 – 9 10+
Total Prescribers
1 208,071 8,131 886 129 24 0 2 18,113 13,079 1,434 269 66 0 3 2,952 3,104 1,467 288 113 0 4 648 790 533 249 102 1
5-9 300 403 365 241 208 7 10+ 2 5 3 5 22 7
The majority of these beneficiaries (n = 208,071; 79%) had only one paid claim for a prescription opioid medication during this one-year period. However, a total of 3,611 beneficiaries (1%) had paid claims for opioids from three or more prescribers and filled these claims at three or more pharmacies. A total of 22,505 beneficiaries were included in an analysis of cumulative MEDD. Each of these beneficiaries was continuously eligible in the Medi-Cal fee-for-service program between January 1, 2015, and June 30, 2015, and had at least one paid claim for a prescription opioid medication between April 1, 2015, and June 30, 2015. This 90-day window was selected in order to identify the distribution of beneficiaries who exceeded a cumulative total of >120 mg MEDD for at least one of those days, and to identify beneficiaries who exceeded >120 mg MEDD for the entire 90 days, which would make this group at high-risk for overdose due to sustained high-dose opioid use over time. As shown in Table 5, a total of 3,904 beneficiaries (17%) were identified in this group with at least one day out of 90 that exceeded >120 mg cumulative MEDD. Results are stratified by those who had a primary or secondary diagnosis of cancer and/or who were receiving hospice care, and those who did not have a primary or secondary diagnosis of cancer and no indication of hospice care in the medical claims data.
Mississippi Division of Medicaid DUR Board Packet (Ver:3) – January 2016 - Page 65

Table 5. Summary of Medi-Cal Fee-For-Service Beneficiaries Days >120 mg Cumulative MEDD (Dates of Service Between April 1, 2015, and June 30, 2015)
Days with MEDD >120 mg
Cancer/Hospice (n = 1,306)
Non-cancer/ Non-hospice (n = 21,199)
Total (n = 22,505)
0 1,078 (83%) 17,523 (83%) 18,601 (83%) ≥1 228 (17%) 3,676 (17%) 3,904 (17%) ≥2 225 (17%) 3,648 (17%) 3,873 (17%) ≥3 223 (17%) 3,593 (17%) 3,816 (17%) ≥10 217 (17%) 3,467 (16%) 3,684 (16%) ≥30 178 (14%) 2,778 (13%) 2,956 (13%) ≥60 120 (9%) 1,900 (9%) 2,020 (9%) ≥90 65 (5%) 963 (5%) 1,028 (5%)
Of the 1,028 beneficiaries that exceeded >120 mg cumulative MEDD for all 90 days, almost half (n = 410; 40%) had only one prescriber and one pharmacy for all opioid claims, while 49 beneficiaries (5%) had paid claims for opioids from three or more prescribers and filled these claims at three or more pharmacies. There was no statistically significant difference between the number of days that exceeded >120 mg cumulative MEDD when stratified by cancer/hospice status. Conclusion/Discussion While there is no completely safe dose of opioids, the ability to calculate morphine equivalent dose adds an additional assessment tool to combat potential opioid overdose and/or overuse. Federal and state agencies should provide guidelines and instructions for calculation of MEDD and promote case management and, as needed, referrals to appropriate pain specialists as higher doses of opioids are considered. Finally, all providers who prescribe opioids need to enroll in and access California’s prescription drug monitoring program, CURES. In order to be most effective, MEDD calculations need to include all opioid prescriptions written for a patient, including those written by other providers. Clinical Recommendations
Review materials and resources for preventing prescription drug abuse available through the California State Board of Pharmacy, Medical Board of California, and the California Department of Public Health.
Weigh the benefits and risks of opioid therapy, especially for opioid therapy when alternative treatments are ineffective.
Discuss with patients the risks and benefits of pain treatment options, including those that do not involve prescription painkillers.
Follow best practices for responsible opioid prescribing, including:
Consult CURES initially and at every subsequent visit
Conduct a physical exam, urine drug test, and document pain history prior to prescribing opioids
Screen for substance abuse, mental health problems, and other physical conditions that are contraindicated for opioid use
Advise against concomitant use of alcohol, sedatives, and hypnotics
Implement pain treatment agreements
Mississippi Division of Medicaid DUR Board Packet (Ver:3) – January 2016 - Page 66

Prescribe the lowest effective dose of short-acting opioid producing analgesia and improved function (no more than 80 mg MEDD) in a limited supply with no refills
Regularly evaluate the role of opioid therapy beyond 3 months for non-cancer chronic pain
Use tapering (not abrupt cessation) to discontinue or reduce dose of opioids
Track and document levels of pain and function at every visit
Exercise vigilance at high doses
Consider prescribing naloxone as a rescue medication in the event of a potentially life-threatening overdose and instruct caregivers on proper use and administration. For detailed information on dosing and administration of naloxone, please go to the Prescribe to Prevent website
Enroll in and access CURES reports to establish whether or not an individual is receiving controlled substances from multiple prescribers. The CURES report should be requested frequently for patients who are being treated for pain and/or addiction.
References
1. Centers for Disease Control and Prevention. Vital signs: opioid painkiller prescribing. July 2014. Available at: http://www.cdc.gov/vitalsigns/pdf/2014-07-vitalsigns.pdf. Accessed: August 13, 2015.
2. Centers for Disease Control and Prevention. Policy impact: prescription painkiller overdoses. Available at: http://www.cdc.gov/drugoverdose/pdf/policyimpact-prescriptionpainkillerod-a.pdf. Accessed: August 13, 2015.
3. Dunn KM, Saunders KW, Rutter CM, et al. Opioid prescriptions for chronic pain and overdose: a cohort study. Ann Intern Med. 2010;152(2):85-92. Available at: http://www.ncbi.nlm.nih.gov/pmc/articles/PMC3000551/pdf/ukmss-32216.pdf. Accessed: August 13, 2015.
4. Washington State Agency Medical Directors’ Group. Interagency guideline on prescribing opioids for pain. June 2015. Available at: http://www.agencymeddirectors.wa.gov/Files/2015AMDGOpioidGuideline.pdf. Accessed: August 13, 2015.
5. Centers for Disease Control and Prevention. Public health grand rounds: prescription drug overdoses - a U.S. epidemic. MMWR. 2012;61(01):10-13. Available at: http://www.cdc.gov/mmwr/pdf/wk/mm6101.pdf. Accessed: August 13, 2015.
6. Medical Board of California. Guidelines for prescribing controlled substances for pain. November 2014. Available at: http://www.mbc.ca.gov/licensees/prescribing/pain_guidelines.pdf. Accessed: August 13, 2015.
7. Chou R, Fanciullo GJ, et al. Clinical guidelines for the use of chronic opioid therapy in chronic noncancer pain. J Pain. 2009 Feb;10(2):113-30. Available at: http://www.ncbi.nlm.nih.gov/pmc/articles/PMC4043401/pdf/nihms-578614.pdf. Accessed: August 13, 2015.
8. Utah Department of Health. Utah clinical guidelines on prescribing opioids for treatment of pain. 2009. Available at: http://health.utah.gov/prescription/pdf/guidelines/final.04.09opioidGuidlines.pdf. Accessed: August 13, 2015.
Mississippi Division of Medicaid DUR Board Packet (Ver:3) – January 2016 - Page 67

9. Department of Veterans Affairs and Department of Defense. VA/DoD clinical practice guideline for management of opioid therapy for chronic pain. May 2010. Available at: http://www.va.gov/painmanagement/docs/cpg_opioidtherapy_fulltext.pdf. Accessed: August 13, 2015.
10. National Opioid Use Guideline Group (NOUGG). Canadian guidelines for safe and effective use of opioids for chronic non-cancer pain. April 2010. Available at: http://nationalpaincentre.mcmaster.ca/documents/opioid_guideline_part_b_v5_6.pdf. Accessed: August 13, 2015.
11. American College of Occupational and Environmental Medicine. ACOEM's Occupational Medicine Practice Guidelines. Westminster, CO: Reed Group, Ltd.; 2014.
12. New York City Department of Health and Mental Hygiene. Preventing misuse of prescription opioid drugs. December 2011. Available at: http://www.nyc.gov/html/doh/downloads/pdf/chi/chi30-4.pdf. Accessed: August 13, 2015.
13. Manchikanti L, Abdi S, Atluri S, et al. American Society of Interventional Pain Physicians (ASIPP) guidelines for responsible opioid prescribing in chronic non-cancer pain: Part I-evidence assessment. Pain Physician. 2012;15(suppl 3):S1–S65. Available at: http://www.painphysicianjournal.com/current/pdf?article=MTcwMg%3D%3D&journal=68. Accessed: August 13, 2015.
14. Centers for Medicare and Medicaid Services. Supplemental guidance related to improving drug utilization review controls in Part D. September 2012. Available at: https://www.cms.gov/Medicare/Prescription-Drug-Coverage/PrescriptionDrugCovContra/Downloads/HPMSSupplementalGuidanceRelated-toImprovingDURcontrols.pdf. Accessed: August 13, 2015.
15. California Division of Workers’ Compensation. Proposed Opioid Treatment Guidelines MTUS, 8. C.C.R. §9792.24.4, July 2015. Available at: http://www.dir.ca.gov/dwc/DWCPropRegs/MTUS-Opioids-ChronicPain/Opioids-Guidelines.pdf. Accessed: August 28, 2015.
16. Centers for Medicare and Medicaid Services. Medicaid drug utilization review state comparison/summary report FFY 2013 annual report. December 2014. Available at: http://www.medicaid.gov/medicaid-chip-program-information/by-topics/benefits/prescription-drugs/downloads/dur-survey-comparison-report-2013.pdf. Accessed: August 13, 2015.
17. Garcia MM, Angelini MC, et al. Implementation of an Opioid Management Initiative by a State Medicaid Program. J Manag Care Spec Pharm. 2014 May;20(5):447-54. Available at: http://www.amcp.org/WorkArea/DownloadAsset.aspx?id=18020. Accessed: August 13, 2015.
18. Franklin GM, Mai J, et al. Bending the prescription opioid dosing and mortality curves: impact of the Washington State opioid dosing guideline. Am J Ind Med. 2012 Apr;55(4):325-31. Available at: http://onlinelibrary.wiley.com/doi/10.1002/ajim.21998/epdf. Accessed: August 13, 2015.
19. Prescription Drug Monitoring Program Training and Technical Assistance Center. Technical assistance guide no. 02-13. Morphine milligram equivalents calculator. Available at: http://www.pdmpassist.org/pdf/bja_performance_measure_aid_mme_conversion_tool.pdf. Accessed: August 13, 2015.
Mississippi Division of Medicaid DUR Board Packet (Ver:3) – January 2016 - Page 68

CDC Guideline for Prescribing Opioids for Chronic Pain — United States, 2016
Listed below are the 12 major recommendations in the proposed guidelines. Detailed information, the clinical background and rationale for each recommendation can be found in the full report.
http://www.regulations.gov/#!documentDetail;D=CDC-2015-0112-0002
Determining When to Initiate or Continue Opioids for Chronic Pain
1. Nonpharmacologic therapy and nonopioid pharmacologic therapy are preferred forchronic pain. Providers should only consider adding opioid therapy if expected benefits forboth pain and function are anticipated to outweigh risks to the patient (recommendationcategory: A, evidence type 3).
2. Before starting opioid therapy for chronic pain, providers should establish treatmentgoals with all patients, including realistic goals for pain and function. Providers shouldnot initiate opioid therapy without consideration of how therapy will be discontinued ifunsuccessful. Providers should continue opioid therapy only if there is clinicallymeaningful improvement in pain and function that outweighs risks to patient safety(recommendation category: A, evidence type: 4).
3. Before starting and periodically during opioid therapy, providers should discuss withpatients known risks and realistic benefits of opioid therapy and patient and providerresponsibilities for managing therapy (recommendation category: A, evidence type: 3).
Opioid Selection, Dosage, Duration, Follow-Up, and Discontinuation
4. When starting opioid therapy for chronic pain, providers should prescribe immediate-release opioids instead of extended-release/long-acting (ER/LA) opioids (recommendation category: A, evidence type: 4).
5. When opioids are started, providers should prescribe the lowest effective dosage.Providers should use caution when prescribing opioids at any dosage, should implement additional precautions when increasing dosage to ≥50 morphine milligram equivalents (MME)/day, and should generally avoid increasing dosage to ≥90 MME/ day (recommendation category: A, evidence type: 3).
APPENDIX D
Mississippi Division of Medicaid DUR Board Packet (Ver:3) – January 2016 - Page 69

6. Long-term opioid use often begins with treatment of acute pain. When opioids are used for acute pain, providers should prescribe the lowest effective dose of immediate-release opioids and should prescribe no greater quantity than needed for the expected duration of pain severe enough to require opioids. Three or fewer days usually will be sufficient for most nontraumatic pain not related to major surgery (recommendation category: A, evidence type: 4).
7. Providers should evaluate benefits and harms with patients within 1 to 4 weeks of starting opioid therapy for chronic pain or of dose escalation. Providers should evaluate benefits and harms of continued therapy with patients every 3 months or more frequently. If benefits do not outweigh harms of continued opioid therapy, providers should work with patients to reduce opioid dosage and to discontinue opioids (recommendation category: A, evidence type: 4).
Assessing Risk and Addressing Harms of Opioid Use
8. Before starting and periodically during continuation of opioid therapy, providers should
evaluate risk factors for opioid-related harms. Providers should incorporate into the management plan strategies to mitigate risk, including considering offering naloxone when factors that increase risk for opioid overdose, such as history of overdose, history of substance use disorder, or higher opioid dosages (≥50 MME), are present (recommendation category: A, evidence type: 4).
9. Providers should review the patient’s history of controlled substance prescriptions using state prescription drug monitoring program (PDMP) data to determine whether the patient is receiving high opioid dosages or dangerous combinations that put him or her at high risk for overdose. Providers should review PDMP data when starting opioid therapy for chronic pain and periodically during opioid therapy for chronic pain, ranging from every prescription to every 3 months (recommendation category: A, evidence type: 4).
10. When prescribing opioids for chronic pain, providers should use urine drug testing before starting opioid therapy and consider urine drug testing at least annually to assess for prescribed medications as well as other controlled prescription drugs and illicit drugs (recommendation category: B, evidence type: 4).
11. Providers should avoid prescribing opioid pain medication for patients receiving
benzodiazepines whenever possible (recommendation category: A, evidence type: 3).
Mississippi Division of Medicaid DUR Board Packet (Ver:3) – January 2016 - Page 70

12. Providers should offer or arrange evidence-based treatment (usually medication-assisted treatment with buprenorphine or methadone in combination with behavioral therapies) for patients with opioid use disorder (recommendation category: A, evidence type: 3).
Mississippi Division of Medicaid DUR Board Packet (Ver:3) – January 2016 - Page 71
http://informahealthcare.com/adaISSN: 0095-2990 (print), 1097-9891 (electronic)
Am J Drug Alcohol Abuse, 2015; 41(1): 1–6! 2015 Informa Healthcare USA, Inc. DOI: 10.3109/00952990.2014.988339
PERSPECTIVE
Strategies aimed at controlling misuse and abuse of opioid prescriptionmedications in a state Medicaid program: a policymaker’s perspective
Shellie L. Keast, PharmD, PhD1, Nancy Nesser, PharmD, JD
2, and Kevin Farmer, PhD1
1University of Oklahoma College of Pharmacy, Department of Pharmacy: Clinical and Administrative Sciences, Oklahoma City, Oklahoma, USA and2Oklahoma Health Care Authority, Oklahoma City, Oklahoma, USA
Abstract
Society in America, like many others, continues to wrestle with the problem of misuse andabuse of prescription opioids. The implications of this struggle are widespread and involvemany individuals and institutions including healthcare policymakers. State Medicaid pharmacyprograms, in particular, undergo significant scrutiny of their programs to curtail this problem.While recent efforts have been made by government agencies to both quantify and offermethods for curbing this issue, it still falls to each state’s policymakers to protect its resourcesand the population it serves from the consequences of misuse and abuse. This paper details thehistory of one state Medicaid’s management of this issue at the pharmacy benefit level.Examples of various methods employed and the results are outlined and commentary isprovided for each method. Regardless of the methods used to address this issue, the problemmust still be a priority at all levels, not just for payers.
Keywords
Health spending, healthcare policy, Medicaid,opioid abuse, prescription diversion, publichealth, state issues, substance abuse
History
Received 6 June 2014Revised 7 November 2014Accepted 10 November 2014Published online 8 December 2014
Introduction
The Centers for Medicare and Medicaid Services (CMS)
stated in January 2012 that state Medicaid programs are
seeing increases in drug diversion (defined as:‘‘diversion of
licit drugs for illicit purposes’’) (1). Diversion is a form of
prescription drug abuse. Use of prescription drugs for reasons
other than originally intended or by persons other than for
whom prescribed can be considered misuse and abuse. This
struggle with misuse and abuse of prescription opioids is not
new. The problem is societal in nature, with implications for
all entities from individuals to governments. The source and
payment of prescription products abused makes prescription
opioid misuse and abuse unique compared to other types of
illicit drug use (2). Though theft is one way for prescription
drugs to end up ‘‘on the street’’, diversion through normal
distribution channels also occurs. When such diversion
occurs, payment for the prescription products is often through
legitimate third party payers such as commercial or govern-
ment-sponsored insurance, like Medicaid or Medicare (1). In
a study by McAdam-Marx et al., costs for Medicaid patients
with abuse/dependence-related diagnoses were higher than
costs for patients without a related diagnosis. The authors
suggest interventions targeted at preventing abuse and
managing comorbidities in these patients can reduce costs
and potential abuse (3).
Suggested methods for intervention were proposed by Katz
et al. based on a meeting sponsored by Tufts Health Care
Institute Program on Opioid Risk Management. Proposed
methods included pharmacy and prescriber controls, promo-
tion of abuse-deterrent opioid products, monitoring of
prescription claims, data sharing among insurance providers,
and promoting strategies at the provider level to reduce risk of
abuse (2).
Over the past 10 years, Oklahoma Medicaid (MOK) has
considered misuse and abuse of prescription narcotics a
priority area of concern. At least nine unique prescription
policies for opioid products were recommended by the Drug
Utilization Review (DUR) Board and implemented by the
Oklahoma Health Care Authority (OHCA)with the goal of
decreasing misuse and abuse of opioids. The objective of this
paper was to discuss the historical steps which MOK has
taken to limit potential misuse and abuse of opioids.
Review of Oklahoma Medicaid policies
The policies that the DUR Board developed for OHCA’s
SoonerCare pharmacy benefit program are listed inTable 1 and
discussed further below. Each policy has an alphabetical
identifier which correlates with the graph in Figure 1. This
figure demonstrates the trend in opioid prescription claims
over time. The vertical lines on Figure 1 indicate the points of
policy implementation.
Address correspondence to Shellie Keast, Assistant Professor, ORI-W4403, PO Box 26901, Oklahoma City, Oklahoma 73126-0901, USA.Tel: +1 (405) 2718222. Fax: +1 (405) 2716602. E-mail: [email protected]
Dow
nloa
ded
by [1
70.2
53.1
64.2
2] a
t 05:
24 3
0 Se
ptem
ber 2
015
APPENDIX E
Mississippi Division of Medicaid DUR Board Packet (Ver:3) – January 2016 - Page 72

Quantity limits
Total quantity allowed on a single prescription claim is a
standard control measure used by pharmacy benefit managers
to reduce over-utilization across therapeutic categories in
their programs. The limit is typically set based on maximum
daily dosage or duration approved by the Food and Drug
Administration (FDA). The first opioid products given
quantity limits by MOK were butorphanol nasal spray,
fentanyl transdermal and oral products, hydromorphone,
methadone, meperidine, and oxycodone immediate and
controlled-release products in October 2003 (Table 1,
Identifier A). Quantity limits were applied to other products
in subsequent years until all opioid products were included
(Table 1, Identifier G).
Pharmacy Lock-In program
Lock-In programs, common to all Medicaid and some
commercial insurance plans, typically function by creating a
prescription gatekeeper for beneficiaries who are deemed to
have potential for misuse of their prescription benefits based
on their prescription and medical services utilization history.
Most programs include at minimum a restriction to a single
pharmacy for these beneficiaries and may include a single
physician source that also controls access to other health care
services. A few states restrict members to a specific hospital
for emergency services. While the research regarding the
effectiveness of these programs is limited, the states
which studied their effect found reductions in opioid utiliza-
tion (4–6).
MOK transferred the responsibility for the program to their
DUR vendor in January 2006 (Table 1, Identifier B). An
evaluation of the program found mean monthly opioid
prescriptions were reduced after a beneficiary was locked-in
to a single pharmacy, with no apparent effect on non-opioid
related medications (7). The results of the analysis indicated
the average per member per month (PMPM) number of opioid
prescription claims decreased by 0.09 (p50.0001) while
there was no statistically significant change in the PMPM for
the number of medications considered by the MOK DUR
Board as maintenance for chronic disease states (Figure 1,
Identifier B). However, this study was unable to determine if
the Lock-In program changed actual behavior outside of the
patients’ Medicaid prescription usage because the program
administrators were not authorized to review the Oklahoma
Prescription Drug Monitoring Program (PDMP) data, a
barrier which remains. Even though dispensers of controlled
substances are required to report details of the transaction to
the PDMP within 5minutes, it does not change prescribing
when a practitioner is not routinely checking the PDMP (8,9).
Prior authorization programs
Several prior authorizations (PA) of single opioid prescription
products were implemented (Table 1, Identifiers C, I, and K).
The PA process for MOK typically consists of manual
requests initiated by the physician or pharmacy for the
Table 1. List of Oklahoma SoonerCare policy implementations and dates.
Identifier* Date Policy category Products or action
A October 2003 Quantity limits Fentanyl, hydromorphone, methadone, merperidine, and oxycodone(additional quantity limits added over time)
B January 2006 Pharmacy Lock-In program Intensification of previous ‘Lock-In’ managementC April 2006 Prior authorization Applied to tramadol productsD November 2007 ProDUR Restriction of hydrocodone to 1 claim per day supplyE July 2008 Step therapy program Step therapy (3 tiers and oncology-only tier)F August 2009 ProDUR Hydrocodone ingredient duplicationG October 2009 Quantity limit Applied to all narcotic/acetaminophen combination productsH August 2010 Prescription limit Hydrocodone limited to 13 prescriptions per 360 day periodI May 2011 Prior authorization Applied to buprenorphineJ July 2011 Prescriber restrictions Removal of non-contracted prescribersK March 2013 Prior authorization Branded oxymorphone extended-release preferred over new generic
productL March 2013 Age restrictions Applied to liquid and solid opioid dosage forms
*Each letter corresponds to the date of initial implementation on Figure 1.
Figure 1. Opioid prescription claims perutilizer per month. Each letter correspondsto a policy listed in Table 1.
1.15
1.2
1.25
1.3
1.35
1.4
1.45
1.5
1.55
2003
-01
2003
-05
2003
-09
2004
-01
2004
-05
2004
-09
2005
-01
2005
-05
2005
-09
2006
-01
2006
-05
2006
-09
2007
-01
2007
-05
2007
-09
2008
-01
2008
-05
2008
-09
2009
-01
2009
-05
2009
-09
2010
-01
2010
-05
2010
-09
2011
-01
2011
-05
2011
-09
2012
-01
2012
-05
2012
-09
2013
-01
2013
-05
Cla
ims
Per
Util
izer
Per
Mon
th
A BC FG H I JD E K, L
Months
2 S. L. Keast et al. Am J Drug Alcohol Abuse, 2015; 41(1): 1–6
Dow
nloa
ded
by [1
70.2
53.1
64.2
2] a
t 05:
24 3
0 Se
ptem
ber 2
015
Mississippi Division of Medicaid DUR Board Packet (Ver:3) – January 2016 - Page 73
prescribed product after the prescription claim is denied
at point-of-sale (POS). Individual products included were
tramadol extended-release (C), buprenorphine (I), and generic
oxymorphone extended-release (K).
Step therapy programs
Step therapy programs are PA programs which MOK utilizes
for entire classes of medications. These programs require the
use of products designated as first step before use of second or
third step products. An example is requiring use of immedi-
ate-release generic opioid medications in opioid-naı̈ve
patients before moving to extended-release products. Step
therapy programs can use manual or automated (computer
generated) approvals for products placed on ‘‘higher’’ steps.
Step therapy was implemented on the entire class of opioid
prescription products in July 2008 (Table 1, Identifier E). The
intent of this step therapy was increased use of short-term
immediate release products for acute pain situations and
breakthrough therapy for chronic pain situations and reserving
long-acting opioids for opioid tolerant patients. Preferred
long-acting generic products were established as the second
step before patients were allowed to move to the third step of
non-preferred long-acting brand products. Preferred and non-
preferred short-acting categories were also established.
This policy resulted in a reduction in utilization of second
and third step products (10); however, research was not
performed to measure other possible outcomes such as an
increase in overall short-acting use over preferred long-acting
products.
Prospective drug utilization review
MOK first used Prospective DUR POS programming in 2007
to limit prescriptions for hydrocodone to one claim per day
supply, thus allowing a patient to have only one prescription
for a hydrocodone containing product at a time (Table 1,
Identifier D). In 2009, MOK implemented a second
Prospective DUR ingredient duplication which examines
prescription claims as they are submitted for hydrocodone-
containing products and reviews each patient’s medication
profile to determine if hydrocodone products from previous
prescription claims are still available to the patient (Table 1,
Identifier F). If a duplication of hydrocodone is found, then
the new claim rejects at POS and an override is required for
claim payment. This POS programming resulted in approxi-
mately 70 000 denied claims in the first year (11). However, it
is unknown if pharmacies dispensed these products to the
patients as cash transactions.
Limit on number of prescriptions
An additional POS programming method was implemented
based on the number of hydrocodone prescriptions filled
during a 360-day period (Table 1, Identifier H). This
programming limits patients to 13 prescriptions per year
unless authorization is granted and resulted in just over 28 000
denied prescription claims for hydrocodone the first reporting
year after implementation (12). Again, it is not known
whether patients received the prescriptions on a cash basis
from the dispensing pharmacies.
Preferred brand prior authorization
Recently a preferred brand PAwas initiated for the new abuse-
deterrent formulation of oxymorphone extended-release (Table
1, Identifier K). Abuse-deterrent products are formulated to
decrease the likelihood of abuse by targeting known or
potential routes for each specific product. This PA restricts
lower-cost generic versions of the original brand product and
allows only use of the new abuse-deterrent brand. There has not
been sufficient time to determine if this policy will result in
decreased misuse of oxymorphone in the MOK population.
Age restrictions
A final POS programming method was implemented on
opioid products based on the patient’s age (Table 1, Identifier
L). These age restrictions were placed on products containing
hydrocodone and allow the liquid formulations for use by
children and the solid oral products for use by adolescents and
adults. The objective of this policy was to limit the more
costly liquid formulations to the most appropriate age group.
Exceptions are allowed for members with physical disabilities
who require non-solid dosage forms.
Prescriber contract requirement
Previously, prescriptions written by any licensed prescriber
could be covered by the MOK pharmacy benefit. However, as
part of compliance with the Affordable Care Act (ACA), in
2011, MOK restricted payment of pharmacy claims to those
written by prescribers contracted to serve MOK
members(Table 1, Identifier J). The rationale for the contract
requirement was based on patterns noticed by states and CMS
of narcotic utilization by members with prescriptions written
by non-contracted prescribers. If the prescriber was not
contracted and thus not being paid by the Medicaid agencies
for office visits, they must have been charging patients
directly for services. Additionally, prescribers were under no
obligation to comply with agency policy or submit patient
records upon request.
Discussion
Oklahoma was in the highest category of state prescription
drug overdose age-adjusted death rates in 2008 (15.8 per
100 000 compared to the national average of 11.9 per
100 000) (13). Faced with the significant issue of opioid
abuse in the state, policymakers through MOK have attempted
to curb misuse by implementing various policies over time
within the pharmacy benefit. The number of different policies
enacted by MOK reflects efforts to curtail misuse and abuse
without interference where high utilization of opioid products
may be medically appropriate. Although it is not within the
scope of this report to determine if these efforts had an overall
effect on the state, it is interesting to highlight some changes
in mortality rates in Oklahoma. According to a report in 2013
by the Oklahoma Department of Health, unintentional
poisoning mortality rates for Oklahoma increased signifi-
cantly over the US average from 1999–2010. Oklahoma also
saw an increase in the number of prescribed opioids during
this time period and prescription opioids remained the most
common product listed in unintentional poisoning deaths.
DOI: 10.3109/00952990.2014.988339 Strategies to control prescription opioid abuse 3
Dow
nloa
ded
by [1
70.2
53.1
64.2
2] a
t 05:
24 3
0 Se
ptem
ber 2
015
Mississippi Division of Medicaid DUR Board Packet (Ver:3) – January 2016 - Page 74

And although mortality rates increased for all ages over the
entire time period reported, it can be noted that there was an
increase from 16.0 in 2007 to 17.7 in 2009 but a subsequent
decrease in the rate to 17.2 by 2011. Likewise, there was a
decrease in the number of deaths attributed to prescription
drugs from 2009–2011 (14). Unfortunately while heroin
appears to be an increasing issue of concern nationally (15),
Oklahoma currently is not able to clearly distinguish heroin
deaths from other morphine-related deaths and it is unclear
whether heroin use is replacing prescription opioid use in
Oklahoma as it is in other areas of the US.
MOK, in conjunction with its DUR Board, believes that
misuse and abuse of these substances is an important societal
issue and should be confronted at all intersections of the lives
of these individuals, not just at an insurer level. Reaching
patients before misuse and abuse occurs is vital. However,
MOK has implemented and continues to implement policies
which are intended to limit potential misuse and abuse while
providing good stewardship of resources and maintaining
positive health outcomes.
Programmatic implications of policy changes
For MOK, basic restrictions such as quantity limits, number of
prescriptions, and limits based on age, may be most effective in
terms of reducing numbers of paid prescription claims for
products. While these restrictions are not difficult to imple-
ment, maintain, and operate, they do result in additional
questions to call centers and higher PA or claim override
volumes. These restrictions also place a higher burden on
physicians and pharmacies if they wish to move forward with
payment of the prescription claim by MOK. An additional
limitation of these programs occurs when the dispensing
pharmacy simply instructs the patient that the prescription is
not covered by MOK and does not attempt to receive
reimbursement by MOK for potentially legitimate claims.
The result is patients not receiving necessary prescriptions or
patients paying out-of-pocket for appropriate opioid prescrip-
tions. PAs and step therapy programs are more complicated to
implement and maintain, with step therapy being the most
difficult to continually monitor. They also generate higher
numbers of phone calls and PA requests. For instance, when the
step therapy program was implemented, the number of prior
authorizations for opioid products increased from approxi-
mately 100 requests monthly to 400 requests monthly. The
current average number of requests for this category for all
reasons is 650 per month. Based on a recent analysis of
OHCA’s prior authorization program, the cost for each PA in
Oklahoma is $12.50 (lower than the national benchmark) (16).
If implemented today, the step therapy program would have
cost the state an additional $3750 per month. A simple PA on a
single product such as buprenorphine typically requires a
manual review and approval for all initial prescription requests.
Products which are placed in step therapy typically have
automated pathways which are processed at POS by the claims
processing software. Of these two methods, the manual PA
process typically results in the highest reduction in approved
prescription claims due to the review by clinical pharmacists.
Automated approvals are limited to more explicit criteria and
do not allow for clinical judgment.
Outcome evidence from policy implementation
Some first efforts at curbing misuse in the Medicaid system
were the Lock-In programs. As early as 1977, Singleton
published a review of the effects of state Lock-In programs,
reporting that the Missouri Medicaid Lock-In program may
have reduced the 1976 state Medicaid budget by 1.7% (or $1.8
million) (5). The Hawaii Medicaid Lock-In program esti-
mated a total of $909 992 in saving for 1983 (4). And a review
by Blake in 1999 of the Louisiana Medicaid Lock-In program
showed reductions in multiple pharmacies, poly-pharmacy,
opioid analgesics and overall pharmacy expenditures (6).
Lock-In programs have appeared once again on the national
radar. In August 2012, the Center for Disease Control and
Prevention (CDC) convened an expert panel to discuss
‘‘Medicaid Patient Review and Restriction (PRR)’’ (or Lock-
In) programs. The final report issued after this panel meeting
concluded that PRRs are important programs to reduce
accidental deaths, particularly for Medicaid patients (17). In
December 2012, researchers at the University of California,
Davis prepared a report for the CDC which evaluated the cost
and health impacts of PRR programs. A tool was developed
that simulated patterns of opioid use and evaluated the results
of different restriction policies on health outcomes and costs.
The goal is to allow state policy makers to improve their
decision making using evidence-based information and
allow specific state reviews of current or proposed PRR
programs (19).
Finally, the preferred brand PA is a new area for
consideration. Medicaid programs may achieve lower net
costs for brand name drugs than generics when one of the
following situations occurs:
(1) Brand product has a high federally mandated rebate
which renders the net cost below that of the generic; or
(2) Brand product has a sufficient supplemental rebate from
the drug manufacturer paid directly to the state which
renders the net product cost below that of the generic.
These situations typically occur when only one manufac-
turer’s generic is available on the market; however these
situations might also arise when multiple manufacturers’
products are available. However in the case of the preferred
brand for oxymorphone extended-release, the policy imple-
mentation is based on the expectation that the new abuse-
deterrent formulation will decrease misuse and abuse of the
product. The result of this new ‘‘experimental’’ policy
requires further review.
As previously mentioned under Lock-In programs, MOK
under current state law does not have the legal authority to
examine and review the PDMP data. Only providers of care
(prescribers and pharmacies) and law enforcement officials
have access to PDMP data. This creates a significant
hindrance in attempts to evaluate programmatic initiatives
to impact abuse and misuse outside of MOK financial
responsibility for these prescriptions. From a public health
perspective, the goal of program initiatives is to improve the
health of plan members by decreasing or eliminating opioid
abuse, not to just avoid financial responsibility for abuse.
Access to the PDMP would allow MOK and other payers to
coordinate monitoring and treatment activities with
4 S. L. Keast et al. Am J Drug Alcohol Abuse, 2015; 41(1): 1–6
Dow
nloa
ded
by [1
70.2
53.1
64.2
2] a
t 05:
24 3
0 Se
ptem
ber 2
015
Mississippi Division of Medicaid DUR Board Packet (Ver:3) – January 2016 - Page 75

prescribers and pharmacies even when patients elected to pay
cash and avoid plan oversight.
Figure 1 displays the opioid prescription claims per utilizer
per month (PUPM) from January 2003 through June 2013.
PUPM is a measure based on the number of enrollees who
utilize the benefit; this number is a subset of the entire
enrolled population. Several events affected the total popu-
lation of MOK during the time period, including carve-in of a
managed care program (January 2004) and carve-out of dually
eligible Medicare beneficiaries as a result of Medicare Part D
(January 2006). However, by reviewing the claim PUPM for
opioids, the effect of the changes in the overall utilizer base is
reduced. Upon review, the most noticeable change in the trend
is the drop in claims PUPM after the step therapy program
was initiated in July 2008.
While not all of the policies MOK implemented over the
years were evaluated either for safety and effectiveness or for
cost savings, several were. The Prospective DUR duplication
of hydrocodone-containing products was estimated to have an
annualized cost avoidance of $325 755 (2010 US$) (11). The
hydrocodone annual prescription limit was estimated to have
an annualized cost avoidance of $83 823 (2011 US$) (12).
Overall, the Lock-In program was estimated to have an annual
cost reduction of $606 (2006 US$) per locked-in member per
month (7). Finally, the restriction of prescribers to those
contracted with OHCA, resulted in a decrease of 6% in overall
opioid prescription claims (19).
Efforts at limiting misuse and abuse of opioid prescriptions
are necessary regardless of payer type. Not only do misuse and
abuse of opioid prescriptions contribute to rising healthcare
costs, but unchecked misuse and abuse will ultimately lead to
addiction for the patient, and/or to fraud on the part of the
patient and possibly the provider. Currently MOK is planning
to review more of its policies for opioid prescription misuse
and abuse. It is hoped that the policy preferring the abuse-
deterrent formulation will result in a slower uptake of the
generic product by those seeking to misuse it. Although the
step therapy program shifted market share from the highest tier
to the lower tiers, concern remains over whether this program
may have increased use of short-acting opioid products.
According to CMS, opioid abuse and diversion is a leading
problem faced by all state Medicaid programs (1). In a study
done in Kentucky by Manchikanti et al. on 400 patients
treated at a pain management clinic, when compared to
commercial insurance, Medicare only, and Medicare and
Medicaid (dually eligible), those in the Medicaid-only group
had the highest percentage of patients with illicit drug use
(39%). Additionally, the Medicaid-only group had the highest
combined rate of both illicit drug use and inappropriate use of
prescription drugs (60%) (20). CMS partners with the Drug
Enforcement Agency (DEA) and state agencies to promote
appropriate use of opioid prescriptions. A law enacted in
October 2008 established a ‘‘tamper-resistant’’ prescription
paper policy for all non-electronic prescriptions written for
Medicaid outpatient drugs. Further, the ACA includes add-
itional measures which can be used to combat abuse. These
new measures are: ‘‘establish enhanced oversight for new
providers, establish periods of enrollment moratoria or other
limits on providers identified as being high risk for fraud and
abuse, establish enhanced provider screening, and require
states to suspend payment when there is a credible allegation
of fraud which may include evidence of overprescribing by
doctors, overutilization by recipients, or questionable medical
necessity’’ (1). CMS also promotes measures which states can
incorporate to detect abuse: using retrospective DUR
processes to identify potential patterns of abuse, improving
prospective DUR screenings at POS for high opioid doses or
potential overuse, reviewing prescriptions written at pain
management clinics, searching for fraud across programs,
forming collaborative workgroups with other state agencies
and neighboring states, using PDMPs, developing new or
enhanced Medicaid patient Lock-In programs, promoting the
national ‘‘Take-Back’’ campaign, and encouraging both
providers and patients to take appropriate steps to safeguard
their identities (1).
Recommendations
Any payer contemplating actions similar to MOK should
carefully consider the potential for increased work load to
their current staff and the overall healthcare system when
planning their policies. In general, each of the policies
implemented by MOK achieved the desired result in the short
term. It is the experience of these policymakers that as one
product or sub-category is identified and acted upon, another
quickly takes its place. Therefore it is not enough to simply
implement a policy and consider this complicated problem
solved. Simultaneous implementation of multiple policies
may have a higher initial effect on opioid utilization; however,
as with most policies, these effects may be greatest in the
shortterm. And while policies may seem to meet short-term
goals, review of the outcomes for unintended clinical
consequences should also occur (21).
The current epidemic should be addressed on the patient
level in areas unrelated to prescription utilization. Payers
should ensure that addiction treatment and counseling services
are readily available and affordable. Nationally, programs
should continue encouraging people to seek help or encoura-
ging family members to seek help for loved ones. Most people
do not plan to become physically and psychologically addicted
to prescription pain medications and should not face stigma
when seeking treatment.
Payers should address the provider side of this epidemic.
Analysis of physician prescribing patterns is necessary to
control misuse and abuse of opioid prescription drugs. When
prescribing patterns are reviewed in combination with a
thorough physician peer quality panel assessment, a higher
impact on prescribing may be possible. State boards of
medical licensure must become more active in monitoring
narcotic prescribing patterns and in providing assistance as
well as disciplinary measures when needed. Information
provided by payers should be used by physicians to review
and revise their prescribing habits, and not assumed to be
punitive or invasive. Only by working together can we prevent
serious problems before they arise.
Regardless of the nature of policies for deterring misuse
and abuse of opioid prescription drugs, it is imperative that
these efforts continue and results from these policies be
shared across payer types. To that end, the CDC and the
National Institutes of Health – National Institute on Drug
DOI: 10.3109/00952990.2014.988339 Strategies to control prescription opioid abuse 5
Dow
nloa
ded
by [1
70.2
53.1
64.2
2] a
t 05:
24 3
0 Se
ptem
ber 2
015
Mississippi Division of Medicaid DUR Board Packet (Ver:3) – January 2016 - Page 76

Abuse (NIH-NIDA) are currently funding research to deter-
mine the impact of policies such as those outlined above on
inappropriate prescribing of opioids (22).
Conclusions
Despite multiple efforts currently in effect for the pharmacy
benefit, misuse and abuse of prescription opioids continues.
As health plans, regulatory agencies, and law enforcement
officials introduce more complex countermeasures, a thor-
ough review of new policies should be performed to
determine their effectiveness so others may adopt successful
policies and avoid poor or overly expensive options. With new
abuse-deterrent formulations for long-acting products coming
to market, real-world evaluations are needed to determine
whether these products effectively reduce misuse, or simply
divert users to other drugs of abuse. Only by continued
combined effort to treat not only abuse, but also to intervene
before more devastating consequences occur, can we begin to
conquer this serious social problem which touches us all.
Declaration of interest
The authors report no conflicts of interest. The authors alone
are responsible for the content and writing of this paper.
References
1. Drug Diversion in the Medicaid Program State Strategies forReducing Prescription Drug Diversion in Medicaid. In: Center forMedicare and Medicaid Services; 2012.
2. Katz NP, Birnbaum H, Brennen MJ, Freedman JD, Gilmore GP, JayD, Kenna GA, et al. Prescription opioid abuse: challenges andopportunities for payers. Am J Managed Care 2013;19:295–302.
3. McAdam-Marx C, Roland CL, Cleveland J, Oderda GM. Costs ofopioid abuse and misuse determined from a Medicaid database.J Pain Palliative Care Pharmacother 2010;24:5–18.
4. Chinn FJ. Medicaid recipient lock-in program – Hawaii’s experi-ence in six years. Hawaii Med J 1985;44:9–18.
5. Singleton TE. Missouri’s Lock-In:control of recipient misutiliza-tion. J Medicaid Manage 1977;1:10–17.
6. Blake S. The effect of the Louisiana Medicaid lock-in onprescription drug utilization and expenditures. Drug BenefitTrends 1999;11:45–55.
7. Keast SL. Lock-In program evaluation. Oklahoma City, OK:Oklahoma Health Care Authority; 2008.
8. Prescription Monitoring Program (PMP). Oklahoma Bureauof Narcotis and Dangerous Drugs Control. Available from:http://www.ok.gov/obndd/Prescription_Monitoring_Program/. [lastaccessed 25 Feb 2014].
9. Oklahoma State Bureau of Narcotics and Dangerous Drugs Control.In: Rules OSOoA, ed. 475:45-1-5. Oklahoma; 2011.
10. Annual Review of Narcotic Analgesics – Fiscal Year 2009:Oklahoma Health Care Authority; 2009.
11. Oklahoma Medicaid Drug Utilization Review Annual Report –Federal Fiscal Year 2010: Okahoma Health Care Authority; 2011.
12. Oklahoma Medicaid Drug Utilization Review Annual Report –Federal Fiscal Year 2011: Oklahoma Health Care Authority; 2012.
13. Policy impact: prescription drug overdose state rates; Center forDisease Control and Prevention, 2011. Available from: http://www.cdc.gov/HomeandRecreationalSafety/rxbrief/states.html [lastaccessed 15 Aug 2013].
14. Nguyen C, Wendling T, Brown S. Unintentional poisoning deathsin Oklahoma, 2007–2011. Oklahoma City, OK: Injury PreventionService Oklahoma State Department of Health; 2013.
15. Massatti R, Beeghly C, Hall O, Kariisa M, Potts L. Increasingheroin overdoses in Ohio: understanding the issue. Columbus, OH:Ohio Department of Mental Health and Addiction Services; 2014.
16. Independent Review of the SoonerCare Pharmacy Benefit andManagement. Oklahoma City, OK: Mercer Health and BenefitsLLC; 14 April 2014.
17. CDC Expert Panel Meeting Report. Patient Review and RestrictionPrograms Lessons learned from state Medicaid programs: Centersfor Disease Control and Prevention (CDC) December 9, 2013.
18. Melnikow J, Yang Z, Soulsby M, Ritley D, Kizer K. Approaches toDrug Overdose Prevention Analytical Tool (ADOPT): evaluatingcost and health impacts of a Medicaid Patient Review & RestrictionProgram: Center for Healthcare Policy and Research; Dec 2012.
19. Oklahoma Health Care Authority. Internal Report: UtilizationReview of Narcotic Prescribing. 2012.
20. Manchikanti L, Fellows B, Damron KS, Pampati V, McManus CD.Prevalence of illicit drug use among individuals with chronic painin the Commonwealth of Kentucky: an evaluation of patterns andtrends. J Kentucky Med Assoc 2005;103:55–62.
21. Soumerai SB. Benefits and risks of increasing restrictions onaccess to costly drugs in Medicaid. Health Affairs 2004;23:135–146.
22. RFA-CE-14-002 Research to prevent prescription drug overdoses.Centers for Disease Control and Prevention – Department of Healthand Human Services. Available from:http://www.grants.gov/web/grants/view-opportunity.html?oppId¼249388 [last accessed 27 Feb2014].
6 S. L. Keast et al. Am J Drug Alcohol Abuse, 2015; 41(1): 1–6
Dow
nloa
ded
by [1
70.2
53.1
64.2
2] a
t 05:
24 3
0 Se
ptem
ber 2
015
Mississippi Division of Medicaid DUR Board Packet (Ver:3) – January 2016 - Page 77