dla reform and pip - tower hamlets 1 dla reform and pip summary disability living allowance (dla) is...
TRANSCRIPT
Page 1
DLA reform and PIP
Summary Disability Living Allowance (DLA) is designed to help children and adults, who have a long term illness or disability, with the extra costs incurred by their condition. In 2013, the Government began phasing out DLA for people of working age and replacing it with a new benefit called Personal Independence Payment (PIP). This briefing presents early evidence on the emerging impacts of PIP in Tower Hamlets. Key points:
In May 2014, 11,270 residents were receiving DLA in Tower Hamlets. Of these, 7,370 claimants were aged 16-64 (4 per cent of the working age population), the group currently in scope for PIP.
1,780 children across the borough receive DLA – 3 per cent of the child population. Children receiving DLA will come into scope for PIP as they approach 16.
The DLA claim rate rises by age. The percentage of adults receiving DLA rises from under 2 per cent of those aged 16-34 up to 14 per cent of those aged 55 to 64. The claim rate for older residents is higher in Tower Hamlets than nationally (14 vs. 9 per cent).
Almost half (47 per cent) of all working age DLA claimants have mental or behavioural disorders as their primary condition, this includes 25 per cent with psychosis and 10 per cent with learning difficulties. A further 23 per cent have musculoskeletal conditions and 10 per cent have neurological conditions.
Almost three quarters (72 per cent) of the DLA population have been claiming DLA for 5 or more years.
Currently, the majority (82 per cent) of claimants in Tower Hamlets receive both the care and mobility award components of DLA. Around one third (32 per cent) of claimants receive the care award at the lower rate - the award rate being phased out with the move to PIP. The average DLA award is £80.21 per week.
DLA and PIP act as potential gateways to a range of other benefits and concessions, including Carer’s Allowance. Entitlement can also help secure a higher level of various means tested benefits, including the forthcoming Universal Credit.
Contents
Introduction ....................................................... 3
A profile of DLA claimants in Tower Hamlets ... 4
DLA claimants by age....................................... 4
DLA claimants by gender ................................. 4
DLA claims by duration .................................... 6
DLA claims by condition ................................... 6
DLA care and mobility awards .......................... 8
DLA and other benefits ..................................... 9
DLA and PIP: passported & related benefits .. 11
DLA and PIP compared .................................. 13
The PIP roll out in Tower Hamlets .................. 14
PIP claimants by award type .......................... 16
DLA re-assessments: outcomes data ............. 18
Evidence about PIP roll out in practice ........... 19
Waiting times .................................................. 19
Conclusions .................................................... 21
Research Briefing 2015-01
March 2015
Summary (continued)
Page 2
It is estimated that around 4 out of every 5 working age DLA claimants also claim other ‘incapacity-related benefits’ such as Employment and Support Allowance. This means many claimants who will be subject to re-assessment under PIP, will have already been, or will be, subject to the ESA assessment process.
PIP was rolled out nationally in June 2013 for all new working age claimants. Over the period June 2013 to January 2015, 3,040 claims for PIP had been registered in Tower Hamlets, but less than two thirds - 1,870 claims - had been processed (ie a decision made). National evidence on waiting times suggests delays of 6 months for a decision are not uncommon.
In Tower Hamlets, 52 per cent of all PIP decisions led to a successful award, compared with 54 per cent nationally.
The latest data show that 977 residents were receiving PIP as at January 2015. Most (94 per cent) PIP claimants were receiving the daily living award, which replaces the DLA care component and 61 per cent were receiving a mobility award.
These early data indicate that, compared with the profile of the existing DLA claimant population, new PIP claimants are less likely to secure help with mobility costs. This is consistent with widespread criticism that the new assessment rules for the mobility award are too stringent. However, as claimant numbers are still fairly low, it is too early to know if these patterns will persist as the roll out continues.
In 2013, DWP started re-assessments of some DLA claimants under the PIP regime. These have been selective, and as yet, none have taken place in London. Of those undertaken nationally, 79 per cent of decisions to date have led to a successful PIP award.
If Tower Hamlets re-assessment award rates turn out be similar to those nationally,
one in five DLA claimants – around 1,500 claimants – could potentially lose benefit, as well as loss of any related benefits or concessions. It is likely those on lower rates of DLA will be most at risk of losing some, or indeed all, of their benefit.
The first independent review of PIP has highlighted a range of problems in relation to how PIP assessments are working in practice. These include:
significant backlogs in the assessment and decision making process resulting in long delays in payments, with knock on impacts for passported benefits;
problems with the ‘claimant journey’ itself which was described as disjointed;
poor communications & administration.
The proportion of registered claims that have been cleared to date is lower in Tower Hamlets than nationally (62 vs. 77 per cent). Indeed, assessment backlogs have been so severe in areas like London (covered by contractor Atos), that the Government decided to postpone the next stage of the roll out in these areas till contractor performance was improved.
CAB, in its evidence to the review, concluded that PIP is not yet fit for purpose and highlighted the increasing numbers requiring advice and support to navigate the PIP process. Nationally, PIP is now the second most common benefits issue clients need support with, after ESA.
The Government’s aim was to reduce spending by 20 per cent through the introduction of PIP. However, the Office for Budget Responsibility, has recently commented that initial award rates are higher than had been originally predicted, so it is unlikely that the Government will make the savings it originally intended through DLA reform.

DLA reform and the move to PIP: emerging impacts
Page 3
Introduction This briefing presents early evidence on the emerging and potential impacts of Disability Living Allowance (DLA) reform in Tower Hamlets through the introduction of the new Personal Independence Payment (PIP). DLA is designed to help children and adults, who have a long term illness or disability, with the extra costs incurred by their condition. DLA is not taxable and is not means tested, and is payable to those in and out of work. The DLA assessment process measures an individual’s care and mobility needs, and uses this as a proxy for the extra costs faced. The Government is phasing out DLA for people of working age and replacing it with a new benefit called Personal Independence Payment (PIP). This process started for new claimants in 2013 and will take some years to complete. A key feature of PIP was the introduction of ‘objective’ medical tests, carried out by external contractors, to assess eligibility. The PIP roll out has been significantly delayed, and currently, DWP estimates that re-assessments will continue till 2018. DWP spending on DLA in Tower Hamlets currently totals around £47 million per year, of which, approximately £29 million is spent on working age claimants1. The Government aims to reduce forecast DLA spending by 20 per cent through the introduction of PIP and has stated that resources will be targeted to those in most need. Various disability advocacy groups have highlighted concerns in relation to the introduction of PIP, not least that deficit reduction - rather than ensuring that disabled people get the right support – will drive the reform and assessment process2
.
To assess the potential impacts of these changes in Tower Hamlets, this report presents the following evidence:
A profile of the DLA claimant population in the borough;
A review of other benefits and concessions that DLA claimants receive;
Early statistics relating to the PIP roll out in Tower Hamlets;
A review of how PIP is working in practice; PIP is in its very early stages, so this report aims to present what is known so far. It is recognised that this picture will inevitably change as the roll out progresses, and the intention is to update this report annually, as more evidence emerges.
1 Source: DWP Statistical and Accounting Data, Benefit Expenditure by local authority, 2000/01 to 2013/14
2 Hardest Hit Coalition , The Tipping Point: The human and economic cost of cutting disabled people’s
support, (October 2012);

DLA reform and the move to PIP: emerging impacts
Page 4
A profile of DLA claimants in Tower Hamlets DLA claimants by age DLA can be claimed by children and adults aged up to 64. Those who are receiving DLA at age 64 can continue to claim as they get older, as long as the initial claim was made before the age of 65, and they continue to meet eligibility criteria. In May 2014, 11,270 residents were receiving Disability Living Allowance in Tower Hamlets. Of these, 7,370 DLA claimants were aged 16-64 (4 per cent of the working age population). This is the age group currently in scope for the PIP roll out. Currently, 1,780 children across the borough receive DLA – around 3 per cent of the child population. Children receiving DLA will come into scope for PIP as they approach 16. Within the working age group, the DLA claim rate rises by age (Table 1). The percentage of the borough’s population who receive DLA rises from under 2 per cent for those aged 16-34 up to 14 per cent for those aged 55 to 64. The claim rate for older residents is higher in Tower Hamlets than nationally (14 vs. 9 per cent for the 55-64 age group). These patterns are consistent with the higher prevalence of disability and health problems among older people. Around 13 per cent of all those aged 65 and over receive DLA. The Government has not ruled out expanding PIP to other age groups in the longer term. DLA claimants by gender Overall, the percentage of women and men receiving DLA is the same (4 per cent for all ages), but there are significant gender differences by age. Among children and young adults, claim rates are higher for males, while amongst the older population, claim rates are higher for females. The gender differential is particularly pronounced for children: boys are twice as likely as girls to receive DLA (4 vs. 2 per cent). Among those aged 45-64, claim rates are higher for women than men (12 vs. 9 per cent). The remainder of this report focuses on the working age group3. DLA claimants: Tower Hamlets and Great Britain compared The percentage of working age residents claiming DLA in Tower Hamlets is a bit lower than that nationally (3.7 vs. 4.8 per cent), however, this masks considerable differentials by age (Figure 1). Claim rates for those aged 45 and over are far higher in Tower Hamlets than nationally: 11 per cent of residents aged 45-64 receive DLA in Tower Hamlets compared with 7 per cent nationally. However, because the borough has a younger age profile than Great Britain, and proportionately fewer residents in the 45-64 age group, the claim rate for the whole working age population in the borough remains lower.
3 Statistics in this report for the working age group relate to two different definitions, depending on where the
data are sourced from. These are a) those aged 16 up to just below state pension age (which is currently around 62/63 for women and 64 for men) and b) those aged 16-64. For this reason, claimant totals relating to the latter definition are slightly higher than the former.
DLA reform and the move to PIP: emerging impacts
Page 5
Table 1 DLA claimants by age and gender, Tower Hamlets, May 2014
Composition of DLA
caseload
% rates (Claimants as % of population in each age group)
Claimants % Total Total Male Female
All ages 11,270 100
4.1 4.2 4.1
0-15 1,780 16 3.2 4.3 2.1
16-24 750 7 1.9 2.4 1.5
25-34 1,090 10 1.4 1.5 1.2
35-44 1,410 13 3.4 3.3 3.4
45-54 2,040 18 8.5 7.5 9.7
55-64 2,080 18 13.5 12.4 14.9
Aged 65 and over 2,120 19 12.8 12.0 13.4
Working age: 16-64 7,370 65 3.7 3.6 3.7
All aged 45-64 4,120 37 10.5 9.3 11.8
All aged 45 and over 6,240 55 11.1 10.0 12.4
Source: DWP (via NOMIS), ONS Mid-year estimates 2013 (used as base to derive rates)
Figure 1: DLA claim rates by age, Tower Hamlets and Great Britain, May 2014
Table 2 DLA claimants aged 16-64 by duration of claim, Tower Hamlets & Great Britain, May 2014 Tower Hamlets
Great Britain
DLA claimants % total DLA claimants % total
Total 7,370 100 1,919,850 100
Up to a year 20 <1 4,410 <1
1 year and up to 2 years 540 7 125,550 7
2 years and up to 5 years 1,490 20 329,350 17
5 years and over 5,330 72 1,460,530 76 Source: DWP (via NOMIS, WPLS)

DLA reform and the move to PIP: emerging impacts
Page 6
DLA claims by duration and fixed term awards DLA is aimed at residents with long term conditions and claims are typically lengthy in duration. Almost three quarters of the borough’s working age claimants have been claiming DLA for 5 or more years, similar to the picture nationally (72 and 76 per cent respectively). Table 2. DLA can be awarded indefinitely or for a fixed period. DWP survey estimates4, for November 2012, suggest that around 29 per cent of DLA claims in Tower Hamlets were fixed term awards. When PIP is rolled out to DLA claimants in the borough, those with fixed term awards will be invited to apply for DLA first. Under PIP, all claims (except terminal illness related claims) will be time limited with additional reviews set at regular periods, and there are no indefinite awards. DLA claims by condition Table 3 shows the breakdown of DLA claims by type of condition for the working age population. The data are limited in that they only record primary condition and fail to capture multiple conditions. However, they do serve to illustrate the diverse range of disabilities and health problems that DLA aims to cover. Almost half (47 per cent) of all working age DLA claimants have mental or behavioural disorders as their primary condition, this includes 25 per cent with psychosis and 10 per cent with learning difficulties. Almost one quarter (23 per cent) have musculoskeletal conditions (eg paraplegia, diseases of the muscles, bones and joints). A further 10 per cent have neurological conditions (eg multiple sclerosis, epilepsy). Tower Hamlets has a higher proportion of DLA claimants with mental health problems than nationally, driven by a significantly higher percentage of claimants with some form of psychosis (25 vs.13 per cent nationally). Conditions with automatic entitlement to DLA Under DLA rules, certain conditions lead to an automatic DLA award, without assessment. These are:
• Severe mental impairment • Double amputee
• Deaf/blind • Haemodialysis
• Severely visually impaired • Special rules for terminal illness Under PIP, there is no longer any automatic entitlement for people with these conditions (though special rules for those who are terminally ill will remain in place). This is in line with the rationale behind PIP which aims to address how a person’s condition affects them, as opposed to focusing solely on the condition itself. People with these conditions currently comprise a relatively small proportion of DLA claimants. In Tower Hamlets, a total of 290 claimants5 had one of these conditions (4 per cent of working age claimants), including 40 who were terminally ill. 4 DWP, Estimates of the number of DLA Age 16-64 Fixed Term Awards in each Local Authority, November
2012. This analysis estimated that around 2,220 claimants (± 340) in Tower Hamlets had fixed term awards in November 2012, which equates to 29% of the total caseload in that age group at that time. 5 DWP statistics for May 2014 were available for 5 out of the 6 categories, and for the sixth (people with
severe visual impairments), the category blindness was used as a proxy.

DLA reform and the move to PIP: emerging impacts
Page 7
Table 3 Working age DLA claimants by main condition, Tower Hamlets, May 2014
Tower Hamlets
Great Britain
Claimants % total Claimants % total
All working age (up to SPA*) 7,030 100
1,808,900 100.0
Primary condition (broad categories)
Mental Health 3,320 47 742,820 41
Musculoskeletal 1,610 23 479,580 27
Neurological 710 10 240,150 13
Cardiovascular 160 2 41,410 2
Respiratory 160 2 48,110 3
Cancers 100 1 23,570 1
Terminally ill 40 <1 12,170 1
Other 860 12 188,300 10
Unknown 60 <1 32,770 2
Detailed condition (top 20 - Tower Hamlets)
Psychosis 1,750 25 238,960 13
Learning Difficulties 710 10 261,930 14
Arthritis 570 8 181,070 10
Psychoneurosis 560 8 146,300 8
Disease of the Muscles, Bones or Joints 390 6 102,260 6
Back pain (other/not specified) 370 5 104,180 6
Neurological Diseases 230 3 86,180 5
Blindness 200 3 43,220 2
Cerebrovascular Disease 190 3 45,770 3
Epilepsy 190 3 55,400 3
Deafness 150 2 27,080 1
Heart Disease 130 2 32,870 2
Trauma to Limbs 120 2 35,570 2
Chest Disease 110 2 32,010 2
Diabetes Mellitus 110 2 19,780 1
AIDS 110 2 7,080 0
Personality Disorder 100 1 19,920 1
Malignant Disease (Cancers) 100 1 23,570 1
Multiple Sclerosis 80 1 45,480 3
Spondylosis 70 1 31,190 2
All other conditions 780 11 269,060 15
Source: DWP (via NOMIS). Claimant numbers are rounded to nearest ten.
* Data relate to working age claimants aged 16 and up to state pension age.

DLA reform and the move to PIP: emerging impacts
Page 8
DLA care and mobility awards There are two parts to DLA: the care component and the mobility component. The care component is designed for those who need help with personal care or supervision. The mobility component is designed to help those who are unable to walk, have great difficulty walking, or need someone with them when walking in unfamiliar places outdoors. The care component is paid at three different rates (higher, middle and lower), and the mobility component is paid at two different rates (higher and lower). Claimants can receive one or both components as their DLA award. This leads to a total of 11 possible combinations of awards with DLA payments ranging from £21.80 up to £139.75 per week. Table 4 shows the different combinations of DLA awards that residents receive in Tower Hamlets. Currently, 95 per cent of claimants receive the care component, and 87 per cent receive the mobility component. The majority (82 per cent) of claimants get both. Around one third (32 per cent) of claimants receive the care award at the lower rate - the award rate being phased out with the move to PIP - and around half receive the lower rate mobility award. In total, just over two thirds (69 per cent) of all claimants receive either the lower rate of the care award and/or the lower rate mobility award. Given the Government’s stated intention to target PIP spending at those in most need, in theory, those currently on the lower DLA award rates face the highest risk of losing some, or all, of their benefit under the new assessments.
Table 4 DLA working age claimants by care and mobility award combination, Tower Hamlets, May 2014
Mobility award:
Total
Higher Rate
Lower Rate
No mobility award
Total 7,030 2,650 3,490 890
Care award:
Higher Rate 1,900 1,060 810 30
Middle Rate 2,550 730 1,640 180
Lower Rate 2,220 650 890 680
No care award 370 210 160 0
% of all claimants in each category
Total 100 38 50 13
Care award:
Higher Rate 27 15 12 <1
Middle Rate 36 10 23 3
Lower Rate 32 9 13 10
No care award 5 3 2 0
Other groupings:
All, care award, any level 6,670 95
All, mobility award, any level 6,140 87
Number who get both a care and mobility award 5,780 82
All who get either lower rate care and/or lower rate mobility 4,830 69
Source: DWP (via NOMIS). Notes: Working age relates to those who are aged 16 or over and under their state pension age.

DLA reform and the move to PIP: emerging impacts
Page 9
DLA award levels in Tower Hamlets and Great Britain compared While the overall proportion of DLA claimants receiving a mobility award is similar in Tower Hamlets and Great Britain (87 vs. 89 per cent), those in Tower Hamlets are more likely to be on the lower rate mobility award than claimants nationally (50 vs. 43 per cent). Conversely, Tower Hamlets claimants are a bit more likely to receive the higher level care award (27 vs. 24 per cent). The size of the average DLA award paid in Tower Hamlets for working age claimants, was £80.21 per week (May 2014), close to the national average (£79.69 per week6). Figure 2 Proportion of DLA claimants receiving different levels of care and mobility awards, working age claimants, Tower Hamlets and Great Britain, May 2014
DLA and other benefits While DLA is not means tested, and can be claimed by those in and out of work, in practice, the majority of working age DLA claimants rely on other benefits for their main income. Table 5 shows different combinations of ‘key’ working age benefits claimed by DLA claimants. Around one in five DLA claimants receive DLA only (ie do not claim any other key benefits), while 4 out of every 5 claim other key benefits, most of which are ‘incapacity-related benefits’. Incapacity-related benefits are designed to support those unable to work due to a health problem or disability and comprise Employment and Support Allowance, and the benefits it is replacing (Incapacity Benefit, Severe Disablement Allowance, and Income Support for disabled people). Figure 3 illustrates the significant overlap between DLA, ESA and other incapacity-related benefits. Benefit combinations are known for a total of 6,540 working age DLA claimants, and of these, it is estimated that around 78 per cent claim other incapacity-related benefits (ESA/IB/SDA). Conversely, around 42 per cent of all those claiming incapacity-related benefits also claim DLA.
6 DWP via DWP Tabulation tool. Analysis of cases in payment for working age claimants as at May 2014.
DLA reform and the move to PIP: emerging impacts
Page 10
Consequently, many DLA claimants who will be subject to re-assessments in the future under PIP, will have already been, or will be, subject to the ESA assessment process. In the longer term, DLA claimants who also receive ESA will also be in scope for Universal Credit for part of their benefit income. CPAG7 has highlighted that it has become common practice for DWP to use information from the ESA Work Capability Assessment (WCA) to inform DLA assessments in recent years. Furthermore, the recent independent review of PIP has recommended that PIP assessments should also explore how best to make use of WCA information8.
Table 5 DLA claimants by combinations of key benefits claimed, working age claimants, Tower Hamlets, May 2014
Working age=16 up to state pension age Claimants % total
All working age DLA claimants 7,030 100
DLA only 1,420 20
DLA & other key benefits 5,610 80
DLA and IB/ESA 4,310 61
DLA and SDA 40 1
DLA, SDA and IS/PC 190 3
DLA, IB and IS/PC 580 8
Other combinations not specified 490 7
Source: DWP (via NOMIS): Working Age Client Group data and DLA claimant data. Key benefits are: Disability living allowance (DLA), Employment & Support Allowance (ESA), Incapacity Benefit (IB), Severe Disablement Allowance (SDA), Jobseeker's Allowance (JSA), Income Support (IS)/Pension Credit (PC), Carer's Allowance (CA), Widow's Benefit & Bereavement benefit.
Figure 3 Overlap between working age DLA claimants and claimants of incapacity-related benefits, (where benefit combination is known), Tower Hamlets May 2014
7 CPAG, Never the twain shall meet? ESA medical reports and DLA decision making, September 2012 8 Paul Gray, An Independent Review of the Personal Independence Payment, December 2014
12,130 Claimants
on both
5,120
6,540
Source: DWP (via NOMIS), Working Age Client Group data (16-State Pension Age). * These figures exclude those on key benefits whose benefit combination was not known (980 residents). For this reason, the number of DLA claimants shown above is lower than the total presented above in Table 5.
DLA claimants* Claimants of incapacity
related benefits* (ESA/IB/SDA)
78% of DLA claimants also receive ESA/IB/SDA 42% of ESA/IB/SDA claimants also receiving DLA
DLA reform and the move to PIP: emerging impacts
Page 11
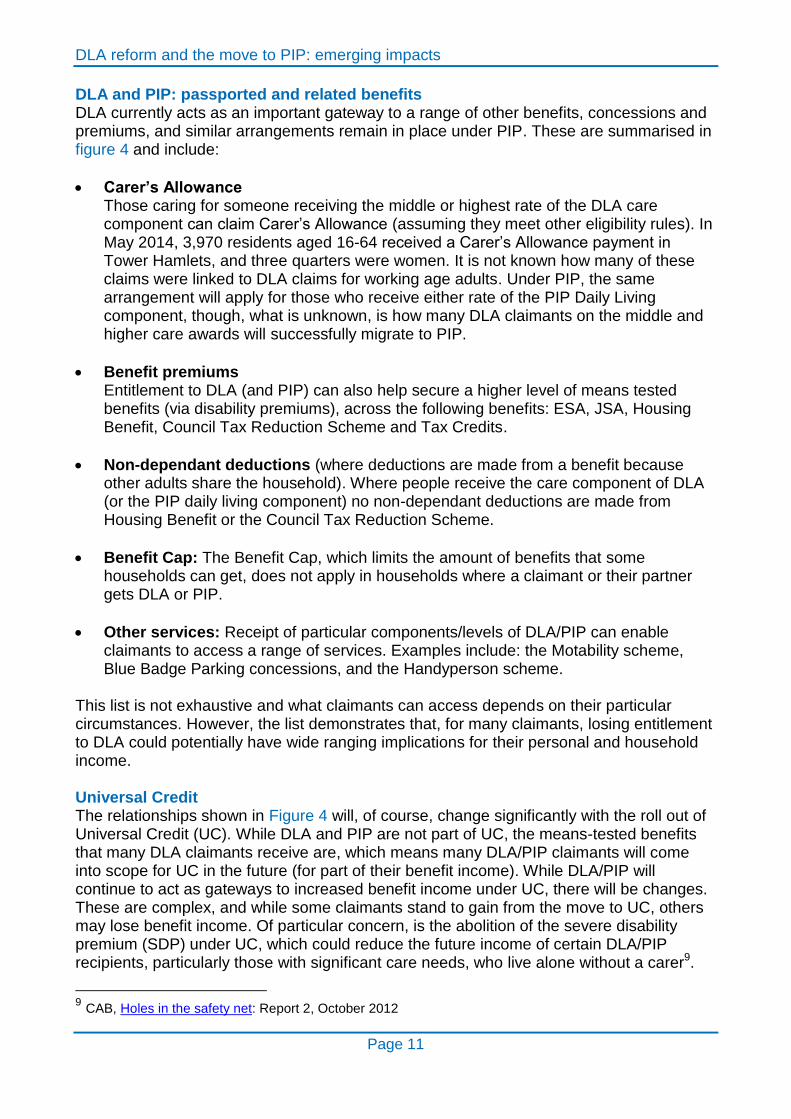
DLA and PIP: passported and related benefits DLA currently acts as an important gateway to a range of other benefits, concessions and premiums, and similar arrangements remain in place under PIP. These are summarised in figure 4 and include:
Carer’s Allowance Those caring for someone receiving the middle or highest rate of the DLA care component can claim Carer’s Allowance (assuming they meet other eligibility rules). In May 2014, 3,970 residents aged 16-64 received a Carer’s Allowance payment in Tower Hamlets, and three quarters were women. It is not known how many of these claims were linked to DLA claims for working age adults. Under PIP, the same arrangement will apply for those who receive either rate of the PIP Daily Living component, though, what is unknown, is how many DLA claimants on the middle and higher care awards will successfully migrate to PIP.
Benefit premiums Entitlement to DLA (and PIP) can also help secure a higher level of means tested benefits (via disability premiums), across the following benefits: ESA, JSA, Housing Benefit, Council Tax Reduction Scheme and Tax Credits.
Non-dependant deductions (where deductions are made from a benefit because other adults share the household). Where people receive the care component of DLA (or the PIP daily living component) no non-dependant deductions are made from Housing Benefit or the Council Tax Reduction Scheme.
Benefit Cap: The Benefit Cap, which limits the amount of benefits that some households can get, does not apply in households where a claimant or their partner gets DLA or PIP.
Other services: Receipt of particular components/levels of DLA/PIP can enable claimants to access a range of services. Examples include: the Motability scheme, Blue Badge Parking concessions, and the Handyperson scheme.
This list is not exhaustive and what claimants can access depends on their particular circumstances. However, the list demonstrates that, for many claimants, losing entitlement to DLA could potentially have wide ranging implications for their personal and household income. Universal Credit The relationships shown in Figure 4 will, of course, change significantly with the roll out of Universal Credit (UC). While DLA and PIP are not part of UC, the means-tested benefits that many DLA claimants receive are, which means many DLA/PIP claimants will come into scope for UC in the future (for part of their benefit income). While DLA/PIP will continue to act as gateways to increased benefit income under UC, there will be changes. These are complex, and while some claimants stand to gain from the move to UC, others may lose benefit income. Of particular concern, is the abolition of the severe disability premium (SDP) under UC, which could reduce the future income of certain DLA/PIP recipients, particularly those with significant care needs, who live alone without a carer9.
9 CAB, Holes in the safety net: Report 2, October 2012

DLA reform and the move to PIP: emerging impacts
Page 12
Figure 4 Current passported benefits, premia and concessions for DLA/PIP claimants (pre-Universal Credit regime)
Note: Benefit rates quoted relate to 2015-16 rates.
Benefit premiums for DLA/PIP claimants who also claim means-tested benefits People who receive DLA/PIP in conjunction with income-related benefits are eligible for one or more disability premiums. These are taken into account when determining the maximum benefit payable (£ weekly amount shown for single claimant, 2015-16 rates):
• Disability premium (£32.25); • Enhanced disability premium (£15.75); • Severe disability premium (£61.85).
The mix and size of premiums applied depends on a person’s specific DLA/PIP entitlement and their particular circumstances. Premiums apply for those receiving any of the following benefits: Income Support; Income-related ESA; Income-related JSA; Housing Benefit & Council Tax Reduction Support.
Carer’s Allowance (CA) and related premiums DLA/PIP is one of the gateways to Carer’s Allowance (for people caring for someone on the middle or highest rate of DLA care component or either rate of the PIP daily living component). Carer’s Allowance is £62.10 per week for those who qualify. In addition, people entitled to CA, who are also receiving other means-tested benefits, can also receive a carer premium of £34.60, as well as National Insurance credits. Note: in some circumstances people can be receiving both DLA/PIP for themselves and CA for caring for someone else.
Benefit Cap Exemption: The Benefit Cap won’t apply where a claimant or their partner get DLA or PIP.
Transport and other services Receipt of particular components/levels of DLA/PIP can enable claimants to access:
• Motability scheme; • Blue Badge parking concessions; • Freedom pass; • Disabled persons railcard; • Vehicle excise duty exemptions; • Taxi card (reduced fares); • Handyperson scheme (repairs, security).
Key passported benefits, premiums & concessions for working age adults receiving DLA or PIP.
Working Tax Credits DLA/PIP are qualifying benefits for the disability element of WTC. In addition, if a claimant or their partner receives the higher rate care component of DLA or the enhanced PIP daily living rate, they can claim the severe disability element of WTC. In effect, receiving one or more of these elements increases the level of the WTC award.
No non-dependant deductions Where people receive the care component of DLA (or PIP daily living component) no non-dependant deductions are made from Housing Benefit or Council Tax Reduction Scheme.

DLA reform and the move to PIP: emerging impacts
Page 13
DLA and PIP compared Like DLA, PIP is intended to provide financial support to those with long term disabilities or health problems. It is payable to those in and out of work, and is not means tested (or taxable). The PIP assessment aims to consider the impact a person’s condition has on them individually, as opposed to focusing on the condition itself. The budgetary aim of PIP is to reduce spend by one fifth by targeting resources on those most in need. Some of the key differences between the way DLA and PIP work are:
The assessment process: One of the key aims of PIP is to introduce objective assessments of need. DLA assessments were based on the claim form and supplementary evidence. Whereas, the majority of PIP assessments will be carried out by external contractors, using a points based assessment process.
The new assessment for the mobility component is considered to be far more stringent than its predecessor under DLA, in part, due to its use of a distance of 20 metres as the distance for determining entitlement to the enhanced rate of the Mobility component. This rule has attracted a lot of criticism and the DWP received over 1,100 consultation
responses on this specific issue10
. Many organisations felt that there was little evidence to show that an individual who could walk a little over 20 metres would face lower costs than an individual who could walk less than 20 metres.
Award levels: Under PIP, the care component has been replaced with the daily living component, and the lower rate has been removed, in line with the policy aim of targeting resources to those in highest need. This means there are now 8 different combinations of PIP awards as opposed to 11 under DLA. The award rates have been set to match DLA award levels (Figure 5), though the DLA lower rate of mobility is now called the standard rate under PIP.
Figure 5 DLA and PIP award rates for 2015/16
DLA award rates (weekly, £) PIP award rates (weekly, £)
Care component
Daily living component
Highest £82.30
Enhanced £82.30 Middle £55.10
Standard £55.10
Lowest £21.80
Mobility component
Mobility component Higher £57.45
Enhanced £57.45
Lower £21.80 Standard £21.80
The ‘qualifying period’ is longer under PIP: PIP claimants must meet criteria (have care/mobility needs) for at least 6 months, as opposed to 3 months for DLA (except in the case of terminal illness). Claimants are also expected to satisfy conditions for at least the next 6 months, the same rule currently applies under DLA.
Award length: As discussed earlier, unlike DLA, where many awards were for indefinite periods, all PIP awards will be time-limited and will have additional reviews within that
10
DWP, The Government’s response to the consultation on the PIP assessment Moving around activity
(October 2013).

DLA reform and the move to PIP: emerging impacts
Page 14
time period (with special rules for terminally ill claimants).
No automatic entitlements: Under DLA, people with certain medical conditions (as outlined on page 6) could qualify automatically. Under PIP, there are no automatic entitlements, except for people who are terminally ill.
The PIP roll out in Tower Hamlets The DWP has contracted Capita and Atos to carry out PIP assessments in different areas. After a very short pilot (‘controlled start’) in selected areas in April 2013, PIP was rolled out nationally for new claimants in June 2013. In London, PIP claims are being assessed by Atos. In 2013, DWP also started selective re-assessments of some existing DLA claimants under the new PIP regime. However, as yet, none have taken place in London due to significant backlogs with new claims processing in the region. At the time of writing, it was unclear as to when DLA re-assessments would begin in London areas. Figure 6 shows the total number of residents receiving PIP in Tower Hamlets since the roll out began. The numbers have risen fairly slowly, and the latest figures for the end of January 2015, indicate there are a total of 977 residents receiving PIP. However, these numbers only tell part of the story, as far larger numbers have registered for PIP, and are stuck in the claims process due to contractor backlogs. Figure 6 PIP claimants in Tower Hamlets, 2013-15
DLA reform and the move to PIP: emerging impacts
Page 15
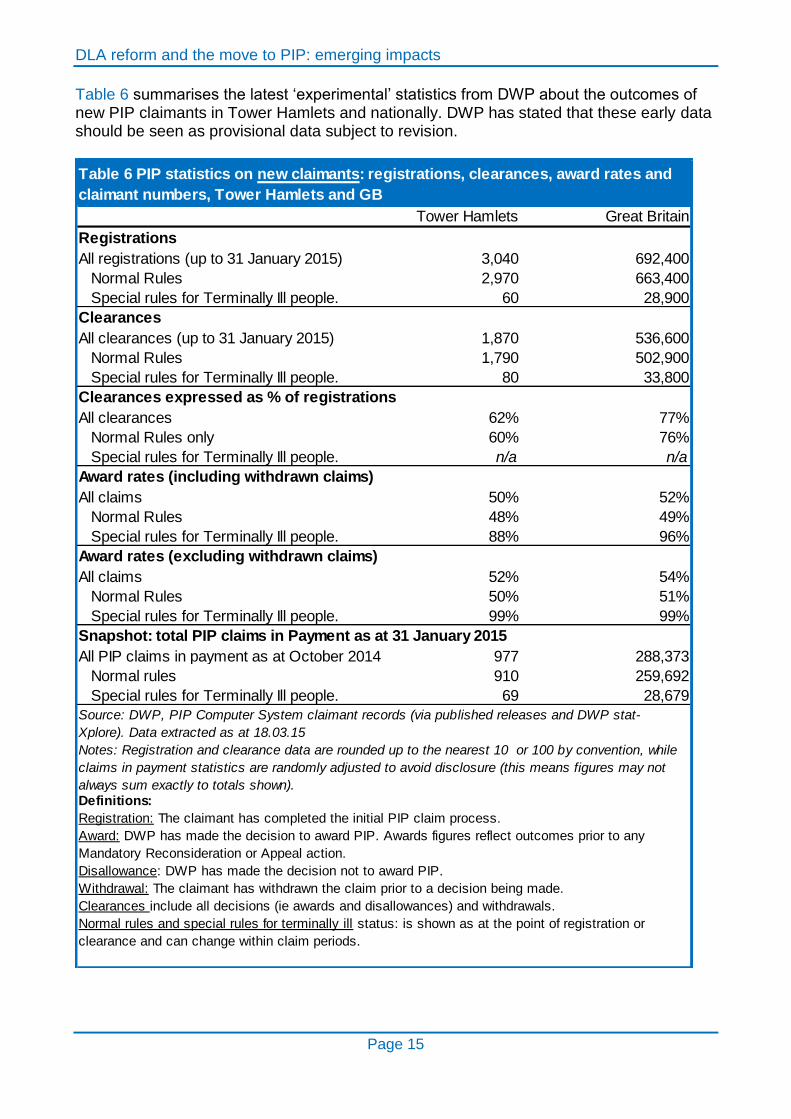
Table 6 summarises the latest ‘experimental’ statistics from DWP about the outcomes of new PIP claimants in Tower Hamlets and nationally. DWP has stated that these early data should be seen as provisional data subject to revision.
Tower Hamlets Great Britain
Registrations
All registrations (up to 31 January 2015) 3,040 692,400
Normal Rules 2,970 663,400
Special rules for Terminally Ill people. 60 28,900
Clearances
All clearances (up to 31 January 2015) 1,870 536,600
Normal Rules 1,790 502,900
Special rules for Terminally Ill people. 80 33,800
Clearances expressed as % of registrations
All clearances 62% 77%
Normal Rules only 60% 76%
Special rules for Terminally Ill people. n/a n/a
Award rates (including withdrawn claims)
All claims 50% 52%
Normal Rules 48% 49%
Special rules for Terminally Ill people. 88% 96%
Award rates (excluding withdrawn claims)
All claims 52% 54%
Normal Rules 50% 51%
Special rules for Terminally Ill people. 99% 99%
Snapshot: total PIP claims in Payment as at 31 January 2015
All PIP claims in payment as at October 2014 977 288,373
Normal rules 910 259,692
Special rules for Terminally Ill people. 69 28,679
Definitions:
Registration: The claimant has completed the initial PIP claim process.
Award: DWP has made the decision to award PIP. Awards figures reflect outcomes prior to any
Mandatory Reconsideration or Appeal action.
Disallowance: DWP has made the decision not to award PIP.
Withdrawal: The claimant has withdrawn the claim prior to a decision being made.
Clearances include all decisions (ie awards and disallowances) and withdrawals.
Normal rules and special rules for terminally ill status: is shown as at the point of registration or
clearance and can change within claim periods.
Table 6 PIP statistics on new claimants: registrations, clearances, award rates and
claimant numbers, Tower Hamlets and GB
Source: DWP, PIP Computer System claimant records (via published releases and DWP stat-
Xplore). Data extracted as at 18.03.15
Notes: Registration and clearance data are rounded up to the nearest 10 or 100 by convention, while
claims in payment statistics are randomly adjusted to avoid disclosure (this means figures may not
always sum exactly to totals shown).

DLA reform and the move to PIP: emerging impacts
Page 16
These figures indicate that over the period June 2013 and January 2015:
3,040 claims for PIP had been registered in Tower Hamlets (registration is the start of the claims process);
As yet, well under two thirds - 1,870 claims - had been cleared/processed (ie a decision made). Evidence on waiting times suggests that nationally, delays of 4-6 months for a decision have not been uncommon (see page 20 for analysis of waiting times data).
The proportion of new PIP claims registered that have been cleared to date is lower in Tower Hamlets than nationally (62 vs. 77 per cent). Indeed, clearance rates by region are lowest across London and the South East (61 and 67 per cent), which are both areas covered by the contractor, Atos. These backlogs have been so severe, that the Government decided to postpone the next stage of the roll out in these areas till performance was improved11;
Of those claims cleared, the percentage of new claim decisions that led to a successful award (the ‘award rate’) was 52 per cent in Tower Hamlets compared with 54 per cent nationally.
The latest data show that 977 residents were receiving PIP as at end of January 2015.
PIP claimants by award type Of the borough’s 977 PIP claimants: well over one third (38 per cent) had psychiatric disorders as their main condition; 28 per cent had musculoskeletal conditions; 9 per cent had neurological conditions; and 11 per cent were suffering from some form of cancer (62 per cent of those with cancer were terminally ill). In total, around seven per cent of claims (69 claimants) were made under Special Rules for Terminally Ill people. People in this category are fast tracked through the process and receive both mobility and daily living awards at the enhanced rates. Table 7 shows the new PIP population by award level. Most PIP claimants (94 per cent) were receiving the daily living award: 58 per cent were receiving the highest level of daily living award (the enhanced rate) and 36 per cent were receiving the standard award. The remaining 6 per cent were receiving a mobility award only with no daily living component. A lower percentage of claimants – 61 per cent - were receiving the mobility award under PIP, 32 per cent at the enhanced rate, and 29 per cent at the standard rate. Just over half (55 per cent) were receiving both daily living and mobility awards. If we exclude the terminally ill from the analysis, and focus only on those with claims made under ‘normal rules’, the proportion of claims made at the enhanced levels falls (from 58 to 54 per cent for daily living awards, and 32 to 27 per cent for mobility awards). Figure 7 compares the award profiles of the first tranche of new PIP claimants locally with the existing DLA population. Those PIP claimants who are terminally ill have been excluded from the analysis to enable a more meaningful comparison. This is because
11
House of Commons Committee of Public Accounts, Personal Independence Payment: First Report of Session 2014–15, June 2014

DLA reform and the move to PIP: emerging impacts
Page 17
terminally ill claimants comprise a higher proportion of the PIP new claimant population than they do of the existing DLA claimant population (7 vs.1 per cent), due to their short longevity.
Table 7 PIP Claims in Payment by award type, Tower Hamlets, January 2015
All claimants
Claimants: normal rules only
(excluding terminally ill)
Claimants % total Claimants % total
All PIP claimants 977 100
Special rules for terminally ill 69 7
Normal rules 910 93 910 100
Daily living award
All daily living award: 915 94 845 93
Daily Living: Enhanced 562 58 492 54
Daily Living: Standard 353 36 353 39
Mobility award
All mobility award 598 61 530 58
Mobility: Enhanced 316 32 248 27
Mobility: Standard 282 29 282 31
Award combinations
Daily Living only 379 39 380 42
Mobility only 62 6 65 7
Both 535 55 471 52
Both at highest award level 239 24 175 19
Source: DWP, PIP Computer System claimant records (via DWP stat-Xplore) Notes: These figures have been randomly adjusted by DWP to avoid disclosure. This means figures do not always sum exactly to the totals shown.
Figure 7 Award profile: Existing DLA claimants and new PIP claimants compared, Tower Hamlets, 2014-15
DLA reform and the move to PIP: emerging impacts
Page 18
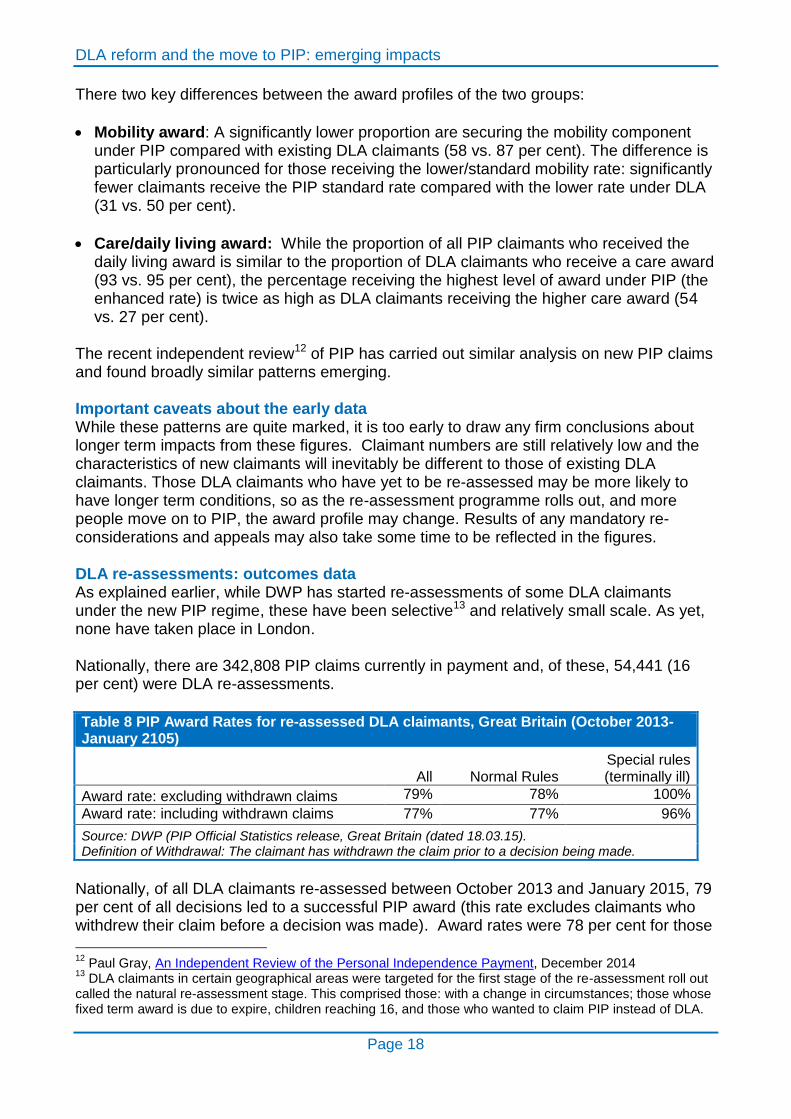
There two key differences between the award profiles of the two groups:
Mobility award: A significantly lower proportion are securing the mobility component under PIP compared with existing DLA claimants (58 vs. 87 per cent). The difference is particularly pronounced for those receiving the lower/standard mobility rate: significantly fewer claimants receive the PIP standard rate compared with the lower rate under DLA (31 vs. 50 per cent).
Care/daily living award: While the proportion of all PIP claimants who received the daily living award is similar to the proportion of DLA claimants who receive a care award (93 vs. 95 per cent), the percentage receiving the highest level of award under PIP (the enhanced rate) is twice as high as DLA claimants receiving the higher care award (54 vs. 27 per cent).
The recent independent review12 of PIP has carried out similar analysis on new PIP claims and found broadly similar patterns emerging. Important caveats about the early data While these patterns are quite marked, it is too early to draw any firm conclusions about longer term impacts from these figures. Claimant numbers are still relatively low and the characteristics of new claimants will inevitably be different to those of existing DLA claimants. Those DLA claimants who have yet to be re-assessed may be more likely to have longer term conditions, so as the re-assessment programme rolls out, and more people move on to PIP, the award profile may change. Results of any mandatory re-considerations and appeals may also take some time to be reflected in the figures. DLA re-assessments: outcomes data As explained earlier, while DWP has started re-assessments of some DLA claimants under the new PIP regime, these have been selective13 and relatively small scale. As yet, none have taken place in London. Nationally, there are 342,808 PIP claims currently in payment and, of these, 54,441 (16 per cent) were DLA re-assessments.
Table 8 PIP Award Rates for re-assessed DLA claimants, Great Britain (October 2013-January 2105)
All Normal Rules Special rules (terminally ill)
Award rate: excluding withdrawn claims 79% 78% 100%
Award rate: including withdrawn claims 77% 77% 96%
Source: DWP (PIP Official Statistics release, Great Britain (dated 18.03.15). Definition of Withdrawal: The claimant has withdrawn the claim prior to a decision being made.
Nationally, of all DLA claimants re-assessed between October 2013 and January 2015, 79 per cent of all decisions led to a successful PIP award (this rate excludes claimants who withdrew their claim before a decision was made). Award rates were 78 per cent for those
12
Paul Gray, An Independent Review of the Personal Independence Payment, December 2014 13
DLA claimants in certain geographical areas were targeted for the first stage of the re-assessment roll out called the natural re-assessment stage. This comprised those: with a change in circumstances; those whose fixed term award is due to expire, children reaching 16, and those who wanted to claim PIP instead of DLA.

DLA reform and the move to PIP: emerging impacts
Page 19
claimants being assessed under normal rules and 100 per cent for those who were being assessed under the special rules for the terminally ill. As before, it is too early to know to what extent these award rates will change as the roll out progresses. The first tranche of re-assessments were highly selective, and not typical of the whole DLA population. Furthermore, they do not capture the impacts of mandatory reconsiderations and appeals. Award levels before and after re-assessment For those DLA claimants who go on to successfully claim PIP, their award level may change, and while some may see a rise in the size of their weekly award others may see a fall. There are no figures on this yet, but DWP projections from December 2012 had estimated that of those who get an award, 40 per cent would see a rise in their award compared to their DLA, while 40 per cent would see a fall. The remainder would retain the same level of benefit.14 Evidence about PIP roll out in practice The first independent review of PIP was published in December and this made some early comments on how the assessment process was working in practice and highlighted a range of problems, including:
Significant backlogs in the assessment and decision making process: these have resulted in very long delays in award payments for many claimants, with knock on impacts for passported/linked benefits;
Problems with the ‘claimant journey’ itself which was described as disjointed;
Poor communications and administration, including lack of clarity in decisions letters about reason for decisions.
CAB, in its evidence15 to the review, concluded that PIP is not yet fit for purpose and has highlighted the increasing numbers requiring advice and support to navigate the PIP process. The CAB reported the following statistics relating to PIP advice:
Up to June 2014, 77,039 people had sought advice about 154,802 issues with PIP across England and Wales, including eligibility, making and managing a claim, face to face assessments and challenging a decision. Over the same time frame, 218,900 accessed online information about PIP from the CAB website.
The volume of advice has steadily increased, and PIP now comprises 11 per cent of all benefit issues brought to bureaux, currently the second most common benefit after ESA.
Waiting times DWP has published national figures on the length of time claimants have had to wait to have their PIP claim dealt with. Figure 8 summarises the figures for new ‘normal rules’ claimants. These show how many weeks a typical claimant had to wait from the point where they applied, through to the time the received a decision (‘end-to-end’ actual clearance times). Over the last year, the typical number of weeks a claimant has had to wait has ranged from 20 weeks to 41 weeks. The data corresponds with evidence from CAB who had suggested that waits of six months were not uncommon in its evidence to the independent
14
DWP, PIP Re-assessments and Impacts, December 2012 15
CAB, Response to Personal Independence Payment (PIP) Assessment – first independent review.

DLA reform and the move to PIP: emerging impacts
Page 20
review. Waiting times have been reducing since July 2014, but are still very long: the latest data show that PIP claimants who received a decision in January 2015, had to wait an average (median figure) of 20 weeks. This means half of those claimants will have waited more than 20 weeks, and half less than 20 weeks. Data are not yet available for local authorities on waiting times. However, given that the number of decisions cleared as a proportion of all registrations is lower in Tower Hamlets than nationally, it is likely that waiting times for local residents have been (are) even longer. Figure 8 Waiting times for new PIP claimants by month of decision, Great Britain
DLA/PIP spend: forecasts versus reality In the 2010 Budget, the Government’s stated policy aims16 were to reduce forecast DLA spending and caseload by 20 per cent through the introduction of PIP, by targeting resources more to those in most need. In theory, this, coupled with the stricter mobility tests, and removal of the lower rate care component, make it highly likely than those on the lower DLA award rates face a higher risk of losing some or all of their benefit under the new assessments. However, those on lower rates constitute a smaller proportion of overall spend compared with those on higher award rates. For example, in Tower Hamlets, while one third of DLA claimants receive the lower rate care award, this group only account for an estimated 18 per cent of overall DLA spend in the borough. For this reason, to achieve a 20 per cent cut in spend would require either a more significant drop in claimant numbers, and/or a significant reduction in average award levels.
16
HM Treasury, 2010 Budget Policy Costings (DLA reform, page 36)

DLA reform and the move to PIP: emerging impacts
Page 21
Indeed, in late 2012, the DWP were predicting that, by the year 2018, numbers would be 28 per cent lower under PIP, compared to what they would have been under DLA17. However, since these predictions were made, the Office for Budget Responsibility (OBR)18, has reviewed early evidence from the roll out and found that award rates (ie the percentage of successful claims) are turning out to be higher than originally predicted. For this reason, the OBR has stated that the original cost saving target is unlikely to be met. Conclusions While it is too early to assess the long term impact of PIP on claimant numbers and award levels in the borough, this preliminary analysis suggest that significant numbers of residents are being, and will be, affected. National data on re-assessments show that, so far, one in five DLA claimants are failing to retain benefit under PIP. As well as loss of DLA income, for many, this could have a knock on impact on a range of other benefits and services. If the same proportion were to lose benefit in Tower Hamlets as a result of the re-assessment programme, this could lead to around 1,500 claimants losing their DLA, and any related benefits. For those who successfully claim PIP, the size of their award may change, and while some may see a rise in the size of their award, others may see a fall. Early evidence on the award profile of new claimants suggests that locally, and nationally, fewer claimants are securing a mobility award under PIP compared with DLA. Furthermore, for new claimants, the extension of the qualifying period under PIP to six months, coupled with the significant backlog in claims assessments, is leading to very long delays in payment, resulting in financial hardship and significant stress for claimants. Research19 frequently highlights that disabled people are more likely to live in poverty, and to face higher costs of living, than non-disabled people. As a result, they are particularly vulnerable in the event of a loss of income and/or delayed payments. Disabled people are also quite likely to experience impacts of different welfare reforms - the majority of DLA claimants also claim ESA, so will be subject to multiple assessments. The future challenge for many DLA/PIP claimants will be the move to Universal Credit for part of their benefit income and the associated impacts. Further information This Briefing was produced by the Council’s Corporate Research Unit. This report is part of a wider programme of research designed to understand the impacts of welfare reforms on residents. The team has also produced reports on Employment & Support Allowance, the Bedroom Tax and JSA sanctions.
These can be accessed on the Council’s website at the following link: http://www.towerhamlets.gov.uk/lgsl/901-950/916_borough_profile/research_and_briefings/income_and_poverty.aspx
17
DWP, PIP Re-assessments and Impacts, December 2012 18 Office of Budget Responsibility, Economic and fiscal outlook, December 2014 (page 155) 19 The Tipping Point: The human and economic cost of cutting disabled people’s support, Hardest Hit
Coalition (October 2012)