dmd 40:1198–1209, 2012 rna sequencing reveals...
TRANSCRIPT
RNA Sequencing Reveals Dynamic Changes of mRNA Abundanceof Cytochromes P450 and Their Alternative Transcripts during
Mouse Liver Development□S
Lai Peng, Byunggil Yoo, Sumedha S. Gunewardena, Hong Lu, Curtis D. Klaassen,and Xiao-bo Zhong
Department of Pharmacology, Toxicology, and Therapeutics, University of Kansas Medical Center, Kansas City, Kansas (L.P.,C.D.K., X.Z.); Kansas Intellectual and Developmental Disabilities Research Center, Kansas City, Kansas (B.Y., S.S.G.); and
Department of Pharmacology, Upstate Medical University, State University of New York, Syracuse, New York (H.L.)
Received February 14, 2012; accepted March 20, 2012
ABSTRACT:
Cytochromes P450 (P450s) are a superfamily of enzymes that havecritical functions in liver to catalyze the biotransformation of nu-merous drugs. However, the functions of most P450s are not ma-ture at birth, which can markedly affect the metabolism of drugs innewborns. Therefore, characterization of the developmental pro-files and regulatory mechanisms of P450 expression is needed formore rational drug therapy of pediatric patients. An animal modelis indispensable for studying the mechanisms of postnatal devel-opment of the P450s. Hence we used RNA sequencing (RNA-Seq)to provide a “true quantification” of mRNA expression of all P450sin mouse liver during development. Liver samples of male C57BL/6mice at 12 different ages from prenatal to adulthood were used.Total mRNAs of the 103 mouse P450s displayed two rapid increas-ing stages after birth, reflecting critical functional transition of liverduring development. Four ontogenic expression patterns were
identified among the 71 significantly expressed P450s, which cat-egorized genes into neonatal-, adolescent-, adolescent/adult-, andadult-enriched groups. The 10 most highly expressed subfamiliesof mouse P450s in livers of adult mice were CYP2E, -2C, -2D, -3A,-4A, -2F, -2A, -1A, -4F, and -2B, which showed diverse expressionprofiles during development. The expression patterns of multiplemembers within a P450 subfamily were often classified to differentgroups. RNA-Seq also enabled the quantification of known tran-script variants of CYP2C44, CYP2C50, CYP2D22, CYP3A25, andCYP26B1 and identification of novel transcripts for CYP2B10,CYP2D26, and CYP3A13. In conclusion, this study reveals themRNA abundance of all the P450s in mouse liver during develop-ment and provides a foundation for mechanistic studies in thefuture.
Introduction
Cytochromes P450s (P450s) are a superfamily of enzymes thatcatalyze the oxidation of organic substances, including the biotrans-formation of numerous endobiotics (e.g., steroids, fatty acids, andeicosanoids) as well as the detoxification or bioactivation of a varietyof xenobiotics (e.g., drugs, chemical carcinogens, and environmentalcontaminants) (Nebert and Gonzalez, 1987; Danielson, 2002). P450s
are the major enzymes involved in the metabolism and bioactivationof drugs, accounting for approximately 75% of drug biotransforma-tion (Guengerich, 2008). Liver expresses the largest number of indi-vidual P450 enzymes (Hrycay and Bandiera, 2009). However, mostP450s in the liver are expressed at low levels at birth. The expressionof P450s changes during liver development and has been categorizedinto several different developmental patterns, and considerable inter-individual variability occurs in the immediate postnatal period (Hinesand McCarver, 2002; Hines, 2007). Low P450 expression in liverduring postnatal development is thought to be responsible for thesubstantial pharmacokinetic differences between newborns and adultsand thus contributes to differences in therapeutic efficacy and adversedrug reactions in pediatric patients (Blake et al., 2005; Hines, 2008).One example is that the low CYP3A4 in neonatal livers results in alow capacity to oxidize cisapride, which can result in QT prolongationin pediatric patients (Pearce et al., 2001; Treluyer et al., 2001). Anin-depth understanding of the regulation of the ontogeny of humanP450s is needed for safer and more effective drug therapy for pediatricpatients.
This study was supported by the National Institutes of Health National Institutefor Environmental Health Sciences [Grant ES-019487] (to X.Z., C.D.K., and H.L.);the National Institutes of Health National Institute of General Medical Sciences[Grant GM-087376] (to X.Z.); the National Institutes of Health National Institute forEnvironmental Health Sciences [Grant ES-009649] (to C.D.K.); and the NationalInstitutes of Health National Center for Research Resources [Grant RR-021940](to C.D.K. and X.Z.).
Article, publication date, and citation information can be found athttp://dmd.aspetjournals.org.
http://dx.doi.org/10.1124/dmd.112.045088.□S The online version of this article (available at http://dmd.aspetjournals.org)
contains supplemental material.
ABBREVIATIONS: P450, cytochrome P450; RNA-Seq, RNA sequencing; bp, base pairs; NCBI, National Center for Biotechnology Information;FPKM, fragments per kilobase of exon per million reads mapped; FDR-BH, Benjamini-Hochberg-adjusted false discovery rate; PCR, polymerasechain reaction; 3�RACE, rapid amplification of cDNA 3� end; UTR, untranslated region.
1521-009X/12/4006-1198–1209$25.00DRUG METABOLISM AND DISPOSITION Vol. 40, No. 6Copyright © 2012 by The American Society for Pharmacology and Experimental Therapeutics 45088/3772544DMD 40:1198–1209, 2012
1198
http://dmd.aspetjournals.org/content/suppl/2012/03/20/dmd.112.045088.DC1Supplemental material to this article can be found at:
at ASPE
T Journals on July 6, 2018
dmd.aspetjournals.org
Dow
nloaded from
The paucity of suitable tissue samples and limitations due to ethicaland technical issues have made it difficult to study the mechanismscontrolling the ontogenic expression of P450s in human liver (Rowelland Zlotkin, 1997). Animal models would be advantageous in over-coming these difficulties and minimizing the influence of geneticvariations and the environment. In recent years, the mouse and rathave surpassed many other laboratory animals as the experimentalmodels of choice for the study of physiology, metabolism, and disease(Muruganandan and Sinal, 2008; Hrycay and Bandiera, 2009). Ad-vantages of these models include rapid growth, easy maintenance, andthe development of genetic manipulation techniques for mechanisticstudies with gain-of-function and loss-of-function strategies. Severalresearchers have examined the ontogenic gene expression profiles ofa few P450s in mouse or rat liver (Choudhary et al., 2004; Alcorn etal., 2007; Cherala et al., 2007; Hart et al., 2009; Li et al., 2009a).Developmental expression patterns of some P450s in mice and rats aresimilar to those in humans.
Previous studies quantified P450 gene expression at the mRNAlevel by either microarrays or multiplex suspension arrays (Hart et al.,2009; Li et al., 2009a), which only provides relative quantification ofa given P450. These technologies detect mRNA levels by probehybridization and fluorescence signal intensity, which cannot compareexpression levels among various P450s, because different probes mayhave different hybridization efficiency. With the development ofnext-generation sequencing technology, RNA sequencing (RNA-Seq)can define a transcriptome with low levels of background noise, noupper limit for quantification, and a high degree of reproducibility forboth technical and biological replicates (Mortazavi et al., 2008; Na-galakshmi et al., 2008). More importantly, compared with microar-rays, RNA-Seq quantifies the true abundance of mRNA molecules inbiological samples and enables the comparison of expression levels ofall genes (Malone and Oliver, 2011). Furthermore, RNA-Seq has thepower to quantify expression levels of alternative transcripts of thesame gene and to identify novel transcripts efficiently (Pan et al.,2008; Wang et al., 2008; Malone and Oliver, 2011). In the currentstudy, RNA-Seq was used to systematically quantify the abundance of103 mouse P450 mRNAs in liver during development to define theontogenic profiles of these P450 mRNAs, with an additional focus onthe identification and quantification of alternative transcripts. There-fore, the purpose of this study was to generate comprehensive infor-mation on the ontogeny of the mRNAs of the P450 family in the liversof mice, which will provide a foundation for determining the regula-tory mechanisms controlling the various transcription patterns ofP450s during liver development.
Materials and Methods
Animals. Eight-week-old C57BL/6 breeding pairs of mice were purchasedfrom The Jackson Laboratory (Bar Harbor, ME). Mice were housed accordingto the American Animal Association Laboratory animal care guidelines andwere bred under standard conditions in the Laboratory Animal ResourcesFacility at the University of Kansas Medical Center. The use of these mice wasapproved by the Institute of Laboratory Animal Resources. Breeding pairswere established at 4:00 PM and separated at 8:00 AM the following day. Thebody weights of the females were recorded each day to determine pregnancystatus. Livers (n � 3) from male offspring were collected at the following 12ages: day �2 (gestational day 17), day 0 (right after birth and before the startof suckling), day 1 (exactly 24 h after birth), and day 3, 5, 10, 15, 20, 25, 30,45, and 60 (collected at approximately 9:00 AM), which represent periods ofprenatal (day �2), neonatal (day 0–10), juvenile (day 15–30), and young adult(day 45–60). Livers were immediately frozen in liquid nitrogen after removaland stored at �80°C.
Total RNA Extraction. Total RNA was isolated by using RNAzol Breagent (Tel-Test Inc., Friendswood, TX) according to the manufacturer’sprotocol. Whole livers without gallbladders at various ages were collected forRNA isolation. RNA concentrations were quantified using a NanoDrop spec-trophotometer (NanoDrop Technologies, Wilmington, DE) at a wavelength of260 nm. The integrity of the total RNA was evaluated on an Agilent 2100Bioanalyzer (Agilent Technologies, Santa Clara, CA), and the samples withRNA integrity values larger than 7.0 were accepted for sequencing libraryconstruction.
cDNA Library Construction. The cDNA libraries from all samples wereprepared by using an Illumina TruSeq RNA Sample Prep Kit (Illumina, SanDiego, CA). Three micrograms of total RNA were used as the RNA input onthe basis of the manufacturer’s recommendation. mRNAs were isolated fromthe total RNAs by poly(A) selection using poly(T) primers. RNA fragmenta-tion, first- and second-strand cDNA syntheses, end repair, adapter ligation, andPCR amplification were performed according to the manufacturer’s protocol.Fragments of the cDNA library ranged from 220 to 500 bp with a peak size atat 280 bp (including 120-bp adapter sequences). Quality of the cDNA librarieswas evaluated using an Agilent 2100 Bioanalyzer before sequencing.
RNA-Seq. RNA-Seq was performed on an Illumina HiSeq 2000 instrumentby the Genome Sequencing Facility at Kansas University Medical Center.Clusters of the cDNA libraries were generated on a TruSeq flow cell andsequenced for 100-bp paired end reads (2 � 100) with a TruSeq 200 cycle SBSkit (Illumina). A PhiX bacteriophage genome and a universal human referenceRNA were used as controls and sequenced in parallel with other samples toensure that the data generated for each run were accurately calibrated duringthe image analysis and data analysis. In addition, the PhiX was spiked intoeach cDNA sample at approximately 1% as an internal quality control.
RNA-Seq Data Analysis. After the sequencing images were generated bythe sequencing platform, the pixel-level raw data collection, image analysis,and base calling were performed using Illumina Real Time Analysis software.The output bcl files were converted to qseq files by Illumina BCL Converter
TABLE 1
Primer sequences for validation of novel transcripts identified by RNA-Seq
Gene Method Amplification Direction Sequence (5� to 3�) PCR Product
bp
Cyp2b10 Endpoint PCR From exon 6 to exon 9 (including cassette exon) Forward ATGGCTTCCTGCTCATGCTCAAGT 411Reverse GACAAATGCGCTTTCCCACAGACT
Sequencing From exon 7 to exon 9 AGTGCCACACAGAGTGACCAAAGACyp2d26 Endpoint PCR From exon 5 to cassette exon Forward ACTACACATCCCTGGTTTGCCTGA 520
Reverse AGCCTCTGAGCACCTTCTCTTGTASequencing From exon 6 to cassette exon TGATTGACCTGTTCATGGCAGGGAEndpoint PCR From cassette exon to exon 9 Forward TACAAGAGAAGGTGCTCAGAGGCT 327
Reverse TAGGGCTCTGGAGTAACTGGCATTSequencing From exon 8 to cassette exon CATGAAGGCCTCGTGCTTCACAAA
Cyp3a13 3�-RACE cDNA synthesis GCGAGCACAGAATTAATACGACTCACTATAGGT12VNOuter PCR Forward AAGTTGCTCTTGTCAGAGTCCTGC
Reverse GCGAGCACAGAATTAATACGACTInner PCR Forward CACTGTCCAGCCTTGTAAGGAAAC
Reverse CGCGGATCCGAATTAATACGACTCACTATAGGSequencing AAGTTGCTCTTGTCAGAGTCCTGC
1199ONTOGENY OF P450s IN MOUSE LIVER REVEALED BY RNA-Seq
at ASPE
T Journals on July 6, 2018
dmd.aspetjournals.org
Dow
nloaded from

FIG. 1. A, total mRNAs of the 103 mouse P450 genes in liver during development. RNA-Seq was done for liver mRNAs of male C57BL/6 mice at 12 ages from2 days before birth to 60 days after birth. The FPKM values of all 103 mouse P450 genes at each age were added and plotted to show the developmental patternof total P450 mRNAs. Bars represented the mean � S.E.M. of three individual animals. B, individual P450 mRNAs (shown as percentages of total P450 mRNAs)at 2 days before birth and 1, 10, 20, and 60 days after birth. Each gene is presented in a unique color for all ages. Only the top 10 P450 mRNAs at each age arelisted in alphabetical order, and the rest were grouped as “Others.”
1200 PENG ET AL.
at ASPE
T Journals on July 6, 2018
dmd.aspetjournals.org
Dow
nloaded from

1.7 software and subsequently converted to FASTQ files for downstreamanalysis. The RNA-Seq reads from the FASTQ files were mapped to the mousereference genome (NCBI37/mm9), and the splice junctions were identified byTopHat 1.2. The output files in BAM (binary sequence alignment) format wereanalyzed by Cufflinks 1.0.3 to estimate the transcript abundance (Trapnell etal., 2010). The mRNA abundance was expressed as the number of fragmentsper kilobase of exon per million reads mapped (FPKM).
Data Visualization and Statistics. The P450 genes (103 in total) wereretrieved from Cufflinks output for further analysis. Significant gene expres-sion was determined by the drop-in-deviance F test of the fitted FPKM data toa generalized linear model with a Poisson link function, a statistic designed tomeasure the significance of a gene’s measured FPKM value relative to a zeroFPKM value. The p values were adjusted for extra Poisson variation andcorrected for false discovery by the Benjamini-Hochberg method (FDR-BH)with a threshold set at 0.05 for significant expression (Benjamini and Hoch-berg, 1995). A two-way hierarchical clustering dendrogram was generated byJMP (version 9.0; SAS Institute, Inc., Cary, NC) to determine the expressionpatterns of the P450 mRNAs during liver development.
Validation of Alternative mRNA Transcripts. Alternative splicing eventsin CYP2B10 and CYP2D26 were validated by reverse transcription andendpoint PCR. Total RNA (5 �g) was reverse-transcribed with M-MLVreverse transcriptase (Invitrogen, Carlsbad, CA) and random primers in a finalvolume of 50 �l. Endpoint PCRs with reaction volumes of 20 �l wereperformed. Primer sequences are listed in Table 1. The PCR products wereseparated on a 2% agarose gel. Bands of the expected sizes were excised andpurified with a QIAquick Gel Extraction Kit (QIAGEN, Valencia, CA).Subsequently, DNA was sequenced with sequencing primers (Table 1) byACGT Inc. (Wheeling, IL). The alternative polyadenylation of CYP3A13mRNA was validated by rapid amplification of cDNA 3�-end (3�-RACE) usingRNA ligase-mediated rapid amplification of cDNA ends (FirstChoice RLM-RACE Kit; Ambion, Austin, TX) as described previously (Li et al., 2012).Primer sequences are shown in Table 1.
Results
Total Expression and Proportions of Individual P450s duringLiver Development. RNA-Seq generated an average of 175 million100-bp paired end reads per sample for the 36 samples from 12different ages (n � 3). More than 80% of the reads from each samplewere mapped to the mouse reference genome (NCBI37/mm9) byTopHat 1.2 (data not shown). Transcript abundances of the 103mouse P450 genes (including nine pseudogenes) were calculatedby Cufflinks and are presented as FPKM values (SupplementalTable 1). The FPKM values were highly reproducible in thetriplicate samples at each age as indicated by the small S.E.M. Ifthe Benjamini-Hochberg adjusted drop-in-deviance F test p value(FDR-BH) in at least one of the 12 ages were less than 0.05 for aP450 gene, then that gene was considered to be expressed in liverduring development. Of the 103 mouse P450 genes, 71 genes wereexpressed during liver development.
Total FPKM values of all P450 mRNAs increased approximately25-fold during postnatal liver development from day �2 (479) to day60 (12,345), with two surges followed by a plateau stage after eachsurge (Fig. 1A). Figure 1B shows the composition of the P450s,represented as percentages of the total P450 mRNA FPKM, at thebeginning and end ages of these surge and plateau stages, i.e., day �2,1, 10, 20, and 60. The first surge occurred from day �2 (FPKM �479) to day 1 (5926) with more than a 10-fold increase of total P450mRNA FPKM values. During the first surge, the top 10 highlyexpressed P450s changed dramatically, with only CYP2D22 andCYP2D10 in the top 10 P450s at both day �2 and day 1. During thefirst plateau stage, although the total P450 mRNA FPKM values wererelatively constant between day 1 and 10, the individual P450 mRNAswere altered, with CYP2E1 the most abundant at day 10. The secondsurge occurred between day 10 and 20, with nearly a 2-fold increase
of total P450 FPKM values from 6139 to 11,087. The individual P450mRNAs, which increased during the second surge from day 10 to 20,were similar, because 6 P450s appeared at both ages in the top 10highly expressed P450s, and the top 3 are the same in an order ofCYP2E1, CYP3A11, followed by CYP2D26. During the second pla-teau stage of day 20 to 60, the individual P450 mRNAs continued tochange and became more diverse. At day 60, the top 10 highlyexpressed P450s consisted of only 74% of the total P450 mRNAs, andmany additional P450s were expressed.
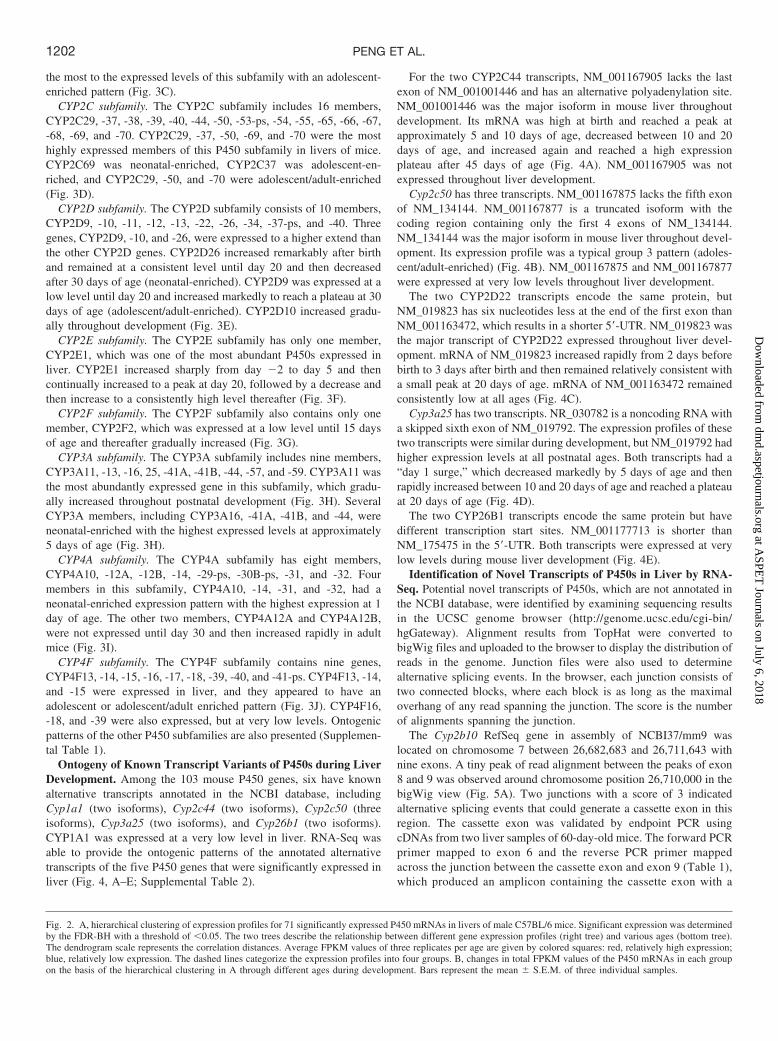
Expression Patterns of P450s during Liver Development. P450genes with a maximum over minimum expression ratio of �2 amongthe 12 ages studied were to be excluded for this part of the study. Thedata indicate that all 71 significantly expressed P450 genes had�2-fold differences in expression during development. Two-wayhierarchical clustering analysis of the 71 P450 genes revealed fourdistinct patterns of gene expression with respect to age, which aredefined as neonatal-enriched (group 1), adolescent-enriched (group2), adolescent/adult-enriched (group 3), and adult-enriched (group 4)(Fig. 2A). The sum of the FPKM values in each group was plottedagainst age in Fig. 2B. Group 1 (neonatal-enriched) containedCYP2D26, CYP3A16, CYP3A41a/b, CYP3A44, CYP4A10, CYP4A14,CYP4A31, CYP4A32, CYP4F16, CYP4F18, CYP4F39, CYP20A1, andCYP39A1. The P450s in this group increased markedly after birthand reached a peak at approximately day 1 of age and then decreased andremained relatively low after day 30. Group 2 P450s (adolescent-enriched) consisted of CYP2A22, CYP2B9, CYP2B13, CYP2B23,CYP2C37, CYP2C40, CYP2C68, CYP2C69, CYP2D37-ps, CYP2E1,CYP2G1, CYP4F15, CYP7A1, and CYP26B1. The P450s in this groupincreased rapidly after birth, reached maximal expression at approxi-mately day 20, and then decreased to lower levels in adult mice. Group3 P450s (adolescent/adult-enriched) included CYP1A2, CYP2A4,CYP2A5, CYP2A12, CYP2B10, CYP2C29, CYP2C39, CYP2C50,CYP2C54, CYP2C55, CYP2C70, CYP2D22, CYP2J6, CYP3A13,CYP3A25, CYP3A59, CYP4B1, CYP4F14, and CYP17A1. ThemRNAs of the P450s in this group were expressed at very low levels atbirth, but increased substantially between day 10 and 25, and reached aplateau in adult mice. Group 4 P450s (adult-enriched) consisted ofCYP2C38, CYP2C44; CYP2C67, CYP2D9, CYP2D10, CYP2D11,CYP2D12, CYP2D13, CYP2D34, CYP2D40, CYP2F2, CYP2J5,CYP2R1, CYP2U1, CYP3A11, CYP4A12A/B, CYP4F13, CYP4V3,CYP7B1, CYP8B1, CYP26A1, CYP27A1, and CYP51. The P450s in thisgroup were expressed at low levels 2 days before birth, gradually increasedafter birth with a rapid increase at approximately 25 days of age, and reachedtheir highest expression in adults (45 and 60 days of age). The largestcorrelation distance with respect to neighboring ages (as shown by the cladeseparation on the dendrogram scale) was observed between 20 and 25 daysof age.
Comparison of Transcript Abundance of Some P450 Subfam-ilies during Liver Development. The 103 mouse P450 genes belongto 16 families and 39 subfamilies. Ontogenic patterns of the majorP450 subfamilies in liver are summarized in Fig. 3.
CYP1A subfamily. The CYP1A subfamily has two members,CYP1A1 and CYP1A2. CYP1A1 mRNA was expressed at very lowlevels in liver at all ages. CYP1A2 had a developmental patternbelonging to group 3 (adolescent/adult-enriched) (Fig. 3A).
CYP2A subfamily. The CYP2A subfamily consists of five mem-bers, CYP2A4, CYP5, CYP12, CYP22, and CYP2AB1. Except forCYP2AB1, the other four genes in liver were expressed with theadolescent- or adolescent/adult-enriched patterns (Fig. 3B).
CYP2B subfamily. The CYP2B subfamily contains five members,CYP2B9, -10, -13, -19, and -23. CYP2B9 and CYP2B13 contributed
1201ONTOGENY OF P450s IN MOUSE LIVER REVEALED BY RNA-Seq
at ASPE
T Journals on July 6, 2018
dmd.aspetjournals.org
Dow
nloaded from
the most to the expressed levels of this subfamily with an adolescent-enriched pattern (Fig. 3C).
CYP2C subfamily. The CYP2C subfamily includes 16 members,CYP2C29, -37, -38, -39, -40, -44, -50, -53-ps, -54, -55, -65, -66, -67,-68, -69, and -70. CYP2C29, -37, -50, -69, and -70 were the mosthighly expressed members of this P450 subfamily in livers of mice.CYP2C69 was neonatal-enriched, CYP2C37 was adolescent-en-riched, and CYP2C29, -50, and -70 were adolescent/adult-enriched(Fig. 3D).
CYP2D subfamily. The CYP2D subfamily consists of 10 members,CYP2D9, -10, -11, -12, -13, -22, -26, -34, -37-ps, and -40. Threegenes, CYP2D9, -10, and -26, were expressed to a higher extend thanthe other CYP2D genes. CYP2D26 increased remarkably after birthand remained at a consistent level until day 20 and then decreasedafter 30 days of age (neonatal-enriched). CYP2D9 was expressed at alow level until day 20 and increased markedly to reach a plateau at 30days of age (adolescent/adult-enriched). CYP2D10 increased gradu-ally throughout development (Fig. 3E).
CYP2E subfamily. The CYP2E subfamily has only one member,CYP2E1, which was one of the most abundant P450s expressed inliver. CYP2E1 increased sharply from day �2 to day 5 and thencontinually increased to a peak at day 20, followed by a decrease andthen increase to a consistently high level thereafter (Fig. 3F).
CYP2F subfamily. The CYP2F subfamily also contains only onemember, CYP2F2, which was expressed at a low level until 15 daysof age and thereafter gradually increased (Fig. 3G).
CYP3A subfamily. The CYP3A subfamily includes nine members,CYP3A11, -13, -16, 25, -41A, -41B, -44, -57, and -59. CYP3A11 wasthe most abundantly expressed gene in this subfamily, which gradu-ally increased throughout postnatal development (Fig. 3H). SeveralCYP3A members, including CYP3A16, -41A, -41B, and -44, wereneonatal-enriched with the highest expressed levels at approximately5 days of age (Fig. 3H).
CYP4A subfamily. The CYP4A subfamily has eight members,CYP4A10, -12A, -12B, -14, -29-ps, -30B-ps, -31, and -32. Fourmembers in this subfamily, CYP4A10, -14, -31, and -32, had aneonatal-enriched expression pattern with the highest expression at 1day of age. The other two members, CYP4A12A and CYP4A12B,were not expressed until day 30 and then increased rapidly in adultmice (Fig. 3I).
CYP4F subfamily. The CYP4F subfamily contains nine genes,CYP4F13, -14, -15, -16, -17, -18, -39, -40, and -41-ps. CYP4F13, -14,and -15 were expressed in liver, and they appeared to have anadolescent or adolescent/adult enriched pattern (Fig. 3J). CYP4F16,-18, and -39 were also expressed, but at very low levels. Ontogenicpatterns of the other P450 subfamilies are also presented (Supplemen-tal Table 1).
Ontogeny of Known Transcript Variants of P450s during LiverDevelopment. Among the 103 mouse P450 genes, six have knownalternative transcripts annotated in the NCBI database, includingCyp1a1 (two isoforms), Cyp2c44 (two isoforms), Cyp2c50 (threeisoforms), Cyp3a25 (two isoforms), and Cyp26b1 (two isoforms).CYP1A1 was expressed at a very low level in liver. RNA-Seq wasable to provide the ontogenic patterns of the annotated alternativetranscripts of the five P450 genes that were significantly expressed inliver (Fig. 4, A–E; Supplemental Table 2).
For the two CYP2C44 transcripts, NM_001167905 lacks the lastexon of NM_001001446 and has an alternative polyadenylation site.NM_001001446 was the major isoform in mouse liver throughoutdevelopment. Its mRNA was high at birth and reached a peak atapproximately 5 and 10 days of age, decreased between 10 and 20days of age, and increased again and reached a high expressionplateau after 45 days of age (Fig. 4A). NM_001167905 was notexpressed throughout liver development.
Cyp2c50 has three transcripts. NM_001167875 lacks the fifth exonof NM_134144. NM_001167877 is a truncated isoform with thecoding region containing only the first 4 exons of NM_134144.NM_134144 was the major isoform in mouse liver throughout devel-opment. Its expression profile was a typical group 3 pattern (adoles-cent/adult-enriched) (Fig. 4B). NM_001167875 and NM_001167877were expressed at very low levels throughout liver development.
The two CYP2D22 transcripts encode the same protein, butNM_019823 has six nucleotides less at the end of the first exon thanNM_001163472, which results in a shorter 5�-UTR. NM_019823 wasthe major transcript of CYP2D22 expressed throughout liver devel-opment. mRNA of NM_019823 increased rapidly from 2 days beforebirth to 3 days after birth and then remained relatively consistent witha small peak at 20 days of age. mRNA of NM_001163472 remainedconsistently low at all ages (Fig. 4C).
Cyp3a25 has two transcripts. NR_030782 is a noncoding RNA witha skipped sixth exon of NM_019792. The expression profiles of thesetwo transcripts were similar during development, but NM_019792 hadhigher expression levels at all postnatal ages. Both transcripts had a“day 1 surge,” which decreased markedly by 5 days of age and thenrapidly increased between 10 and 20 days of age and reached a plateauat 20 days of age (Fig. 4D).
The two CYP26B1 transcripts encode the same protein but havedifferent transcription start sites. NM_001177713 is shorter thanNM_175475 in the 5�-UTR. Both transcripts were expressed at verylow levels during mouse liver development (Fig. 4E).
Identification of Novel Transcripts of P450s in Liver by RNA-Seq. Potential novel transcripts of P450s, which are not annotated inthe NCBI database, were identified by examining sequencing resultsin the UCSC genome browser (http://genome.ucsc.edu/cgi-bin/hgGateway). Alignment results from TopHat were converted tobigWig files and uploaded to the browser to display the distribution ofreads in the genome. Junction files were also used to determinealternative splicing events. In the browser, each junction consists oftwo connected blocks, where each block is as long as the maximaloverhang of any read spanning the junction. The score is the numberof alignments spanning the junction.
The Cyp2b10 RefSeq gene in assembly of NCBI37/mm9 waslocated on chromosome 7 between 26,682,683 and 26,711,643 withnine exons. A tiny peak of read alignment between the peaks of exon8 and 9 was observed around chromosome position 26,710,000 in thebigWig view (Fig. 5A). Two junctions with a score of 3 indicatedalternative splicing events that could generate a cassette exon in thisregion. The cassette exon was validated by endpoint PCR usingcDNAs from two liver samples of 60-day-old mice. The forward PCRprimer mapped to exon 6 and the reverse PCR primer mappedacross the junction between the cassette exon and exon 9 (Table 1),which produced an amplicon containing the cassette exon with a
Fig. 2. A, hierarchical clustering of expression profiles for 71 significantly expressed P450 mRNAs in livers of male C57BL/6 mice. Significant expression was determinedby the FDR-BH with a threshold of �0.05. The two trees describe the relationship between different gene expression profiles (right tree) and various ages (bottom tree).The dendrogram scale represents the correlation distances. Average FPKM values of three replicates per age are given by colored squares: red, relatively high expression;blue, relatively low expression. The dashed lines categorize the expression profiles into four groups. B, changes in total FPKM values of the P450 mRNAs in each groupon the basis of the hierarchical clustering in A through different ages during development. Bars represent the mean � S.E.M. of three individual samples.
1202 PENG ET AL.
at ASPE
T Journals on July 6, 2018
dmd.aspetjournals.org
Dow
nloaded from

1203ONTOGENY OF P450s IN MOUSE LIVER REVEALED BY RNA-Seq
at ASPE
T Journals on July 6, 2018
dmd.aspetjournals.org
Dow
nloaded from

size of 411 bp in all samples examined (Fig. 5A). Sequencing ofthe PCR product revealed the presence of a 31-bp cassette exon,which could alter the protein translation reading frame whenretained in the transcript.
A similar cassette exon peak and alternative splicing junctions werealso found in the browser view of the Cyp2d26 gene, which is locatedon the minus strand of chromosome 15 between 82,620,537 and82,624,675 (Fig. 5B). The cassette exon was located between exon 7
FIG. 3. Expression patterns of the selected P450 subfamilies during liver development: A, CYP1A; B, CYP2A; C, CYP2B; D, CYP2C; E, CYP2D; F, CYP2E; G, CYP2F;H, CYP3A; I, CYP4A; and J, CYP4F. Data are presented as mean FPKM � S.E.M. of three individual samples.
1204 PENG ET AL.
at ASPE
T Journals on July 6, 2018
dmd.aspetjournals.org
Dow
nloaded from

and 8 and validated by endpoint PCR with two sets of primers. Primerset 1 bound to exon 5 and the cassette exon, which amplified a fragmentwith an expected size of 520 bp. Primer set 2 bound to the cassette exonand exon 9, which amplified a fragment with an expected size of 327 bp.The cassette exon sequence contained 42 nucleotides, which wouldchange the protein product if retained in the transcript.
Thirteen peaks of sequencing reads were observed along theRefSeq Cyp3a13 gene. The first 12 exons were covered by a singlepeak. However, in exon 13, a region with high-level reads followedby a region with low-level reads was found. A sharp decrease in thesequencing reads occurred around chromosome position138,335,200 in the 3�-UTR of Cyp3a13 (Fig. 5C). The RNA-Seqreads ended at coordinate 138,334,161 of chromosome 5, whichmatched with the termination of this gene in the reference se-
quence. This suggested an alternative polyadenylated mRNA tran-script in the 3�-UTR region of CYP3A13. To validate the shorter3�-UTR transcript, we performed 3�-RACE-PCR with two RNAsamples from livers of 60-day-old mice. The forward PCR primersshown in Fig. 5C, together with reverse primers provided by theRLM-RACE Kit, generated a band that was sequenced using theCyp3a13-specific sequencing primer (Table 1). Sequencing resultsrevealed a poly(A)-containing sequence that uniquely mapped tothe 3�-UTR of CYP3A13. Termination of the shorter 3�-UTRtranscript occurred at chromosome location 138,336,180, whichwas more than 2 kilobases upstream of the end of the referencegene sequence. In addition, an AATAAA sequence was noted at 23bases upstream of the termination site, which might serve as arecognition signal for the poly(A) polymerase complex.
FIG. 4. The mRNAs of known alternative transcripts of five P450s that were significantly expressed during liver development: A, CYP2C44; B, CYP2C50; C, CYP2D22; D, CYP3A25;and E, CYP26B1. The transcripts are labeled with their NCBI transcript identification number. Data are presented as mean FPKM � S.E.M. of three individual samples.
1205ONTOGENY OF P450s IN MOUSE LIVER REVEALED BY RNA-Seq
at ASPE
T Journals on July 6, 2018
dmd.aspetjournals.org
Dow
nloaded from

Discussion
In the current study, RNA-Seq was used to truly quantify mRNAabundance of the 103 P450 genes in mouse liver during postnataldevelopment. Compared with other commonly used methods for RNAquantification, such as microarray, branched DNA, or real-time PCR,RNA-Seq directly counts sequence reads of the nucleotide moleculesin biological samples, which is the only method for true quantificationof mRNA expression. Expression of a transcript is represented byFPKM, which normalizes sequencing depths between different sam-ples and sizes between various genes, allowing direct comparison ofmRNAs among various transcripts on a genome-wide scale. As shownin Fig. 1, the quantitative abundance of mRNAs encoded by the 103P450 genes was determined in mice at 12 ages, which has not beenreported previously.
From perinatal through neonatal to adult life, the total FPKM valuesof all P450 transcripts increased approximately 25-fold with tworapidly increasing stages (Fig. 1A). The first surge occurred from 2days before birth to 1 day after birth. Not only the total abundance butalso the composition of expressed P450s was markedly altered duringthis period, when the pup was born and lost the direct physiologicalconnection with the mother. Multiple hormones are known to influ-
ence the expression of drug-metabolizing enzymes. During preg-nancy, maternal hormones cross the placenta into the baby. Afterbirth, the loss of maternal hormones may be a contributing factor tothe changes in the expression of some P450s. The newborn mice alsobegan to be exposed to the environment, which contains all kinds ofxenobiotics. A critical function of P450s is xenobiotic metabolism; thus,the first surge of P450 expression may provide protections to the new-borns against environmental toxic compounds. The second surge oc-curred from day 10 to day 20, with a rapid increase in abundance of theP450 mRNAs. However, the expression of each P450 was similar from10 to 20 days of age, as the expression of most P450s increased simul-taneously. This period is also the most rapidly growing stage of postnatalliver development, as studies have shown that cell proliferation in mouseliver is high until 20 days of age and then the hepatic architecture beginsto resemble that of adult liver (Apte et al., 2007).
Hierarchical clustering of significantly expressed P450s revealedfour hepatic ontogenic expression patterns (Fig. 2). The expressionprofiles of these patterns were similar to those in a previous study ofP450 ontogeny in mice (Hart et al., 2009), with some genes enrichedat younger ages and some enriched at older ages. However, theprevious study examined only a few P450s, whereas the present study
FIG. 5. A, identification of a cassette exon in CYP2B10 mRNA.
1206 PENG ET AL.
at ASPE
T Journals on July 6, 2018
dmd.aspetjournals.org
Dow
nloaded from

included all the expressed P450s in the liver of mice and thereforegenerated a more comprehensive summary of ontogenic patterns.Whereas the earlier study concluded that there were three patterns ofP450 ontogeny in livers of mice (Hart et al., 2009), the present studyconcludes that there are four patterns. Clustering of the P450s from 12developmental ages indicates that the largest correlation distance withrespect to neighboring ages is between 20 and 25 days of age, whichspanned the period when the diet changes from milk to chow. BecauseP450s have important functions in metabolizing chemicals absorbedfrom the gastrointestinal tract, it is reasonable to anticipate this changein P450 expression with a change in food intake.
The most highly expressed P450 mRNAs in livers of mice werefrom the CYP1–4 families, which belong to the xenobiotic-metabo-lizing P450s. They displayed changes in expression during develop-ment. Some P450 subfamilies were primarily expressed during theneonatal stage, whereas others were mainly expressed during theadolescent or adult stage of development. Even within each subfam-ily, individual members were expressed with various developmentalpatterns. In the CYP2D subfamily, CYP2D26 mRNA reached itsmaximum expression during the neonatal period, whereas CYP2D9reached its maximum expression during the adolescent/adult period(Fig. 3E). Likewise, in the CYP3A subfamily, CYP3A16,
CYP3A41A, CYP3A41B, and CYP3A44 were maximally expressedduring the neonatal period, whereas CYP3A11 was maximally ex-pressed in the adult mice (Fig. 3H). A similar developmental switchalso exists in human CYP3A enzymes (Schuetz et al., 1994; Stevenset al., 2003; Leeder et al., 2005). Thus, mice might serve as a goodmodel to study the mechanisms controlling the developmentalswitches of P450 expression in liver. Of note, it is difficult to directlycompare our data in mice with other previously published data inhumans. Our study determined levels of mRNA transcripts of P450s,whereas most other published studies determined protein concentra-tions and enzyme activities of human P450s.
Because RNA-Seq has the ability to examine the transcriptome atthe resolution of a single base (Wang et al., 2009), it can quantify themRNAs of genes as well as their individual transcript variants (Fig.4). The known transcript variants of the P450s might be translated intodifferent proteins, as in CYP2C44 and CYP2C50, or those that differonly in the UTR regions of the transcripts, as in CYP2D22 andCYP26B1. Because transcript variants can alter protein functions,mRNA stability, subcellular localization, and translation efficiency ofthe transcripts (Pesole et al., 2000), identification of the predominanttranscripts of P450s and their developmental expression patternsmight help to predict variations in protein activity.
FIG. 5. B, identification of a cassette exon in CYP2D26 mRNA.
1207ONTOGENY OF P450s IN MOUSE LIVER REVEALED BY RNA-Seq
at ASPE
T Journals on July 6, 2018
dmd.aspetjournals.org
Dow
nloaded from

Research has shown that 92 to 94% of human genes undergoalternative splicing, promoter usage, and polyadenylation (Wang etal., 2008). Only 6 of the 103 mouse P450 genes in the NCBI databasehave annotated transcript variants, so alternative splicing of P450transcripts in mice is probably an underexplored area. With theadvantage of RNA-Seq, the present study identified several noveltranscript variants in CYP2B10 and CYP2D26, even though they areexpressed at very low levels (very small peaks in bigWig view of Fig.5, A and B). When the cassette exons are translated, the resultant P450enzymes will have different protein sequences, which might lead to adifference in enzyme activities. The CYP3A13 transcripts, with theshorter 3�-UTR, appeared to be the predominant transcript of thisgene. A similar shorter 3�-UTR transcript has been reported for thehuman CYP3A4 gene (Li et al., 2012). Although the CYP3A4 tran-script with shorter 3�-UTR does not change amino acid sequences, itis more stable and can translate to protein more efficiently than theCYP3A4 transcript with the longer 3�-UTR (Li et al., 2012). The
mouse Cyp3a13 gene might serve as a model to study how alternativepolyadenylation events are regulated. Further studies are needed toinvestigate the functional significance of these novel transcripts.
P450 proteins and enzyme activities were not determined in thisstudy because of technique limitations. Specific antibodies againstmost of the mouse P450 proteins, specific substrates, and inhibitors ofmany individual mouse P450 enzymes are not available. Technolog-ical breakthroughs in proteomics and metabolomics are essential tostudy the ontogeny of P450 proteins.
In summary, the present study describes the ontogeny of themRNAs of all P450s in the mouse liver during development. Thesedata provide fundamental knowledge for studying mechanisms ofregulation of the transcription of P450 genes in liver during develop-ment. A previous study from our laboratories indicates that the de-velopmental regulation of Cyp3a gene expression in mouse liver maybe due to dynamic changes of histone modifications during postnatalliver maturation (Li et al., 2009b). No doubt, epigenetics and various
FIG. 5. C, identification of an alternative polyadenylation site in CYP3A13 mRNA. RNA-Seq reads of a day 60 sample were aligned to the reference genome mm9 byTopHat and viewed as distribution peaks by the UCSC genome browser. Output junction reads from TopHat are also shown. The cassette exons or alternativepolyadenylation was validated by endpoint PCR or 3�-RACE. The PCR products are shown by gel electrophoresis and further sequenced by single-pass DNA sequencingwith a designed primer. The sequence was aligned back to the P450 gene regions.
1208 PENG ET AL.
at ASPE
T Journals on July 6, 2018
dmd.aspetjournals.org
Dow
nloaded from

hepatic transcription factors play an important role in regulatingontogenic expression of P450 enzymes (Kyrmizi et al., 2006). Studieson the networking of transcription factors and epigenetic signatures inliver may shed light on the regulatory mechanisms of the observedP450 developmental patterns. These mechanisms may be of consid-erable importance in understanding the kinetics of xenobiotic metab-olism during the neonatal period.
Acknowledgments
We thank Drs. Julia Yue Cui, Helen Renaud, and Dan Li for help on samplecollection and data analysis and Clark Bloomer (Kansas University MedicalCenter, Sequencing Core Facilities) for technical assistance on RNA-Seq.
Authorship Contributions
Participated in research design: Peng, Yoo, Gunewardena, Lu, Klaassen,and Zhong.
Conducted experiments: Peng.Performed data analysis: Peng, Gunewardena, Yoo, and Zhong.Wrote or contributed to the writing of the manuscript: Peng, Yoo, Gunewar-
dena, Lu, Klaassen, and Zhong.
References
Alcorn J, Elbarbry FA, Allouh MZ, and McNamara PJ (2007) Evaluation of the assumptions ofan ontogeny model of rat hepatic cytochrome P450 activity. Drug Metab Dispos 35:2225–2231.
Apte U, Zeng G, Thompson MD, Muller P, Micsenyi A, Cieply B, Kaestner KH, and Monga SP(2007) �-Catenin is critical for early postnatal liver growth. Am J Physiol Gastrointest LiverPhysiol 292:G1578–G1585.
Benjamini Y and Hochberg Y (1995) Controlling the false discovery rate—a practical andpowerful approach to multiple testing. J R Stat Soc Ser B 57:289–300.
Blake MJ, Castro L, Leeder JS, and Kearns GL (2005) Ontogeny of drug metabolizing enzymesin the neonate. Semin Fetal Neonatal Med 10:123–138.
Cherala G, Shapiro BH, and D’mello AP (2007) Effect of perinatal low protein diets on theontogeny of select hepatic cytochrome P450 enzymes and cytochrome P450 reductase in therat. Drug Metab Dispos 35:1057–1063.
Choudhary D, Jansson I, Sarfarazi M, and Schenkman JB (2004) Xenobiotic-metabolizingcytochromes P450 in ontogeny: evolving perspective. Drug Metab Rev 36:549–568.
Danielson PB (2002) The cytochrome P450 superfamily: biochemistry, evolution and drugmetabolism in humans. Curr Drug Metab 3:561–597.
Guengerich FP (2008) Cytochrome p450 and chemical toxicology. Chem Res Toxicol 21:70–83.Hart SN, Cui Y, Klaassen CD, and Zhong XB (2009) Three patterns of cytochrome P450 gene
expression during liver maturation in mice. Drug Metab Dispos 37:116–121.Hines RN (2007) Ontogeny of human hepatic cytochromes P450. J Biochem Mol Toxicol
21:169–175.Hines RN (2008) The ontogeny of drug metabolism enzymes and implications for adverse drug
events. Pharmacol Ther 118:250–267.Hines RN and McCarver DG (2002) The ontogeny of human drug-metabolizing enzymes: phase
I oxidative enzymes. J Pharmacol Exp Ther 300:355–360.Hrycay EG and Bandiera SM (2009) Expression, function and regulation of mouse cytochrome
P450 enzymes: comparison with human P450 enzymes. Curr Drug Metab 10:1151–1183.Kyrmizi I, Hatzis P, Katrakili N, Tronche F, Gonzalez FJ, and Talianidis I (2006) Plasticity and
expanding complexity of the hepatic transcription factor network during liver development.Genes Dev 20:2293–2305.
Leeder JS, Gaedigk R, Marcucci KA, Gaedigk A, Vyhlidal CA, Schindel BP, and Pearce RE(2005) Variability of CYP3A7 expression in human fetal liver. J Pharmacol Exp Ther314:626–635.
Li D, Gaedigk R, Hart SN, Leeder JS, and Zhong XB (2012) The role of CYP3A4 mRNAtranscript with shortened 3�-untranslated region in hepatocyte differentiation, liver develop-ment, and response to drug induction. Mol Pharmacol 81:86–96.
Li T, Huang J, Jiang Y, Zeng Y, He F, Zhang MQ, Han Z, and Zhang X (2009a) Multi-stageanalysis of gene expression and transcription regulation in C57/B6 mouse liver development.Genomics 93:235–242.
Li Y, Cui Y, Hart SN, Klaassen CD, and Zhong XB (2009b) Dynamic patterns of histonemethylation are associated with ontogenic expression of the Cyp3a genes during mouse livermaturation. Mol Pharmacol 75:1171–1179.
Malone JH and Oliver B (2011) Microarrays, deep sequencing and the true measure of thetranscriptome. BMC Biol 9:34.
Mortazavi A, Williams BA, McCue K, Schaeffer L, and Wold B (2008) Mapping and quantifyingmammalian transcriptomes by RNA-Seq. Nat Methods 5:621–628.
Muruganandan S and Sinal CJ (2008) Mice as clinically relevant models for the study ofcytochrome P450-dependent metabolism. Clin Pharmacol Ther 83:818–828.
Nagalakshmi U, Wang Z, Waern K, Shou C, Raha D, Gerstein M, and Snyder M (2008) Thetranscriptional landscape of the yeast genome defined by RNA sequencing. Science 320:1344–1349.
Nebert DW and Gonzalez FJ (1987) P450 genes: structure, evolution, and regulation. Annu RevBiochem 56:945–993.
Pan Q, Shai O, Lee LJ, Frey BJ, and Blencowe BJ (2008) Deep surveying of alternative splicingcomplexity in the human transcriptome by high-throughput sequencing. Nat Genet 40:1413–1415.
Pearce RE, Gotschall RR, Kearns GL, and Leeder JS (2001) Cytochrome P450 Involvement inthe biotransformation of cisapride and racemic norcisapride in vitro: differential activity ofindividual human CYP3A isoforms. Drug Metab Dispos 29:1548–1554.
Pesole G, Grillo G, Larizza A, and Liuni S (2000) The untranslated regions of eukaryoticmRNAs: structure, function, evolution and bioinformatic tools for their analysis. Brief Bioin-form 1:236–249.
Rowell M and Zlotkin S (1997) The ethical boundaries of drug research in pediatrics. PediatrClin North Am 44:27–40.
Schuetz JD, Beach DL, and Guzelian PS (1994) Selective expression of cytochrome P450CYP3A mRNAs in embryonic and adult human liver. Pharmacogenetics 4:11–20.
Stevens JC, Hines RN, Gu C, Koukouritaki SB, Manro JR, Tandler PJ, and Zaya MJ (2003)Developmental expression of the major human hepatic CYP3A enzymes. J Pharmacol ExpTher 307:573–582.
Trapnell C, Williams BA, Pertea G, Mortazavi A, Kwan G, van Baren MJ, Salzberg SL, WoldBJ, and Pachter L (2010) Transcript assembly and quantification by RNA-Seq revealsunannotated transcripts and isoform switching during cell differentiation. Nat Biotechnol28:511–515.
Treluyer JM, Rey E, Sonnier M, Pons G, and Cresteil T (2001) Evidence of impaired cisapridemetabolism in neonates. Br J Clin Pharmacol 52:419–425.
Wang ET, Sandberg R, Luo S, Khrebtukova I, Zhang L, Mayr C, Kingsmore SF, Schroth GP, andBurge CB (2008) Alternative isoform regulation in human tissue transcriptomes. Nature456:470–476.
Wang Z, Gerstein M, and Snyder M (2009) RNA-Seq: a revolutionary tool for transcriptomics.Nat Rev Genet 10:57–63.
Address correspondence to: Dr. Xiao-bo Zhong, Department of Pharmacol-ogy, Toxicology, and Therapeutics, The University of Kansas Medical Center,3901 Rainbow Blvd., Kansas City, KS 66160. E-mail: [email protected]
1209ONTOGENY OF P450s IN MOUSE LIVER REVEALED BY RNA-Seq
at ASPE
T Journals on July 6, 2018
dmd.aspetjournals.org
Dow
nloaded from