dmg mori co., ltd. fy 2017(jan- dec) q3 result ir ... how dmg mori addresses the changes in the...
TRANSCRIPT
0/34 IR Conference2017/11/7
DMG MORI CO., LTD.FY 2017(Jan- Dec) Q3 ResultIR Conference

1/34 IR Conference2017/11/7
Agenda
1)Financial summary of 3rd quarter
2)Business environment
3)Topics from DMG MORI• How DMG MORI addresses the changes in the market• ADAMOS to offer democratic MES (Manufacturing Execution System)
• Successful EMO to improve the presence in 5-axis, mill-turnand automation
• Deeper cooperation in CO-AG joint development• Higher precision with standardized SmartSCALE• Efforts in ESG

2/34 IR Conference2017/11/7
Highlights of 3 rd quarter 2017
�Record-high quarterly order intake(JPY term:+37%(Jul-Sep) /+23%(Jan-Sep) )
�Operating profit for the 9 months: JPY 14.9bn (previous year +2.6bn)
�Uplifted annual order intake forecast: more than JPY 430bn
�Success at EMO: improved presence in 5-axis, mill-turn, automation
�Quarterly free cash flows +JPY 12.3bn (2016Q3, cash outflow of JPY 6bn)
�ADAMOS to offer democratic MES(Manufacturing Execution System)
�Another upward revision of annual forecast: sales revenue (JPY403bn→415bn), operating profit (JPY 26bn→JPY 28bn)

3/34 IR Conference2017/11/7
2017Q3 Income statement summary
Jan – Mar Apr – Jun Jul – Sep Change Full-year forecast
(JPY bn) 2016 2017 2016 2017 2016 2017 (%) Previous New
Sales revenue 95.4 97.2 89.9 100.9 82.4 105.2 +27.6% 403.0 415.0
Operating profit 2.3 4.0 1.2 5.0 -0.8 5.9 26.0 28.0Operating profit margin (%)
2.4% 4.1% 1.3% 5.0% -1.0% 5.6% 6.5% 6.7%
Net financial cost -0.6 -1.1 -0.5 -1.0 -0.8 -1.1 -4.0 -4.5
(economic compensation associated with DA) - (-0.5) - (-0.5) (-0.2) (-0.5) (-2.0) (-2.1)
Net profit attributable to owners of the parent company
0.8 1.6 -0.1 2.0 -2.6 3.3 14.0 15.0
Depreciation & Amortization 4.3 4.4 4.1 4.5 3.9 4.5 17.0 17.5
Capex 2.9 1.6 4.2 2.2 2.5 2.6 10.0 10.0
USD/JPY 115.5 113.7 108.2 111.1 102.4 111.1 111.2 111.4
EUR/JPY 127.2 121.1 122.0 122.2 114.3 130.4 123.3 125.9
*FX rate for Q4 USD/JPY 110.0 110.0
EUR/JPY 125.0 130.0
4/34 IR Conference2017/11/7
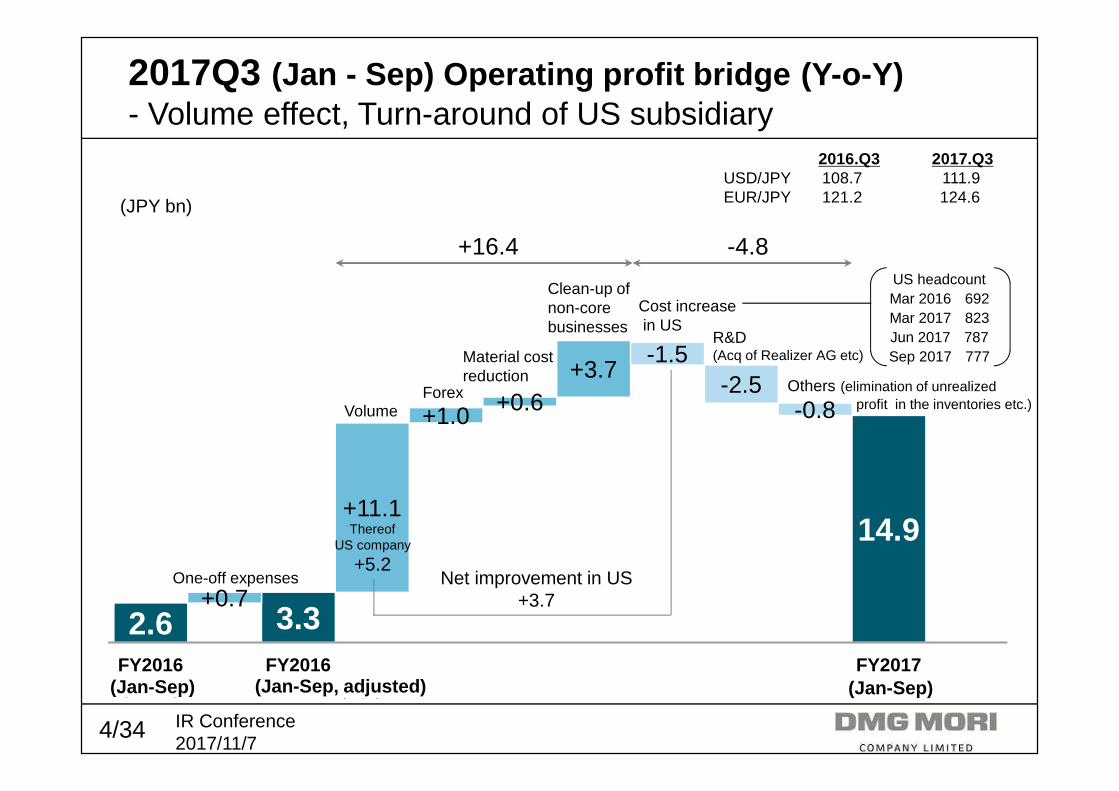
2.6 3.3
14.9
+0.7
+11.1
+1.0 +0.6 +3.7
-1.5-2.5
-0.8
FY2016(1-9月月月月)
FY2016(1-9月月月月)
FY2017(1-9月月月月)
2016.Q3 2017.Q3USD/JPY 108.7 111.9EUR/JPY 121.2 124.6
2017Q3 (Jan - Sep) Operating profit bridge (Y-o-Y)- Volume effect, Turn-around of US subsidiary
(JPY bn)
ThereofUS company
+5.2
Volume
Material cost reduction
Forex
R&D(Acq of Realizer AG etc)
Cost increasein US
Net improvement in US+3.7
+16.4 -4.8
Clean-up of non-core businesses
US headcountMar 2016 692Mar 2017 823Jun 2017 787Sep 2017 777
Others (elimination of unrealizedprofit in the inventories etc.)
One-off expenses
(実質)(実質)(実質)(実質)(Jan-Sep) (Jan-Sep, adjusted) (Jan-Sep)
5/34 IR Conference2017/11/7
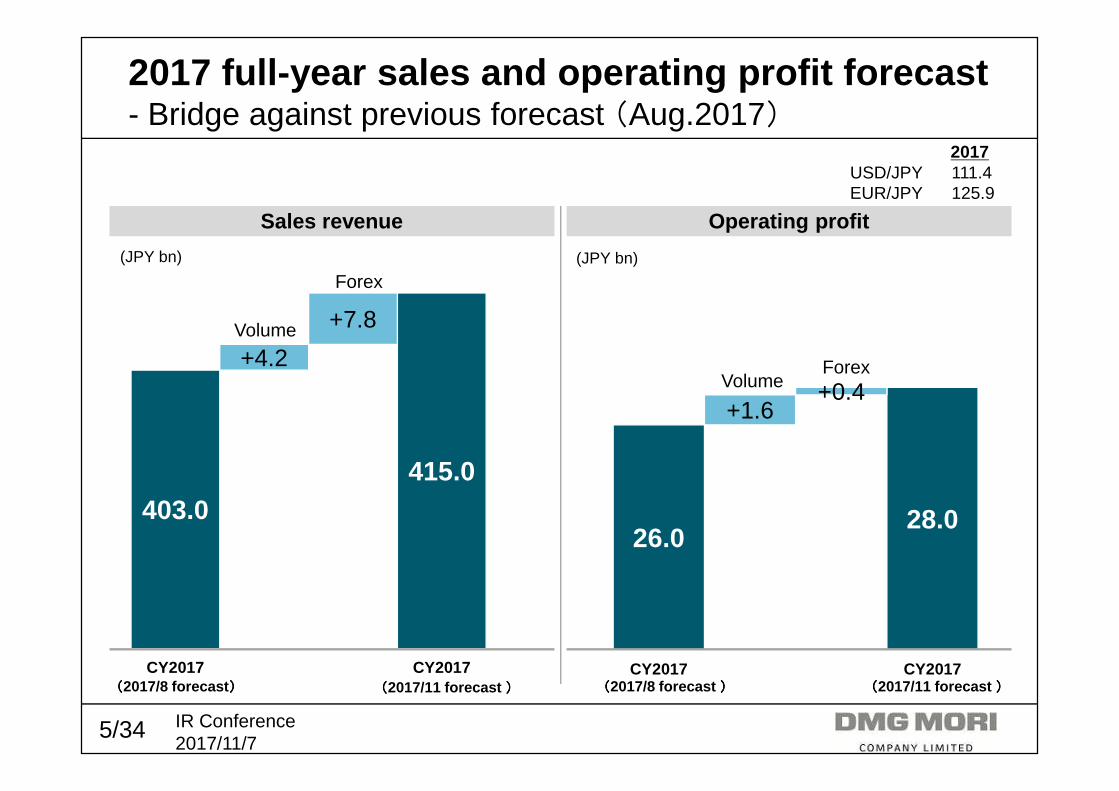
26.028.0
+1.6+0.4
CY2017 CY2017
2017USD/JPY 111.4EUR/JPY 125.9
2017 full-year sales and operating profit forecast- Bridge against previous forecast (Aug.2017)
403.0 415.0
+4.2
+7.8
CY2017 CY2017
Sales revenue
((((2017/8 forecast )))) ((((2017/11 forecast ))))((((2017/8 forecast )))) ((((2017/11 forecast ))))
Operating profit
Volume
Forex
VolumeForex
(JPY bn) (JPY bn)

6/34 IR Conference2017/11/7
7-9月 10-12 4-6 7-9
4-6
1-3 1-3
10-12 7-9
(JPY bn)2015 2016 2017
7-9 10-12 FY 1-3 4-6 7-9 10-12 FY 1-3 4-6 7-9 YTD
Cash flow from operation -3.2 35.4 18.6 -11.9 -1.4 -3.2 34.6 18.2 -7.8 3.2 12.3 7.6
Profit before taxes 4.1 -8.1 29.6 1.6 0.7 -1.6 -1.9 -1.1 2.9 4.0 4.7 11.7
Depreciation and amortization 3.9 6.8 14.6 4.3 4.1 3.9 5.3 17.7 4.4 4.5 4.5 13.4
Changes in working capital -5.7 32.5 19.9 -10.4 -8.3 -3.4 18.0 -4.1 -10.2 2.6 -2.0 -9.6
Others -5.6 4.2 -45.6 -7.4 2.1 -2.1 13.2 5.7 -4.9 -7.9 5.1 -7.8
Cash flow from investments -8.0 -7.8 -26.8 -2.9 -3.8 -2.8 -0.5 -10.0 -2.1 -2.0 0.0 -4.0
(thereof, acquisition of fixed assets) -7.7 -9.7 -24.4 -2.9 -4.2 -2.5 -5.6 -15.2 -1.6 -2.2 -2.6 -6.4
Free cash flows -11.2 27.6 -8.2 -14.8 -5.2 -6.0 34.1 8.1 -9.9 1.2 12.3 3.6
Cash flows- Strong positive free cash flow
+
- Quarterly free cash flows
7/34 IR Conference2017/11/7
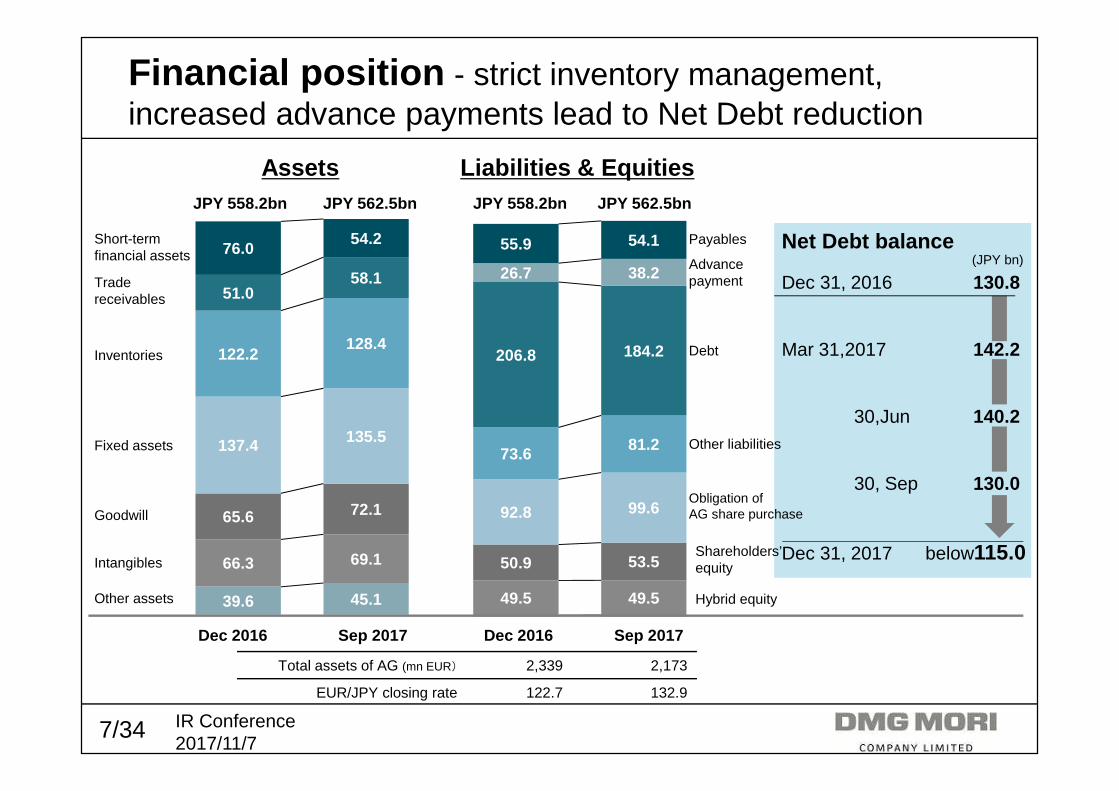
39.6 45.1
66.3 69.1
65.6 72.1
137.4 135.5
122.2128.4
51.058.1
76.054.2
49.5 49.5
50.9 53.5
92.8 99.6
73.6 81.2
206.8 184.2
26.7 38.2
55.9 54.1
Financial position - strict inventory management, increased advance payments lead to Net Debt reduction
Assets Liabilities & Equities
Dec 2016 Dec 2016Sep 2017 Sep 2017
JPY 558.2bn JPY 558.2bn5,425億円億円億円億円 5,425億円億円億円億円JPY 562.5bn JPY 562.5bn
Total assets of AG (mn EUR) 2,339 2,173
EUR/JPY closing rate 122.7 132.9
Net Debt balance
Dec 31, 2016 130.8
Mar 31,2017 142.2
30,Jun 140.2
30, Sep 130.0
Dec 31, 2017 below115.0
(JPY bn)
Short-term financial assets
Inventories
Trade receivables
Fixed assets
Goodwill
Intangibles
Other assets
Payables
Debt
Other liabilities
Obligation of AG share purchase
Shareholders’ equity
Hybrid equity
Advancepayment
8/34 IR Conference2017/11/7
Agenda
1)Financial summary of 3rd quarter
2)Business environment
3)Topics from DMG MORI• How DMG MORI address the changes in the market• ADAMOS to offer democratic MES (Manufacturing Execution System)
• Successful EMO to improve the presence in 5-axis, mill-turnand automation
• Deeper cooperation in CO-AG joint development• Higher precision with standardized SmartSCALE• Efforts in ESG
9/34 IR Conference2017/11/7
4,838
5,710
6,693
8,291 8,269
4,893
5,652
7,071 7,219
7,904
8,956 9,328
8,140
8,901
36.0
41.745.8
51.454.3
37.6
48.6
63.6
70.3
60.963.8
69.467.6
70.773.2
75.678.1
80.4
0
20
40
60
80
100
0
2,000
4,000
6,000
8,000
10,000
2004 2005 2006 2007 2008 2009 2010 2011 2012 2013 2014 2015 2016 2017.E 2018.E 2019.E 2020.E 2021.E
134.4 136.9 146.1 161.2 152.4 130.2 116.3 111.1 102.6 129.7 140.4 134.3 120.3 125.9
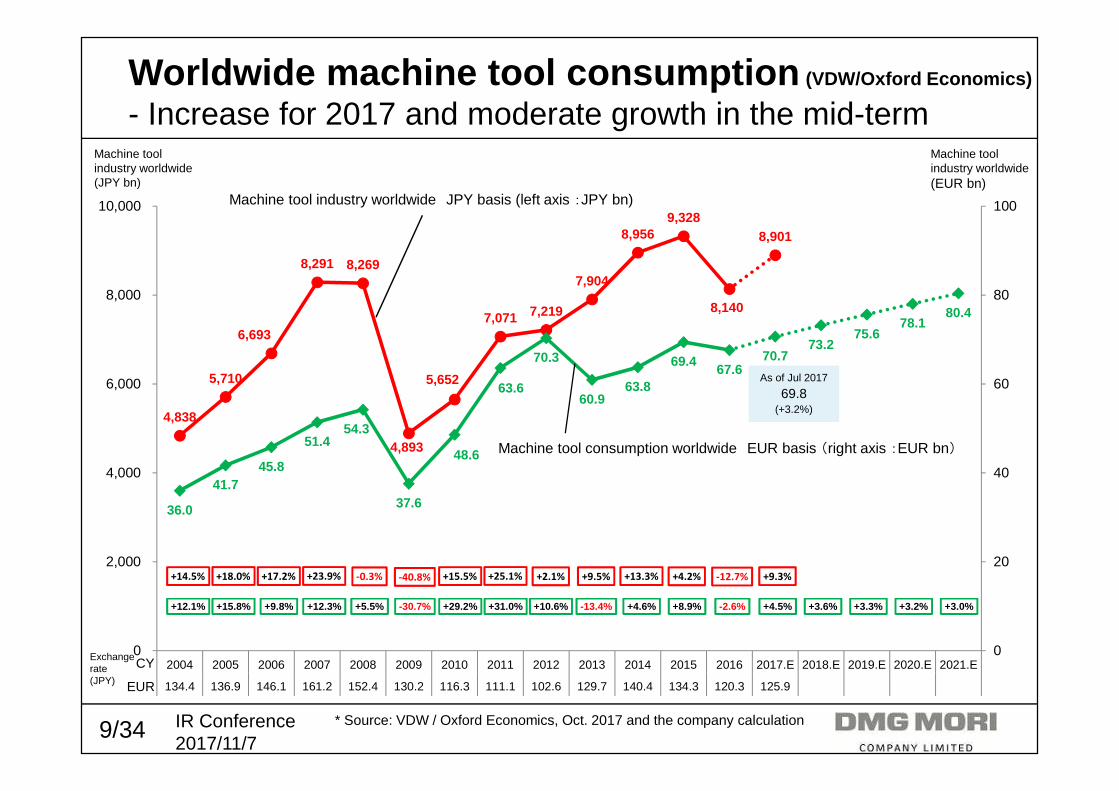
Machine tool consumption worldwide EUR basis (right axis :EUR bn)
Worldwide machine tool consumption (VDW/Oxford Economics)
- Increase for 2017 and moderate growth in the mid-term
* Source: VDW / Oxford Economics, Oct. 2017 and the company calculation
CY
EUR
+12.1% +15.8% +9.8% +12.3% +5.5% -30.7% +29.2% +31.0% +10.6% -13.4% +4.6% +8.9% -2.6% +4.5% +3.6% +3.3% +3.2% +3.0%
+14.5% +18.0% +17.2% +23.9% -0.3% -40.8% +15.5% +25.1% +2.1% +9.5% +13.3% +4.2% -12.7% +9.3%
As of Jul 2017
69.8(+3.2%)
Machine tool industry worldwide JPY basis (left axis :JPY bn)
Machine tool industry worldwide(EUR bn)
Machine tool industry worldwide(JPY bn)
Exchangerate(JPY)
10/34 IR Conference2017/11/7
7,219
7,904
8,956 9,328
8,140
8,901
3,006
3,454
4,060 3,838
3,670
4,300
70.3 60.963.8
69.4 67.670.7
0
20
40
60
80
100
0
2,000
4,000
6,000
8,000
10,000
2012 2013 2014 2015 2016 2017.E
102.6 129.7 140.4 134.3 120.3 125.9
+2.1%
+9.5%
+13.3%+4.2%
-12.7%
+9.3%
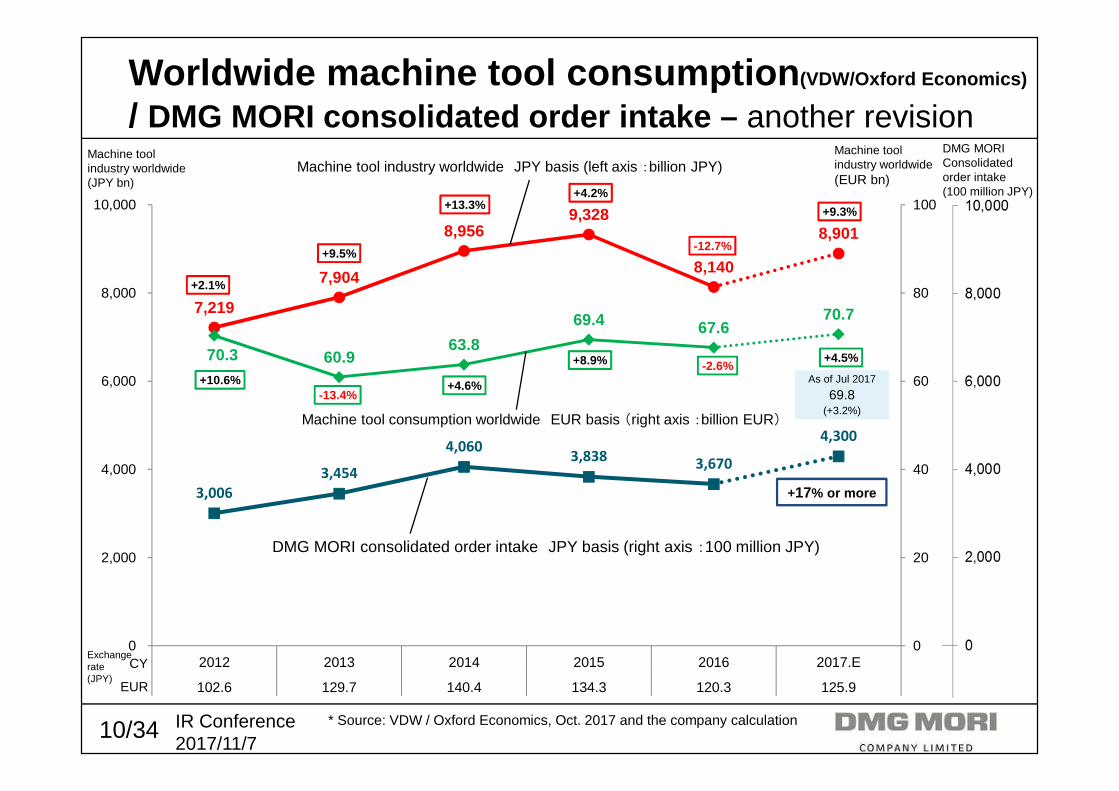
Worldwide machine tool consumption (VDW/Oxford Economics)
/ DMG MORI consolidated order intake – another revision
CY
EUR
+17% or more
+10.6%-13.4%
+4.6%
+8.9% -2.6%+4.5%
As of Jul 2017
69.8(+3.2%)
Machine tool industry worldwide JPY basis (left axis :billion JPY)
Machine tool consumption worldwide EUR basis (right axis :billion EUR)
DMG MORI consolidated order intake JPY basis (right axis :100 million JPY)
Machine tool industry worldwide(JPY bn)
Machine tool industry worldwide(EUR bn)
DMG MORIConsolidatedorder intake(100 million JPY)
Exchangerate(JPY)
* Source: VDW / Oxford Economics, Oct. 2017 and the company calculation
11/34 IR Conference2017/11/7
831 775
680 720
763
928 920
844
1,022 1,055
920
1,063
972
1,081
931 892
949 904 880 898
1,034
1,121
1,206
799 753
691 684 625
719 702
617
726 753
668 743 725
806
684 671 746 741 770 762
854 917 925
0
200
400
600
800
1,000
1,200
1,400
0
200
400
600
800
1,000
1,200
1,400
Jan-MarCY12
Apr-Jun Jul-Sep Oct-Dec Jan-MarCY13
Apr-Jun Jul-Sep Oct-Dec Jan-MarCY14
Apr-Jun Jul-Sep Oct-Dec Jan-MarCY15
Apr-Jun Jul-Sep Oct-Dec Jan-MarCY16
Apr-Jun Jul-Sep Oct-Dec Jan-MarCY17
Apr-Jun Jul-Sep
79.3 80.2 78.6 81.2 92.4 98.8 99.0 100.5 102.8 102.2 103.9 114.5 119.1 121.4 122.2 121.5 115.5 108.2 102.4 109.3 113.7 111.1 111.1
104.0 102.9 98.4 105.3 122.0 129.0 131.1 136.7 140.8 140.1 137.8 143.1 134.2 134.2 136.0 133.0 127.2 122.0 114.3 117.8 121.1 122.2 130.4
(million EUR)(100 million JPY)
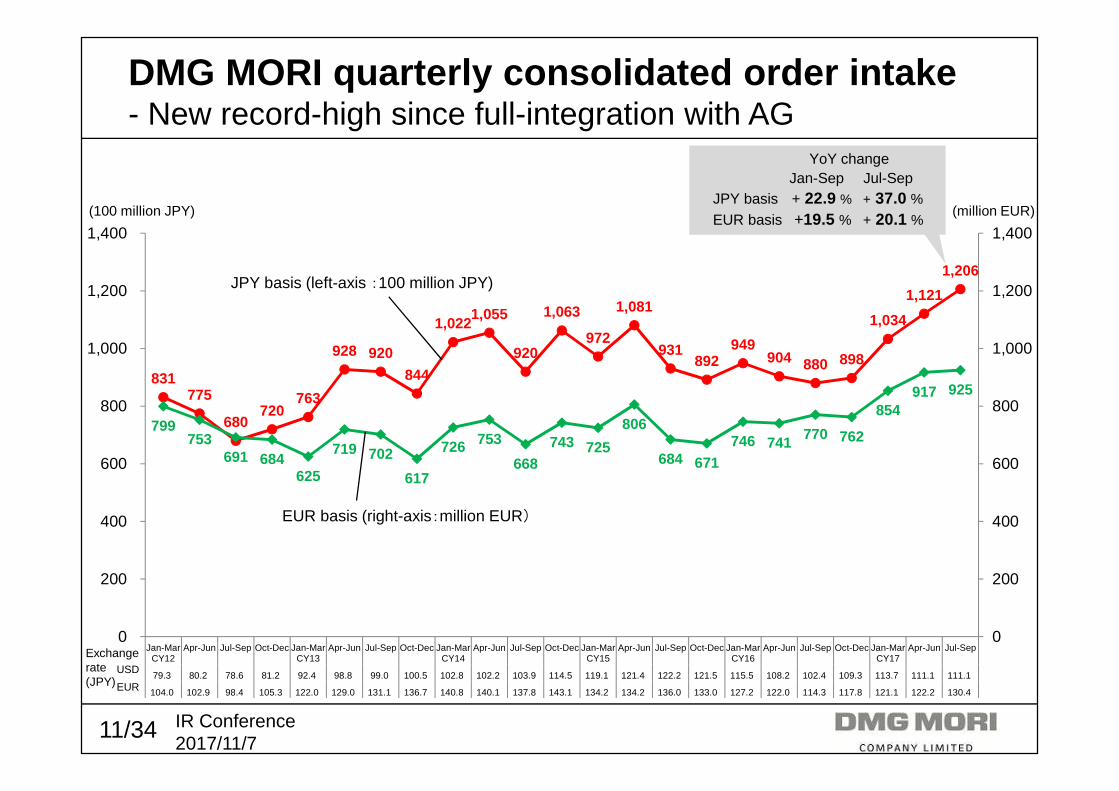
DMG MORI quarterly consolidated order intake- New record-high since full-integration with AG
USD
EUR
YoY changeJan-Sep Jul-Sep
JPY basis + 22.9 % + 37.0 %EUR basis +19.5 % + 20.1 %
JPY basis (left-axis :100 million JPY)
EUR basis (right-axis:million EUR)
Exchangerate(JPY)

12/34 IR Conference2017/11/7
Automobile
Aerospace
Machinery
Medical
Die & Mold
Energy
Construction
Electronics
Japan
Europe
USA
Americas
China
Asia
CY2016 CY2017 CY2017(As at Aug 2017) (As at Nov 2017)
Overview (by region & by industry)
Down Flat UP Down Flat UP Down Flat UP
CY2016 CY2017 CY2017(As at Aug 2017) (As at Nov 2017)
Down Flat UP Down Flat UP Down Flat UP
KoreaTaiwan
Region Industry
13/34 IR Conference2017/11/7
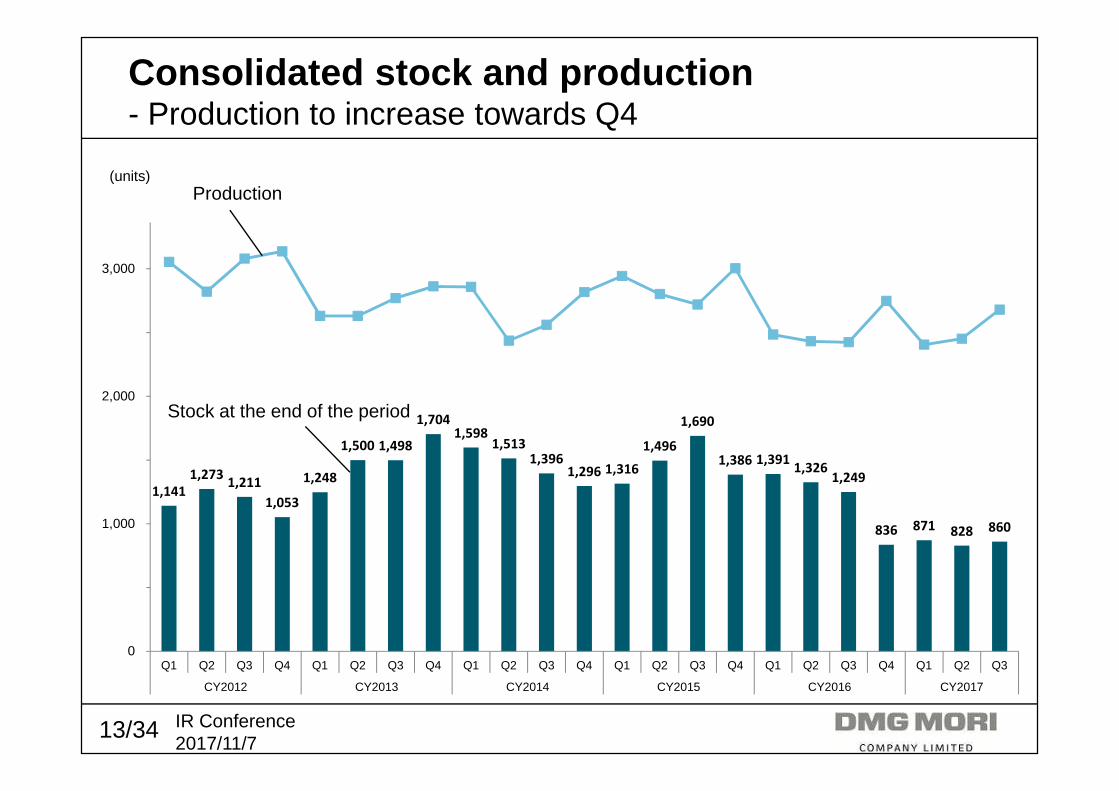
1,141
1,273 1,211
1,053
1,248
1,500 1,498
1,704 1,598
1,513 1,396
1,296 1,316
1,496
1,690
1,386 1,391 1,326
1,249
836 871 828 860
0
500
1,000
1,500
2,000
2,500
3,000
3,500
Q1 Q2 Q3 Q4 Q1 Q2 Q3 Q4 Q1 Q2 Q3 Q4 Q1 Q2 Q3 Q4 Q1 Q2 Q3 Q4 Q1 Q2 Q3
CY2012 CY2013 CY2014 CY2015 CY2016 CY2017
(units)
Consolidated stock and production- Production to increase towards Q4
Stock at the end of the period
Production

14/34 IR Conference2017/11/7
23% 24% 26%20%
27% 29% 25%26%
16% 12% 11%13%
32% 31% 33% 36%
2% 5% 5% 5%
34% 36% 38%
CY2016CY2014CY2012 CY2017.Jan-Sep
41%
Consolidated order intake - average price- Upward trend due to 5-axis, multi-function and automation
(million JPY) (thousand EUR)
CY
*machine body only6-month moving average
USD/JPY
EUR/JPY
CMX V seriesVertical Machining CenterTurning Center
Milturn Center
5-axis Machine
AdvancedTechnologies
HorizontalMachining Center
JPY basis (left axis: million JPY)
EUR basis (right axis :thousand EUR)

15/34 IR Conference2017/11/7
22%
31%6%
8%
3%
17%
13%20%
33%
6%
8%
3%
15%
15%
Order and sales composition (by region)
CY2017. Jan-Sep
*Europe, the Middle East and Africa
* Value basis* Machine body only
CY2017. Jan-SepConsolidated machine order intake Consolidated machine sales
USA
Japan
China
Germany
EMEA*RussiaTurkey
AsiaKoreaTaiwan
52%
USA
Japan
China
Germany
EMEA*RussiaTurkey
AsiaKoreaTaiwan
50%
AmericasAmericas
16/34 IR Conference2017/11/7
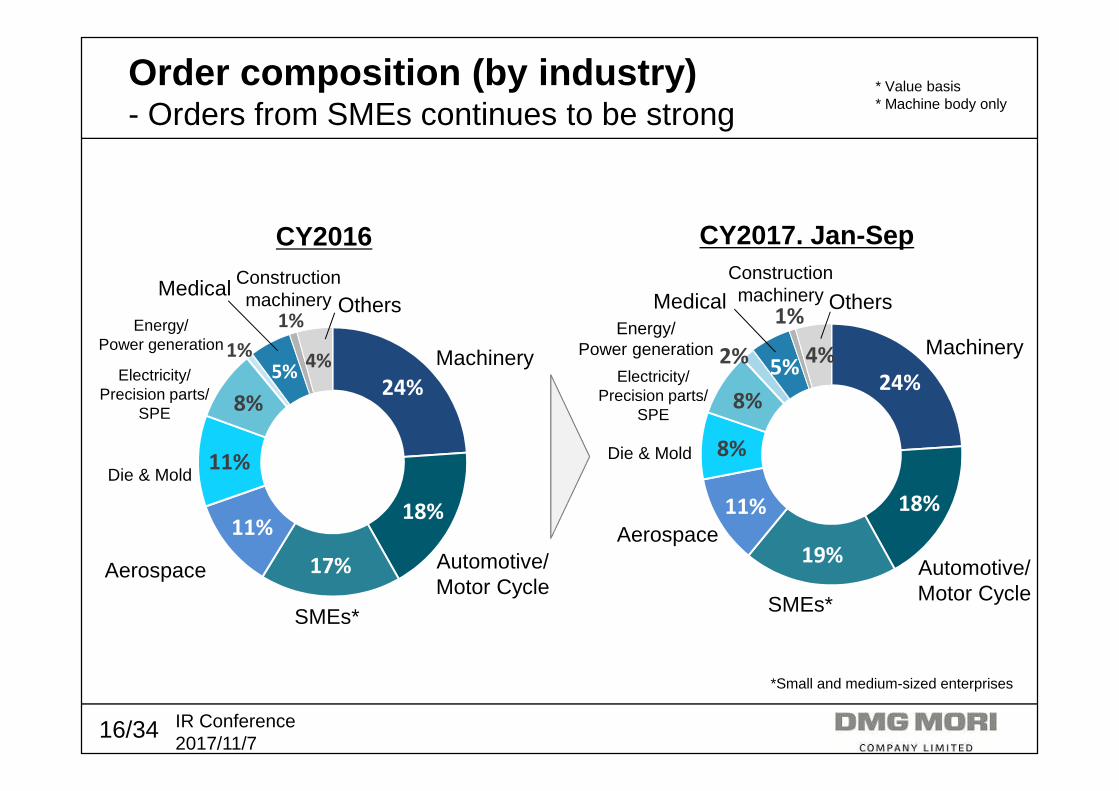
24%
18%
19%
11%
8%
8%
2%5%
1%
4%
CY2017. Jan-Sep
24%
18%
17%
11%
11%
8%
1%5%
1%
4%
Energy/Power generation
Machinery
Automotive/Motor Cycle
SMEs*
Aerospace
Die & Mold
Electricity/Precision parts/
SPE
MedicalOthers
Constructionmachinery
Energy/Power generation Machinery
Automotive/Motor CycleSMEs*
Aerospace
Die & Mold
Electricity/Precision parts/
SPE
Medical OthersConstructionmachinery
Order composition (by industry)- Orders from SMEs continues to be strong
*Small and medium-sized enterprises
CY2016
* Value basis* Machine body only
17/34 IR Conference2017/11/7
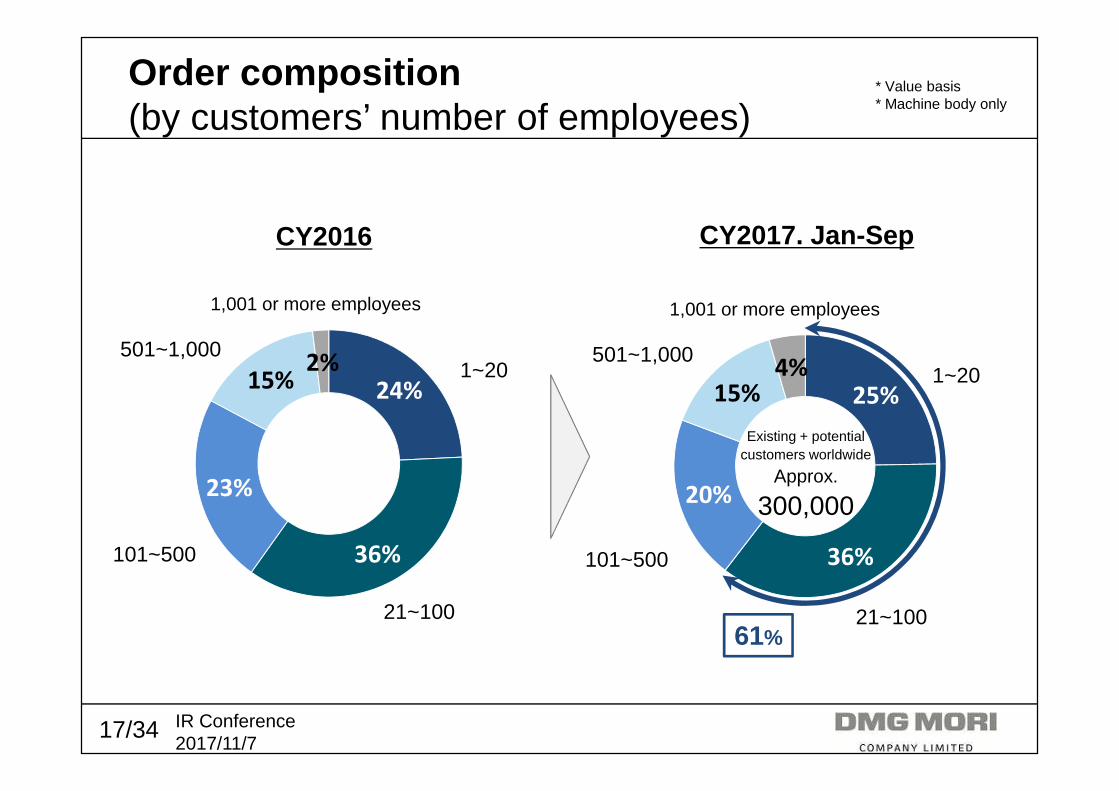
25%
36%
20%
15%4%
24%
36%
23%
15%2%
Order composition(by customers’ number of employees)
CY2016 CY2017. Jan-Sep
1~20
21~100
101~500
501~1,000
1,001 or more employees
61%
1~20
21~100
101~500
501~1,000
1,001 or more employees
* Value basis* Machine body only
Existing + potentialcustomers worldwide
Approx.
300,000

18/34 IR Conference2017/11/7
5%
36%
13%
26%
4%
16%5%
33%
11%25%
1%
9%
16%
Order composition (by product type)- Further expansion of 5-axis machines and mill-turn
5-axisMachine
Millturn Center HorizontalMachining Center
Advanced TechnologiesVertical Machining CenterTurning Center
CMXV series
(From Sep 2016)
ECOLINE
CY2016 CY2017. Jan-Sep
5-axisMachine
Millturn CenterHorizontal
Machining Center
Advanced TechnologiesVertical Machining CenterTurning Center
CMXV series
* Value basis* Machine body only
19/34 IR Conference2017/11/7
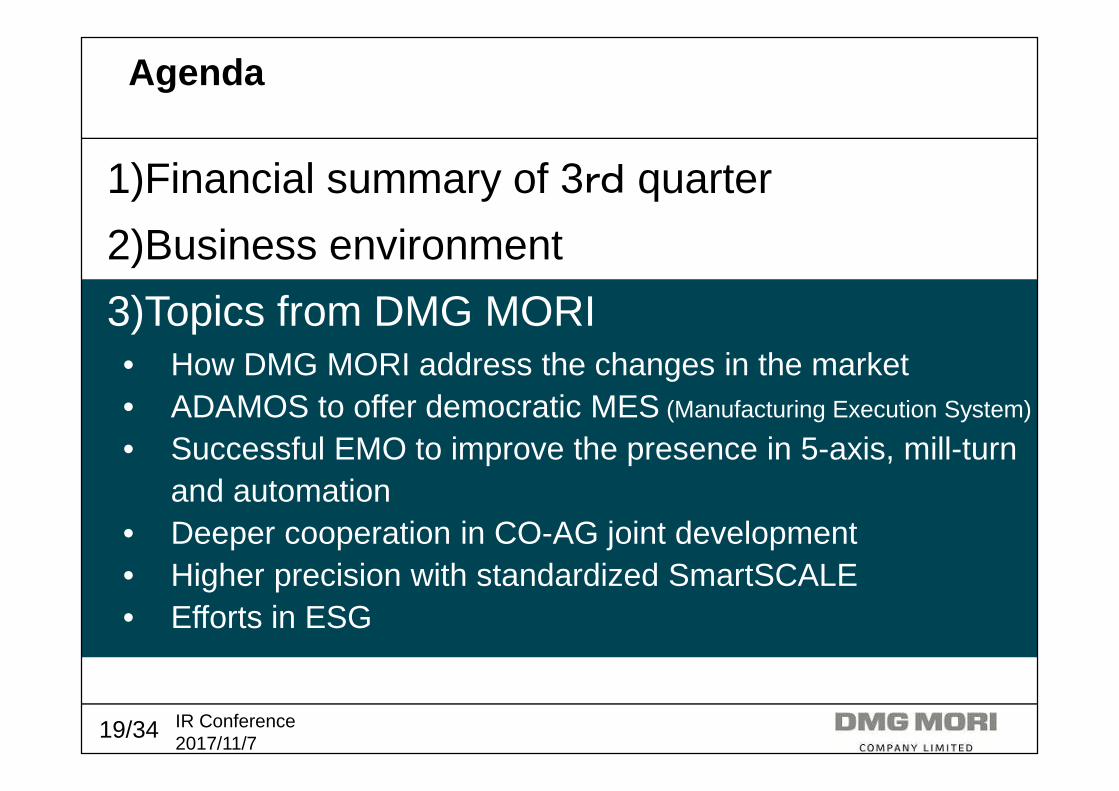
Agenda
1)Financial summary of 3rd quarter
2)Business environment
3)Topics from DMG MORI• How DMG MORI address the changes in the market• ADAMOS to offer democratic MES (Manufacturing Execution System)
• Successful EMO to improve the presence in 5-axis, mill-turnand automation
• Deeper cooperation in CO-AG joint development• Higher precision with standardized SmartSCALE• Efforts in ESG
20/34 IR Conference2017/11/7
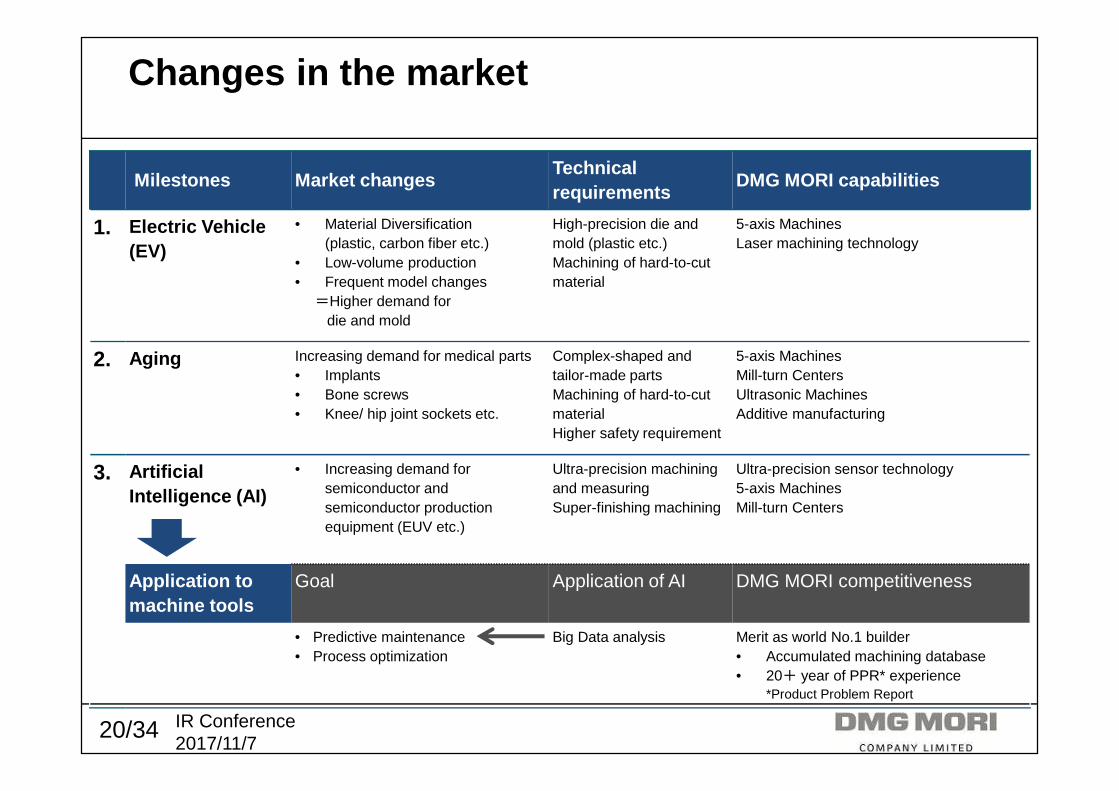
Milestones Market changesTechnical requirements
DMG MORI capabilities
1. Electric Vehicle(EV)
• Material Diversification(plastic, carbon fiber etc.)
• Low-volume production• Frequent model changes =Higher demand for
die and mold
High-precision die and mold (plastic etc.)Machining of hard-to-cutmaterial
5-axis MachinesLaser machining technology
2. Aging Increasing demand for medical parts• Implants• Bone screws • Knee/ hip joint sockets etc.
Complex-shaped and tailor-made partsMachining of hard-to-cut materialHigher safety requirement
5-axis MachinesMill-turn CentersUltrasonic MachinesAdditive manufacturing
3. ArtificialIntelligence (AI)
• Increasing demand for semiconductor and semiconductor production equipment (EUV etc.)
Ultra-precision machining and measuringSuper-finishing machining
Ultra-precision sensor technology5-axis MachinesMill-turn Centers
Application to machine tools
Goal Application of AI DMG MORI competitiveness
• Predictive maintenance• Process optimization
Big Data analysis Merit as world No.1 builder• Accumulated machining database• 20+ year of PPR* experience
*Product Problem Report
Changes in the market
21/34 IR Conference2017/11/7
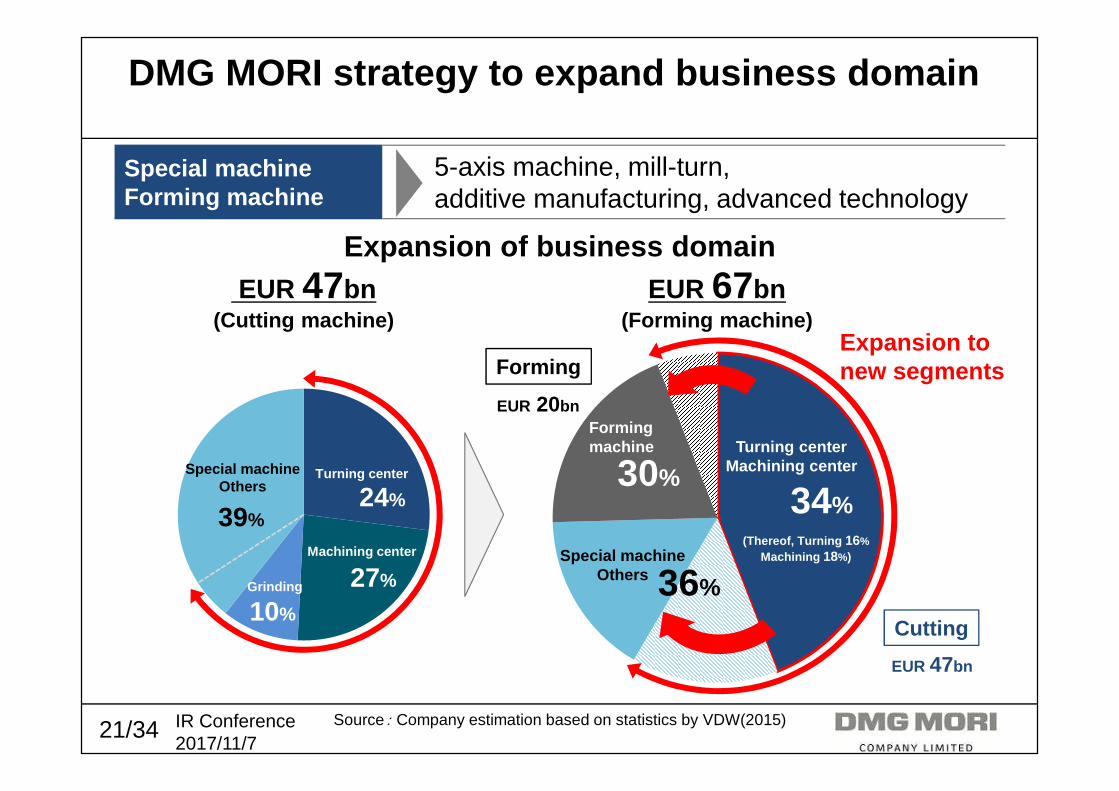
DMG MORI strategy to expand business domain
Turning centerMachining center
マシニングセンタマシニングセンタマシニングセンタマシニングセンタ
Special machineOthers
Cutting
Forming
Formingmachine
Expansion of business domain
34%
Source: Company estimation based on statistics by VDW(2015)
36%
30%
EUR 47bn
EUR 20bn
(Thereof, Turning 16%
Machining 18%)
Expansion tonew segments
Turning center
24%
Grinding
Special machineOthers
10%
39%
EUR 47bn(Cutting machine)
EUR 67bn(Forming machine)
Special machineForming machine
5-axis machine, mill-turn,additive manufacturing, advanced technology
Machining center
27%
22/34 IR Conference2017/11/7
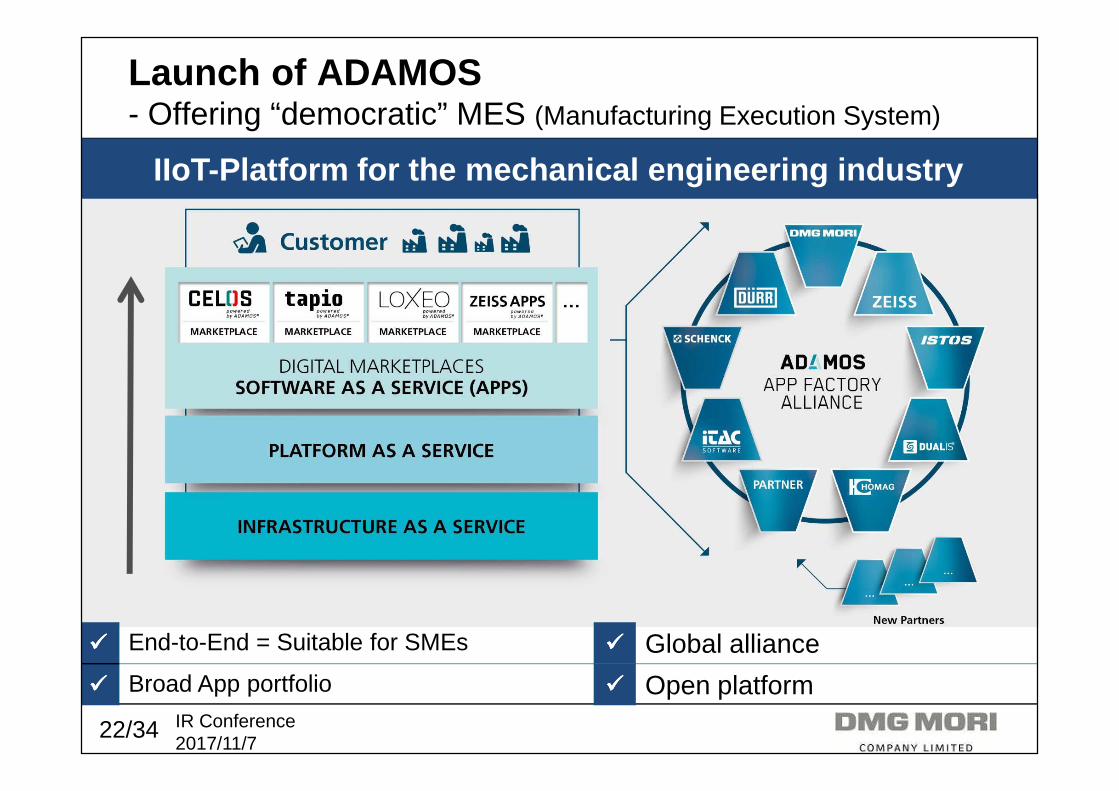
Launch of ADAMOS- Offering “democratic” MES (Manufacturing Execution System)
IIoT-Platform for the mechanical engineering indust ry
���� End-to-End = Suitable for SMEs ���� Global alliance
���� Broad App portfolio ���� Open platform

23/34 IR Conference2017/11/7
ADAMOS – Path of digitization
~ 1 msec.
powered by
NETbox NETboxNETbox
Machines from other makers
Peripheralequipments
AutomationRobots
� Data Security� Data Storage� Data Analysis� Device Management� Scheduler
Infrastructure
……
� Big Data Analysis� Predictive Maintenance� Service BoM Management
MachineEdge
~ 100msec.
Factory
1 sec. ~
Company
Cloud
Available with Cloud and server with tight security

24/34 IR Conference2017/11/7
EMO (Sep 2017, Hannover) - A whole building to showour latest technology and expertise by themes
5%
42%
9%
23%
21%
� Order intake +11% from EMO 2013 (last EMO held in Hannover)
The video clip of the press conference is available here;https://youtu.be/TFgCukaBezw
Technical press conference Order intake (by model)
Approx. 50%
5-axis Machine
Millturn Center
HorizontalMachining Center
Advanced Technologies
Vertical Machining CenterTurning Center
130 technical journalists joined from all over the world
Approx. 65%with Automation

25/34 IR Conference2017/11/7
44%40% 39%
35%32%
14%
0%
50%
Germany EMEA* Asia USA China Japan
(Jan-Sep, 2017)
5-axis machine sales promotion in Japan
� Exhibiting 5-axis machines to appeal the accuracy andproductivity
Global average
36%
5-axis machines’ share in order intake ((((by region ))))
� Utilizing DMU50 3rd Generation to develop machining processes with top 50 users
� Training operators for customers
DMU50 3rd Generation
*Europe, the Middle East and Africa

26/34 IR Conference2017/11/7
Overview
4th GDS
Location Seebach (Germany)
No. of participants
180 developers for10 workshops
Achievements in the past
• Portfolio integration(CTX, CMX etc.)
• Common PPR system• Technology Cycles
extension• Digital Twin/ DMC340G
� Accelerating global projects via face-to-face meetings
Global Development Summit (GDS)September 2017

27/34 IR Conference2017/11/7
� Combined AG (CTX) and CO models (NLX) to develop into a machine with Europe specifications and a spindle produced in Iga
Deeper global collaboration in the product development – Example: CTX2500
Feb, 2017
� Manufacturing training at Iga
Jun, 2016
� Project launch
May
� Assembly start at Bielefeld
Sep
� World Premiereat EMO2017
Mass production from November
Scraping training for FAMOT(Poland) employees at Iga
� Casting part machiningat FAMOT

28/34 IR Conference2017/11/7
� 3-year warranty for MASTER series, the world’s best spindles (starting 2018)
� Feedback from SmartSCALE
DMU50 3rd Generation, NHX6300 2nd Generation on sale
� Improved cutting capability and accuracy byin-house components
DMU50 3rd Generation NHX6300 2nd Generation

29/34 IR Conference2017/11/7
All axes equipped with SmartSCALE toenhance accuracy – New in the industry
� Full-closed loop for more precise control with SmartSCALE developed by
Full-closed loop⇒⇒⇒⇒The scale gives feedback on detected positions
With scalesWith scales
Encoder
CNC
Servo motor
MotorAmplifier
Semi-closed loop⇒⇒⇒⇒The drive mechanism can cause errors
Without scalesWithout scales
Encoder
Servo Motor
CNC
MotorAmplifier
Linear scale
Magnescale Co., Ltd
Sales 2017 JPY 10bn+
Good demand from Semiconductor and machine tools
30/34 IR Conference2017/11/7
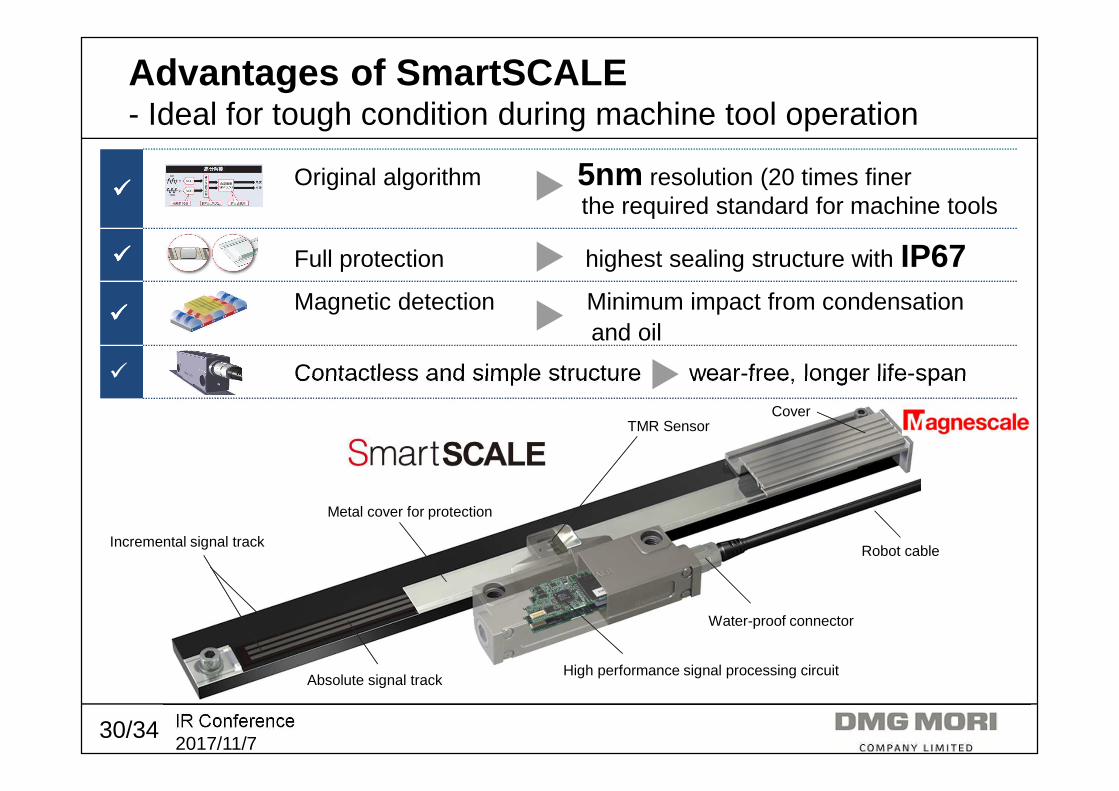
����Original algorithm 5nm resolution (20 times finer
���� Full protection highest sealing structure with IP67
����Magnetic detection Minimum impact from condensation
� Contactless and simple structure wear-free, longer life-span
Advantages of SmartSCALE- Ideal for tough condition during machine tool operation
TMR Sensor
Incremental signal track
Metal cover for protection
Absolute signal trackHigh performance signal processing circuit
Water-proof connector
Robot cable
Cover
the required standard for machine tools
and oil

31/34 IR Conference2017/11/7
More environment-friendly– Expanding GREENmode functions towards 2020
Sample results (per workpiece)
ModelEnergy
consumptionCycle time
Mill-turnNTX2000
885Whreduction
(-17.1%)
2min.6sec.shorter
(-5.8%)
Monitoring
Idle reduction
Device
Control
15 items
201720+ items
2020
Sample workpiece:Nut
Breakdown of energy consumption reduction
80%
12%8%
Highly efficient control by inverter
Power cut-off on non-operational axis
Cycle time reduction

32/34 IR Conference2017/11/7
Internal day-care centers (for main plants/offices)- Japan’s highest standard child-care and education
� Available for all the female and male permanent employees with pre-school children
� Operated by Poppins Co., Ltd. Received “Health, Labor and Welfare Ministry Award” in the 1st Nihon Service Award (June, 2016)
� Opening hours depending on each location’s operating schedule
� Extensive education program (English classes etc.)
Image (Iga/Nara)
Schedule2017 October Orientation, Application2018 February Facilities completion
March PreviewApril Open
33/34 IR Conference2017/11/7
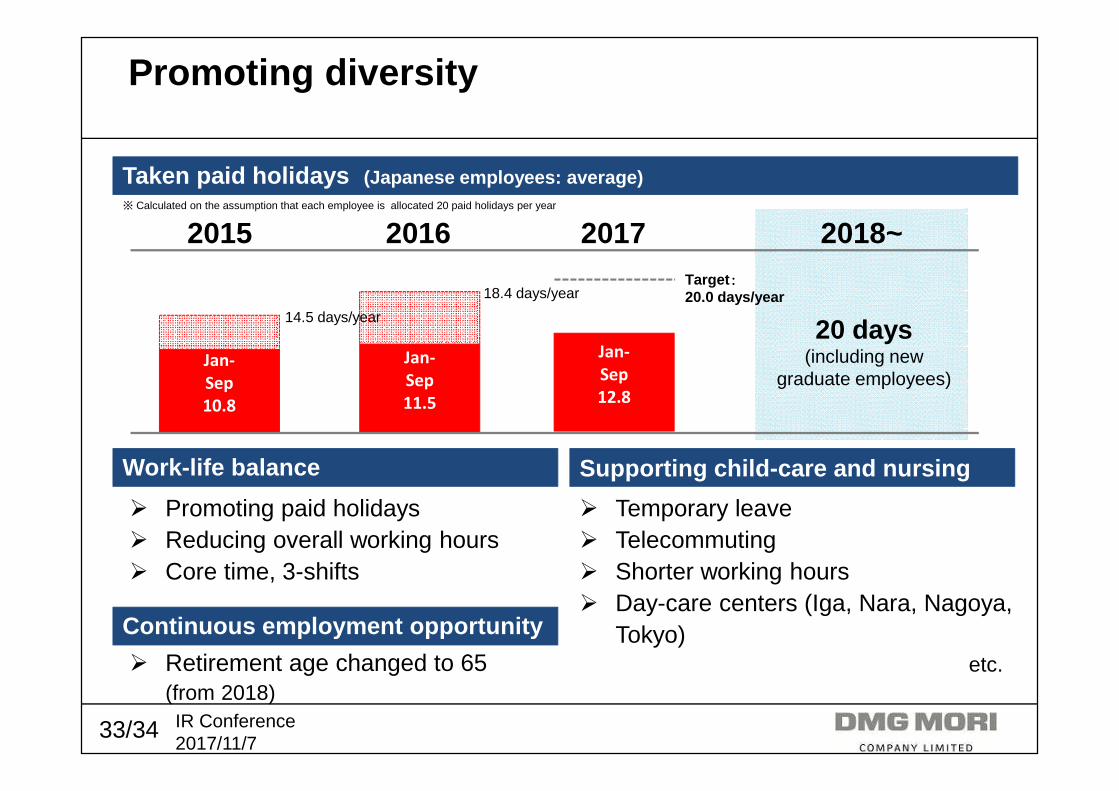
Jan-
Sep
12.8
� Promoting paid holidays� Reducing overall working hours� Core time, 3-shifts
Promoting diversity
Taken paid holidays (Japanese employees: average)
2015 2016 2017
20 days(including new
graduate employees)
Work-life balance Supporting child-care and nursing
� Temporary leave� Telecommuting� Shorter working hours� Day-care centers (Iga, Nara, Nagoya,
Tokyo)etc.
Jan-
Sep
10.8
Jan-
Sep
11.5
Target ::::20.0 days/year
※ Calculated on the assumption that each employee is allocated 20 paid holidays per year
2018~
14.5 days/year
18.4 days/year
Continuous employment opportunity
� Retirement age changed to 65 (from 2018)

34/34 IR Conference2017/11/7
Disclaimer
This material contains targets, plans, etc. concerning the future of DMG MORI CO., LTD. and the DMG MORI Group. All predictions concerning the future are judgments and assumptions based on information available to DMG MORI at the time of writing. There is a possibility that the actual future results may differ significantly from these forecasts, due to changes in management policy or changes in external factors.
There are many factors which contain elements of uncertainty or the possibility of fluctuation including, but not limited to, the following:
� Fluctuations in exchange rates� Changes to the laws, regulations and government policies in the markets
where DMG MORI CO., LTD. conducts its business� DMG MORI CO., LTD.’s ability to develop and sell new products in a timely fashion� Instability of governments in the markets where DMG MORI CO., LTD. conducts its
business� Operational changes by the competent authorities or regulations related to anti-trust, etc.