dmm 2017 q4 report highlights - california iso 2017 q4 report highlights gabe murtaugh ... in the...
TRANSCRIPT

DMM 2017 Q4 Report Highlights
Gabe MurtaughSenior AnalystDepartment of Market Monitoring
Conference CallFebruary 21, 2018

• Real-time market performance– Higher prices in the 15-minute market– Large congestion revenue rights losses
• EIM market performance• Special issues and recommendations
– Wind and solar downward dispatch– Use of Aliso Canyon measures– Capacity procurement
Page 2
Outline
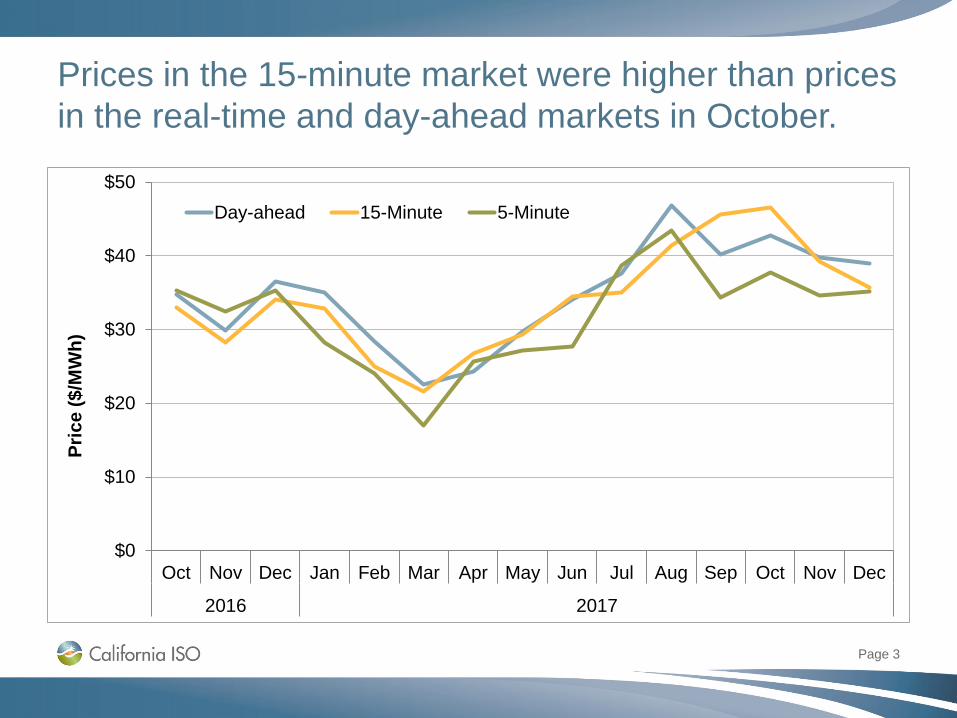
Prices in the 15-minute market were higher than prices in the real-time and day-ahead markets in October.
Page 3
$0
$10
$20
$30
$40
$50
Oct Nov Dec Jan Feb Mar Apr May Jun Jul Aug Sep Oct Nov Dec
2016 2017
Pric
e ($
/MW
h)
Day-ahead 15-Minute 5-Minute

ISO prices continue to follow the net-load pattern. Net loads were lowest during the middle of the day.
Page 4
0
5,000
10,000
15,000
20,000
25,000
30,000
$0
$20
$40
$60
$80
$100
$120
1 2 3 4 5 6 7 8 9 10 11 12 13 14 15 16 17 18 19 20 21 22 23 24
Aver
age
net s
yste
m lo
ad (M
W)
Pric
e ($
/MW
h)
Day-ahead 15-minute 5-minute Average net load

The power balance constraint was triggered more frequently in the 15-minute market this quarter.
Page 5
0.0%
0.1%
0.2%
0.3%
0.4%
0.5%
0.6%
0.7%
0.8%Ja
nFe
bM
ar Apr
May Jun
Jul
Aug
Sep Oct
Nov
Dec Jan
Feb
Mar Apr
May Jun
Jul
Aug
Sep Oct
Nov
Dec
2016 2017
Perc
ent o
f 15-
min
ute
inte
rval
s
Valid under-supply infeasibility (shortage)
Load bias limiter resolved infeasibility
Corrected or invalid infeasibility
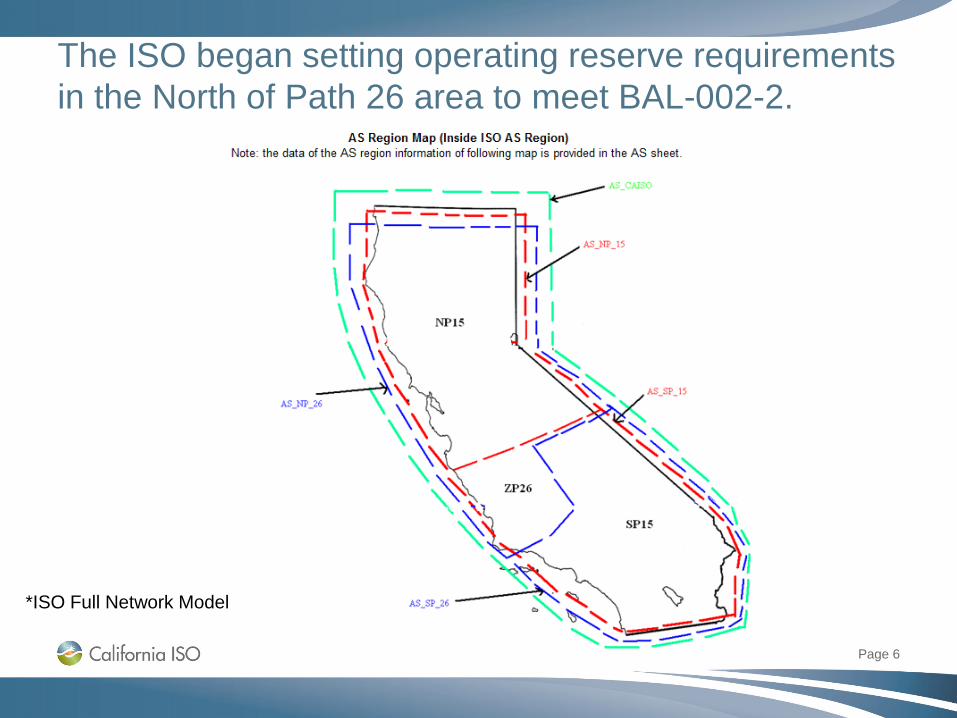
The ISO began setting operating reserve requirements in the North of Path 26 area to meet BAL-002-2.
*ISO Full Network Model
Page 6
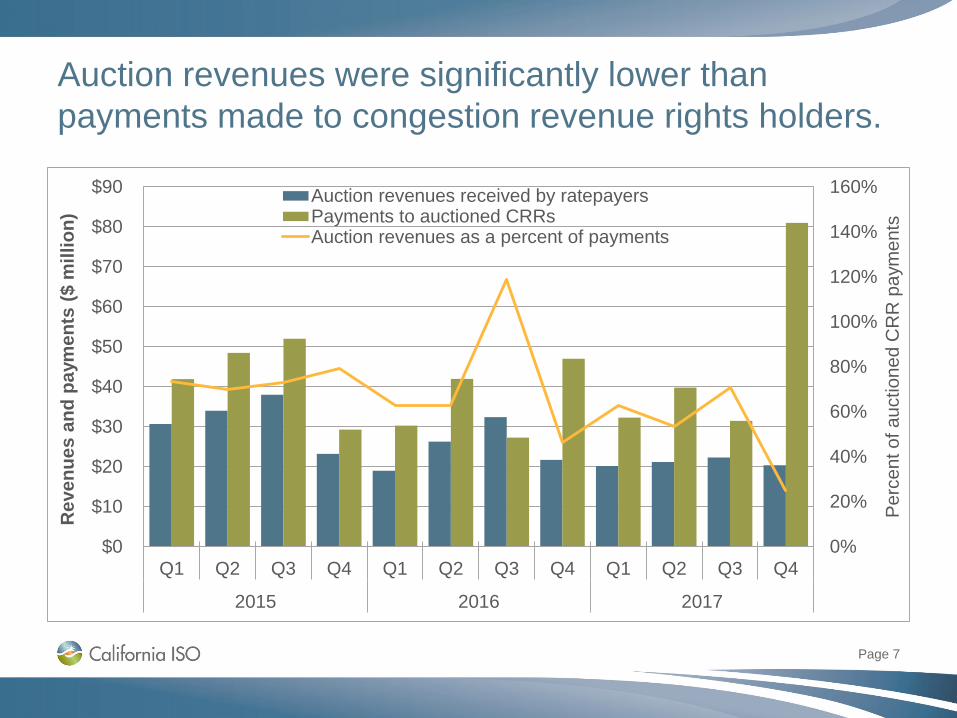
Auction revenues were significantly lower than payments made to congestion revenue rights holders.
Page 7
0%
20%
40%
60%
80%
100%
120%
140%
160%
$0
$10
$20
$30
$40
$50
$60
$70
$80
$90
Q1 Q2 Q3 Q4 Q1 Q2 Q3 Q4 Q1 Q2 Q3 Q4
2015 2016 2017
Per
cent
of a
uctio
ned
CR
R p
aym
ents
Rev
enue
s an
d pa
ymen
ts ($
mill
ion)
Auction revenues received by ratepayersPayments to auctioned CRRsAuction revenues as a percent of payments

Payments for the flexible ramping capacity product were low in the fourth quarter.
Page 8
$0.00
$0.04
$0.08
$0.12
$0.16
$0.20
$0.24
$0.00
$1.00
$2.00
$3.00
$4.00
$5.00
$6.00
Nov Dec Jan Feb Mar Apr May Jun Jul Aug Sep Oct Nov Dec
2016 2017
Paym
ents
per
MW
h lo
ad ($
/MW
h)
Tota
l pay
men
ts ($
mill
ion)
California ISO PacifiCorp EastPacifiCorp West NV EnergyPuget Sound Energy Arizona Public ServicePortland General Electric Payments per MWh of load
The ISO discussed issues with the flexible ramping capacity with the Market Planning and Performance meeting on Feb 20:http://wwwpub.oa.caiso.com:21083/Documents/AgendaandPresentation-MarketPerfomanceandPlanningForum-Feb202018.pdf

Prices in all energy imbalance markets continue to mirror patterns in the ISO.
Page 9
$0
$20
$40
$60
$80
$100
$120
$140
1 2 3 4 5 6 7 8 9 10 11 12 13 14 15 16 17 18 19 20 21 22 23 24
Aver
age
hour
ly p
rice
($/M
Wh)
PacifiCorp West, Puget Sound Energy, and Portland General ElectricPacifiCorp EastNV Energy and Arizona Public ServiceSouthern California Edison

Energy imbalance market participants are failing the sufficiency test less often than last year.
Page 10
0%
10%
20%
30%
40%
50%
60%
Nov Dec Jan Feb Mar Apr May Jun Jul Aug Sep Oct Nov Dec
2016 2017
Perc
ent o
f hou
rs
California ISO PacifiCorp East PacifiCorp WestNV Energy Puget Sound Energy Arizona Public ServicePortland General Electric
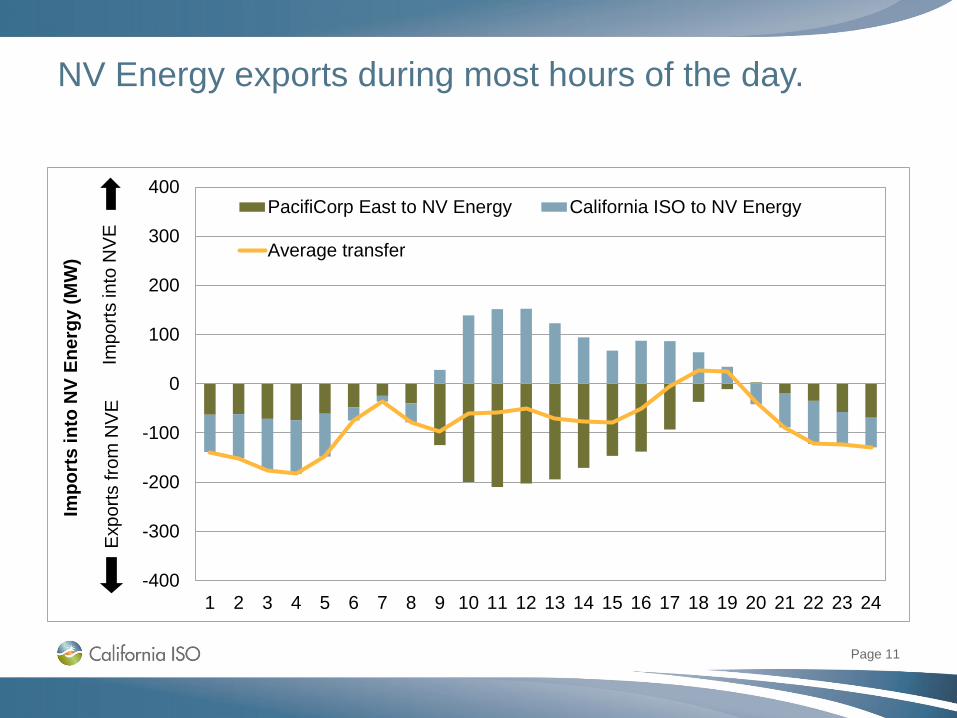
NV Energy exports during most hours of the day.
Page 11
-400
-300
-200
-100
0
100
200
300
400
1 2 3 4 5 6 7 8 9 10 11 12 13 14 15 16 17 18 19 20 21 22 23 24
Impo
rts
into
NV
Ener
gy (M
W)
PacifiCorp East to NV Energy California ISO to NV Energy
Average transfer
Impo
rts in
to N
VE
Exp
orts
from
NV
E
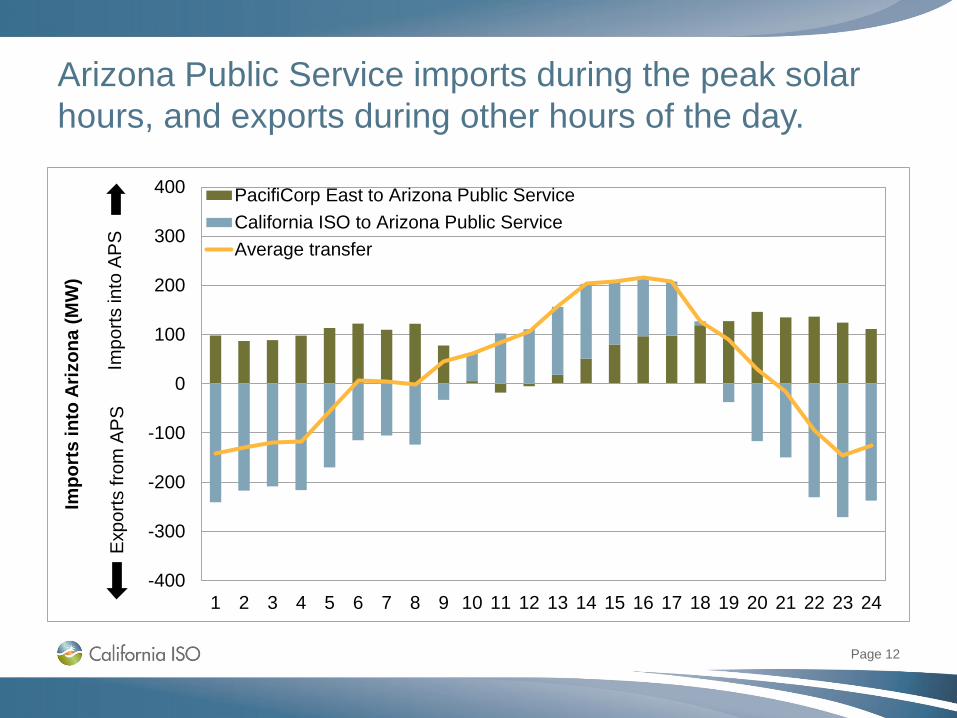
Arizona Public Service imports during the peak solar hours, and exports during other hours of the day.
Page 12
-400
-300
-200
-100
0
100
200
300
400
1 2 3 4 5 6 7 8 9 10 11 12 13 14 15 16 17 18 19 20 21 22 23 24
Impo
rts
into
Ariz
ona
(MW
)
PacifiCorp East to Arizona Public ServiceCalifornia ISO to Arizona Public ServiceAverage transfer
Impo
rts in
to A
PS
Exp
orts
from
AP
S

PacifiCorp West exports during most hours of the day.
Page 13
-250
-200
-150
-100
-50
0
50
100
150
200
250
1 2 3 4 5 6 7 8 9 10 11 12 13 14 15 16 17 18 19 20 21 22 23 24
Impo
rts
into
Pac
ifiC
orp
Wes
t (M
W)
ISO to PacifiCorp WestPacifiCorp East to PacifiCorp WestPuget Sound Energy to PacifiCorp WestPortland to PacfiCorp WestAverage transfer
Impo
rts in
to P
AC
WE
xpor
ts fr
om P
AC
W

Renewable downward dispatch increased from 2016, while curtailments continued to be very small.
Page 14
0%
1%
2%
3%
4%
5%
6%
7%
8%
0
20
40
60
80
100
120
140
160
Jan
Feb
Mar Apr
May Jun
Jul
Aug
Sep Oct
Nov
Dec Jan
Feb
Mar Apr
May Jun
Jul
Aug
Sep Oct
Nov
Dec
Perc
ent r
educ
tion
Meg
atw
att h
our (
thou
sand
s)
Economic downward dispatch (ISO)Self-scheduled curtailment (ISO)Economic downward dispatch (EIM)Wind and solar percent reduction (ISO)
2016 2017

Aliso adders were in place for a large number of days during the quarter.
Page 15

Many of the resources eligible for the Aliso adders did not include them in bids.
Page 16
0%
20%
40%
60%
80%
100%
23-O
ct24
-Oct
25-O
ct7-
Dec
8-D
ec9-
Dec
10-D
ec11
-Dec
12-D
ec13
-Dec
14-D
ec15
-Dec
16-D
ec17
-Dec
18-D
ec19
-Dec
20-D
ec21
-Dec
22-D
ec23
-Dec
24-D
ec25
-Dec
26-D
ec27
-Dec
28-D
ec29
-Dec
30-D
ec31
-Dec
Perc
ent S
oCal
Gas
min
imum
load
ca
paci
ty
Bid does not use scalar Bid uses scalar, not near capBid uses scalar, at or near cap
Page 17
$0.0
$0.5
$1.0
$1.5
$2.0
Jan Feb Mar Apr May Jun Jul Aug Sep Oct Nov Dec
2017
Bid
cos
t rec
over
y pa
ymen
ts ($
mill
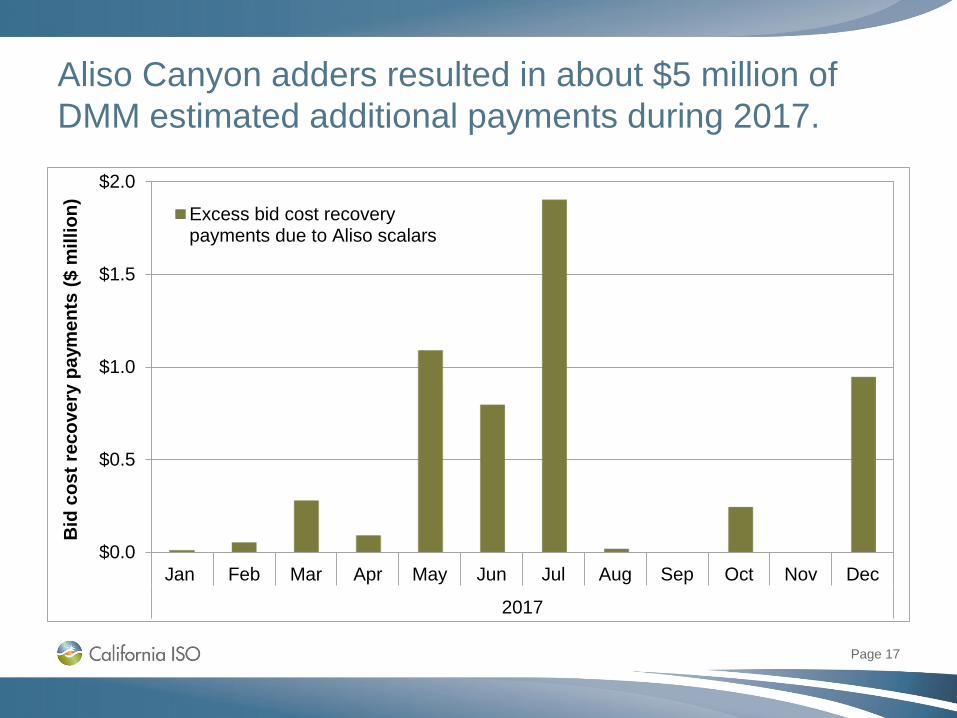
ion) Excess bid cost recovery
payments due to Aliso scalars
Aliso Canyon adders resulted in about $5 million of DMM estimated additional payments during 2017.
Page 18
40% 80% 120% 160% 200% 240% 280% 320% 360% 400%0%
5%
10%
15%
20%
25%
Perc
ent o
f tra
ded
volu
me
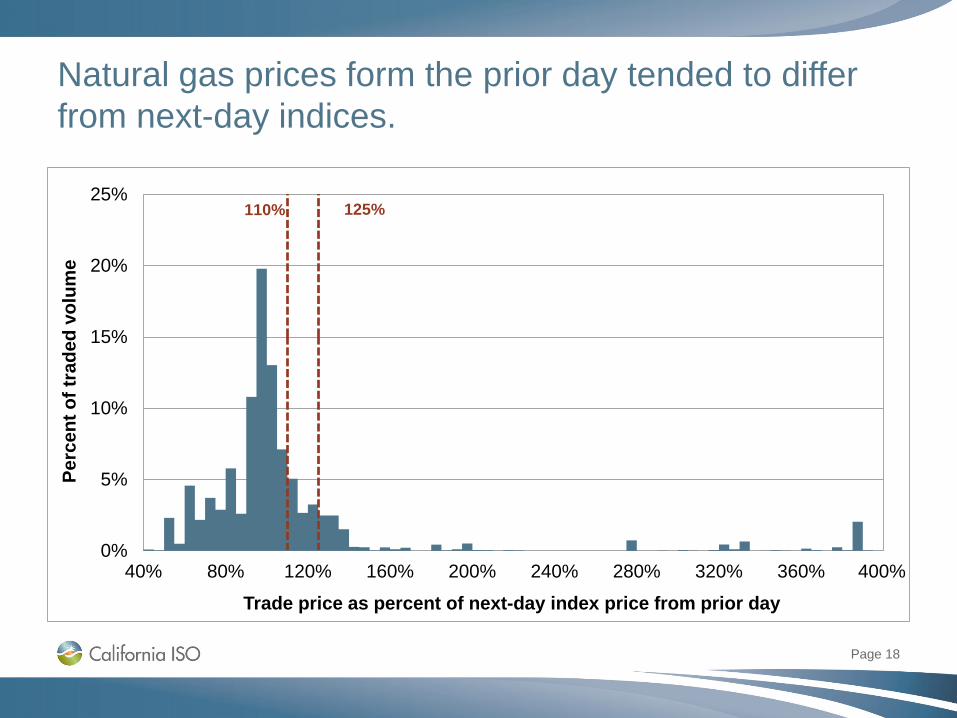
Trade price as percent of next-day index price from prior day
110% 125%
Natural gas prices form the prior day tended to differ from next-day indices.

Page 19
40% 60% 80% 100% 120% 140% 160%0%
10%
20%
30%
40%
50%
Perc
ent o
f tra
ded
volu
me
Trade price as percent of average at 8:30 a.m.
110% 125%
Average natural gas prices at 8:30 tended to reflect next-day indices.

• Metcalf received a designation for reliability must-run.
Page 20
Resource
CPM designation
(MW)
CPM deisgnation
datesPrice
($/kW-mon)Estimated cost
($ million)Local capacity
area Exceptional dispatch CPM triggerMANDALAY GEN STA. UNIT 3 119.4 10/24-11/22 $6.31 $0.73 System Higher loads in real-timeMANDALAY GEN STA. UNIT 2 215 12/05-2/02 $6.31 $2.67 SCE Local availabil ity for wildfireMANDALAY GEN STA. UNIT 1 215 12/05-2/02 $6.31 $2.67 SCE Local availabil ity for wildfireMANDALAY GEN STA. UNIT 3 130 12/05-2/02 $6.31 $1.61 SCE Local availabil ity for wildfire
Resource
CPM designation
(MW)Price
($/kW-mon)Estimated cost
($ million)Local capacity
area Exceptional dispatch CPM triggerMOSS LANDING POWER BLOCK 1 510 $6.19 $38.4 PG&E Material sub-area deficiencyENCINA UNIT 4 272 $6.31 $20.9 SDG&E Material sub-area deficiencyENCINA UNIT 5 273 $6.31 $21.0 SDG&E Material sub-area deficiency
Several procurements were made for capacity in the fourth quarter and for 2018.