dna methylation in glioblastoma: impact on gene - hal - inserm
TRANSCRIPT

HAL Id: inserm-00663706http://www.hal.inserm.fr/inserm-00663706
Submitted on 27 Jan 2012
HAL is a multi-disciplinary open accessarchive for the deposit and dissemination of sci-entific research documents, whether they are pub-lished or not. The documents may come fromteaching and research institutions in France orabroad, or from public or private research centers.
L’archive ouverte pluridisciplinaire HAL, estdestinée au dépôt et à la diffusion de documentsscientifiques de niveau recherche, publiés ou non,émanant des établissements d’enseignement et derecherche français ou étrangers, des laboratoirespublics ou privés.
DNA methylation in glioblastoma: impact on geneexpression and clinical outcome.
Amandine Etcheverry, Marc Aubry, Marie De Tayrac, Elodie Vauleon, RachelBoniface, Frédérique Guenot, Stephan Saikali, Abderrahmane Hamlat,
Laurent Riffaud, Philippe Menei, et al.
To cite this version:Amandine Etcheverry, Marc Aubry, Marie De Tayrac, Elodie Vauleon, Rachel Boniface, et al.. DNAmethylation in glioblastoma: impact on gene expression and clinical outcome.. BMC Genomics,BioMed Central, 2010, 11 (1), pp.701. <10.1186/1471-2164-11-701>. <inserm-00663706>

RESEARCH ARTICLE Open Access
DNA methylation in glioblastoma: impact ongene expression and clinical outcomeAmandine Etcheverry1,2,3, Marc Aubry3, Marie de Tayrac4, Elodie Vauleon1,5, Rachel Boniface1, Frederique Guenot2,3,
Stephan Saikali6, Abderrahmane Hamlat7, Laurent Riffaud7, Philippe Menei8, Veronique Quillien1,5, Jean Mosser1,2,3*
Abstract
Background: Changes in promoter DNA methylation pattern of genes involved in key biological pathways have
been reported in glioblastoma. Genome-wide assessments of DNA methylation levels are now required to decipher
the epigenetic events involved in the aggressive phenotype of glioblastoma, and to guide new treatment
strategies.
Results: We performed a whole-genome integrative analysis of methylation and gene expression profiles in 40
newly diagnosed glioblastoma patients. We also screened for associations between the level of methylation of CpG
sites and overall survival in a cohort of 50 patients uniformly treated by surgery, radiotherapy and chemotherapy
with concomitant and adjuvant temozolomide (STUPP protocol). The methylation analysis identified 616 CpG sites
differentially methylated between glioblastoma and control brain, a quarter of which was differentially expressed in
a concordant way. Thirteen of the genes with concordant CpG sites displayed an inverse correlation between
promoter methylation and expression level in glioblastomas: B3GNT5, FABP7, ZNF217, BST2, OAS1, SLC13A5, GSTM5,
ME1, UBXD3, TSPYL5, FAAH, C7orf13, and C3orf14. Survival analysis identified six CpG sites associated with overall
survival. SOX10 promoter methylation status (two CpG sites) stratified patients similarly to MGMT status, but with a
higher Area Under the Curve (0.78 vs. 0.71, p-value < 5e-04). The methylation status of the FNDC3B, TBX3, DGKI, and
FSD1 promoters identified patients with MGMT-methylated tumors that did not respond to STUPP treatment (p-
value < 1e-04).
Conclusions: This study provides the first genome-wide integrative analysis of DNA methylation and gene
expression profiles obtained from the same GBM cohort. We also present a methylome-based survival analysis for
one of the largest uniformly treated GBM cohort ever studied, for more than 27,000 CpG sites. We have identified
genes whose expression may be tightly regulated by epigenetic mechanisms and markers that may guide
treatment decisions.
BackgroundGlioblastoma (GBM) is the most common and aggres-
sive primary brain tumor in adults. Its prognosis
remains extremely poor, despite multimodal treatment
by surgery, radiotherapy and, chemotherapy [1]. These
tumors are now well characterized at the transcriptome
and genome levels. Several studies have demonstrated
that a combination of these two molecular levels may be
advantageous for determining robust signatures and
clinically relevant molecular classifiers of GBM [2,3].
The role of general epigenetic mechanisms in carcino-
genesis and tumor aggressiveness is well documented:
CpG island hypermethylation silences tumor suppressor
genes, whereas hypomethylation promotes the transcrip-
tional activation of oncogenes and induces chromosomal
instability [4,5]. Such epigenetic changes are potentially
reversible and may therefore be considered promising
targets for epigenetic anticancer treatments. Indeed, the
use of DNA-demethylating drugs (5 azacytidine and
5-aza-2’-deoxicytidine) has been approved by the Food
and Drug Administration (FDA) as a treatment for mye-
lodysplastic syndromes and myelogenous leukemia [6,7].
Changes in promoter DNA methylation pattern of
genes involved in key biological pathways have been
* Correspondence: [email protected] UMR6061 Institut de Génétique et Développement, Université de
Rennes 1, UEB, IFR140, Rennes, France
Full list of author information is available at the end of the article
Etcheverry et al. BMC Genomics 2010, 11:701
http://www.biomedcentral.com/1471-2164/11/701
© 2010 Etcheverry et al; licensee BioMed Central Ltd. This is an Open Access article distributed under the terms of the CreativeCommons Attribution License (http://creativecommons.org/licenses/by/2.0), which permits unrestricted use, distribution, andreproduction in any medium, provided the original work is properly cited.
reported in GBM. For instance, the retinoblastoma (RB),
PI3K, and p53 pathways are affected by CpG island pro-
moter hyper-methylation (RB, CDKN2A, PTEN, TP53)
[8-12]. Epigenetic silencing of the O6-methylguanine DNA
methyltransferase (MGMT) gene, which encodes a DNA
repair enzyme, sensitizes cancer cells to alkylating agents,
and is associated with significantly longer survival in GBM
patients treated by radiotherapy and concomitant and
adjuvant temozolomide [13]. According to the European
Organization for Research and Treatment of Cancer
(EORTC) and the National Cancer Institute of Canada
(NCIC) trial 26981-22981/CE.3, the methylation status of
the MGMT promoter is the strongest predictor of out-
come and benefit from temozolomide treatment [14].
An instructive mechanism for de novo methylation has
also been described in cancers [15]. This mechanism
involves polycomb group proteins known to repress
genes epigenetically at the embryonic stem cell (ESC)
stage. Indeed, recent studies have shown that the poly-
comb repressor complex 2 (PRC2) may mark genes
repressed during the ESC stage and induce their tar-
geted silencing in cancer [16].
Genome-wide assessments of DNA methylation are
now necessary, to decipher the epigenetic events
involved in the aggressive phenotype of GBM and to
guide new treatment strategies. Several microarray-
based GBM studies have identified gene promoters that
are frequently hyper- and hypomethylated. These gene
promoters were initially identified indirectly, by the
pharmacologic or RNAi-induced inhibition of DNA
methyltransferase in GBM cell lines [17,18], or by the
use of methyl-CpG-binding proteins [19]. More recently,
direct hybridization of bisulfite-modified DNA on bead-
chips has made it possible to reliably quantify promoter
methylation [20,21] in cohorts of patients. Noushmehr
et al. used this technique to profile DNA methylation
alterations in 272 GBMs in the context of The Cancer
Genome Atlas (TCGA). They reported a rare subgroup
of GBMs displaying a concerted multilocus hypermethy-
lation pattern and suggested the existence of a Glioma
CpG Island Methylator Phenotype (G-CIMP). G-CIMP
tumors tended to be secondary and recurrent GBMs,
and were tightly associated with IDH1 somatic mutation.
We report here the first genome-wide integrative ana-
lysis of DNA methylation and gene expression profiles
obtained from the same GBM cohort. We also present a
methylome-based survival analysis for one of the largest
uniformly treated (radiotherapy and chemotherapy with
concomitant and adjuvant temozolomide) GBM cohort
ever studied, for more than 27,000 CpG sites. We iden-
tified frequent tumor-specific methylation changes in
GBM. Some of these alterations directly affected gene
expression, whereas others were significantly associated
with the clinical outcome of patients.
MethodsTissue samples
The prospective cohort included 55 patients with newly
diagnosed GBM (World Health Organization (WHO)
grade IV), admitted to the Neurosurgery Departments of
Rennes and Angers University Hospitals. Tumor sam-
ples were collected, following informed consent, in
accordance with the French regulations and the Helsinki
Declaration. Initial histologic findings were confirmed,
according to the WHO classification [22], by a central
review panel including at least two neuropathologists.
The male/female ratio was 1:0.96. Median age at diagno-
sis was 57.5 ± 12 years (range: 26 - 80 years) and med-
ian preoperative Karnofsky Performance Status (KPS)
was 78.6 (range: 40 - 100). Fifty patients underwent
radiotherapy and chemotherapy with concomitant and
adjuvant temozolomide (STUPP protocol). Four patients
received only fractionated radiotherapy (60 Gy). One
patient died after surgery. Median overall survival (OS)
was 18.7 ± 17.3 months (range: 0.2 - 98.6 months). Five
non-neoplastic brain tissues obtained from patients
undergoing surgery for chronic epilepsy were included
in the study as control samples. Each snap-frozen tumor
block was cut into 10 μm sections. For accurate paired
comparisons between biological materials, adjacent sec-
tions were used for DNA and RNA extraction. We
investigated the expression profiles of 40 GBMs for
which methylation data were also available.
DNA and RNA isolation
DNA was extracted with the NucleoSpin Tissue Kit
(Macherey Nagel) according to the manufacturer’s
instructions. The quality of DNA samples was assessed
by electrophoresis in a 1% agarose gel. Total RNA was
isolated with the NucleoSpin RNAII Kit (Macherey-
Nagel). RNA integrity (RNA Integrity Number ≥ 8) was
confirmed with an Agilent 2100 Bioanalyzer (Agilent
Technologies).
DNA methylation profiling
DNA methylation profiling was performed with the Infi-
nium HumanMethylation27 beadchip (Illumina Inc.),
which interrogates 27,578 highly informative CpG sites
located within the proximal promoter regions of 14,475
genes (1,126 cancer-related genes). Nearly 73% of these
CpGs were localized within CpG islands. DNA from
GBMs and control brains were bisulfite-modified, using
the EZ DNA methylation kit (Zymo Research) and
hybridized according to the manufacturer’s instructions.
The profiling was performed on 55 GBMs and 3 non-
neoplastic brains. We performed two intra- and inter-
array replicates, the first one on a GBM sample and the
other one on a non-neoplastic brain sample. The
observed correlations between replicate samples (r >
Etcheverry et al. BMC Genomics 2010, 11:701
http://www.biomedcentral.com/1471-2164/11/701
Page 2 of 11
0.99) demonstrate the high reproducibility of the techni-
que. For each interrogated CpG site, methylation status
is calculated by dividing the signal from the methylated
probe (M) by the sum of signals for both methylated
and unmethylated (U) probes (GenomeStudio 2008.1,
Illumina Inc.): b = Max(M,0)/[Max(M,0) + Max(U,0) +
100]. This b-value provides a continuous and quantita-
tive measurement of DNA methylation, ranging from 0
(completely unmethylated) to 1 (completely methylated).
Missing values were imputed by nearest neighbor aver-
aging (impute R package). DNA methylation values fol-
lowed a non symmetric bimodal distribution (Additional
file 1) and CpG sites were globally hypomethylated in
both GBM and control brain samples (median b-value =
0.1). DNA methylation data have been submitted to
Gene Expression Omnibus (GEO) repository under
accession number “GSE22867”.
Determination of methylation thresholds on the basis of
expression values
CpG probes were binned according to their b-values
(windows 0.05 wide). For each bin, the maximum
expression values of the genes corresponding to the
CpG probes were averaged for all patients (n = 40).
Differentially methylated (DM) CpG sites
Prior selection of the CpG sites displaying the highest
DNA methylation variation was carried out, based on
the standard deviation (SD ≥ 0.1). b-values were com-
pared between GBMs and control brain tissues with
Student t-tests with a Welch approximation. Adjusted
p-values were calculated by controlling for the false dis-
covery rate (FDR) with the Benjamini & Hochberg (BH)
procedure (multtest, R package). CpG sites were consid-
ered significantly differentially methylated if the adjusted
p-value was below 0.01 and the difference in b-values
(∆b GBM vs. control brain) was greater than 0.2.
Pyrosequencing analysis
MGMT promoter pyrosequencing was performed with
the PyroMark Q96 CpG MGMT kit (Qiagen), according
to the manufacturer’s protocol. The values obtained
were averaged over the five CpG loci tested.
Gene expression profiling
This study was performed on 40 GBM samples with 3
non-neoplastic brains as controls. Gene expression pro-
filing was carried out with the Agilent Whole Human
Genome 4 × 44 K Microarray Kit (Agilent Technolo-
gies). Total RNA was extracted, labeled and hybridized
according to the kit manufacturer’s recommendations.
Data were log2-transformed and normalized (quantile
normalization and baseline transformation) with Gene-
Spring GX software (Agilent Technologies). Gene
expression data have been submitted to Gene Expres-
sion Omnibus (GEO) repository under accession num-
ber “GSE22866”.
Differentially expressed (DE) genes
We used a non-parametric rank product method to
account for hybridization bias and to identify genes up-
or downregulated in GBM vs. control brains (RankProd
R package). Genes were considered significantly differ-
entially expressed if the FDR was below 0.05 and the
absolute fold-change (GBM vs. control brain) was
greater than 2. A list of DE genes with absolute fold-
change greater than 4 is provided in Additional file 2.
Correlation analysis
This analysis was performed on 40 GBM samples with
methylation and expression data available. Methylation
and expression probes were paired on the basis of
Entrez Gene ID concordance. We assessed the associa-
tion between CpG site methylation and the level of
expression of the corresponding genes, by calculating
Pearson’s correlation coefficient (r). The level of gene
expression was considered to be inversely correlated
with CpG site methylation level if the r value obtained
was less than -0.5 and the p-value was less than 0.001.
Survival analysis
Survival analyses were carried out on 50 patients who
had undergone surgery, radiotherapy, and chemotherapy
with concomitant and adjuvant temozolomide. We per-
formed univariate Cox regression analyses on the CpG
sites displaying the greatest variation of DNA methyla-
tion (SD > 0.15). b-values were used as the predictor
and OS time (in months) was used as the response.
CpG sites with a p-value lower than 0.05 were selected
for further analysis. For each CpG site, the b-value
threshold giving the best stratification p-value according
to the log-rank test was selected for the identification of
patients displaying hypomethylation (b-value ≤ thresh-
old) and hypermethylation (b-value > threshold). Only
CpG sites with a p-value below 0.001 were investigated
further. Survival probabilities at 18 months, correspond-
ing to the median OS in our cohort, were determined
with a classical Cox model. Time-dependent ROC curve
analyses were used to determine the area under the
curve (AUC) for each CpG. All tests were stratified for
the age of patients (above or below the age of 50 years).
Analyses were carried out with the survival and survi-
valROC packages of R software.
IDH1 mutation
The genomic region spanning wild-type R132 of IDH1
was analyzed by direct sequencing as previously
described [23].
Etcheverry et al. BMC Genomics 2010, 11:701
http://www.biomedcentral.com/1471-2164/11/701
Page 3 of 11

ResultsSelection of CpG probes with direct effect on gene
expression
Expression levels remained almost constant for a broad
range of b-values but the distributions were different for
extremely low and high methylation values (Figure 1).
We therefore identified CpG sites with a putative effect
on gene expression levels as those with b-values below
0.15 or above 0.9 in at least three samples. This selec-
tion method led to the identification of 19,837 CpG
sites (located within the promoter of 11,855 genes) and
was used for DNA methylation profiling and correlation
analysis.
DNA methylation profiling of GBMs
We found that 616 of the 4,344 selected CpG sites (SD
≥ 0.10) were DM between GBM and control brain sam-
ples: 440 CpG sites (358 genes) were hypermethylated
and 176 (170) were hypomethylated in GBM (Additional
file 3). Some of the identified changes in gene methyla-
tion have been reported before: the hypermethylation of
CDKN2A (p14ARF and p16ΙNK4a) has been implicated
in carcinogenesis and tumor progression [10], whereas
the hypomethylation of S100A2 [24] has been identified
as a strong inducer of metastasis in vivo in non small
cell lung cancer [25]. As expected, unsupervised hier-
archical clustering of the DM CpG sites clustered the
samples into two distinct groups: the GBM samples and
the control brain samples (Figure 2). CpG sites methyla-
tion patterns differed considerably between GBM
patients. This heterogeneity was even more marked if
we considered the hypermethylated CpG subset. This
analysis also showed that some GBM samples were
more strongly altered than others and we observed
three main GBM clusters displaying different degrees of
DNA methylation alteration.
Functional annotation of the DM genes (NIH-DAVID
software) identified several enriched Gene Ontology
(GO) biological processes (Fisher Exact test). Hyper-
methylated genes were significantly associated with ner-
vous system development (p-value = 7e-15), embryonic
development (p-value = 3e-13), brain development
Figure 1 Mean of the maximal gene expression values by b-value bins (5% wide), in GBMs (n = 40). The expression values presented are
normalized and log-transformed intensities. Errors bars are also shown. Gray rectangles define the b-value ranges for which a change in maximal
expression values is observed.
Etcheverry et al. BMC Genomics 2010, 11:701
http://www.biomedcentral.com/1471-2164/11/701
Page 4 of 11

(p-value = 6e-16), and cell migration (p-value = 4e-4).
Hypomethylated genes were significantly associated with
immune response (p-value = 1e-10) and response to
stress (p-value = 8e-16).
Interestingly, 97% of the hypermethylated CpG sites
were located within a CpG island, whereas 91% of the
abnormally demethylated CpG sites were not located
within a CpG island. We compared the frequencies of
PRC2 marks in the hypermethylated gene set and in the
full array, as previously described by Martinez et al.
[20]. The hypermethylated gene set was significantly
enriched in PRC2 targets (35% vs. 9.5%, Fisher’s exact
test p-value = 2e-16; Figure 2). This suggests that a
large proportion of the hypermethylated genes in GBM
may have undergone de novo DNA methylation
mediated by the PRC2 complex. We tested this hypoth-
esis by carrying out unsupervised hierarchical clustering
restricted to the hypermethylated CpGs located within
PRC2-targeted promoters (Figure 3A). We observed
considerable heterogeneity between GBMs and we
focused on two groups of seven patients clustered on
the basis of the difference between their mean b-value
and the one of control brain (∆b). These groups are
named the “low-∆b” (mean ∆b = 0.15) and “high-∆b”
(mean ∆b = 0.49) groups. We compared the expression
levels of genes belonging to the PRC2 complex (EZH2,
SUZ12, EED) and DNMT genes (DNMT1, DNMT3A
and DNMT3B) in control brains, all GBM samples, the
low-∆b cluster and the high-∆b cluster. Two genes
(EZH2 and DNMT3A) were significantly over-expressed
in GBMs relative to control brains (FDR = 0, fold-
change = 19 and FDR = 0.003, fold-change = 4, respec-
tively). These two genes were more strongly expressed
in the high-∆b cluster, but no statistically significant dif-
ference was found between the levels of expression in
the low- and high-∆b clusters (Figure 3B).
Correlation analysis
In total, 421 CpG sites (321 genes) displayed a signifi-
cant inverse correlation (r < -0.5) between methylation
Figure 2 Hierarchical clustering of the 616DM CpG sites in GBMs vs. control brain (N). For each CpG site, a horizontal black bar on the right
indicates membership of the hypermethylated subset, a CpG island (CGI), or the location within the promoter of a PRC2 target.
Etcheverry et al. BMC Genomics 2010, 11:701
http://www.biomedcentral.com/1471-2164/11/701
Page 5 of 11

level and the level of expression of the corresponding
gene in GBM samples (Additional file 4). Almost 91% of
these sites were located within CpG islands. The genes
displaying the strongest inverse correlation included
four genes related to cancer processes: SERPINB1 (Fig-
ure 4), which promotes cancer cell motility in invasive
oral squamous cell carcinoma [26], EMP3, which dis-
plays regulation through promoter methylation in glio-
mas [27], FABP5, which mediates EGFR-induced
carcinoma cell growth [28], and CBR1, which is involved
in tumor progression [29,30]. Thirteen genes were DE in
GBM vs. control brain, consistent with their promoter
methylation status (5 overexpressed genes with a hypo-
methylated promoter: B3GNT5, FABP7, ZNF217, BST2
and OAS1; 8 underexpressed genes with a hypermethy-
lated promoter: SLC13A5, GSTM5, ME1, UBXD3,
TSPYL5, FAAH, C7orf13, and C3orf14).
Survival analysis
Univariate Cox analyses identified 474 CpG sites (419
genes) significantly associated with OS (Additional file
5). These sites had a high predictive power (absolute
univariate z score greater than 2) and 26 were inversely
correlated. As expected, the methylation status of the
five CpG sites located within the MGMT promoter was
correlated with survival. Sixty CpG sites stratified the
patients into two groups (each containing at least five
patients) with significantly different OS (Additional file 6).
One of these sites is located within the MGMT promoter
(Table 1 and Figure 5A) and its Illumina probe overlaps
the sequence tested by the PyroMark Q96 CpG MGMT
kit used to validate our data (Additional file 7). For this
CpG site, a strong correlation was obtained between the
results of the two techniques (r = 0.7). Interestingly, 10
CpG sites (9 genes) had a larger AUC than the MGMT
CpG (Kruskal-Wallis test p-value < 5e-4) (Table 1). For
these 10 CpGs no evidence of violation of the proportional
hazards assumption was found. The hypermethylation of
two of these CpG sites, within the SOX10 promoter, was
associated with shorter survival (Figure 5B). CpG site #2
methylation level was inversely correlated with the level of
SOX10 expression (r = -0.75) in GBM samples, and
SOX10 was significantly underexpressed in GBM (FDR =
0.009, fold-change = 4). This inverse correlation and
underexpression in GBM, is entirely consistent with the
shorter survival observed for patients displaying SOX10
hypermethylation. Four CpG sites remained significantly
associated with OS (p-value < 0.01) in a Cox multivariate
model including MGMT promoter methylation status and
were therefore identified as potential independent
prognostic markers. These sites are located within the
Figure 3 Analysis of the hypermethylated CpGs located within PRC2-targeted promoters. (A) Heatmap of the hypermethylated CpGs
located within PRC2-targeted promoters. Samples are ranked horizontally as a function of their mean b-values. Two clusters representing
extreme methylation changes (∆b) relative to control samples (N) are framed. (B) EZH2 and DNMT3A expression level in control samples, GBM
samples, the low- and the high-∆b clusters. The expression values presented are normalized and log-transformed intensities.
Etcheverry et al. BMC Genomics 2010, 11:701
http://www.biomedcentral.com/1471-2164/11/701
Page 6 of 11
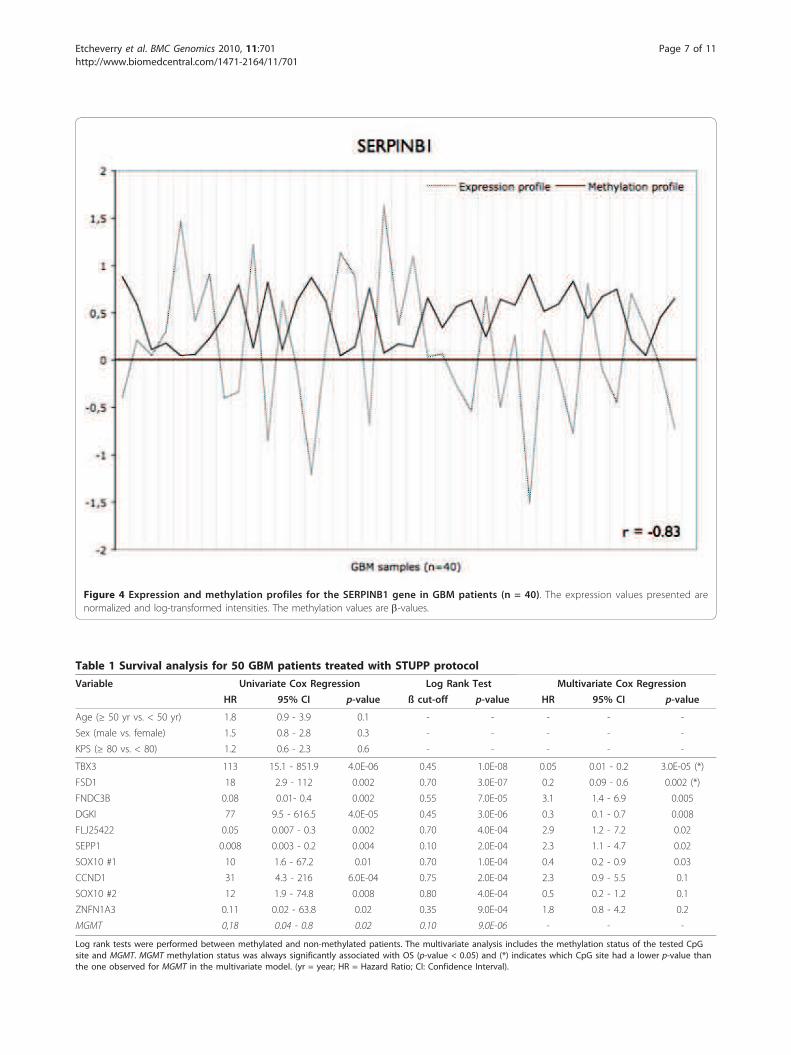
Figure 4 Expression and methylation profiles for the SERPINB1 gene in GBM patients (n = 40). The expression values presented are
normalized and log-transformed intensities. The methylation values are b-values.
Table 1 Survival analysis for 50 GBM patients treated with STUPP protocol
Variable Univariate Cox Regression Log Rank Test Multivariate Cox Regression
HR 95% CI p-value ß cut-off p-value HR 95% CI p-value
Age (≥ 50 yr vs. < 50 yr) 1.8 0.9 - 3.9 0.1 - - - - -
Sex (male vs. female) 1.5 0.8 - 2.8 0.3 - - - - -
KPS (≥ 80 vs. < 80) 1.2 0.6 - 2.3 0.6 - - - - -
TBX3 113 15.1 - 851.9 4.0E-06 0.45 1.0E-08 0.05 0.01 - 0.2 3.0E-05 (*)
FSD1 18 2.9 - 112 0.002 0.70 3.0E-07 0.2 0.09 - 0.6 0.002 (*)
FNDC3B 0.08 0.01- 0.4 0.002 0.55 7.0E-05 3.1 1.4 - 6.9 0.005
DGKI 77 9.5 - 616.5 4.0E-05 0.45 3.0E-06 0.3 0.1 - 0.7 0.008
FLJ25422 0.05 0.007 - 0.3 0.002 0.70 4.0E-04 2.9 1.2 - 7.2 0.02
SEPP1 0.008 0.003 - 0.2 0.004 0.10 2.0E-04 2.3 1.1 - 4.7 0.02
SOX10 #1 10 1.6 - 67.2 0.01 0.70 1.0E-04 0.4 0.2 - 0.9 0.03
CCND1 31 4.3 - 216 6.0E-04 0.75 2.0E-04 2.3 0.9 - 5.5 0.1
SOX10 #2 12 1.9 - 74.8 0.008 0.80 4.0E-04 0.5 0.2 - 1.2 0.1
ZNFN1A3 0.11 0.02 - 63.8 0.02 0.35 9.0E-04 1.8 0.8 - 4.2 0.2
MGMT 0,18 0.04 - 0.8 0.02 0.10 9.0E-06 - - -
Log rank tests were performed between methylated and non-methylated patients. The multivariate analysis includes the methylation status of the tested CpG
site and MGMT. MGMT methylation status was always significantly associated with OS (p-value < 0.05) and (*) indicates which CpG site had a lower p-value than
the one observed for MGMT in the multivariate model. (yr = year; HR = Hazard Ratio; CI: Confidence Interval).
Etcheverry et al. BMC Genomics 2010, 11:701
http://www.biomedcentral.com/1471-2164/11/701
Page 7 of 11

promoters of the FNDC3B, TBX3, FSD1, and DGKI genes
(Figure 5C and 5D and Additional file 8).
DiscussionIn this study, we used array technology for quantitative
expression and methylation profiling in a well character-
ized cohort of newly diagnosed GBM patients. We
describe (i) the relationship between DNA methylation
pattern and gene expression in GBM and (ii) the asso-
ciation between DNA methylation and clinical outcome
in a subgroup of patients given uniform treatment in
accordance with the STUPP protocol.
The methylation analysis identified 616 CpG sites DM
between GBM and control brain and revealed consider-
able heterogeneity between GBMs, particularly for
hypermethylated CpG sites. Hypo- and hypermethylated
CpG sites were preferentially located outside and within
CpG islands, respectively. This clearly confirms that
cancer cells are characterized by both a loss of methyla-
tion in CpG-depleted regions and gains of methylation
Figure 5 Kaplan-Meier estimation of overall survival in 50 GBMs treated in accordance with the STUPP protocol. Patients were assigned
to groups according to the methylation status of (A) MGMT, (B) SOX10 site #2, (C) MGMT and FNDC3B, and (D) MGMT and TBX3. M: methylated;
NM: non methylated. P-values for the difference in OS (log-rank test), size and median survival of each group are also reported. See Table 1 for
b-values cut-offs.
Etcheverry et al. BMC Genomics 2010, 11:701
http://www.biomedcentral.com/1471-2164/11/701
Page 8 of 11
at CpG islands [4]. Consistent with the findings of
Martinez et al. [20], the hypermethylated gene set was
found to be significantly enriched in PRC2 targets, high-
lighting the putative role of polycomb group proteins in
de novo methylation in GBM. However, our data were
not entirely consistent with this hypothesis. Indeed,
there is no strong methylation pattern among the PRC2
targeted promoters and the changes in expression of the
PRC2 and DNMT genes do not follow the hypermethy-
lation gradient observed between low- and high-∆b
GBM clusters. This suggests that other genes may be
linked to polycomb-associated de novo methylation.
The integrated analysis of DNA methylation and gene
expression showed that DNA methylation only partly
regulated gene expression. Indeed, almost a quarter of
the DM genes also displayed concordant differential
expression (chi-square test p-value < 0.01) (Additional
file 9) and, in GBM samples, only 3% of the genes dis-
played an inverse correlation between promoter methy-
lation and expression levels. This finding is consistent
with published data for GBM [21]. Moreover, many
other well known mechanisms are involved in the regu-
lation of gene expression (e.g. copy number alterations
[2,3], transcription factor production and recruitment,
histone modifications, micro-RNA expression [31]).
Nevertheless, our analysis led to the identification of 13
genes displaying concordant differential methylation and
differential expression in GBM and control brain, and
whose methylation and expression patterns were anti-
correlated. The expression patterns of these genes may
therefore be tightly regulated by epigenetic mechanisms,
and their in-depth analysis may help us to understand
the contribution of DNA methylation to glioblastoma-
genesis. Most of these genes have already been impli-
cated in cancer-related processes. For example, ZNF217
(encoding zinc finger protein 217) is an important onco-
gene in many cancer types and its overexpression has
been implicated in cell immortalization and resistance
to chemotherapy [32]. A recent study demonstrated that
the ZNF217 protein forms nuclear complexes with sev-
eral histone-modifying proteins (including EZH2) with
synergistic effects in transcriptional repression [33].
Another example is provided by FABP7 (brain fatty acid
binding protein 7), which is expressed by the radial glia
and involved in glia-guided neuronal migration [34].
This protein has been associated with pure GBM histol-
ogy, invasion and poor prognosis [35]. Yet another
example is provided by TSPYL5 (encoding testis-specific
Y-like protein), which is a potent tumor suppressor
gene and a frequent target of epigenetic silencing in
glial tumors and gastric cancers [17,36]. This gene has
been shown to play a role in cell growth and resistance
to radiation, through regulation of the p21(WAF1/Cip1)
and PTEN/AKT pathway [37].
Noushmehr et al. [21] described a rare subgroup of
GBMs with a CpG Island Methylator Phenotype. These
G-CIMP tumors are a subclass of the GBM proneural
subtype defined by Phillips et al. and Verhaak et al.
[38,39]. They were shown to be associated with second-
ary and recurrent GBMs, IDH1 somatic mutation,
younger age at diagnosis and longer survival. Based on
the G-CIMP 8-gene signature they describe (ANKRD43,
HFE, MAL, LGALS3, FAS-1, FAS-2, RHO-F, and
DOCK5), we identified three G-CIMP-positive tumors in
the 55 patients of our cohort. This proportion (5.5%) is
similar to that reported in the context of the TCGA
(7.6%). We also confirm the association of G-CIMP sta-
tus with IDH1 somatic mutation (Fisher’s exact test
p-value = 2e-4) and younger age at diagnosis (Wilcoxon
rank sum test p-value = 0.01). However, we were unable
to test the association between G-CIMP-positive status
and OS, due the low frequency of this phenotype (three
patients, two with survival data available).
Survival analysis was performed on a cohort of
50 patients uniformly treated by radiotherapy combined
with concomitant and adjuvant temozolomide (STUPP
protocol) [40]. To our knowledge, this is the largest uni-
formly treated GBM cohort ever to be studied over such
a large number of CpG loci. As expected, MGMT pro-
moter methylation was strongly associated with longer
survival, in both the microarray and pyrosequencing
approaches. The chosen cutoff point for the b-value
(10%) is similar to frequently used values (9%) [41]. For
the 27,578 CpG sites tested, MGMT methylation status
remained one of the most powerful predictors of
response to temozolomide-based treatment in GBM.
Nevertheless, we have also identified two different types
of prognostic markers. The first type stratifies the
patients similarly to MGMT, but with a higher AUC.
There is an association between the methylation level of
MGMT and SOX10 promoters (chi-square test p-value
< 0.01). The SOX10 gene is one such marker, and the
hypermethylation of its promoter was associated with
shorter survival in our cohort. Interestingly, the SOX10
protein is a marker of oligodendrocytes [42], and the
presence of oligodendroglial differentiation areas in
GBM has also been associated with longer survival [43].
The second type of prognostic marker (FNDC3B, TBX3,
DGKI, and FSD1) identifies patients with MGMT-
methylated tumors not responding to STUPP treatment
(Additional file 10). This second group of markers need
to be validated on a larger cohort.
ConclusionWe performed a comprehensive analysis of DNA methy-
lation and gene expression profiles obtained from the
same GBM cohort, using array technologies. We identi-
fied frequent tumor-specific methylation changes in
Etcheverry et al. BMC Genomics 2010, 11:701
http://www.biomedcentral.com/1471-2164/11/701
Page 9 of 11

GBM. Some of these alterations directly affected gene
expression, whereas others were significantly associated
with the clinical outcome of patients and could be use-
ful for predict the response to standard treatment.
Additional material
Additional file 1: Distribution of the b-values for GBM samples (n =
55) and control brain samples (n = 3).
Additional file 2: Genes differentially expressed between GBM and
control brain.
Additional file 3: CpG sites differentially methylated between GBM
and control brain.
Additional file 4: CpG sites displaying an inverse correlation
between promoter methylation and expression levels.
Additional file 5: CpG sites significantly associated with overall
survival - univariate Cox regression analysis.
Additional file 6: CpG sites significantly associated with overall
survival - Log rank analysis.
Additional file 7: MGMT promoter sequence. Overlap between the
sequence tested by the PyroMark Q96 CpG MGMT kit and the Illumina
probe used to stratify patients (log rank test p-value = 9e-06). Numbers
indicate positions on the reference genome.
Additional file 8: Kaplan-Meier estimation of overall survival in 50
GBMs treated in accordance with the STUPP protocol. Patients were
assigned to groups according to the methylation status of (A) SOX10 site
#1, (B) MGMT and FSD1, and (C) MGMT and DGKI. M: methylated; NM:
non methylated. P-values for the difference in OS (log-rank test), size and
median survival of each group are also reported. See Table 1 for b-values
cut-offs.
Additional file 9: Contingency Table showing differentially
expressed and differentially methylated enes.
Additional file 10: Kaplan Meier estimation of overall survival in 30
GBMs with methylated MGMT promoter. Patient were separated into
two groups according to the methylation status of (A) FNDC3B, (B) TBX3,
(C) DGKI, and (D) FSD1. See Table 1 for b-values cut-offs.
Acknowledgements
This work was supported by grants from the Ligue contre le Cancer
foundation (LNCC), the Cancéropôle Grand-Ouest Glioma Project, and the
European Union (FEDER) (MA, equipment). Samples were stored using the
CRB (Centre de Ressources Biologiques) facilities in Rennes.
Author details1CNRS UMR6061 Institut de Génétique et Développement, Université de
Rennes 1, UEB, IFR140, Rennes, France. 2Service de Génétique Moléculaire et
Génomique, CHU Rennes, France. 3Plateforme Génomique Santé
Biogenouest®, Rennes, France. 4INSERM U946, Fondation Jean Dausset, CEPH,
Paris, France. 5Département de Biologie Médicale, Centre Eugène Marquis,
Rennes, France. 6Service d’Anatomie et Cytologie Pathologique, CHU Rennes,
France. 7Service de Neurochirurgie, CHU Rennes, France. 8Service de
Neurochirurgie, CHU Angers, France.
Authors’ contributions
AE and MDT elaborated the experimental design. AE, RB, and FG performed
the microarray experiments and AE analyzed data. MDT and MA helped to
the statistical analysis. AE wrote the paper. MA and JM helped to draft the
manuscript. AE, EV, SS, AH, LR, PM, VQ, and JM discussed the results and
commented on the manuscript. JM supervised the study. All authors read
and approved the final manuscript.
Received: 19 August 2010 Accepted: 14 December 2010
Published: 14 December 2010
References
1. Wen PY, Kesari S: Malignant gliomas in adults. N Engl J Med 2008,
359:492-507.
2. de Tayrac M, Etcheverry A, Aubry M, Saikali S, Hamlat A, Quillien V, Le
Treut A, Galibert MD, Mosser J: Integrative genome-wide analysis reveals
a robust genomic glioblastoma signature associated with copy number
driving changes in gene expression. Genes Chromosomes Cancer 2009,
48:55-68.
3. Nigro JM, Misra A, Zhang L, Smirnov I, Colman H, Griffin C, Ozburn N,
Chen M, Pan E, Koul D, et al: Integrated array-comparative genomic
hybridization and expression array profiles identify clinically relevant
molecular subtypes of glioblastoma. Cancer Res 2005, 65:1678-1686.
4. Herman JG, Baylin SB: Gene silencing in cancer in association with
promoter hypermethylation. N Engl J Med 2003, 349:2042-2054.
5. Karpf AR, Matsui S: Genetic disruption of cytosine DNA methyltransferase
enzymes induces chromosomal instability in human cancer cells. Cancer
Res 2005, 65:8635-8639.
6. Garcia-Manero G: Demethylating agents in myeloid malignancies. Curr
Opin Oncol 2008, 20:705-710.
7. Mack GS: Epigenetic cancer therapy makes headway. J Natl Cancer Inst
2006, 98:1443-1444.
8. Watanabe T, Yokoo H, Yokoo M, Yonekawa Y, Kleihues P, Ohgaki H:
Concurrent inactivation of RB1 and TP53 pathways in anaplastic
oligodendrogliomas. J Neuropathol Exp Neurol 2001, 60:1181-1189.
9. Nakamura M, Yonekawa Y, Kleihues P, Ohgaki H: Promoter
hypermethylation of the RB1 gene in glioblastomas. Lab Invest 2001,
81:77-82.
10. Costello JF, Berger MS, Huang HS, Cavenee WK: Silencing of p16/CDKN2
expression in human gliomas by methylation and chromatin
condensation. Cancer Res 1996, 56:2405-2410.
11. Bello MJ, Rey JA: The p53/Mdm2/p14ARF cell cycle control pathway
genes may be inactivated by genetic and epigenetic mechanisms in
gliomas. Cancer Genet Cytogenet 2006, 164:172-173.
12. Amatya VJ, Naumann U, Weller M, Ohgaki H: TP53 promoter methylation
in human gliomas. Acta Neuropathol 2005, 110:178-184.
13. Stupp R, Hegi ME, Mason WP, van den Bent MJ, Taphoorn MJ, Janzer RC,
Ludwin SK, Allgeier A, Fisher B, Belanger K, et al: Effects of radiotherapy
with concomitant and adjuvant temozolomide versus radiotherapy
alone on survival in glioblastoma in a randomised phase III study: 5-year
analysis of the EORTC-NCIC trial. Lancet Oncol 2009, 10:459-466.
14. Gorlia T, van den Bent MJ, Hegi ME, Mirimanoff RO, Weller M, Cairncross JG,
Eisenhauer E, Belanger K, Brandes AA, Allgeier A, et al: Nomograms for
predicting survival of patients with newly diagnosed glioblastoma:
prognostic factor analysis of EORTC and NCIC trial 26981-22981/CE.3.
Lancet Oncol 2008, 9:29-38.
15. Keshet I, Schlesinger Y, Farkash S, Rand E, Hecht M, Segal E, Pikarski E,
Young RA, Niveleau A, Cedar H, Simon I: Evidence for an instructive
mechanism of de novo methylation in cancer cells. Nat Genet 2006,
38:149-153.
16. Lee TI, Jenner RG, Boyer LA, Guenther MG, Levine SS, Kumar RM,
Chevalier B, Johnstone SE, Cole MF, Isono K, et al: Control of
developmental regulators by Polycomb in human embryonic stem cells.
Cell 2006, 125:301-313.
17. Kim TY, Zhong S, Fields CR, Kim JH, Robertson KD: Epigenomic profiling
reveals novel and frequent targets of aberrant DNA methylation-
mediated silencing in malignant glioma. Cancer Res 2006, 66:7490-7501.
18. Foltz G, Yoon JG, Lee H, Ryken TC, Sibenaller Z, Ehrich M, Hood L, Madan A:
DNA methyltransferase-mediated transcriptional silencing in malignant
glioma: a combined whole-genome microarray and promoter array
analysis. Oncogene 2009, 28:2667-2677.
19. Wu X, Rauch TA, Zhong X, Bennett WP, Latif F, Krex D, Pfeifer GP: CpG
island hypermethylation in human astrocytomas. Cancer Res 2010,
70:2718-2727.
20. Martinez R, Martin-Subero JI, Rohde V, Kirsch M, Alaminos M, Fernandez AF,
Ropero S, Schackert G, Esteller M: A microarray-based DNA methylation
study of glioblastoma multiforme. Epigenetics 2009, 4:255-264.
21. Noushmehr H, Weisenberger DJ, Diefes K, Phillips HS, Pujara K, Berman BP,
Pan F, Pelloski CE, Sulman EP, Bhat KP, et al: Identification of a CpG island
methylator phenotype that defines a distinct subgroup of glioma.
Cancer Cell 2010, 17:510-522.
Etcheverry et al. BMC Genomics 2010, 11:701
http://www.biomedcentral.com/1471-2164/11/701
Page 10 of 11

22. Louis DN, Ohgaki H, Wiestler OD, Cavenee WK, Burger PC, Jouvet A,
Scheithauer BW, Kleihues P: The 2007 WHO classification of tumours of
the central nervous system. Acta Neuropathol 2007, 114:97-109.
23. Kang MR, Kim MS, Oh JE, Kim YR, Song SY, Seo SI, Lee JY, Yoo NJ, Lee SH:
Mutational analysis of IDH1 codon 132 in glioblastomas and other
common cancers. Int J Cancer 2009, 125:353-355.
24. Martinez R, Schackert G: Epigenetic aberrations in malignant gliomas: an
open door leading to better understanding and treatment. Epigenetics
2007, 2:147-150.
25. Bulk E, Sargin B, Krug U, Hascher A, Jun Y, Knop M, Kerkhoff C, Gerke V,
Liersch R, Mesters RM, et al: S100A2 induces metastasis in non-small cell
lung cancer. Clin Cancer Res 2009, 15:22-29.
26. Tseng MY, Liu SY, Chen HR, Wu YJ, Chiu CC, Chan PT, Chiang WF, Liu YC,
Lu CY, Jou YS, Chen JY: Serine protease inhibitor (SERPIN) B1 promotes
oral cancer cell motility and is over-expressed in invasive oral squamous
cell carcinoma. Oral Oncol 2009, 45:771-776.
27. Alaminos M, Davalos V, Ropero S, Setien F, Paz MF, Herranz M, Fraga MF,
Mora J, Cheung NK, Gerald WL, Esteller M: EMP3, a myelin-related gene
located in the critical 19q13.3 region, is epigenetically silenced and
exhibits features of a candidate tumor suppressor in glioma and
neuroblastoma. Cancer Res 2005, 65:2565-2571.
28. Kannan-Thulasiraman P, Seachrist DD, Mahabeleshwar GH, Jain MK, Noy N:
Fatty acid binding protein 5 and PPAR{beta}/{delta} are critical
mediators of EGFR-induced carcinoma cell growth. J Biol Chem 2010.
29. Miura T, Nishinaka T, Terada T: Different functions between human
monomeric carbonyl reductase 3 and carbonyl reductase 1. Mol Cell
Biochem 2008, 315:113-121.
30. Takenaka K, Ogawa E, Oyanagi H, Wada H, Tanaka F: Carbonyl reductase
expression and its clinical significance in non-small-cell lung cancer.
Cancer Epidemiol Biomarkers Prev 2005, 14:1972-1975.
31. Nagarajan RP, Costello JF: Epigenetic mechanisms in glioblastoma
multiforme. Semin Cancer Biol 2009, 19:188-197.
32. Quinlan KG, Verger A, Yaswen P, Crossley M: Amplification of zinc finger
gene 217 (ZNF217) and cancer: when good fingers go bad. Biochim
Biophys Acta 2007, 1775:333-340.
33. Banck MS, Li S, Nishio H, Wang C, Beutler AS, Walsh MJ: The ZNF217
oncogene is a candidate organizer of repressive histone modifiers.
Epigenetics 2009, 4:100-106.
34. Feng L, Hatten ME, Heintz N: Brain lipid-binding protein (BLBP): a novel
signaling system in the developing mammalian CNS. Neuron 1994,
12:895-908.
35. Kaloshi G, Mokhtari K, Carpentier C, Taillibert S, Lejeune J, Marie Y,
Delattre JY, Godbout R, Sanson M: FABP7 expression in glioblastomas:
relation to prognosis, invasion and EGFR status. J Neurooncol 2007,
84:245-248.
36. Jung Y, Park J, Bang YJ, Kim TY: Gene silencing of TSPYL5 mediated by
aberrant promoter methylation in gastric cancers. Lab Invest 2008,
88:153-160.
37. Kim EJ, Lee SY, Kim TR, Choi SI, Cho EW, Kim KC, Kim IG: TSPYL5 is
involved in cell growth and the resistance to radiation in A549 cells via
the regulation of p21(WAF1/Cip1) and PTEN/AKT pathway. Biochem
Biophys Res Commun 2010, 392:448-453.
38. Phillips HS, Kharbanda S, Chen R, Forrest WF, Soriano RH, Wu TD, Misra A,
Nigro JM, Colman H, Soroceanu L, et al: Molecular subclasses of high-
grade glioma predict prognosis, delineate a pattern of disease
progression, and resemble stages in neurogenesis. Cancer Cell 2006,
9:157-173.
39. Verhaak RG, Hoadley KA, Purdom E, Wang V, Qi Y, Wilkerson MD, Miller CR,
Ding L, Golub T, Mesirov JP, et al: Integrated genomic analysis identifies
clinically relevant subtypes of glioblastoma characterized by
abnormalities in PDGFRA, IDH1, EGFR, and NF1. Cancer Cell 2010,
17:98-110.
40. Stupp R, Mason WP, van den Bent MJ, Weller M, Fisher B, Taphoorn MJ,
Belanger K, Brandes AA, Marosi C, Bogdahn U, et al: Radiotherapy plus
concomitant and adjuvant temozolomide for glioblastoma. N Engl J Med
2005, 352:987-996.
41. Dunn J, Baborie A, Alam F, Joyce K, Moxham M, Sibson R, Crooks D,
Husband D, Shenoy A, Brodbelt A, et al: Extent of MGMT promoter
methylation correlates with outcome in glioblastomas given
temozolomide and radiotherapy. Br J Cancer 2009, 101:124-131.
42. Stolt CC, Rehberg S, Ader M, Lommes P, Riethmacher D, Schachner M,
Bartsch U, Wegner M: Terminal differentiation of myelin-forming
oligodendrocytes depends on the transcription factor Sox10. Genes Dev
2002, 16:165-170.
43. Salvati M, Formichella AI, D’Elia A, Brogna C, Frati A, Giangaspero F,
Delfini R, Santoro A: Cerebral glioblastoma with oligodendrogliomal
component: analysis of 36 cases. J Neurooncol 2009, 94:129-134.
doi:10.1186/1471-2164-11-701Cite this article as: Etcheverry et al.: DNA methylation in glioblastoma:impact on gene expression and clinical outcome. BMC Genomics 201011:701.
Submit your next manuscript to BioMed Centraland take full advantage of:
• Convenient online submission
• Thorough peer review
• No space constraints or color figure charges
• Immediate publication on acceptance
• Inclusion in PubMed, CAS, Scopus and Google Scholar
• Research which is freely available for redistribution
Submit your manuscript at www.biomedcentral.com/submit
Etcheverry et al. BMC Genomics 2010, 11:701
http://www.biomedcentral.com/1471-2164/11/701
Page 11 of 11