dna repair and cell cycle biomarkers of radiation exposure
TRANSCRIPT
DNA Repair and Cell Cycle Biomarkers of RadiationExposure and Inflammation Stress in Human BloodHelen Budworth1., Antoine M. Snijders1., Francesco Marchetti1¤, Brandon Mannion1,
Sandhya Bhatnagar1, Ely Kwoh1, Yuande Tan2, Shan X. Wang3, William F. Blakely4, Matthew Coleman5,
Leif Peterson2, Andrew J. Wyrobek1*
1 Life Sciences Division, Lawrence Berkeley National Laboratory, Berkeley, California, United States of America, 2 Center for Biostatistics, The Methodist Hospital Research
Institute, Houston, Texas, United States of America, 3 Department of Materials Science and Engineering, Department of Electrical Engineering, Stanford University,
Stanford, California, United States of America, 4 Armed Forces Radiobiology Research Institute, Uniformed Services University of the Health Sciences, Bethesda, Maryland,
United States of America, 5 Radiation Oncology, UC Davis School of Medicine, University of California Davis, Davis, California, United States of America
Abstract
DNA damage and repair are hallmarks of cellular responses to ionizing radiation. We hypothesized that monitoring theexpression of DNA repair-associated genes would enhance the detection of individuals exposed to radiation versus otherforms of physiological stress. We employed the human blood ex vivo radiation model to investigate the expressionresponses of DNA repair genes in repeated blood samples from healthy, non-smoking men and women exposed to 2 Gy ofX-rays in the context of inflammation stress mimicked by the bacterial endotoxin lipopolysaccharide (LPS). Radiationexposure significantly modulated the transcript expression of 12 genes of 40 tested (2.2E-06,p,0.03), of which 8 showedno overlap between unirradiated and irradiated samples (CDKN1A, FDXR, BBC3, PCNA, GADD45a, XPC, POLH and DDB2). Thispanel demonstrated excellent dose response discrimination (0.5 to 8 Gy) in an independent human blood ex vivo dataset,and 100% accuracy for discriminating patients who received total body radiation. Three genes of this panel (CDKN1A, FDXRand BBC3) were also highly sensitive to LPS treatment in the absence of radiation exposure, and LPS co-treatmentsignificantly affected their radiation responses. At the protein level, BAX and pCHK2-thr68 were elevated after radiationexposure, but the pCHK2-thr68 response was significantly decreased in the presence of LPS. Our combined panel yields anestimated 4-group accuracy of ,90% to discriminate between radiation alone, inflammation alone, or combined exposures.Our findings suggest that DNA repair gene expression may be helpful to identify biodosimeters of exposure to radiation,especially within high-complexity exposure scenarios.
Citation: Budworth H, Snijders AM, Marchetti F, Mannion B, Bhatnagar S, et al. (2012) DNA Repair and Cell Cycle Biomarkers of Radiation Exposure andInflammation Stress in Human Blood. PLoS ONE 7(11): e48619. doi:10.1371/journal.pone.0048619
Editor: Kerstin Borgmann, University Medical Center Hamburg-Eppendorf, Germany
Received June 11, 2012; Accepted September 26, 2012; Published November 7, 2012
This is an open-access article, free of all copyright, and may be freely reproduced, distributed, transmitted, modified, built upon, or otherwise used by anyone forany lawful purpose. The work is made available under the Creative Commons CC0 public domain dedication.
Funding: This work was performed under the auspices of the U.S. Department of Energy by the University of California, Lawrence Berkeley National Laboratoryunder DOE contract No. DE-AC02-05CH11231. This project has been funded in whole or in part by Federal funds from the Biomedical Advanced Research andDevelopment Authority, Office of the Assistant Secretary for Preparedness and Response, Office of the Secretary, Department of Health and Human Services,under Contract No. HHSO100201000006C. The Armed Forces Radiobiology Research Institute (AFRRI) supported the involvement of WFB in this research underAFRRI work units RBB4AR and RAB4AU; views presented in this manuscript are those of the authors; no endorsement by the Department of Defense has beengiven or should be inferred. The funders had no role in study design, data collection and analysis, decision to publish, or preparation of the manuscript.
Competing Interests: The authors have declared that no competing interests exist.
* E-mail: [email protected]
¤ Current address: Environmental Health Science Research Bureau, Health Canada, Ottawa, ON, Canada
. These authors contributed equally to this work.
Introduction
Biological markers of exposure to ionizing radiation (IR) in
human populations are of great interest for assessing normal tissue
injury in radiation oncology and for biodosimetry in nuclear
incidents and accidental radiation exposures. Current approaches
to radiation biodosimetry include assessments of physical effects,
such as time to emesis and blood lymphocyte kinetics, and cellular
determinants such as cytogenetic biodosimetry to assess radiation-
induced chromosome aberrations in circulating blood lymphocytes
[1]. However, these methods are time-consuming and do not
provide results fast enough to identify people who would benefit
the most from medical intervention immediately after irradiation.
The use of biochemical markers, such as changes in transcript or
protein expression or posttranslational modifications, represents an
alternative method with the potential for high-throughput,
deployable methods for initial triage as well as for the estimation
of exposure dose (reviewed in [1,2]).
Recent studies have identified large-scale changes in transcript
expression in irradiated blood lymphocytes shortly following IR
exposures and that transcript changes can persist for days after
exposure [3–12]. A 2006 literature review from our laboratory
identified over 260 radiation-responsive proteins and ranked them
according to their potential usefulness in human biodosimetric
applications [13]. Genes involved in cellular DNA damage
response and repair functions, including DNA repair, cell cycle
functions and apoptosis were identified as priority candidates for
radiation biodosimetry.
DNA is a critical cellular target of IR and the ability of the cell
to repair DNA damage determines its fate after exposure. Various
PLOS ONE | www.plosone.org 1 November 2012 | Volume 7 | Issue 11 | e48619
forms of DNA damage are induced by IR, including DNA-protein
cross-links, base and sugar alterations, DNA single-strand breaks
(SSBs), bulky lesions (i.e. clusters of base and sugar damage) and
double-strand breaks (DSBs) [14]. The immediate response to IR-
induced DNA damage is the stimulation of the DNA repair
machinery and the activation of cell cycle checkpoints, followed by
down-stream cellular responses such as apoptosis that removes
damaged cells. The predominant repair pathway is base excision
repair (BER), which is responsible for the removal of damaged
bases and DNA single-strand breaks through gap-filling by DNA
polymerase and ligation of DNA ends [15]. Nucleotide excision
repair (NER) is the major pathway for the repair of bulky DNA
damages that cause DNA helical distortion [16]. NER proteins are
also involved in repair of oxidative damage through stimulation of
BER, including XPC and XPG, indicating cross-talk between
these two repair pathways [17–21]. Several NER genes are
upregulated at the gene expression level by IR, including XPC and
DDB2 [4,22]. IR exposure is known to modulate transcript and/or
protein levels of several cell cycle regulators (CDKN1A (p21),
GADD45a, Cyclin G1 (CCNG1), CHK2-thr68) and apoptosis genes
(BAX and BBC3) in diverse cell and blood model systems (in vivo,
in vitro and ex vivo) [6,8,10,23–28]. However, little is known of how
co-exposure to confounding factors can affect the utility of
individual biomarkers for radiation biodosimetry [1,29,30].
The human blood ex vivo irradiation exposure model has been
used to investigate the early radiation-induced biological responses
for potential biodosimetry applications, and was recently demon-
strated to accurately reflect the in vivo peripheral blood radiation
response in humans [12]. Our study utilized this model to
examine: (i) the transcriptional response of 40 well known DNA
repair, cell cycle control and apoptosis genes after exposure to IR;
(ii) IR-induced transcript changes associated with changes in a
selected set of proteins; and (iii) transcript and protein responses in
the context of inflammatory stress. Lipopolysaccharide (LPS), the
principal component of the outer membrane of Gram-negative
bacteria [31], elicits strong inflammatory responses and induces
oxidative stress in exposed mammalian cells [32]. Our findings
demonstrate that inflammation significantly confounds the radia-
tion response of some DNA repair genes at a dose that is relevant
for radiation biodosimetry. We identified a small panel of DNA
repair transcripts and proteins whose expression changes distin-
guish between unirradiated and 2 Gy ex vivo irradiated human
blood samples display excellent radiation dose and time dependent
responses in an independent ex vivo irradiated human dataset, show
robust non-overlapping responses in blood samples from human
patients treated with total body irradiation, and demonstrate high
accuracy for classifying blood samples receiving radiation only,
inflammation stress alone, or both.
Materials and Methods
Human SubjectsAll research involving human subjects were approved by the
Lawrence Berkeley National Laboratory Institutional Review
Board. Peripheral blood from healthy volunteers was obtained
after written informed consent and was drawn into sodium citrate
(whole blood culture model) or sodium heparin (PBMC culture
model) Vacutainer tubes (Becton Dickinson and Company,
Franklin Lakes, NJ).
Whole Blood ex vivo Radiation ModelFive donors (2 male, 3 female; age range, 20–50 years) provided
two peripheral blood samples each, at least one month apart for
measurement of transcript and protein responses. Blood collected
in Vacutainer tubes was transferred in 18 ml aliquots into 50 ml
conical tubes. Blood in tubes was exposed at room temperature to
0 or 2 Gy X-rays, (,780 mGy/min; Pantak 320 kVp X-ray
machine (Precision X-ray); run at 300 kV and 10 mA). Dosimetry
was performed using a RadCal AccuPro dosimeter by measuring
the accumulated dose over a specific time interval. After
irradiation, blood samples were diluted 1:1 with RPMI 1640
medium (Sigma-Aldrich) supplemented with 10% heat-inactivated
fetal bovine serum (Invitrogen) in 50 ml centrifuge tubes, loosely
capped and maintained on a 10 degree angle at 37uC in a
humidified incubator with 5% CO2 for 24 hrs. LPS was added to
some blood cultures immediately after irradiation (50 ng/ml LPS
from Escherichia coli O111:B4) (Sigma Aldrich). After 24 hrs, buffy
coats were extracted for protein and RNA purification. Plasma
was collected, aliquoted and stored at 280uC.
RNA Isolation and Quantitative RT-PCRRNA was isolated using Trizol reagent (Invitrogen) and
purification was performed according to the manufacturer’s
instructions. In brief, cell pellets were homogenized in Trizol
reagent (1.2 ml). The lysed cells were incubated for 5 min at room
temperature, followed by the addition of 0.25 ml chloroform.
After mixing, the samples were centrifuged at 12,000 g for 15 min
at 4uC. The aqueous phase was separated and 0.625 ml ice-cold
isopropanol was used to precipitate RNA. The samples were
incubated at room temperature for 10 min and total RNA was
collected by centrifugation at 12,000 g for 10 min at 4uC. The
RNA pellet was washed with 1 ml 70% ethanol and dissolved in
40 ml RNase-free deionized water. The RNA was quantified using
a NanoDrop-2000c spectrophotometer (Thermo Scientific), and
quality was monitored with the Agilent 2100 Bioanalyzer (Agilent
Technologies, Santa Clara, CA). RNA integrity numbers (RIN)
ranged from between 7 to 9.5 (mean, 8.3), and 260/280
absorbance ratios ranged from 1.7 to 1.95 (mean, 1.86) [33].
For cDNA synthesis, an aliquot of 4 mg of total RNA was
reverse transcribed using the High-Capacity cDNA Reverse
Transcription Kit (Applied Biosystems, Foster City, CA) according
to the manufacturer’s instructions. Taqman Gene Expression
Assays (Applied Biosystems, Foster City, CA, USA) were used,
according to manufacturer’s instructions, to detect mRNA of
40 DNA damage response genes. 13 genes were selected for
further investigation (BAX, Hs00180269_m1*, BBC3,
Hs00248075_m1*, FDXR, Hs01031624_m1, CDKN1A,
Hs00355782_m1*, GADD45a, Hs99999173_m1, CCNG1,
Hs00171112_m1*, CHK2, Hs00200485_m1*, PCNA,
Hs00696862_m1, LIG1, Hs01553527_m1*, XPC,
Hs01104206_m1*, DDB2, Hs03044953_m1*, POLH,
Hs00982625_m1*, RAD51, Hs00153418_m1*; * indicates manu-
facturer’s recommended assay for this gene, if more than one assay
was available). See Table S1 for a full list of all 40 genes and assay
numbers. The RT-PCR reactions were performed, in individual
reaction format, with the ABI 7500 Fast Real Time PCR System
using Taqman Fast Universal PCR Master Mix from ABI and
following manufacturer’s recommendations. The results were
expressed as the threshold cycle (Ct), i.e. the cycle number at
which the PCR product crosses the threshold of detection. The
relative quantification of the target transcripts normalized to the
endogenous control ACTB (b-Actin) was determined by the
comparative Ct method (DCt) according to the manufacturer’s
protocol. The endogenous control gene GAPDH was run
concurrently but was not used for normalization since LPS
treatment induced changes in GAPDH transcript levels. Relative
fold inductions were calculated by the DDCT method [7]. All
samples were run in triplicate. A no RT qPCR control was
Blood Biomarkers of Radiation Exposure and Stress
PLOS ONE | www.plosone.org 2 November 2012 | Volume 7 | Issue 11 | e48619
included for all reactions to monitor for genomic DNA contam-
ination and was negative across all reactions.
Confirmation of Radiation Responsiveness of Our 8-geneTranscript Panel in Independent Expression Datasets ofex vivo Irradiated Human Blood and Blood Samples ofHuman Patients Undergoing total body Irradiation
Globally normalized whole genome microarray expression
profiles of whole blood irradiated ex vivo were obtained from the
NCBI GEO database (GSE8917; [10]). In that study, human
peripheral blood was obtained from five donors and irradiated ex
vivo (sham, 0.5, 2, 5 and 8 Gy). RNA was isolated from samples
collected at 6 and 24 hrs after exposure and transcript levels were
measured using Agilent-012391 Whole Human Genome Oligo
Microarray G4112A [10]. We then mean normalized the
expression levels of each of the eight genes in this dataset across
doses, times, and donors, and then summed theses values across all
8 genes for each blood sample in each treatment group. For
calculating dose response, we plotted the average and standard
error for each dose group, normalized to the average value of the
sham group for each of the two time points.
Globally normalized whole genome expression profiles of
patients undergoing total body irradiation (TBI) were obtained
from the NCBI GEO database (GSE20162; [12]). In that study,
peripheral blood gene expression profiles were obtained from 18
donors undergoing TBI. Patients were exposed to a total of
3.75 Gy in one day divided into three equal fractions of 1.25 Gy
with approximately 4 hrs between fractions. Blood was collected
before irradiation, 4 hrs after the first fraction of 1.25 Gy and 20–
24 hrs after the first fraction. Blood from 14 healthy donors was
collected as control. RNA was extracted and transcript levels were
measured using Agilent Whole Human Genome Microarray
G4112A [12]. For the TBI dataset, we again mean normalized the
expression levels of each of our 8 genes across all samples in the
database for the patients and healthy donors. For each blood
samples we calculated the sum of the normalized expression of
each of the 8 genes, normalized to the average of the sum
expression of the healthy donors.
Peripheral Blood Mononuclear Cell (PBMC) ex vivoRadiation Model
Seven donors (6 male, 1 female; age range, 20–50 years)
provided two peripheral blood samples each, at least one month
apart, for protein analyses. Blood was transferred to 3 equal
(,13 ml) aliquots into 50 ml conical tubes. Blood in tubes was
exposed at room temperature to 0, 2 or 6 Gy X-rays at a rate of
,1.25 Gy/min (2 Gy) or ,1.30 Gy/min (6 Gy) (X-ray machine
(Faxitron) set at 160 kV and 6.3 mA). Dosimetry was performed
using a RadCal AccuPro dosimeter by measuring the accumulated
dose over a specific time interval. After irradiation, blood samples
were separated over Accuspin System-Histopaque-1077 (Sigma-
Aldrich) according to the manufacturer’s instructions. PBMC were
washed in phosphate buffered saline (PBS) and resuspended in
RPMI 1640 medium (Sigma-Aldrich) supplemented with 10%
heat-inactivated fetal bovine serum (Invitrogen) and cultured in
duplicate T25 flasks for each dose group. Cells were maintained
on a rocking platform at 37uC in a humidified incubator with 5%
CO2 for 6 and 24 hrs.
Cell Lysates for Protein Analyses by Enzyme-linkedImmunosorbent Assays (ELISA)
Buffy coats were collected from whole blood cultures and
treated with a 1:3 mixture of warm (37uC) RBC Lysis buffer (5
Prime) for two steps and then washed once with cold phosphate
buffered saline. The obtained cell pellets or PBS-washed PBMC
pellets, from the PBMC culture model, were then lysed with Pierce
M-PER Mammalian Protein Extraction Reagent and 1X Halt
protease/phosphatase inhibitors (Thermo Scientific). Extracts
were collected, aliquoted and stored at 280uC. Protein concen-
trations were measured using Pierce BCA Protein Assay Reagent
(Thermo Scientific). Amounts of protein in lysate or plasma were
quantified using ELISA kits; human BAX ELISA kit (Assay
Designs), human phosphorylated CHK2-thr68 ELISA kit (Cell
Signalling). The biological effectiveness of LPS was confirmed by
measuring secretion of IL-6 and TNF-a in plasma by ELISA
following manufacturer’s recommended protocol (R&D Systems).
ELISAs were performed following manufacturer’s instructions.
BAX ELISAs were performed using 0.1 or 1 mg protein cell lysate
per well for irradiated and non-irradiated samples, respectively.
pCHK2-thr68 ELISAs were performed using 25 mg of protein cell
lysate for all samples. IL-6 and TNF-a ELISAs were performed
using undiluted or 1:100-fold dilution of plasma for non-LPS and
LPS-co-treated samples, respectively. All ELISA absorbance
readings were read with reference to the standard curve, except
for pCHK2-thr68 that had no standard curve and used average
difference data between control and test samples as readout
(Figure S1). The majority of absorbance readings were within a
0.1–0.7 range (Table S2). All samples were run in duplicate.
ELISA plates were read using TECAN Infinite M200 plate reader
and analyzed using the TECAN Magellan software. Raw ELISA
data was loge transformed and mean-zero standardized to obtain a
standard normal distribution. We performed inferential tests of
hypothesis via independent 2 sample t-tests for each dose-time
experimental group for each biomarker.
Classification AnalysisWe investigated the classification characteristics of our panel of
transcript and protein biomarkers for assigning individual samples
into their correct exposure/treatment group: no treatment (N),
radiation exposure only (R), LPS treatment only (L), and samples
exposed to both radiation and LPS (RL). Classification was
performed using marker expression values for n = 40 observations
per marker, based on the replicate pair of observations per subject
and 4 classes (40 = 26564). A 4-class problem was considered for
which the true class labels of observations were N, R, L, and RL.
Marker order was determined via filtering by considering all
possible pairs of classes, and for each pair ranking all 9 markers by
their Gini index [34] for pairwise class discrimination; this
involved 6 possible pairwise comparisons (6 = 4(3)/2). The Gini
index, G, is a measure of class impurity among objects assigned to
a given node in a decision tree [34]. For a given tree node,
G~1{PK
k p2k, where pk is the proportion of node members in
class k, and K is the number of classes. Gini has range 0#G#1, and
is equal to zero when there is class purity in the node, and equal to
unity when KR‘ and all pk tend to zero. The first gene selected
was therefore the best discriminating marker for the N and R
classes, followed by the best discriminating marker for the N and L
class pairs. Any markers that were the best for multiple pairs of
classes were selected in the order of their first appearance among
ranks. After filtering to identify marker order based on discrim-
ination, k-nearest neighbor (KNN) classification analysis was
performed with K = 5, so the KNN model was called 5NN. An
odd value for K was chosen to prevent ties in the predicted class
membership of nearest neighbors. Classification accuracy based on
ten 10-fold cross-validation for predicting the correct true class
label was performed using sets of the 1, 2,…, 9 ordered markers.
Linear discriminant analysis and PCA were not performed
Blood Biomarkers of Radiation Exposure and Stress
PLOS ONE | www.plosone.org 3 November 2012 | Volume 7 | Issue 11 | e48619
because covariance (correlation) is undefined for one marker.
Diagnostic screening was also determined for the 9-marker set to
determine sensitivity, specificity, positive predictive value (PV+),
and negative predictive value (PV2). Sensitivity is equal to the
proportion of observations in a given class with the correct class
prediction, whereas specificity is the proportion of observations not
in a given class whose predicted membership is not in the given
class. On the other hand, PV+ reflects the proportion of
observations predicted to be in a given class that are truly in the
class, while PV2 is defined as the proportion of observations that
are not predicted to be in a given class which are not in the given
class.
Results
Radiation Response of DNA Repair GenesThe radiation response of 40 genes associated with various
aspects of DNA damage response (Table S1) was surveyed.
Twelve genes (Figure 1) were significantly modulated in
transcript response 24 hrs after ex vivo exposure to 2 Gy X-rays,
relative to sham-irradiated samples (individual t-test 2.2E-
06,p,0.03; Figure S2). Most of these genes (11 of 12) showed
increased expression after exposure (Figure 1), ranging from 2.3-
fold for LIG1 to 17-fold for FDXR. RAD51, a key component of
homologous recombination repair, was the only gene in this set
that showed significant down regulation after exposure (2.5-fold).
Expression responses for sham and irradiated samples showed little
inter-individual variation and reproducible responses within
donors sampled twice at approximately one month apart. These
findings indicate that transcript responses of this panel of 12 DNA
repair genes are robust biomarkers of radiation exposure in
peripheral blood cells. Among these 12 genes, we found no overlap
between sham and irradiated samples for 8 biomarkers (BBC3,
FDXR, CDKN1A, GADD45a, PCNA, XPC, DDB2 and POLH;
individual T-test 2.24E-06,p,7.45E-04), and found only slight
overlaps for the other 4 biomarkers (BAX, CCNG1, LIG1 and
RAD51; individual t-test 7.64E-04,p,2.57E-02) (Figure S2).
CHK2 is included as an example of a gene that does not respond
to radiation (Figure 1; p = 0.5). Our findings predict that when
blood samples prior to exposure are not available, our panel of
eight DNA repair markers can distinguish between 2 Gy
irradiated and unirradiated individuals with 100% accuracy
24 hrs after a 2 Gy exposure.
Validation of the Dose and Time Response Characteristicsof Our 8-gene Transcript Panel in Independent Human exvivo and in vivo Datasets
We tested the dose response characteristics of our 8-gene panel
(BBC3, FDXR, CDKN1A, PCNA, XPC, GADD45a, DDB2 and
POLH) using an independent public dataset containing microarray
transcript expression data collected at 6 and 24 hrs after ex vivo
exposures (sham, 0.5, 2, 5 and 8 Gy) in human blood from 5
independent donors. This analysis confirmed our primary finding
of no overlap in transcript responses for any of the 8 genes
between sham and irradiated samples at 24 hrs after 2 Gy
exposures (Figure S3). We then investigated the dose and time
response characteristics of our panel using the sum expression
values of the 8 genes for each donor (Figure 2A). The average
expression of our panel among the donor group was increased
above sham for all dose groups tested at 6 hrs (p,5.5E-05) and
24 hrs (p,2.32E-04). The average sum expression at 6 hrs was
consistently higher compared to 24 hrs for all doses tested (5.9E-
04,p,0.02). Furthermore, the samples irradiated with 2 Gy were
significantly different from those irradiated with 0.5 Gy (p,6.09E-
03), 5 Gy (p,8.47E-03) or 8 Gy (p,1.65E-04) at 6 and 24 hrs,
demonstrating the significant dose response characteristics of our
panel.
We then tested whether our 8-gene panel could distinguish
human patients receiving total body irradiation (TBI) from pre-
irradiation patients and healthy controls. We obtained a public
dataset containing microarray transcript expression data of blood
collected from 14 independent healthy donors and from 18
patients who provided blood samples before TBI treatment, at
4 hrs after the first of three fractions of 1.25 Gy and at 20–24 hrs
after the first fraction. We calculated the sum expression value for
blood sample for each patient and control subject to investigate
their variation across experimental groups. As shown in
Figure 2B, there was no overlap in expression between TBI
treated blood samples and pre-TBI and control group values. The
average expression of the 8-gene panel after TBI treatment was
increased above the levels of healthy control group and pre-TBI
blood levels for both timepoints tested, at 4 hrs after first fraction
(1.25 Gy; p,1.34E-11) and at 20–24 hrs after the first fraction
(3.75 Gy; p,1.45E-11).
In a separate analysis of human in vivo radiation response, we
compared our 8-gene panel against a 25-gene signature developed
by Meadows et al [35] to distinguish healthy individuals and pre-
irradiation patients from the irradiated patients. In their study,
peripheral blood was obtained from TBI patients before irradi-
ation and 6 hrs after 1.5–2.0 Gy. Peripheral blood was also
obtained from a population of healthy control individuals.
Interestingly, 5 of our eight biomarkers were present in their
signature (XPC, PCNA, CDKN1A, DDB2 and BBC3). These
comparisons against two independent groups of blood samples
from irradiated human patients provide compelling in vivo
corroborative support for the utility of our 8-gene panel for
radiation biodosimetry in blood cells.
LPS Modulation of Transcript and Protein Expression inIrradiated Whole Blood Cultures
We investigated the specificity of the radiation response of our
biomarkers in the ex vivo blood radiation model in the context of
inflammatory stress simulated by LPS. We confirmed that LPS
treatment (50 ng/ml) induced an inflammatory response in white
blood cells by measuring the secretion of IL-6 and TNF-a into
plasma of all donors tested, (Figure S4). LPS treatment showed
no significant changes in baseline transcript expression in 5
biomarkers (fold-change ,1.5; GADD45a, PCNA, XPC, DDB2,
POLH) (Figure 3). Significant changes were observed in 3
biomarkers (Figure 3): .8-fold (61.1) increase in CDKN1A and
reduced expression in BBC3 and FDXR (2.9-fold (60.08) and 1.5-
fold (60.1), respectively).
We then investigated the effect of LPS treatment on radiation
response of the 8 genes in our panel, using blood cultures exposed
to 2 Gy X-rays and co-treated with LPS (50 ng/ml). The strongest
effect of LPS on the radiation responses was seen for CDKN1A,
BBC3 and FDXR (Figure 4; fold-change difference .1.4-fold and
p,0.03). LPS modified the radiation response of CDKN1A by an
additional 1.4-fold increase over the effects of radiation on
CDKN1A expression alone (p = 0.03; Figure 4A). BBC3 and
FDXR expression, on the other hand, were repressed 1.6-fold (2.7-
fold upregulated after radiation vs. 1.7-fold after radiation in the
presence of LPS; p = 0.03) and 1.7-fold (17-fold upregulated after
radiation vs. 10-fold after radiation in the presence of LPS;
p = 1.2E-04) after radiation and subsequent culture in the presence
of LPS in comparison to the effects of radiation alone (Figure 4Band C). The radiation responses of the remaining five biomarkers
Blood Biomarkers of Radiation Exposure and Stress
PLOS ONE | www.plosone.org 4 November 2012 | Volume 7 | Issue 11 | e48619

were not significantly altered by LPS treatment (Figure 5; ,1.4-
fold change or p.0.03).
Our analyses of protein expression confirm that phosphorylated
CHK2 protein is a radiation responsive biomarker [36], and
demonstrate that the transcript levels of CHK2 were unaffected by
radiation only, LPS only, and co-exposure to both agents.
Phosphorylated CHK2-thr68 protein levels showed a modest
,1.6 (60.1; p = 2.9E-05) fold increase in the whole blood ex vivo
culture model at 24 hours post 2 Gy irradiation compared to sham
(Figure 6). However, in the presence of LPS, this protein response
was completely suppressed and indistinguishable from sham-
irradiated samples without LPS co-treatment (p.0.4) (Figure 6).
This is compelling evidence that pCHK2-thr68 may not be a
suitable biomarker of radiation exposure when in the context of
inflammatory stress. Interestingly, we found that by including
pCHK2-thr68 as a member of the panel of biomarkers improved
the discrimination of radiation-exposed individuals with inflam-
matory stress from those exposed to radiation alone. We arrived at
this conclusion by comparing the relative protein radiation
responses in our PBMC model compared to our data from the
whole blood culture model. We measured pCHK2-thr68 as well as
BAX protein levels in PBMCs of healthy donors at 6 and 24 hours
after ex vivo exposure to 2 or 6 Gy X-rays. BAX was included in
this study as a surrogate indicator for the role of apoptosis in these
models (Figure S5A). As expected, the pCHK2-thr68 responses
were stronger at the earlier timepoint, while the BAX responses
were stronger at later time (Figure S5B). Both BAX and
pCHK2-thr68 proteins showed significant increases at 6 and
24 hrs after both 2 and 6 Gy exposures (p,0.05) (Figure S5C).
Due to the substantial variability in radiation response in the
PBMC model system both among donors and between repeated
blood draws of the same donor, we used the protein response data
from the whole blood model in our further analyses.
Multi-group Classification of Blood Samples by theirRadiation and Inflammation Status
We tested our combined nine-gene panel of eight transcript and
one protein biomarkers in our ex vivo blood model to test its ability
to discriminate among four exposure/treatment groups: radiation
exposure only (R), inflammatory stress only (L), combined
exposures with both radiation and LPS (RL), and samples with
no radiation exposure or LPS treatment (N) (Figure 7). Marker
filtering with the Gini index (see methods) resulted in the following
marker order: PCNA, CDKN1A, pCHK2-thr68, BBC3, FDXR,
DDB2, XPC, POLH and GADD45a. Figure 8 illustrates the
cumulative 4-class accuracy for the sets of 1, 2,…,9 markers based
on their order of selection during filtering. The overall accuracy
for the single best marker, PCNA, was 0.65, and the accuracy of
0.88 was attained when 5 markers were used, after which the
overall accuracy leveled off. Table 1 lists the results of diagnostic
screening analysis for the 9-marker set. The majority of sensitivity
calculations approached 0.9 or greater. Specificity was in the 0.8–
0.9 range. The positive predictive value (PV+) was unity (1.00) for
the NL class, 0.96 for the L class, and below 0.8 for the R and RL
classes, whereas the negative predictive value (PV2) ranged from
0.81–0.91. This analysis has identified a subpanel of 5 biomarkers
that correctly assign individual blood samples to one of the four
different experimental conditions with an overall classification
accuracy of , 90%.
Figure 1. Radiation-induced transcriptional responses of DNA repair genes in the human ex vivo radiation blood model. Relativetranscript level responses using human blood from 5 healthy human donors measured by quantitative RT-PCR analysis 24 hrs after 2 Gy exposurewith respect to sham (0 Gy) transcript levels. Expression of the sham (0 Gy) and 2 Gy transcript responses were calculated relative to the averageexpression of ACTB (b-Actin). The delta Ct for b-Actin between sham and 2 Gy irradiated samples was ,0.3 for all but one sample, which wasexcluded from this analysis. The fold-change for each gene between sham and irradiated samples was calculated using the delta-delta Ct method.Similar results were obtained when normalized using GAPDH expression as endogenous control (data not shown).doi:10.1371/journal.pone.0048619.g001
Blood Biomarkers of Radiation Exposure and Stress
PLOS ONE | www.plosone.org 5 November 2012 | Volume 7 | Issue 11 | e48619

Discussion
Our findings showcase the advantage of using blood cells and
the expression of genes associated with the DNA repair for human
radiation biodosimetry, and furthermore that these genes have the
ability to discriminate between radiation dose and inflammation
stress. In a survey of 40 DNA repair genes in the human
peripheral blood cells ex vivo radiation model (Table S1), twelve
genes showed more than two fold changes in transcript levels at 24
hours after 2 Gy exposures. These included the cell cycle
regulators (CDKN1A, GADD45a, PCNA and CCNG1), apoptosis
regulators (BAX, BBC3 and FDXR) and genes involved in specific
DNA repair functions (XPC, DDB2, LIGI, POLH and RAD51). We
compared the responses to radiation and inflammation stress to
develop a panel of 8 genes that we validated using publicly
available expression datasets for (1) an independent group of
donors in a blood ex vivo model, and (2) a second independent
group of patients who provided blood samples before and after
whole body radiation ([10,12,35], Figure 2A). Our findings
support the strength of using DNA repair related genes to detect
radiation exposure in the context of inflammation stress, which
may become helpful for discriminating between worried-well,
those exposed to medically significant doses of ionizing radiation
and those experiencing inflammation stress (Table 1). By
including protein expression markers we developed a 9-gene
panel (8 transcripts and one protein marker) that correctly
discriminated irradiated from unirradiated blood samples inde-
pendent of the presence or absence of inflammation stress
(Figure 7), with a ,90% 4-group classification accuracy
(Figure 8).
The DNA repair-associated genes we surveyed are regulated by
TP53 signaling [37]. The TP53 tumor suppressor protein is
central to cell signaling networks following cellular stressors,
including DNA damage such as that caused by ionizing radiation.
TP53 modulates the main DNA repair processes in eukaryotic
cells (base excision repair (BER), nucleotide excision repair (NER),
non-homologous end-joining (NHEJ) and homologous recombi-
nation (HR) along with direct roles in induction of DNA damage-
induced cell cycle arrest and apoptosis. TP53 is activated after
DNA damage through phosphorylation to function as a transcrip-
tional regulator inducing expression of a number of downstream
Figure 2. Independent human ex vivo and in vivo confirmationof the radiation response of the 8-gene panel. The robustness ofour panel of 8 non-overlapping radiation biomarkers was confirmedusing two published expression array data sets: (A) ex vivo irradiated (0,0.5, 2, 5, 8 Gy) human blood samples obtained from five independentdonors 6 and 24 hrs after radiation exposure (GSE8917; [10]) and (B)human in vivo irradiated blood samples obtained from patientsundergoing total body irradiation (GSE20162; [12]). A. Shown is theaverage of the summed expression for the samples in each exposuregroup (+/2 standard error) normalized to the average expression of the0 Gy samples for each time-point. B. Shown is the plot of the summedexpression of the 8-gene panel of each blood sample in the in vivostudy, normalized to the average of the healthy donor samples.doi:10.1371/journal.pone.0048619.g002
Figure 3. Effects of LPS treatment on radiation responsive DNArepair and cell cycle genes. Transcript level responses measured byquantitative RT-PCR analysis 24 hrs after LPS treatment of whole bloodof two apoptosis, three cell cycle and three DNA repair genes withrespect to transcript levels in untreated blood cultures. CDKN1A wasstrongly upregulated (,8.2-fold) by LPS treatment alone in the absenceof radiation exposure with little variation among donors. BBC3 andFDXR expression was downregulated (,3-fold and ,1.5-fold, respec-tively) by LPS treatment. LPS treatment did not modulate expressionlevels of GADD45a, PCNA, XPC, DDB2 and POLH (,1.5-fold change inexpression compared to untreated samples). ACTB was used tonormalize gene expression in samples in which the delta Ct of LPStreated vs untreated was less than 0.3 (donor 1.1, 3, 4.1, 5 and 5.1).GAPDH was not used to normalize since its levels varied depending onthe presence of LPS (the average Ct difference between GAPDH in LPStreated and untreated samples was 0.54).doi:10.1371/journal.pone.0048619.g003
Blood Biomarkers of Radiation Exposure and Stress
PLOS ONE | www.plosone.org 6 November 2012 | Volume 7 | Issue 11 | e48619

target genes that directly control cellular outcomes [38]. Activators
of TP53 include CHK2, a serine/threonine kinase that, upon
activation directly by ATM phosphorylation (e.g., threonine-68) or
indirectly by other protein kinases (e.g., DNA-PKcs), acts as both a
downstream signal transducer of DNA damage and an effector for
DNA repair, checkpoint control and apoptosis [39]. In our study
we did not observe changes in transcript expression of CHK2
following irradiation, consistent with the role of CHK2 as an
upstream mediator of TP53 rather than a downstream target,
however, an increase in phosphorylated CHK2 protein was
observed. Phosphorylation of TP53 at serine-20 by CHK2
prevents MDM2-mediated TP53 degradation. This enhancement
of TP53 stability allows for the continuance of downstream DNA
damage response pathways including apoptosis, of which BAX is
an effector [40]. CHK2, a direct substrate of ATM, is an earlier
DNA damage response protein than BAX. Hirao et al. [41]
observed by Western blot that CHK2 levels in both sham- and
5 Gy irradiated wild-type mouse thymocytes precede BAX up
until 6 h post-irradiation, which is consistent with our protein
ELISA results post-irradiation.
Our radiation-response results in the ex vivo blood model are
consistent with previous human studies [6,8,10,23–25,42] with the
exception of RAD51, which showed a decrease in expression in our
study [43]. A recent study in mice of radiation effects on gene
expression showed significant increases in expression of CDKN1A,
BBC3 and GADD45a at 24 hrs after 2 Gy whole body irradiation
[42]. However, in that study DDB2 was downregulated and no
significant changes were observed for FDXR or XPC, which is
inconsistent with our results and those of others in humans
irradiated ex vivo [10]. Expression of GADD45a, LIG1 and XPC
were decreased at 24 hours after 6 Gy IR in mice, whereas we
observed increased expression at 24 hrs after 2 Gy in our ex vivo
human blood culture model consistent with published human ex
vivo and in vivo literature [7,12,30]. Also, our use of a 2 Gy
exposure (rather than 6 Gy used in a prior mouse study [30]) is
more relevant for radiation biodosimetry because individuals
having a radiation exposure dosage of less than 2 Gy require no
immediate treatment as opposed to those having a dosage higher
than 2 Gy. The inherent differences between murine and human
assays emphasize the importance of using human model systems to
validate biomarkers for human radiation biodosimetry. Our study
investigates the blood of unrelated people and we confirm our
findings in a separate independent group of unrelated people,
suggesting that interindividual variation in the transcript response
is not a major factor for the genes in our panel.
Understanding the effects of confounding factors, such as
inflammation stress, on radiation-responsive biomarkers is impor-
tant for assessing their utility in radiation biodosimetry in practical
human exposure scenarios [1,2,29,30]. Of the 8 radiation-
responsive genes in our study, only three (CDKN1A, FDXR and
BBC3) were confounded by LPS-induced inflammation stress.
CDKN1A is a canonical marker of DNA damage response and has
been proposed as a biomarker of radiation exposure [7,42]. While
cigarette smoking did not confound the radiation response of
Figure 4. Radiation-induced transcript responses of CDKN1A, BBC3 and FDXR are confounded by LPS treatment. Transcript levelresponses measured by quantitative RT-PCR analysis 24 hrs after exposure to 2 Gy, LPS treatment, and combined LPS and 2 Gy of whole blood ofCDKN1A (A), BBC3 (B), and FDXR (C) genes with respect to transcript levels in un-treated blood cultures. A. A radiation exposure of 2 Gy in the absenceof LPS (left panel) or LPS treatment alone (middle panel) induced CDKN1A to approximately the same level at 24 hrs: 7.3 vs 8.2-fold, respectively (T-Test p = 0.47). LPS treatment in the presence of a 2 Gy radiation exposure induced CDKN1A expression ,10.2-fold (right panel), which is a 1.4-foldincrease compared to 2 Gy alone (T-test p = 0.03). B. In the absence of LPS, radiation induced BBC3 ,2.7-fold (left panel). LPS treatment alone (middlepanel) suppresses BBC3 ,2.9-fold. LPS treatment in the presence of a 2 Gy radiation exposure induced BBC3 expression ,1.7-fold (right panel), a,1.6-fold decrease in BBC3 expression when compared to 2 Gy alone (T-test p = 0.03). C. In the absence of LPS, radiation induced FDXR ,17-fold (leftpanel). LPS treatment alone (middle panel) suppressed FDXR ,1.5-fold. LPS treatment in the presence of a 2 Gy radiation exposure induced FDXRexpression ,10-fold (right panel), a ,1.7-fold decrease in FDXR expression when compared to 2 Gy alone (T-test p = 1.2E-04).doi:10.1371/journal.pone.0048619.g004
Blood Biomarkers of Radiation Exposure and Stress
PLOS ONE | www.plosone.org 7 November 2012 | Volume 7 | Issue 11 | e48619
CDKN1A [29], our study shows that inflammatory stress induced
CDKN1A transcript levels in the absence of radiation exposure.
Our finding seriously undermines the promise of CDKN1A as a
predictive tool for radiation exposure in individuals suffering
simultaneous inflammatory stress. Studies in the murine central
nervous system also identified CDKN1A as an inflammatory
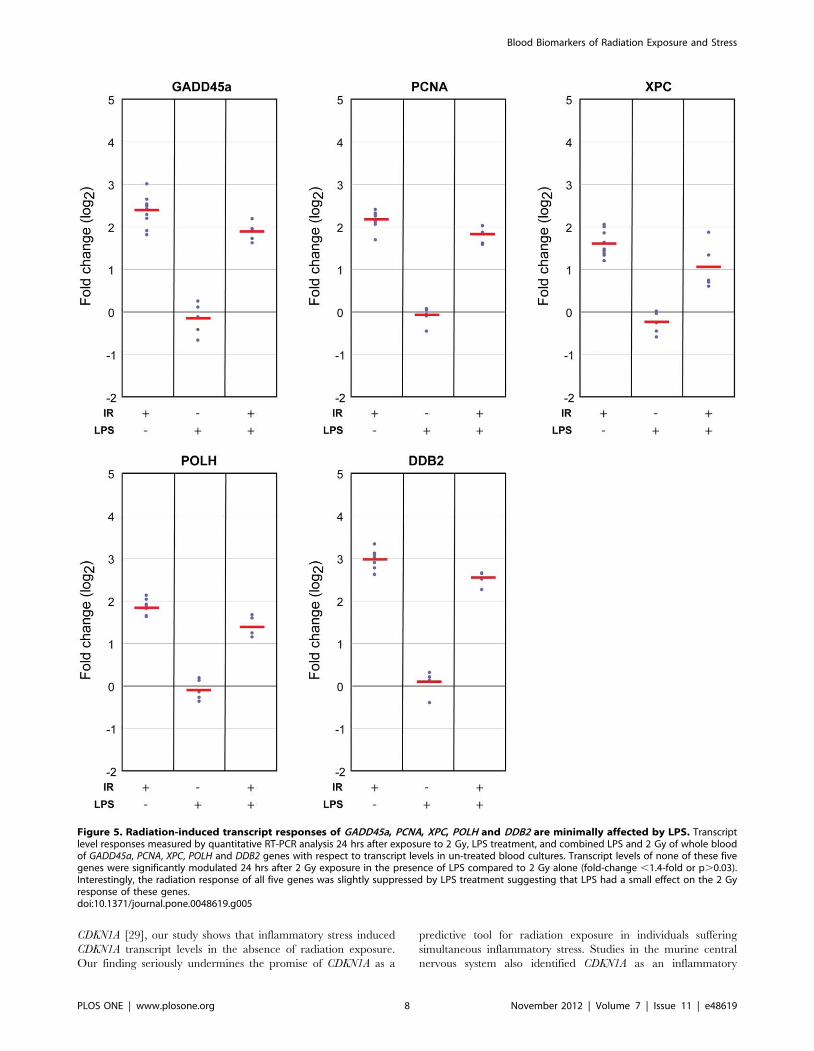
Figure 5. Radiation-induced transcript responses of GADD45a, PCNA, XPC, POLH and DDB2 are minimally affected by LPS. Transcriptlevel responses measured by quantitative RT-PCR analysis 24 hrs after exposure to 2 Gy, LPS treatment, and combined LPS and 2 Gy of whole bloodof GADD45a, PCNA, XPC, POLH and DDB2 genes with respect to transcript levels in un-treated blood cultures. Transcript levels of none of these fivegenes were significantly modulated 24 hrs after 2 Gy exposure in the presence of LPS compared to 2 Gy alone (fold-change ,1.4-fold or p.0.03).Interestingly, the radiation response of all five genes was slightly suppressed by LPS treatment suggesting that LPS had a small effect on the 2 Gyresponse of these genes.doi:10.1371/journal.pone.0048619.g005
Blood Biomarkers of Radiation Exposure and Stress
PLOS ONE | www.plosone.org 8 November 2012 | Volume 7 | Issue 11 | e48619

response gene [44] and LPS exposure upregulated CDKN1A
transcripts in mice [30]. LPS-induced and the radiation-induced
CDKN1A responses were indistinguishable in our human blood
model, while in the mouse the upregulation of CDKN1A at 24
hours after LPS injection did not mask the ability to detect a
radiation response [30]. This difference in murine vs human
responses might be attributed to the differences in LPS dosage
(50 ng/ml in our study vs. 0.3 mg/kg which equals 7.2 mg per
mouse), LPS bioavailability and species differences in response.
We have made the new observation that LPS co-treatment
confounds the transcript response of FDXR and BBC3, also
compromising their utility as radiation biodosimeters. The pro-
apoptotic gene, BBC3, is responsible for induction of apoptosis
pathways following DNA damage. Whole blood cultured in the
presence of LPS repressed the expression of BBC3 ,2.5-fold. Co-
treatment with LPS and radiation diminished BBC3 transcripts
compared to either LPS alone or radiation alone. Consistent with
our finding, LPS suppressed apoptosis in human blood monocytes
[45], but some studies found opposite responses [33]. The
transcription of BBC3 is regulated by a complex combination of
pro-apoptotic and pro-survival mechanisms [46], suggesting that
LPS may suppress BBC3 transcription in blood cultures through
activation of pro-survival signals. In contrast to our findings,
Figure 6. LPS mediated suppression of phosphorylated CHK2-thr68 protein at 24 hrs after 2 Gy exposures. Protein levels ofphosphorylated CHK2-thr68 in protein lysate from cultured wholeblood in the presence or absence of LPS (50 ng/ml) were measured byELISA. Absorbance values were normalized with respect to the averagepCHK2-thr68 level in unirradiated donors. In the absence of LPS,radiation induced CHK2-thr68 levels ,1.6-fold (60.1) relative to shamirradiated samples, whereas in the presence of LPS, CHK2-thr68 levelswere indistinguishable from sham irradiated samples (p.0.4).doi:10.1371/journal.pone.0048619.g006
Figure 7. Transcript and protein panel discriminates 2 Gy exposure and unirradiated samples, independent of inflammation stress.In comparison to untreated sham samples, inflammation in the absence of radiation exposure upregulates CDKN1A (red) and downregulates FDXRand BBC3 (green). Samples exposed to 2 Gy radiation only exhibit increased expression of all nine biomarkers, whereas subjects exposed to 2 Gy plusinflammation stress show modified induction of CDKN1A, FDXR and BBC3 and abrogation of the phosphorylation of CHK2 protein. The arrows in theradiation and inflammation combined treatment group indicate the direction of expression relative to the radiation alone group.doi:10.1371/journal.pone.0048619.g007
Table 1. Classification sensitivity, specificity, predictive valuepositive (PV+), and predictive value negative (PV2) for thenine-gene panel.
Class Sensitivity Specificity PV+ PV2
N 0.89 0.84 1 0.81
R 0.86 0.86 0.78 0.88
L 0.91 0.84 0.96 0.82
RL 0.76 0.89 0.69 0.91
Results are based on ten 10-fold cross-validation runs.doi:10.1371/journal.pone.0048619.t001
Blood Biomarkers of Radiation Exposure and Stress
PLOS ONE | www.plosone.org 9 November 2012 | Volume 7 | Issue 11 | e48619

Tucker and colleagues observed a marginal confounding effect of
LPS treatment on the radiation response of BBC3 in mice [30],
again emphasizing the importance of validating biomarker panels
in a human model.
The increases in protein levels of phosphorylated CHK2 after
radiation-alone exposures were fully suppressed in the presence of
LPS, also undermining it as a useful protein biomarker for
radiation response in the context of inflammation stress. CHK2
protein is phosphorylated in response to DNA damage which
activates the protein [13,36]. While we demonstrate that LPS co-
treatment fully abrogates this radiation-induced CHK2 phosphor-
ylation process, the underlying mechanisms for this confounding
effect remain unclear.
The LPS-modified CDKN1A, FDXR and BBC3 transcript levels
were remarkably uniform among donors, even though the
secretions of IL-6 and TNF-a two genes well-known to be induced
by LPS, were more variable (Figure S4). The levels of LPS-
induced IL-6 and TNF-a were highly correlated (R2 = 0.8; FigureS6). Among 4 of the donors, IL-6 and TNF-a levels in the first
blood draw were nearly identical to those in the second blood
draw, 1 month later. These findings point to the hypothesis that
the induction of inflammatory response genes IL-6 and TNF-adepend on genetic background, while the inductions of CDKN1A
and BBC3 are more ‘switch-like’. This would predict that other
confounding stimuli might also affect CDKN1A and BBC3
expression.
Our research has identified a small panel of DNA repair-related
biomarkers that distinguish among human blood samples from
four radiation exposure scenarios: no radiation exposure, 2 Gy
radiation exposure only, inflammation stress without radiation
exposure, and combined 2 Gy exposure plus inflammation stress.
Independent validation for dose and time response and with in vivo
total body irradiated samples further supports the utility of these
biomarkers for clinical applications, accident scenarios and other
situations involving potential radiation exposure. Future studies
will be needed to evaluate our panel for effects of gender, age, and
inter-individual variations, to examine the influence of differential
radiation cytotoxicities of the white cell subtypes on expression
biodosimetry [47], and to investigate the radiation specificity of
our panel using other inflammation, chemical, and physical
stressors that are relevant for human radiation biodosimetry
applications in various hypothetical exposure scenarios.
Supporting Information
Figure S1 Standard curves for ELISAs. BAX, IL-6 and
TNF-a representative standard curves are shown. pCHK2-thr68
did not use a standard curve.
(PDF)
Figure S2 Transcript level radiation responses of twelveDNA repair-related biomarkers. Relative expression of the
sham (0 Gy) and 2 Gy transcript responses were calculated relative
to the mean expression of ACTB (b-Actin). Each symbol represents
mean of 3 replicate relative expression levels for the designated
DNA repair genes from a blood collection of a single donor. Data
are plotted for 5 donors, each donating two blood samples. The
delta Ct for b-Actin between sham and 2 Gy irradiated samples
was ,0.3 for all but one sample, which was excluded from this
analysis. A two-sided T-test was performed on the distribution of
expression levels between sham and irradiated samples (p-values
are shown in the lower right of each box-plot).
(PDF)
Figure S3 Transcript level radiation responses of eightDNA repair-related biomarkers in an independentdataset. Normalized expression intensities of the sham (0 Gy)
and 2 Gy transcript responses are shown. Each symbol represents
expression levels for the designated DNA repair gene from a blood
collection of a single donor. Data are plotted for 5 donors. A two-
sided T-test was performed on the distribution of expression levels
between sham and irradiated samples (p-values are shown in the
lower right of each box-plot).
(PDF)
Figure S4 Increased plasma protein levels of IL-6 andTNF-a in LPS-treated human blood in 24-hour culture.Levels of IL-6 (A) and TNF-a (B) were measured by ELISA in
human whole blood culture after LPS treatment (50 ng/ml) for
24 hrs. Blood cultures, from five unique donors, each sampled
twice (second samples from each donor indicated by x.1), were
assessed for IL-6 and TNF-a protein levels in plasma at 24 hrs by
ELISA. Concentrations of protein (mg/ml) in each sample and
treatment group are listed in the tables below the figures. In the
absence of LPS-induced inflammatory stress, there is little
detectable protein for either IL-6 or TNF-a. The presence of
LPS induces up to a 7000-fold increase in protein levels for IL-6
(donor 4) and a 3000-fold increase in TNF-a (donor 4). Responses
varied across donors but were consistent between the two different
protein markers of inflammatory stress for each donor (donor 3
and donor 4 showed the greatest induction of both proteins).
(PDF)
Figure S5 Radiation-induced increased protein levels ofBAX and phosphorylated CHK2-thr68 in human ex vivoquiescent PBMC. A. BAX and pCHK2-thr68 responses by
ELISA after 0, 2 or 6 Gy at 6 and 24 hrs in independent replicate
culture flasks from the same blood sample of two donors produce
minimal technical variability (R2 = 0.95 for pCHK2-thr68;
R2 = 0.92 for BAX). B. Levels of BAX and pCHK2-thr68 were
Figure 8. Classification (4-class) accuracy of the transcript andprotein panel. Classification accuracy based on ten 10-fold cross-validation as a function of the number of markers considered, based onorder determined during filtering with the Gini index. The four classesused in this analysis are: radiation only (R), inflammation stress only (L),combined exposures involving both radiation and LPS (RL), and sampleswith no radiation exposure and no LPS treatment (N). Marker order is:PCNA, CDKN1A, pCHK2-thr68, BBC3, FDXR, DDB2, XPC, POLH, andGADD45a. Maximum classification accuracy was 0.88 for the top 5-marker set.doi:10.1371/journal.pone.0048619.g008
Blood Biomarkers of Radiation Exposure and Stress
PLOS ONE | www.plosone.org 10 November 2012 | Volume 7 | Issue 11 | e48619

measured by ELISA in unstimulated PBMC after 0, 2, or 6 Gy
ionizing radiation. PBMC cultures from six or five unique donors
were assessed for BAX and pCHK2-thr68 protein levels at 6 hrs
and 24 hrs by ELISA. Data were normalized with respect to sham
for each timepoint. Repeat draws from the same donor , 1 month
after the first blood draw are indicated with a ‘‘.1’’ after the donor
identifier. C. T-test results (t-statistics and p-values in parentheses)
identify significant mean differences in BAX and pCHK2-thr68
ELISA data for the 0- vs. 2 Gy and 0- vs. 6 Gy groups at 6 hrs and
24 hrs after irradiation.
(PDF)
Figure S6 Correlation between IL-6 and TNF-a respons-es in LPS treated whole blood cultures. Secretion of IL-6
and TNF-a were measured by ELISA for 5 donors. Each donor is
represented with a different color. All donors were sampled twice
at least one month apart. Note that the TNF-a and IL-6 secretory
response after LPS treatment is variable among donors, but highly
correlated between the replicate blood draws for each donor with
the exception of the donor represented in red.
(PDF)
Table S1 Target genes selected from DNA damageresponse pathways for transcript analysis.
(PDF)
Table S2 Average absorbance ranges of ELISA mea-surements.
(PDF)
Author Contributions
Conceived and designed the experiments: HB AMS FM SXW WFB MC
LP AJW. Performed the experiments: HB AMS BM SB EK YT. Analyzed
the data: HB AMS FM BM SB YT LP AJW. Contributed reagents/
materials/analysis tools: YT LP. Wrote the paper: HB AMS AJW.
References
1. Fenech M (2011) Current status, new frontiers and challenges in radiation
biodosimetry using cytogenetic, transcriptomic and proteomic technologies.
Radiation Measurements 46: 737–741.
2. Pinto MM, Santos NF, Amaral A (2010) Current status of biodosimetry based on
standard cytogenetic methods. Radiat Environ Biophys 49: 567–581.
3. Falt S, Holmberg K, Lambert B, Wennborg A (2003) Long-term global gene
expression patterns in irradiated human lymphocytes. Carcinogenesis 24: 1837–
1845.
4. Amundson SA, Do KT, Shahab S, Bittner M, Meltzer P, et al. (2000)
Identification of potential mRNA biomarkers in peripheral blood lymphocytes
for human exposure to ionizing radiation. Radiat Res 154: 342–346.
5. Turtoi A, Sharan RN, Srivastava A, Schneeweiss FH (2010) Proteomic and
genomic modulations induced by gamma-irradiation of human blood lympho-
cytes. Int J Radiat Biol 86: 888–904.
6. Kabacik S, Mackay A, Tamber N, Manning G, Finnon P, et al. (2011) Gene
expression following ionising radiation: identification of biomarkers for dose
estimation and prediction of individual response. Int J Radiat Biol 87: 115–129.
7. Amundson SA, Grace MB, McLeland CB, Epperly MW, Yeager A, et al. (2004)
Human in vivo radiation-induced biomarkers: gene expression changes in
radiotherapy patients. Cancer Res 64: 6368–6371.
8. Kang CM, Park KP, Song JE, Jeoung DI, Cho CK, et al. (2003) Possible
biomarkers for ionizing radiation exposure in human peripheral blood
lymphocytes. Radiat Res 159: 312–319.
9. Dressman HK, Muramoto GG, Chao NJ, Meadows S, Marshall D, et al. (2007)
Gene expression signatures that predict radiation exposure in mice and humans.
PLoS Med 4: e106.
10. Paul S, Amundson SA (2008) Development of gene expression signatures for
practical radiation biodosimetry. Int J Radiat Oncol Biol Phys 71: 1236–1244.
11. Daino K, Ichimura S, Nenoi M (2002) Early induction of CDKN1A (p21) and
GADD45 mRNA by a low dose of ionizing radiation is due to their dose-
dependent post-transcriptional regulation. Radiat Res 157: 478–482.
12. Paul S, Barker CA, Turner HC, McLane A, Wolden SL, et al. (2011) Prediction
of in vivo radiation dose status in radiotherapy patients using ex vivo and in vivo
gene expression signatures. Radiat res 175: 257–265.
13. Marchetti F, Coleman MA, Jones IM, Wyrobek AJ (2006) Candidate protein
biodosimeters of human exposure to ionizing radiation. Int J Radiat Biol 82:
605–639.
14. Breen AP, Murphy JA (1995) Reactions of oxyl radicals with DNA. Free Radic
Biol Med 18: 1033–1077.
15. Inoue M, Shen GP, Chaudhry MA, Galick H, Blaisdell JO, et al. (2004)
Expression of the oxidative base excision repair enzymes is not induced in TK6
human lymphoblastoid cells after low doses of ionizing radiation. Radiat Res
161: 409–417.
16. Batty DP, Wood RD (2000) Damage recognition in nucleotide excision repair of
DNA. Gene 241: 193–204.
17. Bessho T (1999) Nucleotide excision repair 39 endonuclease XPG stimulates the
activity of base excision repairenzyme thymine glycol DNA glycosylase. Nucleic
Acids Res 27: 979–983.
18. Klungland A, Hoss M, Gunz D, Constantinou A, Clarkson SG, et al. (1999) Base
excision repair of oxidative DNA damage activated by XPG protein. Mol Cell 3:
33–42.
19. Shimizu Y, Uchimura Y, Dohmae N, Saitoh H, Hanaoka F, et al. (2010)
Stimulation of DNA Glycosylase Activities by XPC Protein Complex: Roles of
Protein-Protein Interactions. J Nucleic Acids 2010.
20. Shimizu Y, Iwai S, Hanaoka F, Sugasawa K (2003) Xeroderma pigmentosum
group C protein interacts physically and functionally with thymine DNA
glycosylase. EMBO J 22: 164–173.
21. D’Errico M, Parlanti E, Teson M, de Jesus BM, Degan P, et al. (2006) New
functions of XPC in the protection of human skin cells from oxidative damage.
EMBO J 25: 4305–4315.
22. Zschenker O, Borgmann K, Streichert T, Meier I, Wrona A, et al. (2006)
Lymphoblastoid cell lines differing in p53 status show clear differences in basal
gene expression with minor changes after irradiation. Radiother Oncol 80: 236–
249.
23. Mayer C, Popanda O, Greve B, Fritz E, Illig T, et al. (2011) A radiation-induced
gene expression signature as a tool to predict acute radiotherapy-induced
adverse side effects. Cancer Lett 302: 20–28.
24. Amundson SA, Do KT, Fornace AJ Jr (1999) Induction of stress genes by low
doses of gamma rays. Radiat Res 152: 225–231.
25. Brengues M, Paap B, Bittner M, Amundson S, Seligmann B, et al. (2010)
Biodosimetry on small blood volume using gene expression assay. Health Phys
98: 179–185.
26. Tichy A, Zaskodova D, Rezacova M, Vavrova J, Vokurkova D, et al. (2007)
Gamma-radiation-induced ATM-dependent signalling in human T-lymphocyte
leukemic cells, MOLT-4. Acta biochimica Polonica 54: 281–287.
27. Wang S, Guo M, Ouyang H, Li X, Cordon-Cardo C, et al. (2000) The catalytic
subunit of DNA-dependent protein kinase selectively regulates p53-dependent
apoptosis but not cell-cycle arrest. Proceedings of the National Academy of
Sciences of the United States of America 97: 1584–1588.
28. Zhang Y, Lim CU, Zhou J, Liber HH (2007) The effects of NBS1 knockdown by
small interfering RNA on the ionizing radiation-induced apoptosis in human
lymphoblastoid cells with different p53 status. Toxicology letters 171: 50–59.
29. Paul S, Amundson SA (2011) Gene expression signatures of radiation exposure
in peripheral white blood cells of smokers and non-smokers. Int J Radiat Biol 87:
791–801.
30. Tucker JD, Grever WE, Joiner MC, Konski AA, Thomas RA, et al. (2012) Gene
expression-based detection of radiation exposure in mice after treatment with
granulocyte colony-stimulating factor and lipopolysaccharide. Radiat res 177:
209–219.
31. Guha M, Mackman N (2001) LPS induction of gene expression in human
monocytes. Cell Signal 13: 85–94.
32. Lavnikova N, Laskin DL (1995) Unique patterns of regulation of nitric oxide
production in fibroblasts. J Leukoc Biol 58: 451–458.
33. Schroeder A, Mueller O, Stocker S, Salowsky R, Leiber M, et al. (2006) The
RIN: an RNA integrity number for assigning integrity values to RNA
measurements. BMC Mol Biol 7: 3.
34. Quinlan JR (1986) Induction of decision trees. Machine Learning 1: 81–106.
35. Meadows SK, Dressman HK, Muramoto GG, Himburg H, Salter A, et al.
(2008) Gene expression signatures of radiation response are specific, durable and
accurate in mice and humans. PloS one 3: e1912.
36. Ahn JY, Schwarz JK, Piwnica-Worms H, Canman CE (2000) Threonine 68
phosphorylation by ataxia telangiectasia mutated is required for efficient
activation of Chk2 in response to ionizing radiation. Cancer Res 60: 5934–5936.
37. Amundson SA, Patterson A, Do KT, Fornace AJ Jr (2002) A nucleotide excision
repair master-switch: p53 regulated coordinate induction of global genomic
repair genes. Cancer biology & therapy 1: 145–149.
38. Zhang XP, Liu F, Wang W (2011) Two-phase dynamics of p53 in the DNA
damage response. Proceedings of the National Academy of Sciences of the
United States of America 108: 8990–8995.
39. Antoni L, Sodha N, Collins I, Garrett MD (2007) CHK2 kinase: cancer
susceptibility and cancer therapy - two sides of the same coin? Nature reviews
Cancer 7: 925–936.
40. Zhivotovsky B, Kroemer G (2004) Apoptosis and genomic instability. Nature
reviews Molecular cell biology 5: 752–762.
Blood Biomarkers of Radiation Exposure and Stress
PLOS ONE | www.plosone.org 11 November 2012 | Volume 7 | Issue 11 | e48619
41. Hirao A, Kong YY, Matsuoka S, Wakeham A, Ruland J, et al. (2000) DNA
damage-induced activation of p53 by the checkpoint kinase Chk2. Science 287:1824–1827.
42. Li MJ, Wang WW, Chen SW, Shen Q, Min R (2011) Radiation dose effect of
DNA repair-related gene expression in mouse white blood cells. Medical sciencemonitor : international medical journal of experimental and clinical research 17:
BR290–297.43. Russell JS, Brady K, Burgan WE, Cerra MA, Oswald KA, et al. (2003) Gleevec-
mediated inhibition of Rad51 expression and enhancement of tumor cell
radiosensitivity. Cancer Res 63: 7377–7383.44. Ring RH, Valo Z, Gao C, Barish ME, Singer-Sam J (2003) The Cdkn1a gene
(p21Waf1/Cip1) is an inflammatory response gene in the mouse central nervoussystem. Neurosci Lett 350: 73–76.
45. Eslick J, Scatizzi JC, Albee L, Bickel E, Bradley K, et al. (2004) IL-4 and IL-10
inhibition of spontaneous monocyte apoptosis is associated with Flip upregula-
tion. Inflammation 28: 139–145.
46. Han J, Flemington C, Houghton AB, Gu Z, Zambetti GP, et al. (2001)
Expression of bbc3, a pro-apoptotic BH3-only gene, is regulated by diverse cell
death and survival signals. Proceedings of the National Academy of Sciences of
the United States of America 98: 11318–11323.
47. Riecke A, Rufa CG, Cordes M, Hartmann J, Meineke V, et al. (2012) Gene
expression comparisons performed for biodosimetry purposes on in vitro
peripheral blood cellular subsets and irradiated individuals. Radiat res 178:
234–243.
Blood Biomarkers of Radiation Exposure and Stress
PLOS ONE | www.plosone.org 12 November 2012 | Volume 7 | Issue 11 | e48619