dnatribes - evidence for early migrations to europe from west asia and siberia
DESCRIPTION
Lookout for the South Asian componentTRANSCRIPT
DNA Tribes® Digest January 2, 2013
All contents © 2006-2013 DNA Tribes. DNA Tribes®. DNA Tribes patented analysis is available exclusively from DNA Tribes. U.S. PAT. NO. 8,285,486. All rights reserved.
DNA Tribes® Digest January 2, 2013 Page 1 of 12
Web: www.dnatribes.com; Email: [email protected]; Facebook: facebook.com/DNAtribes Mail: DNA Tribes, P.O. Box 735, Arlington, VA 22216
DNA Tribes® Digest January 2, 2013 Copyright © 2013 DNA Tribes®. All rights reserved. To request an email subscription to DNA Tribes® Digest, email [email protected] with the subject heading “Subscribe.” To unsubscribe from DNA Tribes® Digest, email [email protected] with the subject heading “Unsubscribe.” Previous issues of DNA Tribes® Digest are available online at http://dnatribes.com/library.html.
Table of Contents:
Introduction ..................................................................................................................................... 1 Evidence for Early Migrations to Europe from West Asia and Siberia (STR) ............................... 2
Background ............................................................................................................................. 2 Genetic Analysis ..................................................................................................................... 3
Getting the Most from Your STR Testing .................................................................................... 11
Introduction
Hello, and welcome to the January 2013 issue of DNA Tribes® Digest. This month’s feature article will explore genetic evidence for the origins of European populations, based on a detailed comparison to neighboring world regions using autosomal STR data.
In particular, this analysis will explore evidence for early migrations to Europe from West Asia (including Anatolia and the East Mediterranean) and Siberia (including early relatives of Native Americans). The background section highlights the possible role of mixed populations that emerged near the Balkan Peninsula during the Neolithic period, which might have included early speakers of the Indo-European languages that later spread throughout Europe.
This article also explores localized genetic links with North Africa and Western South Asia in some parts of Europe. These might relate to more specific population movements, such as Proto-Celtic migrations to Western Europe.
Best regards and Happy New Year, Lucas Martin DNA Tribes
DNA Tribes® is on Facebook. Find us at http://facebook.com/DNAtribes
DNA Tribes® Digest January 2, 2013
All contents © 2006-2013 DNA Tribes. DNA Tribes®. DNA Tribes patented analysis is available exclusively from DNA Tribes. U.S. PAT. NO. 8,285,486. All rights reserved.
DNA Tribes® Digest January 2, 2013 Page 2 of 12
Web: www.dnatribes.com; Email: [email protected]; Facebook: facebook.com/DNAtribes Mail: DNA Tribes, P.O. Box 735, Arlington, VA 22216
Evidence for Early Migrations to Europe from West Asia and Siberia (STR)
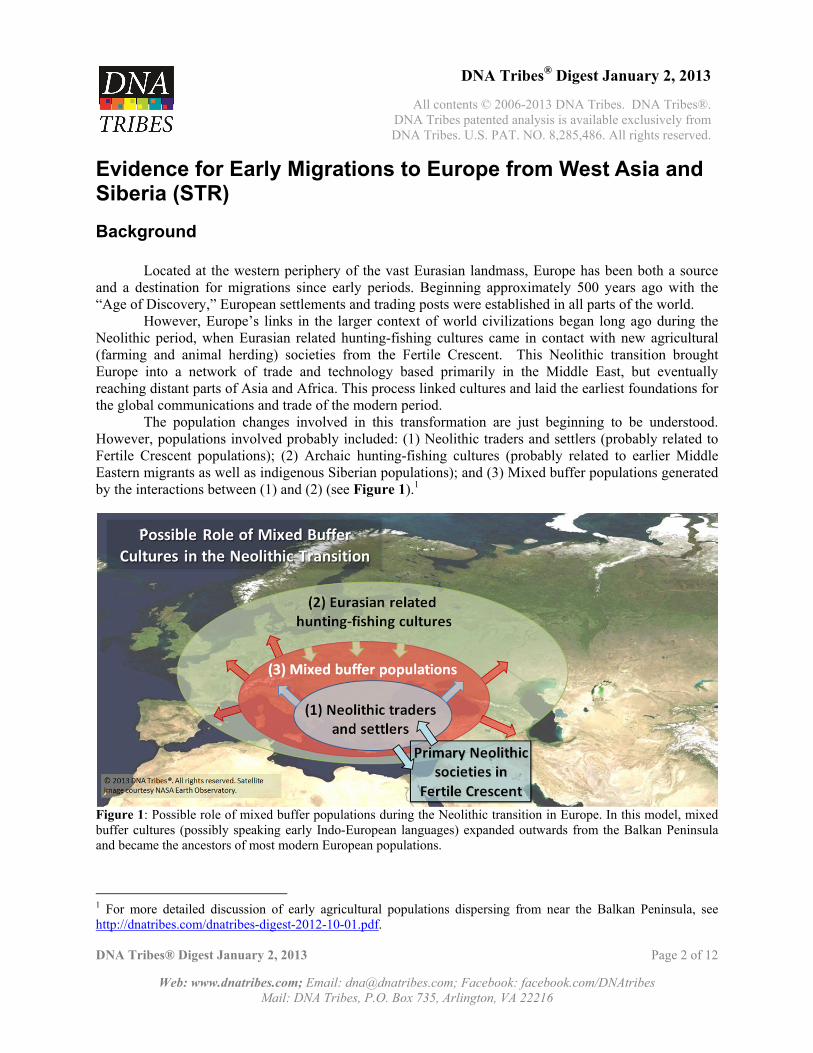
Background Located at the western periphery of the vast Eurasian landmass, Europe has been both a source and a destination for migrations since early periods. Beginning approximately 500 years ago with the “Age of Discovery,” European settlements and trading posts were established in all parts of the world. However, Europe’s links in the larger context of world civilizations began long ago during the Neolithic period, when Eurasian related hunting-fishing cultures came in contact with new agricultural (farming and animal herding) societies from the Fertile Crescent. This Neolithic transition brought Europe into a network of trade and technology based primarily in the Middle East, but eventually reaching distant parts of Asia and Africa. This process linked cultures and laid the earliest foundations for the global communications and trade of the modern period. The population changes involved in this transformation are just beginning to be understood. However, populations involved probably included: (1) Neolithic traders and settlers (probably related to Fertile Crescent populations); (2) Archaic hunting-fishing cultures (probably related to earlier Middle Eastern migrants as well as indigenous Siberian populations); and (3) Mixed buffer populations generated by the interactions between (1) and (2) (see Figure 1).1
Figure 1: Possible role of mixed buffer populations during the Neolithic transition in Europe. In this model, mixed buffer cultures (possibly speaking early Indo-European languages) expanded outwards from the Balkan Peninsula and became the ancestors of most modern European populations.
1 For more detailed discussion of early agricultural populations dispersing from near the Balkan Peninsula, see http://dnatribes.com/dnatribes-digest-2012-10-01.pdf.
DNA Tribes® Digest January 2, 2013
All contents © 2006-2013 DNA Tribes. DNA Tribes®. DNA Tribes patented analysis is available exclusively from DNA Tribes. U.S. PAT. NO. 8,285,486. All rights reserved.
DNA Tribes® Digest January 2, 2013 Page 3 of 12
Web: www.dnatribes.com; Email: [email protected]; Facebook: facebook.com/DNAtribes Mail: DNA Tribes, P.O. Box 735, Arlington, VA 22216
These mixed buffer populations2 would have bridged two very different worlds during this period of transition. Frontier settlements would have attracted individuals from European hunting-fishing cultures who were interested in peaceful interactions with incoming Neolithic populations. This would have created a fertile setting for new technologies and social forms to emerge (possibly including the early Indo-European languages). To provide a modern analogy, this dynamic process of cultural mixing in Neolithic Europe might have been similar to the formation of Spanish speaking Mestizo cultures throughout Latin America in the past 500 years.3 These mixed cultures might have been among the first predecessors of most extant European populations, descended from both archaic hunting-fishing populations and Neolithic populations of the Fertile Crescent. These buffer cultures would have first emerged near the Balkan Peninsula, and later expanded and/or migrated outside of Southeastern Europe.4 This process of cultural integration and innovation, followed by expansions outwards into Northern Europe continued in many waves throughout prehistory. For instance, the Bronze Age Hittite Empire of Anatolia was a cosmopolitan trade hub integrating Indo-European (Luwian and Hittite) cultures with Hattian, Hurrian, and Akkadian societies of West Asia.5 In the subsequent Iron Age, specialists from the Neo-Hittite states of West Asia were highly valued in the Greek and Etruscan worlds, bringing new technologies, craft specializations, and ideas when they settled in emerging European societies.6 In turn, the Orientalized cultures of Greece and Italy influenced cultures in more distant parts of Europe. To explore genetic evidence for these early processes, this article will use autosomal STR data to perform a detailed comparison of European populations to neighboring regions of Asia and Africa (see Figure 2). This will include both world genetic regions used in DNA Tribes® 15, 21, and 27 Marker Kit tests, as well as several more locally specific parts of West Asia and South Asia.
Genetic Analysis
To identify source regions for early migrations to Europe, the non-European genetic components
of European sub-regions and several ethnic populations were identified using autosomal STR data (excluding local admixture from European regions and populations).
2 See http://dnatribes.com/dnatribes-digest-2012-10-01.pdf; http://dnatribes.com/dnatribes-digest-2012-07-01.pdf. For an example of buffer populations mediating relations between center and periphery in Europe during the Iron Age, see Europe Before History by Kristian Kristiansen, p. 218. 3 In modern Mestizo populations of Latin America, the combination of European Y-DNA paternal lineages and Native American mtDNA maternal lineages is frequent. Similarly, the combination of West Asian paternal lineages (such as R1b) and archaic European maternal lineages (such as U5) has been identified in early Bell-Beaker sites of Western Europe (see http://onlinelibrary.wiley.com/doi/10.1002/ajpa.22074/abstract). 4 Marija Gimbutas noted similarities between Bell Beaker cultures and early sites near the Black Sea and Jericho; this suggests that migrating groups of these mixed European cultures might have been active in the Neolithic heartland of the Fertile Crescent. See The Kurgan Culture and the Indo-Europeanization of Europe pp. 107-109. If so, some of the earliest “Indo-Europeans” might have spoken Hurrian or Afro-Asiatic languages during their travels. 5 It is noteworthy that Hittite treaties made use of Sanskrit like vocabulary, suggesting an international role for Indic cultural concepts during the Bronze Age (possibly linked to lucrative Central Asian trade routes). 6 See The Orientalizing Revolution: Near Eastern Influence on Greek Culture in the Early Archaic Age by Walter Burkert. For instance, Odyssey 17.383-385 describes skilled “public workers” (demioergoi), who are “welcome all the world over.” Many of these migratory specialists were of Luwian, Aramaean, or Phoenician origins.
DNA Tribes® Digest January 2, 2013
All contents © 2006-2013 DNA Tribes. DNA Tribes®. DNA Tribes patented analysis is available exclusively from DNA Tribes. U.S. PAT. NO. 8,285,486. All rights reserved.
DNA Tribes® Digest January 2, 2013 Page 4 of 12
Web: www.dnatribes.com; Email: [email protected]; Facebook: facebook.com/DNAtribes Mail: DNA Tribes, P.O. Box 735, Arlington, VA 22216
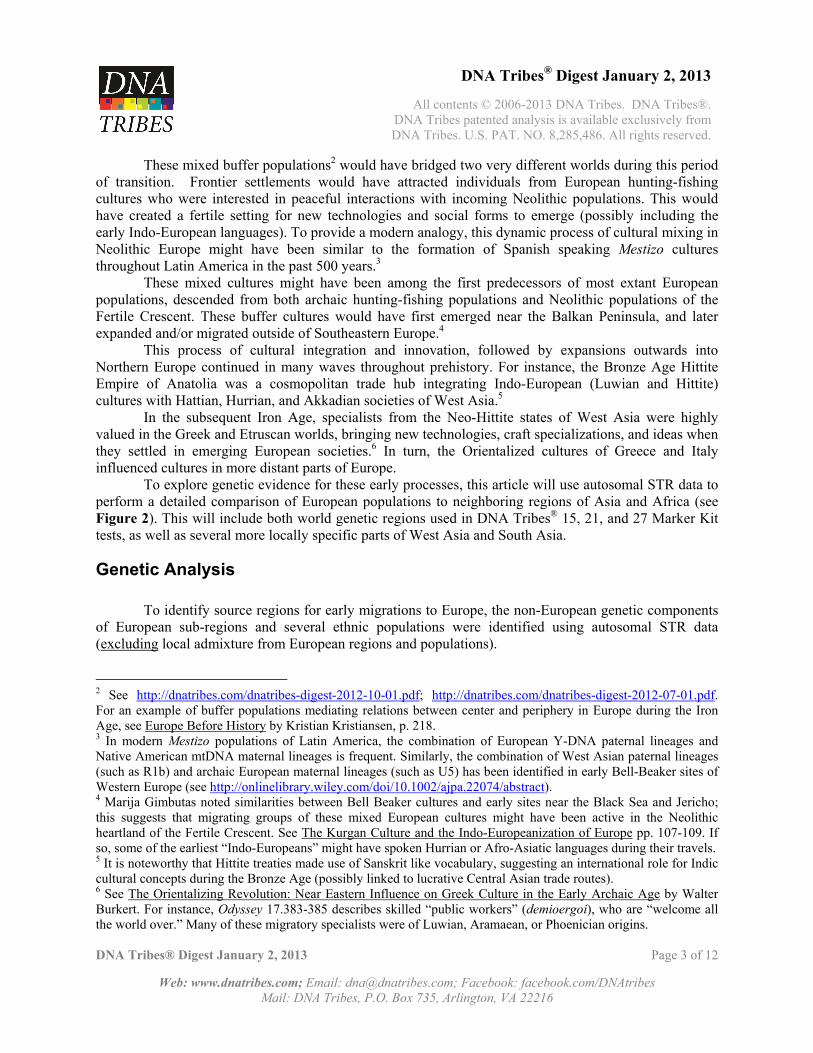
The source regions included in this analysis included both world genetic regions used in DNA Tribes® 15, 21, and 27 Marker Kit tests,7 as well as several additional more specific regions of West Asia and South Asia (see Figure 2). Results are summarized in Table 1 and illustrated in Figure 3.
Figure 2: Map of potential source regions for early migrations into Europe. Populations associated with each region are listed in italics.
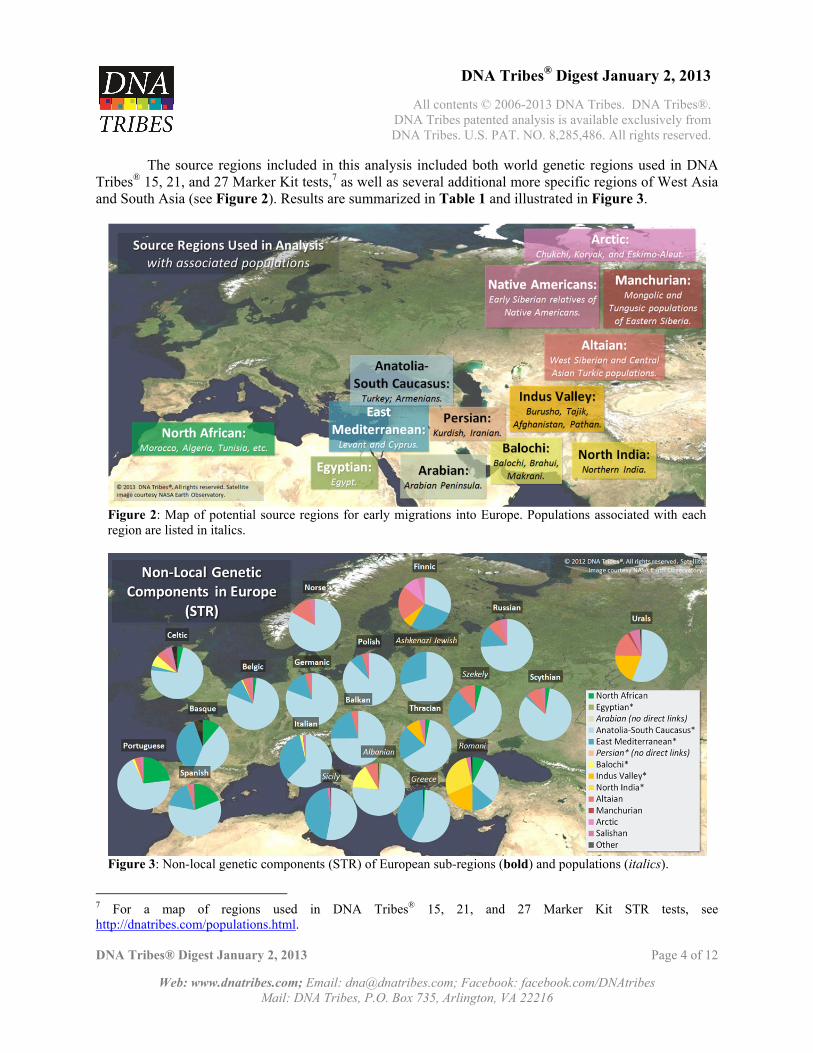
Figure 3: Non-local genetic components (STR) of European sub-regions (bold) and populations (italics).
7 For a map of regions used in DNA Tribes® 15, 21, and 27 Marker Kit STR tests, see http://dnatribes.com/populations.html.
DNA Tribes® Digest January 2, 2013
All contents © 2006-2013 DNA Tribes. DNA Tribes®. DNA Tribes patented analysis is available exclusively from DNA Tribes. U.S. PAT. NO. 8,285,486. All rights reserved.
DNA Tribes® Digest January 2, 2013 Page 5 of 12
Web: www.dnatribes.com; Email: [email protected]; Facebook: facebook.com/DNAtribes Mail: DNA Tribes, P.O. Box 735, Arlington, VA 22216
Sub‐Region or Population
North African
Egypt‐ian *
Arabian (no direct links)
East Mediterr‐anean *
Anatolia‐South
Caucasus*
Persian* (no direct links)
Balochi*
Indus Valley
*
North India*
Altaian Manchu‐rian Arctic Salish‐
‐an Other
Polish 0.0% 0.0% 0.0% 7.9% 87.6% 0.0% 0.0% 0.0% 0.0% 2.8% 0.0% 0.0% 1.7% 0.0%
Scythian 2.7% 0.0% 0.0% 1.3% 84.0% 0.0% 0.0% 0.0% 0.0% 9.6% 0.0% 0.0% 2.4% 0.0%
Norse 0.0% 0.0% 0.0% 0.0% 83.1% 0.0% 0.0% 0.0% 0.0% 13.3% 0.0% 0.0% 3.6% 0.0%
Germanic 0.0% 0.0% 0.0% 14.7% 80.8% 0.0% 0.0% 0.0% 0.0% 3.1% 0.0% 0.0% 1.4% 0.0%
Belgic 2.2% 0.0% 0.0% 11.2% 79.2% 0.0% 1.0% 0.0% 0.0% 4.0% 0.0% 0.0% 2.4% 0.0%
Balkan 0.0% 0.0% 0.0% 20.9% 74.8% 0.0% 0.0% 0.0% 0.0% 4.1% 0.0% 0.0% 0.3% 0.0%
Albanian 0.0% 1.6% 0.0% 0.0% 74.7% 0.0% 15.3% 0.0% 0.0% 7.9% 0.0% 0.0% 0.0% 0.4%
Russian 0.0% 0.0% 0.0% 13.6% 74.1% 0.0% 0.0% 0.0% 0.0% 7.8% 0.0% 0.0% 4.5% 0.0%
Celtic 3.7% 0.0% 0.0% 2.7% 72.9% 0.0% 7.1% 0.0% 0.0% 4.6% 0.0% 0.0% 5.5% 3.4%
Ashkenazi Jewish 0.0% 0.0% 0.0% 29.2% 70.8% 0.0% 0.0% 0.0% 0.0% 0.0% 0.0% 0.0% 0.0% 0.0%
Portuguese 23.1% 0.0% 0.0% 0.0% 69.5% 0.0% 1.8% 0.0% 0.0% 2.8% 0.0% 0.0% 2.7% 0.0%
Thracian 2.9% 0.0% 0.0% 21.3% 63.2% 0.0% 0.0% 9.1% 0.0% 0.0% 0.0% 0.0% 3.5% 0.0%
Italian 0.0% 0.0% 0.0% 33.9% 62.5% 0.0% 1.7% 0.0% 0.0% 0.6% 0.0% 0.0% 1.4% 0.0%
Szekely 4.1% 0.0% 0.0% 23.6% 61.3% 0.0% 0.0% 0.0% 0.0% 11.0% 0.0% 0.0% 0.0% 0.0%
Spanish 18.9% 0.0% 0.0% 17.3% 59.2% 0.0% 0.1% 0.0% 0.0% 2.0% 0.0% 0.0% 2.2% 0.3%
Greece 0.8% 0.0% 0.0% 41.7% 57.0% 0.0% 0.0% 0.0% 0.0% 0.0% 0.0% 0.0% 0.0% 0.5%
Urals 0.0% 0.0% 0.0% 0.0% 55.8% 0.0% 0.0% 19.4% 0.0% 15.7% 1.7% 0.0% 6.5% 0.8%
Sicily 0.0% 0.0% 0.0% 44.6% 53.0% 0.0% 0.0% 0.0% 0.0% 0.0% 0.0% 0.0% 2.0% 0.4%
Basque 11.0% 0.0% 0.0% 38.2% 45.2% 0.0% 0.0% 0.0% 0.0% 0.2% 0.0% 0.0% 0.0% 5.4%
Finnic 0.0% 0.0% 0.0% 27.6% 31.0% 0.0% 0.0% 6.3% 0.0% 21.1% 0.0% 9.7% 4.3% 0.0%
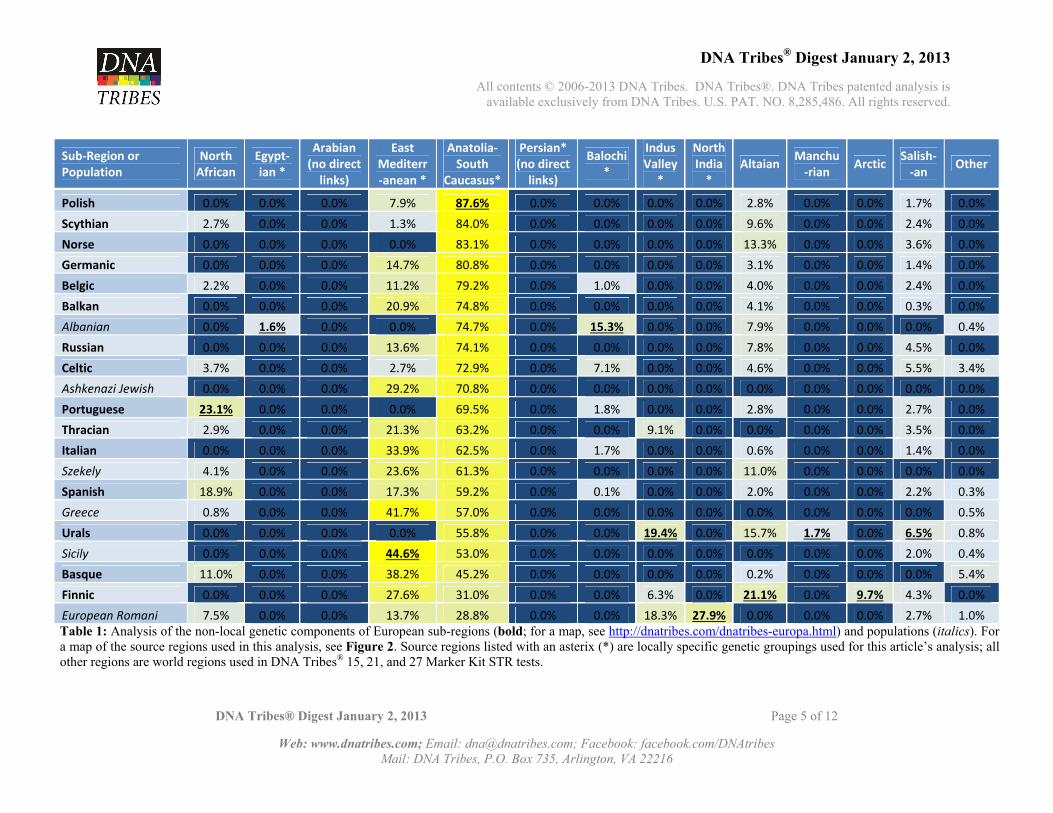
European Romani 7.5% 0.0% 0.0% 13.7% 28.8% 0.0% 0.0% 18.3% 27.9% 0.0% 0.0% 0.0% 2.7% 1.0% Table 1: Analysis of the non-local genetic components of European sub-regions (bold; for a map, see http://dnatribes.com/dnatribes-europa.html) and populations (italics). For a map of the source regions used in this analysis, see Figure 2. Source regions listed with an asterix (*) are locally specific genetic groupings used for this article’s analysis; all other regions are world regions used in DNA Tribes® 15, 21, and 27 Marker Kit STR tests.
DNA Tribes® Digest January 2, 2013
All contents © 2006-2013 DNA Tribes. DNA Tribes®. DNA Tribes patented analysis is available exclusively from DNA Tribes. U.S. PAT. NO. 8,285,486. All rights reserved.
DNA Tribes® Digest January 2, 2013 Page 6 of 12
Web: www.dnatribes.com; Email: [email protected]; Facebook: facebook.com/DNAtribes Mail: DNA Tribes, P.O. Box 735, Arlington, VA 22216
Discussion: Results in Table 1 indicate both major and minor migration sources in Europe (see Tables 2-3 and Figures 4-5). Major migration sources are identified for most European sub-regions and populations; minor migration sources are identified only for some European sub-regions or populations.
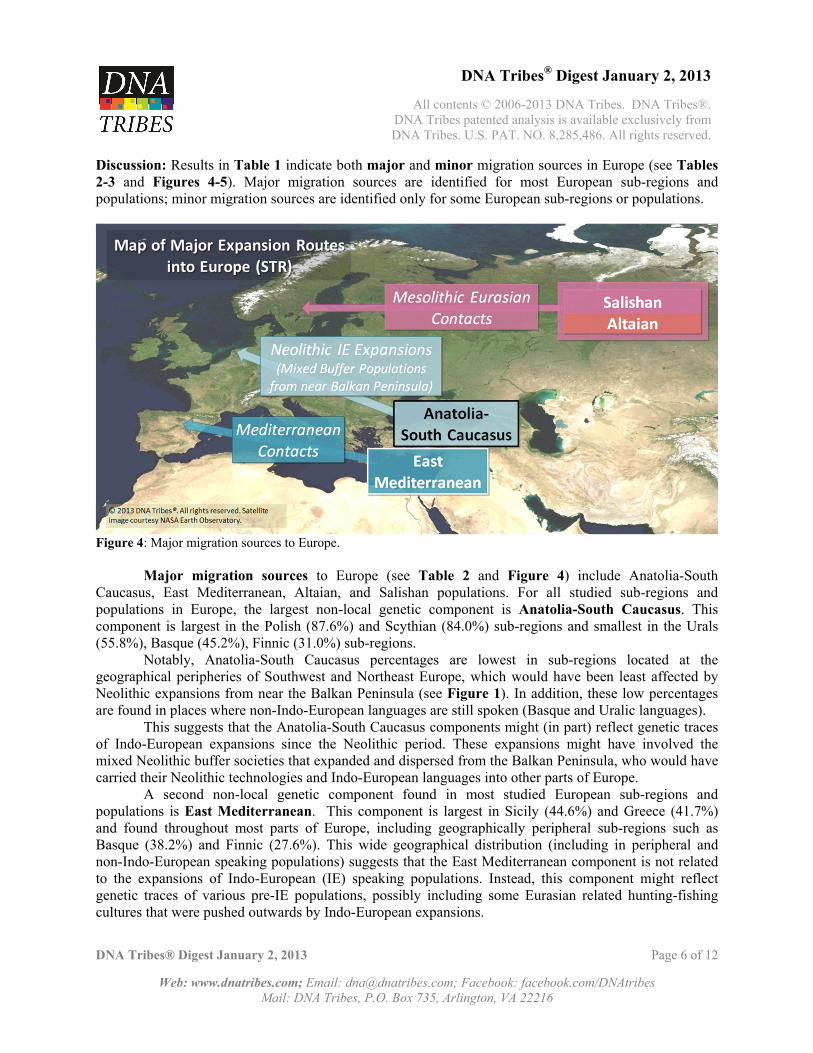
Figure 4: Major migration sources to Europe.
Major migration sources to Europe (see Table 2 and Figure 4) include Anatolia-South Caucasus, East Mediterranean, Altaian, and Salishan populations. For all studied sub-regions and populations in Europe, the largest non-local genetic component is Anatolia-South Caucasus. This component is largest in the Polish (87.6%) and Scythian (84.0%) sub-regions and smallest in the Urals (55.8%), Basque (45.2%), Finnic (31.0%) sub-regions.
Notably, Anatolia-South Caucasus percentages are lowest in sub-regions located at the geographical peripheries of Southwest and Northeast Europe, which would have been least affected by Neolithic expansions from near the Balkan Peninsula (see Figure 1). In addition, these low percentages are found in places where non-Indo-European languages are still spoken (Basque and Uralic languages).
This suggests that the Anatolia-South Caucasus components might (in part) reflect genetic traces of Indo-European expansions since the Neolithic period. These expansions might have involved the mixed Neolithic buffer societies that expanded and dispersed from the Balkan Peninsula, who would have carried their Neolithic technologies and Indo-European languages into other parts of Europe.
A second non-local genetic component found in most studied European sub-regions and populations is East Mediterranean. This component is largest in Sicily (44.6%) and Greece (41.7%) and found throughout most parts of Europe, including geographically peripheral sub-regions such as Basque (38.2%) and Finnic (27.6%). This wide geographical distribution (including in peripheral and non-Indo-European speaking populations) suggests that the East Mediterranean component is not related to the expansions of Indo-European (IE) speaking populations. Instead, this component might reflect genetic traces of various pre-IE populations, possibly including some Eurasian related hunting-fishing cultures that were pushed outwards by Indo-European expansions.
DNA Tribes® Digest January 2, 2013
All contents © 2006-2013 DNA Tribes. DNA Tribes®. DNA Tribes patented analysis is available exclusively from DNA Tribes. U.S. PAT. NO. 8,285,486. All rights reserved.
DNA Tribes® Digest January 2, 2013 Page 7 of 12
Web: www.dnatribes.com; Email: [email protected]; Facebook: facebook.com/DNAtribes Mail: DNA Tribes, P.O. Box 735, Arlington, VA 22216
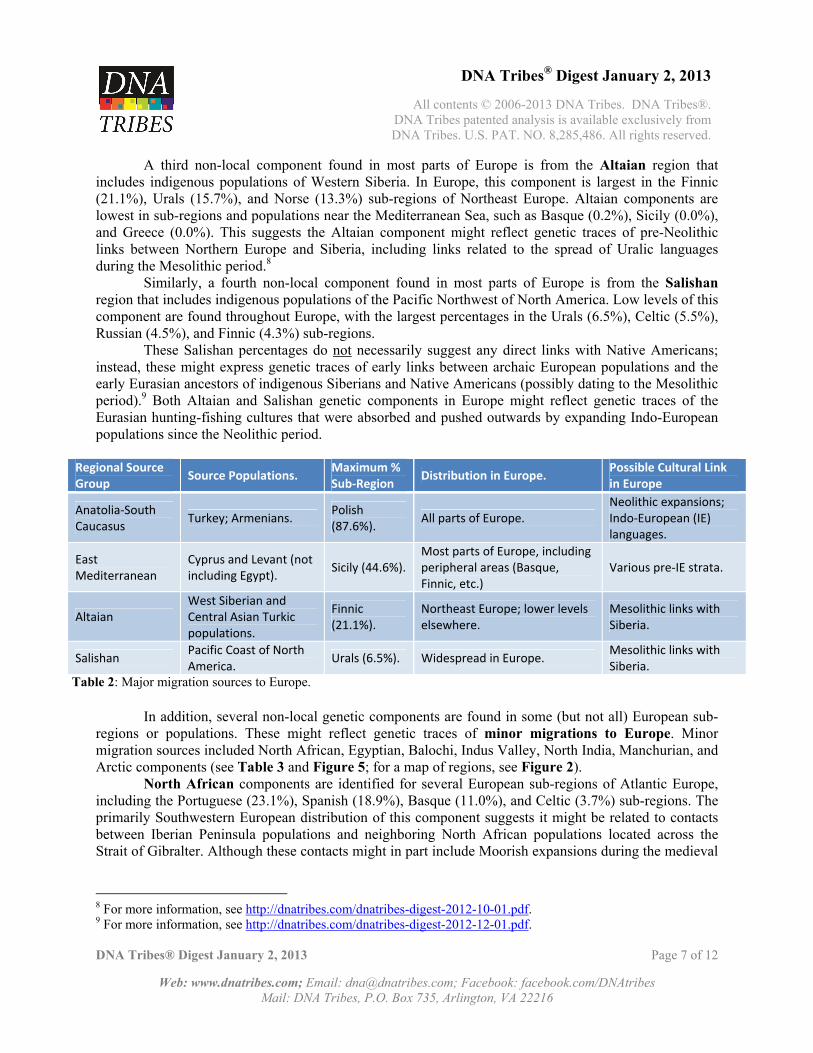
A third non-local component found in most parts of Europe is from the Altaian region that includes indigenous populations of Western Siberia. In Europe, this component is largest in the Finnic (21.1%), Urals (15.7%), and Norse (13.3%) sub-regions of Northeast Europe. Altaian components are lowest in sub-regions and populations near the Mediterranean Sea, such as Basque (0.2%), Sicily (0.0%), and Greece (0.0%). This suggests the Altaian component might reflect genetic traces of pre-Neolithic links between Northern Europe and Siberia, including links related to the spread of Uralic languages during the Mesolithic period.8
Similarly, a fourth non-local component found in most parts of Europe is from the Salishan region that includes indigenous populations of the Pacific Northwest of North America. Low levels of this component are found throughout Europe, with the largest percentages in the Urals (6.5%), Celtic (5.5%), Russian (4.5%), and Finnic (4.3%) sub-regions.
These Salishan percentages do not necessarily suggest any direct links with Native Americans; instead, these might express genetic traces of early links between archaic European populations and the early Eurasian ancestors of indigenous Siberians and Native Americans (possibly dating to the Mesolithic period).9 Both Altaian and Salishan genetic components in Europe might reflect genetic traces of the Eurasian hunting-fishing cultures that were absorbed and pushed outwards by expanding Indo-European populations since the Neolithic period.
Regional Source Group Source Populations. Maximum %
Sub‐Region Distribution in Europe. Possible Cultural Link in Europe
Anatolia‐South Caucasus
Turkey; Armenians. Polish (87.6%).
All parts of Europe. Neolithic expansions; Indo‐European (IE) languages.
East Mediterranean
Cyprus and Levant (not including Egypt).
Sicily (44.6%). Most parts of Europe, including peripheral areas (Basque, Finnic, etc.)
Various pre‐IE strata.
Altaian West Siberian and Central Asian Turkic populations.
Finnic (21.1%).
Northeast Europe; lower levels elsewhere.
Mesolithic links with Siberia.
Salishan Pacific Coast of North America.
Urals (6.5%). Widespread in Europe. Mesolithic links with Siberia.
Table 2: Major migration sources to Europe.
In addition, several non-local genetic components are found in some (but not all) European sub-regions or populations. These might reflect genetic traces of minor migrations to Europe. Minor migration sources included North African, Egyptian, Balochi, Indus Valley, North India, Manchurian, and Arctic components (see Table 3 and Figure 5; for a map of regions, see Figure 2).
North African components are identified for several European sub-regions of Atlantic Europe, including the Portuguese (23.1%), Spanish (18.9%), Basque (11.0%), and Celtic (3.7%) sub-regions. The primarily Southwestern European distribution of this component suggests it might be related to contacts between Iberian Peninsula populations and neighboring North African populations located across the Strait of Gibralter. Although these contacts might in part include Moorish expansions during the medieval
8 For more information, see http://dnatribes.com/dnatribes-digest-2012-10-01.pdf. 9 For more information, see http://dnatribes.com/dnatribes-digest-2012-12-01.pdf.
DNA Tribes® Digest January 2, 2013
All contents © 2006-2013 DNA Tribes. DNA Tribes®. DNA Tribes patented analysis is available exclusively from DNA Tribes. U.S. PAT. NO. 8,285,486. All rights reserved.
DNA Tribes® Digest January 2, 2013 Page 8 of 12
Web: www.dnatribes.com; Email: [email protected]; Facebook: facebook.com/DNAtribes Mail: DNA Tribes, P.O. Box 735, Arlington, VA 22216
period, more ancient links between Iberian and North African populations are also suggested in the historical and archaeological records.10
Smaller North African percentages are also identified near the Balkan Peninsula, including European Romani (7.5%), Szekelys (4.1%), and the Thracian sub-region (2.9%). These might express either separate links between North Africa and Southeastern Europe,11 or else early links between the Iberian Peninsula and Balkan Peninsula.12
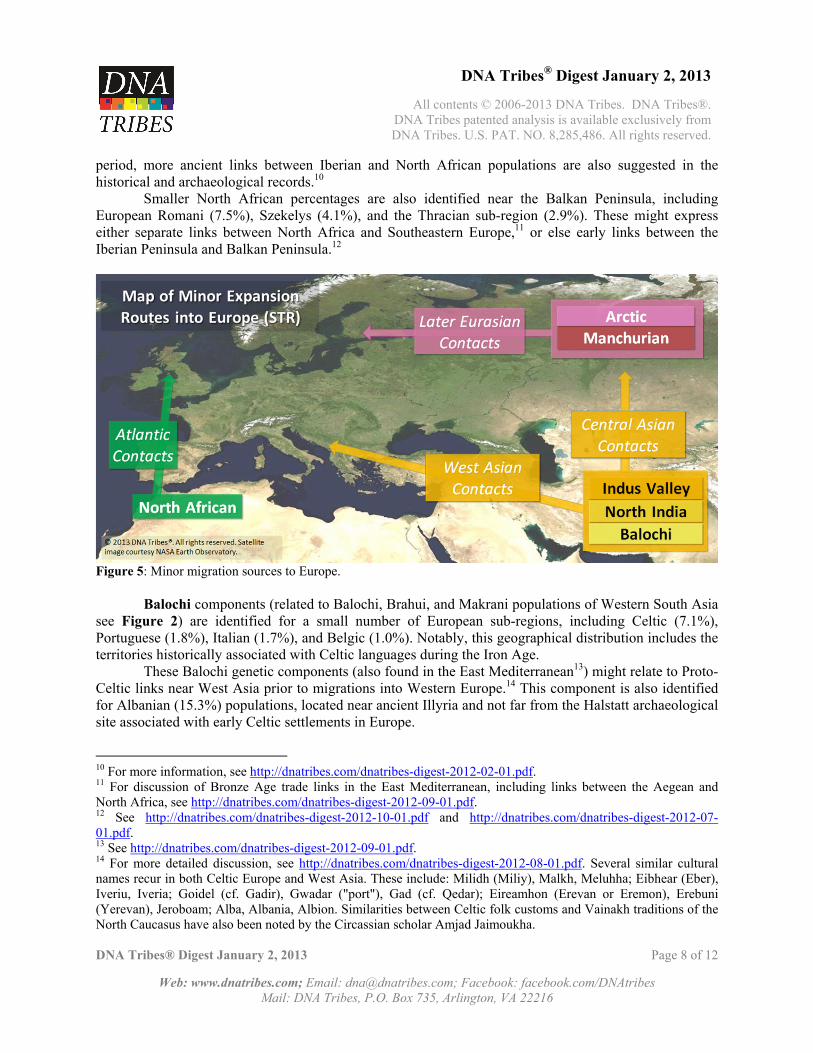
Figure 5: Minor migration sources to Europe.
Balochi components (related to Balochi, Brahui, and Makrani populations of Western South Asia see Figure 2) are identified for a small number of European sub-regions, including Celtic (7.1%), Portuguese (1.8%), Italian (1.7%), and Belgic (1.0%). Notably, this geographical distribution includes the territories historically associated with Celtic languages during the Iron Age.
These Balochi genetic components (also found in the East Mediterranean13) might relate to Proto-Celtic links near West Asia prior to migrations into Western Europe.14 This component is also identified for Albanian (15.3%) populations, located near ancient Illyria and not far from the Halstatt archaeological site associated with early Celtic settlements in Europe.
10 For more information, see http://dnatribes.com/dnatribes-digest-2012-02-01.pdf. 11 For discussion of Bronze Age trade links in the East Mediterranean, including links between the Aegean and North Africa, see http://dnatribes.com/dnatribes-digest-2012-09-01.pdf. 12 See http://dnatribes.com/dnatribes-digest-2012-10-01.pdf and http://dnatribes.com/dnatribes-digest-2012-07-01.pdf. 13 See http://dnatribes.com/dnatribes-digest-2012-09-01.pdf. 14 For more detailed discussion, see http://dnatribes.com/dnatribes-digest-2012-08-01.pdf. Several similar cultural names recur in both Celtic Europe and West Asia. These include: Milidh (Miliy), Malkh, Meluhha; Eibhear (Eber), Iveriu, Iveria; Goidel (cf. Gadir), Gwadar ("port"), Gad (cf. Qedar); Eireamhon (Erevan or Eremon), Erebuni (Yerevan), Jeroboam; Alba, Albania, Albion. Similarities between Celtic folk customs and Vainakh traditions of the North Caucasus have also been noted by the Circassian scholar Amjad Jaimoukha.
DNA Tribes® Digest January 2, 2013
All contents © 2006-2013 DNA Tribes. DNA Tribes®. DNA Tribes patented analysis is available exclusively from DNA Tribes. U.S. PAT. NO. 8,285,486. All rights reserved.
DNA Tribes® Digest January 2, 2013 Page 9 of 12
Web: www.dnatribes.com; Email: [email protected]; Facebook: facebook.com/DNAtribes Mail: DNA Tribes, P.O. Box 735, Arlington, VA 22216
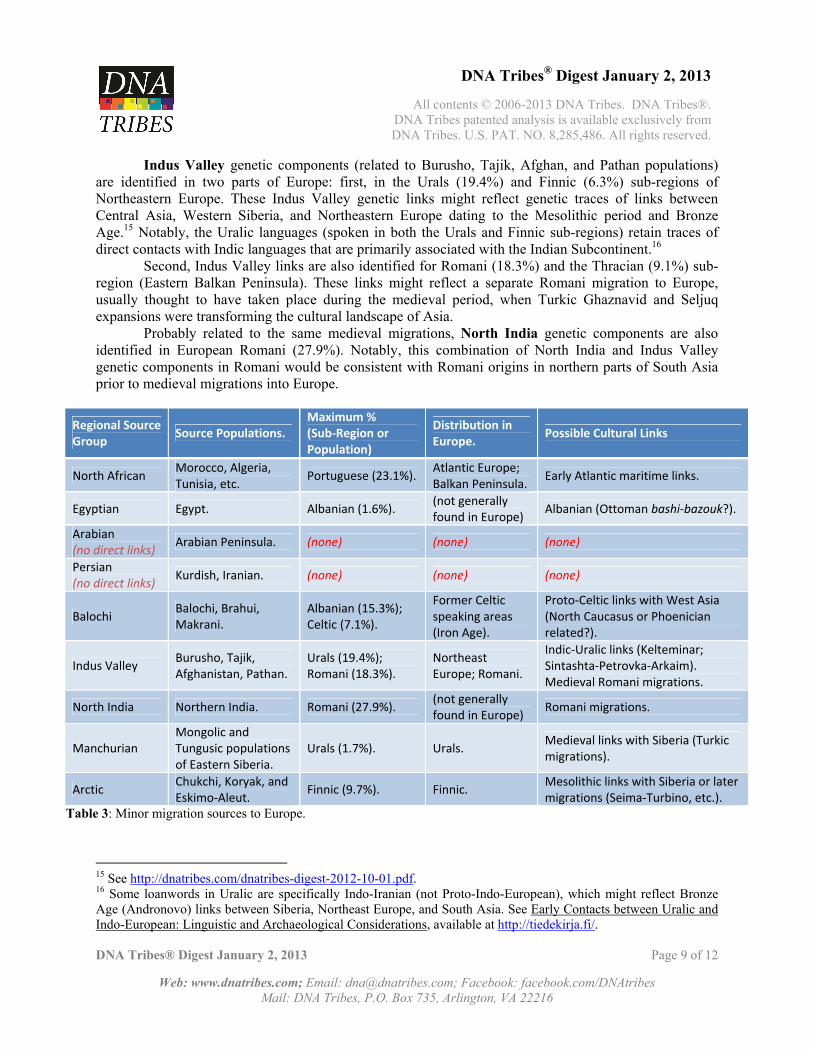
Indus Valley genetic components (related to Burusho, Tajik, Afghan, and Pathan populations) are identified in two parts of Europe: first, in the Urals (19.4%) and Finnic (6.3%) sub-regions of Northeastern Europe. These Indus Valley genetic links might reflect genetic traces of links between Central Asia, Western Siberia, and Northeastern Europe dating to the Mesolithic period and Bronze Age.15 Notably, the Uralic languages (spoken in both the Urals and Finnic sub-regions) retain traces of direct contacts with Indic languages that are primarily associated with the Indian Subcontinent.16
Second, Indus Valley links are also identified for Romani (18.3%) and the Thracian (9.1%) sub-region (Eastern Balkan Peninsula). These links might reflect a separate Romani migration to Europe, usually thought to have taken place during the medieval period, when Turkic Ghaznavid and Seljuq expansions were transforming the cultural landscape of Asia.
Probably related to the same medieval migrations, North India genetic components are also identified in European Romani (27.9%). Notably, this combination of North India and Indus Valley genetic components in Romani would be consistent with Romani origins in northern parts of South Asia prior to medieval migrations into Europe.
Regional Source Group Source Populations.
Maximum % (Sub‐Region or Population)
Distribution in Europe. Possible Cultural Links
North African Morocco, Algeria, Tunisia, etc.
Portuguese (23.1%). Atlantic Europe; Balkan Peninsula.
Early Atlantic maritime links.
Egyptian Egypt. Albanian (1.6%). (not generally found in Europe)
Albanian (Ottoman bashi‐bazouk?).
Arabian (no direct links) Arabian Peninsula. (none) (none) (none)
Persian (no direct links) Kurdish, Iranian. (none) (none) (none)
Balochi Balochi, Brahui, Makrani.
Albanian (15.3%); Celtic (7.1%).
Former Celtic speaking areas (Iron Age).
Proto‐Celtic links with West Asia (North Caucasus or Phoenician related?).
Indus Valley Burusho, Tajik, Afghanistan, Pathan.
Urals (19.4%); Romani (18.3%).
Northeast Europe; Romani.
Indic‐Uralic links (Kelteminar; Sintashta‐Petrovka‐Arkaim). Medieval Romani migrations.
North India Northern India. Romani (27.9%). (not generally found in Europe)
Romani migrations.
Manchurian Mongolic and Tungusic populations of Eastern Siberia.
Urals (1.7%). Urals. Medieval links with Siberia (Turkic migrations).
Arctic Chukchi, Koryak, and Eskimo‐Aleut.
Finnic (9.7%). Finnic. Mesolithic links with Siberia or later migrations (Seima‐Turbino, etc.).
Table 3: Minor migration sources to Europe.
15 See http://dnatribes.com/dnatribes-digest-2012-10-01.pdf. 16 Some loanwords in Uralic are specifically Indo-Iranian (not Proto-Indo-European), which might reflect Bronze Age (Andronovo) links between Siberia, Northeast Europe, and South Asia. See Early Contacts between Uralic and Indo-European: Linguistic and Archaeological Considerations, available at http://tiedekirja.fi/.
DNA Tribes® Digest January 2, 2013
All contents © 2006-2013 DNA Tribes. DNA Tribes®. DNA Tribes patented analysis is available exclusively from DNA Tribes. U.S. PAT. NO. 8,285,486. All rights reserved.
DNA Tribes® Digest January 2, 2013 Page 10 of 12
Web: www.dnatribes.com; Email: [email protected]; Facebook: facebook.com/DNAtribes Mail: DNA Tribes, P.O. Box 735, Arlington, VA 22216
Manchurian and Arctic genetic components are identified for the Urals (Manchurian 1.7%) and Finnic (Arctic 9.7%) sub-regions of Northeast Europe. Both of these components might reflect locally specific links with Siberia during the medieval period (Manchurian links, possibly related to Turkic and Mongol expansions) and earlier Mesolithic and/or Bronze Age (Seima-Turbino).17
Finally, there were two neighboring regions that do not appear as migration sources to Europe. These components for which no direct links are identified included Arabian and Egyptian populations (see Figure 2). This suggests that the genetic links between Europe and these regions have been indirect or mediated through other regions (such as East Mediterranean populations).
In summary, results identified several non-local components in Europe. Major migration sources (see Table 2 and Figure 4) included Anatolia-South Caucasus, East Mediterranean, Altaian, and Salishan populations. These genetic components might reflect major expansions that affected most parts of Europe, such as expansions of Indo-European speaking populations (possibly originating in mixed Neolithic buffer cultures near the Balkan Peninsula).
Minor migration sources included North African, Egyptian, Balochi, Indus Valley, North India, Manchurian, and Arctic components (see Table 3 and Figure 5; for a map of regions, see Figure 2). These minor components might reflect genetic traces of later localized migrations, such as Proto-Celtic contacts with Southeastern Europe and possibly West Asian linked cultures (possibly including Nakh-Dagestanian cultures near the North Caucasus).
17 See http://dnatribes.com/dnatribes-digest-2012-10-01.pdf.
DNA Tribes® Digest January 2, 2013
All contents © 2006-2013 DNA Tribes. DNA Tribes®. DNA Tribes patented analysis is available exclusively from DNA Tribes. U.S. PAT. NO. 8,285,486. All rights reserved.
DNA Tribes® Digest January 2, 2013 Page 11 of 12
Web: www.dnatribes.com; Email: [email protected]; Facebook: facebook.com/DNAtribes Mail: DNA Tribes, P.O. Box 735, Arlington, VA 22216
Getting the Most from Your STR Testing
Once your 15, 21 or 27 Marker Kit STR testing is complete, we offer several options to keep your
report current and customize your genetic analysis for the information you want. (Prices are listed as of January 2, 2013 and are subject to change.) Updating Your Analysis:
DNA Tribes® analysis is updated on a periodic basis to include new reference data as well as refinements to our match algorithms and world regions analysis. (A map illustrating current populations and genetic regions is available at http://dnatribes.com/populations.html.)
After your testing is complete, your analysis can be updated at any times of your choice for
$24.99 through our secure online checkout at http://dnatribes.com/order_addons.html.
Customizing Your Analysis with Add-On Reports:
DNA Tribes® offers several $24.99 Add-On reports to customize your analysis: African Panel: A listing of your DNA match scores for all individual Sub-Saharan African
populations in our database. Central Asian Panel: A listing of your DNA match scores for individual native Central Asian
and Siberian populations in our database, also including Roma (European Gypsy) match scores. East Asian Panel: A listing of your DNA match scores for East Asian populations in our
database, including all individual Chinese, Japanese, Korean, and Southeast Asian populations. Middle Eastern Panel: A listing of your DNA match scores for Middle Eastern populations in
our database, including all individual Arab, Berber, Caucasus, Jewish, Persian, and Turkish populations. Native American Panel: A listing of your DNA match scores for all individual Native American
populations in our database. South Asian Panel: A listing of your DNA match scores for South Asian populations in our
database, including all individual populations of Bangladesh, India, Nepal, Pakistan, and Sri Lanka. Extended Match Results: A comprehensive listing of your DNA match scores for all individual
populations in our database. Once lab testing is complete, Add-On reports can be performed at any time (without the need to
submit new DNA samples) by ordering through our secure online checkout at http://dnatribes.com/order_addons.html.
DNA Tribes® Digest January 2, 2013
All contents © 2006-2013 DNA Tribes. DNA Tribes®. DNA Tribes patented analysis is available exclusively from DNA Tribes. U.S. PAT. NO. 8,285,486. All rights reserved.
DNA Tribes® Digest January 2, 2013 Page 12 of 12
Web: www.dnatribes.com; Email: [email protected]; Facebook: facebook.com/DNAtribes Mail: DNA Tribes, P.O. Box 735, Arlington, VA 22216
DNA Tribes® Europa: A Detailed Comparison to European Sub-Regions: DNA Tribes® Europa provides the most detailed and complete analysis of European autosomal
genetic structure available. DNA Tribes® Europa provides your DNA match scores for 17 genetic sub-regions of Europe, which is substantially more robust than the individual population matches in Parts B – C of reports and more detailed than the European world regions referenced in Part D of core results.
More information about DNA Tribes® Europa is available for $49.99 at: http://dnatribes.com/dnatribes-europa.html
Confirm or Clarify Your Results with Lab Upgrade: For customers who have completed testing with DNA Tribes®, we offer 15-to-21, 15-to-27 and
21-to-27 Marker Upgrade tests. Upgrades include lab testing of additional STR marker systems, allowing a closer comparison of your own DNA to world populations for enhanced match precision and power of exclusion. The incorporation of additional marker systems can confirm or clarify your existing results, and all upgrades includes an update to all Add-On reports previously ordered for your kit.
Upgrades are available through our secure online checkout system at: http://dnatribes.com/order_upgrades.html. Researching Your Results: Each person’s DNA Tribes® results are one of a kind and express their own unique collection of genetic material inherited from both paternal and maternal ancestors. Your personal DNA matches can express recent family genealogy and more ancient genetic relationships among world populations.
A library of articles based on DNA Tribes® original ongoing research and analysis of world genetic structure is available free at http://dnatribes.com/library.html.