dnp group environmental report€¢ the dnp group environmental report 2016 is published in a page...
TRANSCRIPT
2016DNP Group Environmental Report

20 Greenhouse Gas Emissions Reduction
21 Switching to Low CO2-Emission Fuels
22 Anti-Global Warming Measures in Transport and at Our Offices
23 Reducing Air Pollutants
24 Reducing Water Pollutants
25 Chemical Substances Subject to the PRTR Law
26 Reducing Waste Products in Manufacturing Processes
27 Breakdown of Generated Waste Volume
28 Use of Recycled Resources
29 Environmentally Conscious Materials Procurement and Products
30 Environmentally Conscious Products and Services
31 Guidelines for Developing Environmentally Conscious Products and Services with Example Products
32 Environmental Label Certification
33 Biodiversity Efforts
35 Basic Target and Calculation Items
36 Table (1) Environmental Conservation Costs (categories corresponding to business activities)
37 Table (2) Environmental Conservation Benefits (1)
38 Table (2) Environmental Conservation Benefits (2)(3)
39 Table (3) Economic Benefits of Environmental Conservation Activities
2 Message from the Director in Charge of the Environment 3 Outline of the DNP Group 4 The DNP Group’s Fields of Business 5 DNP Group Vision 2015 6 DNP Group Code of Conduct 7 DNP Group Environmental Policy 8 Environmental Management Structure 9 Environmental Management System 10 Eco-Audit Content and Flow 11 Eco-Audit Performance 12 Environmental Risk Management 13 Certification Acquisition Status 14 Environmental Education 15 The DNP Group’s Business and Environmental Activities 16 Table: Environmental Activity Targets and Results 17 Current Status of Environmental Impact 18 Environmental Impact and Environmental Efficiency 19 Efforts to Reduce GHG Emissions Across the Entire DNP Group Supply Chain 20 39 40 Result of Efforts 41 Domestic manufacturing sites with required business performance data disclosure (1) 42 Domestic manufacturing sites with required business performance data disclosure (2) 43 International manufacturing sites with required business
performance data disclosure 44 Independent Review Report Comments by an Independent
Institution
DNP Group Environmental Report 2016 1
• The DNP Group Environmental Report 2016 was created to announce all of the environmental activities of the DNP Group, and is based on the Environmental Reporting Guidelines (2012 edition) issued by Japan’s Ministry of the Environment.
• The DNP Group Environmental Report 2016 is published in a page format designed to be easy to read on the Web.
• We have interspersed columns throughout, covering specific topics.
• The information in this report was subjected to a third-par-ty-review conducted by Bureau Veritas Japan. A check mark
indicates indices that have undergone third-party audits.
Period covered by this reportThis report focuses on activities carried out in the period of April 1, 2015 to March 31, 2016. It may also include reporting on important items not occuring within this period. The report also covers activities carried out at some overseas business locations in the period of January 1, 2015 to December 31, 2015.
Scope of environmental dataEnvironmental accounting was applied to DNP and to all domestic companies in the Group that are subject to consolidated financial accounting. Twenty-six domestic manufacturing companies plus one distribution company (see pp. 41, 42), the non-manufacturing sites (three development centers, office build-ings, sales offices, etc.) of all domestic Group companies, and our overseas manufacturing companies (see p. 43) were included in the scope.
Standards for Calculating Environmental Performance IndicesThe standards used for calculating environmental performance indices are published separately on the Web.
CONTENTS
Achieving a Low-Carbon Society Realizing a Society in Symbiosis with Nature
For Reduction of Environmental Pollutants
Environmental Accounting
Building a Recycling Society
Editorial Policy
Domestic Efforts
http://www.dnp.co.jp/csr/index02.html
1
2
3
4
5
DNP GroupEnvironmentalReport 2016

DNP Group Environmental Report 2016 2
Going BeyondSociety’s Expectations
Chairman of the CSR-Environment Committee
Satoru Inoue
Message from the Directorin Charge of the Environment
Protecting the environment and bringing sustainability to society are part of the Code of Conduct of the DNP Group. Harmonious coexistence with the environment is a constant consideration as we carry out sustainable business practices. The DNP Group has been working to reduce environmental impact in all processes from the procurement and use of raw materials to their disposal. We shall do everything to meet the trust in our relationships with diverse stakeholders. This year’s Environmental Report presents the results of our initiatives and efforts throughout the past fiscal year. The report is edited according to the Environmental Reporting Guidelines (2012 edition) issued by Japan’s Ministry of the Environment and aims to be exhaustive and provide continuity. The information in this report was subjected to a third-party review conducted by Bureau Veritas Japan, assuring that important environmental data was measured and calculated accurately.
Efforts in Fiscal 2015Environmental targets for fiscal 2015 and a record of actions taken are presented in this report. The DNP Group has set and achieved its 2015 global targets for reducing the total amount of its greenhouse gas emissions; this year we also worked through energy conservation subcommittees to promote group-wide energy-saving measures. In conjunction with these efforts we are implementing action across our entire supply chain, including at our key overseas bases, to calculate and reduce greenhouse gas emissions. In Japan we have reached and significantly exceeded our domestic fiscal 2015 target values for reducing atmospheric emissions of volatile organic compounds (VOCs). Outside of Japan, we began operating a VOC recovery system at our plant in Karawang, Indonesia. With regard to lowering industrial waste, we achieved our 2015 global targets for emissions reductions, and have been maintaining zero emissions domestically since fiscal 2013, achieving a less than 0.5% landfill
rate. In addition, we met 2015 sales targets for environmentally conscious products and services aimed at conserving resources and energy and promoting recycling.
With regard to protecting biodiversity, the DNP Group has focused on two key areas that are closely tied to our business activities: the procurement of raw materials and creating green areas on the premises of our business sites. Paper is a key raw material for the DNP Group and in 2012 we set Guidelines for Procurement of Paper for Printing and Converting and we are aiming to achieve a 100% rate of compliance with these guidelines. We are strengthening cooperation with our suppliers to promote the effective utilization of forest resources that have been confirmed as being lawfully harvested, and are working to guarantee traceability. In the creation of green spaces at business sites as natural habitats for wildlife and to protect rare and endangered species, we have carried out activities with employee participation in 31 locations. In fiscal 2015 we also began an environmental initiative together with the Toshiba Group that is taking place at 12 business sites in six locations around Japan.
Future effortsTwo historic international agreements were adopted in 2015—Sustainable Development Goals (SDGs) and the Paris Accord. Enterprises are further being called on to take control of their entire supply chain from a global perspective, institute measures to prevent global warming, and take action to promote sustainability in resource procurement, manufacturing, and consumption. Such times bring risk but also opportunity. The DNP Group has set targets for fiscal 2020 to step up the environmental actions taken to date, and we will do our best to meet those targets by working together. We also plan to communicate closely with our stakeholders to build deeper trust and meet our ideals, becoming a corporation that is consistently worthy of society’s high confidence in it.

DNP Group Environmental Report 2016 3
3.2
2.7
2.2
2.8
2.7
(1.8)
3.8
2.3
2.5
3.4
3.2
3.052.61,455.9
0
62.71,589.3 1,649.7
36.8
40.3
1,507.2
1,446.6
1,462.1
1,608.8
1,578.9
1,718.6
(16.3)
33.545.4
25.0
19.2
67.8 952.4
34.0
35.7
914.2
937.0
53.2
53.7
1,448.5 1,574.7
1,809.4
25.6
26.9
50.0
48.1
976.3
1,124.0
1,063.2
0 0
0 0 0
2010
2011
2012
2013
2014
2015
2010
2011
2012
2013
2014
2015
2010
2011
2012
2013
2014
2015
2010
2011
2012
2013
2014
2015
2010
2011
2012
2013
2014
2015
2010
2011
2012
2013
2014
2015
Net operating (Yen billions)
Net sales (Yen billions) Net ordinary income (Yen billions)Net sales (Yen billions)
Net income (net loss) (Yen billions)
Net ordinary income (Yen billions)
ROA (Return On Assets): Calculated using ordinary income.
ROE (Return On Equity): Calculated using net income.
Total assets (Yen billions) Bar graph / ROA (%) Line graph
Net assets (Yen billions) Bar graph / ROA (%) Line graph
Outline of the DNP GroupCompany Name
Head Office
Dai Nippon Printing Co., Ltd.
1-1, Ichigaya Kagacho, 1-chome, Shinjuku-ku, Tokyo, 162-8001, Japan
Tel: +81-3-3266-2111
(general information)
URL http://www.dnp.co.jp/
Established
Incorporated
Paid in Capital
Number of Employees
Sales Offices
Main Plants
R&D Facilities
October 1876
January 1894
¥114.464 billion
10,676 (Non-consolidated) 39,198 (Consolidated)
40 locations in Japan 25 locations overseas (including local affiliates)
56 domestic plants 14 overseas plants (including local affiliates)
3 locations in Japan
DNP Corporate Profile (as of March 31, 2016)
FY2015 Financial Data (FY ending March 2016)

DNP Group Environmental Report 2016 4
Information Communication
56.2%
Lifestyle and Industrial Supplies
26.2%
Electronics
13.6%
Beverages
4.0%
グラフデータ編集可能(右クリック)
The DNP Group’s Fields of Business
The business of the DNP Group is made up of our Printing Operations and Beverages Operations.
Printing: We are developing our printing business across a broad range of applications. These include the Information Communication segment, made up of operations such as publishing/commercial printing, smart cards, and network businesses; the Lifestyle and Industrial Supplies segment, which includes pack-aging, lifestyle materials, and industrial supplies; and the Electronics segment, which includes display prod-ucts and electronics devices.
Beverages: We produce and market carbonated beverages, coffee, tea, and other beverage products, mainly through Hokkaido Coca-Cola Bottling.
Sales distribution (FY ending March 2016)
1 2
3
5 6
74
8
10
9
Printing
Information Communication
Books and magazines, commercial printing, smart cards, network businesses, etc.
Lifestyle and Industrial Supplies
Packaging, lifestyle materials, industrial supplies, etc.
Electronics
Display components, electronic devices, optical film, etc.
Beverages Beverages
1 Magazines, books
2 Direct mail
3 Photobooks, dye-sublimation transfer media
4 Packaging
5 PET bottles and preforms (left of photo)
6 Aseptic filling systems for PET bottles
7 Automotive interior materials
8 Screens for projectors
9 Electronic paper systems
10 Soft drinks

DNP Group Environmental Report 2016 5
The DNP Group Vis ion 2015 consists of our Corporate Philosophy, Business Vision, and Guiding Principles, and is an expression of our basic philosophy of co-existence and co-development with society and the environment.
Our Corporate Philosophy is the DNP Group’s social mission, and is an expression of the most important value held by all DNP employees. Our Business Vision and Guiding Principles provide direction for the business and employee conduct that will enable us to make our Corporate Philosophy a reality.
The DNP Group Code of Conduct establishes the behavioral standards for all activities undertaken in realizing our Corporate Philosophy. The Code is intended to ensure that all employees conduct themselves with integrity at all times.
The DNP Groupprovides society with what individuals need, provides individuals with what society needs.
P&I Innovations“P&I Innovation” refers to the creation of new value—value that never existed before—by combining printing (P) and information (I) as DNP’s strengths along with diversified partners.
Each member of DNP becomes a professional in his or her field. Actively and repeatedly engaging in Taiwa and working together with people both inside and outside the company leads to the generation of original products and services that never existed in the past.
DNP’s Four Growth Areas● Knowledge and Communication: Supporting people’s lifestyles and fostering culture within an advanced
information society by conveying valuable information reliably, safely, and in optimal formats
● Food and Healthcare: Supporting safer and higher-quality living and lifelong health maintenance amid changing population dynamics, including the increasing aging of society.
● Lifestyle and Mobility: Aiming to achieve greater comfort in response to increasing desire for personal space as a result of consumers’ diversifying values.
● Environment and Energy: Aiming to make environmentally friendly society a reality in order to simultaneously achieve economic growth and environmental preservation.
Corporate Philosophy
The DNP Group connects individuals and society, and provides new value.
Guiding Principles
Taiwa (dialog) andCooperation
Corporate Philosophy
Business Vision
DNP Group Guiding Principles
The DNP Group connects individuals and society, and provides new value.
Use P&I Innovations to expand business, primarily around four growth areas.
Taiwa (dialog) and Cooperation
Business Vision
Use P&I Innovations to expand business,
primarily infour growth areas.
DNP Group Vision 2015

DNP Group Environmental Report 2016 6
DNP Group Code of Conduct
The DNP Group has established the DNP Group Code of Conduct as the set of principles upon which our efforts toward realizing our Management Concept are based. The Code of Conduct is founded upon strong ethical principles in accordance with our own rules as well as the law of the land, and is built around themes we consider to be of mutual importance to both the DNP Group and society as a whole.
The conduct of business with integrity at all times in accordance with this Code of Conduct is the foundation of our CSR activities.
1. Contributing to the development of society
We shall contribute to the development of society by offering new values through our business.
2. Social contribution as a good corporate citizen
We, as good corporate citizens living in harmony with society, shall deepen our ties with society and make social contributions through our solutions to various social issues and through our cultural activities.
3. Compliance with the law and social ethics
We shall contribute to the sustainable development of free and orderly market competition while assuming a fair and honest attitude at all times, in compliance with the law and social ethics.
4. Respect for human dignity and diversity
The dignity of humanity is of supreme importance to us. We shall respect diversity in the culture, nationality, creed, race, ethnicity, language, religion, gender, age, and ways of thinking of all persons, and conduct ourselves in a disciplined manner.
5. Environmental conservation and the realization of a sustainable society
We are contributing to building a sustainable society so as to pass on the rich blessings of the Earth to future generations.
6. Realization of a ‘universal society’
We shall work on the development and diffusion of easy-to-use functional products, services and systems so that everyone can live in safety and comfort, and thus contribute to the realization of a “universal society” in which all kinds of people can lead pleasant lives.
7. Ensuring the safety and quality of our products and services
We shall strive to win over the satisfaction and trust of consumers in general and of our corporate clients by ensuring the safety and quality of our products and services.
8. Ensuring information securityWe shall strive to ensure thorough security measures to protect information assets entrusted to us by our clients as well as those retained by the DNP Group itself (industrial secrets, personal information, intellectual property, etc.).
9. Proper disclosure of informationWe shall take the initiative to disclose information in a timely and appropriate manner so as to have our own business and activities properly understood by our various stakeholders with the goal of maintaining a high degree of transparency.
10. Realization of a safe and vibrant workplace
We shall exert ourselves for the maintenance and improvement of the safe and hygienic conditions of our workplace and shall always endeavor to seek ways to implement new improvements. At the same time, we shall respect working styles suited to the diversity of our employees and make efforts to create a safe, healthy and vibrant working environment.

DNP Group Environmental Report 2016 7
DNP Group Environmental Policy
Rapid economic progress and a rising global population are bound to continue through the twenty- first century, so we must do what we can to protect biodiversity and prevent further degradation of the environment. Different groups and organizations work to protect the global environment in different ways; we all must do what we can to pass on a healthy planet to future generations.
We follow the DNP Group Code of Conduct, which guides us toward environmental conservation and the realization of a sustainable society. The DNP Group Environmental Policy links this code to specific activities that take the environment into consideration within the scope of our various business activities.
The DNP Group seeks to minimize the impact our businesses have on the environment and supports biodiversity, first by complying with environmental laws and regulations and also by recognizing the relationship that each of our business activities has with the environment. In this way we hope to create a sustainable society in a world with limited resources.
1. Each member of the DNP Group establishes and periodically reviews its own environmental policies and environmental targets, and puts into effect continuous improvement of its activities and the prevention of environmental pollution.
2. For all construction projects, and before designing and commissioning new facilities, we carry out a full and detailed environmental survey to assess the impact that the project will have on the environment to make proper efforts to protect the environment. We shall also make aggressive efforts to use renewable energy.
3. When carrying out research, development, design, manufacture, and sales of a new product, we consider the impact of the product on the environment throughout its lifecycle, including materials procurement, production, distribution, use, and disposal, especially in terms of energy conservation, resource conservation, and reducing the use of harmful chemicals.
4. When purchasing raw materials, stationery, and equipment, we choose items that are ecologically-friendly and easy to recycle.
5. In manufacturing a product, we aim to comply with environmental laws and regulations, and moreover we set up more stringent standards to reduce the emissions of pollutants into the air, watershed, and soil, and to prevent unpleasant odors, noise, vibration, and land subsidence. We are constantly improving facilities, techniques, and manufacturing processes to promote the targets of energy conservation, resource conservation, and the reduction of industrial waste.
6. When generating waste from business operations, we strive to achieve zero emissions by separating and recycling waste as much as possible.
CSR-Environment Committee (March 21, 2000, revised March 16, 2010)
The DNP Group is a signatory of the United Nations Global Compact and a “promotion partner” of the Nippon Keidanren’s 2009 Declaration on Biodiversity.

DNP Group Environmental Report 2016 8
All companies in the DNP Group are striving to build an environmentally sustainable world through the efficient use of resources and various efforts—to prevent global warming, protect the environment, and preserve biodiversity.
The CSR-Environment Committee was established to coordinate group-wide environmental activities, while Operations & Group Company Environmental Committees preside over domestic and overseas activities within each business area. Each committee has its own office or promotion office.
• CSR-Environment CommitteeThis is made up of the directors of the basic organizations at company headquarters, who are responsible for the environment. The Committee deliberates and makes decisions concerning the environmental policies, objectives, and plans of the entire Group, and monitors the progress of the plans and the status of the achievement of those objectives.
• Operations & Group Company Environmental Committees
We carry out such activities based on decisions made by the CSR-Environment Committee and the characteristics of different business areas, including activities at our locations outside of Japan.
Environmental Management Structure
President
Office
Promotion Office
Operations & Group Company Sites
14 members
28 members
225 members
96 members
Technical and Manufacturing Group
Regional Measures Group
Office and Work Environment Group
Environmentally Conscious Products Development Group
Global Warming Mitigation Group
Industrial Waste Reduction Group
VOC/PRTR Group
Environmental Conservation Group
Biodiversity Group
(1) Deliberate and decide on environmental policies, targets, and plans of the DNP Group(2) Approve environmental policies, targets, and plans of the Operations & Group Company
Environmental Committees(3) Check and follow up on the progress being made in the plans of the Operations & Group
Company Environmental Committees, and the status of the achievement of those objectives
(1) Propose the DNP Group environmental policies, targets, and plans, and submit reports to the Committee
(2) Convey the environmental policies, targets, and plans of the DNP Group to all Operations & Group Company Environmental Committees, check their progress, and support activities
(3) Report to the Environmental Committee regarding the progress (results, progress of the measures, etc.) achieved by the Operations & Group Company Environmental Committees
(1) Deliberate and decide on environmental policies, targets, and plans of each operation(2) Check and follow up on the progress of plans by the Operations & Group Company
Environmental Committees, and the progress being made towards the targets(3) Hold committee meetings on a regular basis
(1) Submit environmental policies, targets, plans, and reports to the Operations & Group Company Environmental Committees
(2) Convey environmental policies, targets, and plans of divisional groups decided by the Committees to all sites, check, and follow up on their progress
(3) Report to the Committees regarding the progress (results, progress of the measures, etc.) being achieved by all sites
CSR-Environment Committee
Operations & Group Company Environmental
Committees
Cumulative total,1,283 members

DNP Group Environmental Report 2016 9
The DNP Group created its own environmental management system (EMS) in 1993, prior to the publication of ISO 14001. Our EMS uses the twin tools of Eco-Reports and Site Eco-Reports set up by the CSR-Environment Committee Office as a framework. We also execute the “Plan-Do-Check-Action” cycle every six months.
The Eco-Reports cover trends in environmental issues and changes in applicable laws, our courses of action, and how well the DNP Group overall has achieved its targets. The Eco-Reports are distributed to the Operations & Group Company Environmental Committees and to every business site. The Site Eco-Reports document each site’s targets, plans, and status of activities. The Operations & Group Company Environmental Committees use the Site Eco-Reports to gain an understanding of the situation at each site and submit a summary report to the CSR-Environment Committee.
The CSR-Environment Committee and the Operations & Group Company Environmental Committees carry out continuous improvement activities through training teams, implementation teams, liaison teams, etc. Progress is checked through periodic environmental activities promotion meetings.
Environmental Management System
Code of Conduct
Improvement Indicated
Improvement Indicated
Environmental Action
Confirmation by Committee Chairman
Confirmation by Coordinator
Environmental ActivitiesPromotion Meetings
Eco-Audit
CSR-Environment Committee
Environmental Vision
Operations & Group Company Environmental Committees
Site
Guidelines(environmental protection, development of environmentally conscious products and services, management of chemical
substances, soil pollution prevention)
Operations & Group Company Targets
Setting Site Targets
Site Environmental Committee Execution
Site Eco-ReportNext Term Action
Report
Site Eco-ReportEvaluation
Next-term Plan
Site Eco-ReportEnvironmental Target
DOACTION
CHECK
PLAN
Site Eco-Report
Summary Report
Site Eco-Report
• Setting Group Environmental Targets• Determining Site Eco-Report
Formats
Action Policy
Corporate Philosophy
Outline of the DNP Group Environmental Management System
DO
CHECK
DNP GroupEco-Report
PLAN
ACTION
Training Teams
Implementation Teams
Liaison Teams

DNP Group Environmental Report 2016 10
We began implementing “Eco-Audits” in 1996, so as to make our Environmental Management System (EMS) more effective.
Eco-Audits have the following features.
(1) Because auditors are DNP employees from sites not being audited, they have specialized knowledge about the products and processes and are able to maintain an independent perspective, which produces meaningful, objective results from the audit.
(2) In the Eco-Audit we place importance on on-site confirmation of actual items. In addition, we point out factors for which danger is projected and request preventive action when needed.
(3) In addition to confirmation of compliance, we confirm the status of continuous improvements and corrections being made towards the achievement of the environmental targets. When necessary, we require audited sites to review plans.
Under this system, when an audit reveals that corrective measures are needed at a site, a “corrective action request” is issued in writing and such actions as necessary are managed by the CSR-Environment Committee.
Eco-Audit Content and Flow
Allocation of roles, briefing on the site environment, confirmation of deficiency notices in the previous audit.Confirmation of: applicable standards, scope of audit, auditor assignment, types of deficiency notifications, warnings during the audit, confirmation of documentation.
Consistency of documents, state of management of related facilities, site conditions
Preparation of audit report and requests for improvement measures
Description of audit results and content of requests for improvements
Acceptance
DNP Group Eco-Audit checklist
Record of corrections and measures performed sheets from the previous audit
(1) Compliance audit (Air, water, sewer, noise, vibration, odors, qualified personnel, energy conservation, waste, PRTR)
(2) Operations audit (Ensuring management with regard to waste reduction, global warming prevention, and the reduction of chemical substances)
Eco-Audit Notification
Auditing team
Lead Auditor
Head Office Committee Office
Auditing team
Auditing team
Auditing team
Auditing Team Chief Auditor
Audited Operations/Group Company Promotion Office Manager
Sites subject to audit
Audited site manager
Head Office Manager
Audited Operations/Group Company Environmental Committee Chair
CSR-Environment Committee Chair
Sites subject to audit
Sites subject to audit
Approval
Approval
Approval
Approval
Approval
[Auditor Qualifications]Lead Auditor• Person designated or selected from
auditors by the Head Office Manager
Auditor• Person having completed a special
training course and approved by the Head Office Promotions Office Manager
• Other persons recognized as being suitable by the Office Manager
Auditor
Auditor
Preparation and notification of annual plan
Formation of auditing team
Adjustment of auditing schedule
Preparation of audit notification
Notification to sites of impending audit(1 month in advance)
Performance of Eco-Audit
Auditor’s pre-audit meeting
Open meeting
Document checking
Site confirmation
Auditor’s meeting
Closing meeting
Completion of Eco-Audit
Audit Report and Requests for Improvement Measures
Correction Measures Performed Sheet Preparation

DNP Group Environmental Report 2016 11
Eco-Audit Performance
Number of sites audited 70 sites
Number of attendees at sites 506 persons
Cumulative auditor numbers 123 persons
Cumulative auditing hours 346 hours
• Notification level and improvements required
Improvement required ➡
Submission of a written description of correction measures performed or improvement plans
Improvement consideration & examination
➡Submission as necessary of a written description of results of consideration/examination or improvement plans
Indications of “improvement required” at domestic sites included items such as insufficient reporting by qualified personnel and at specific sites and other legal violations, but we confirmed that the necessary improvement measures were being taken in each case.
The areas indicated as requiring improvement are analyzed and follow-up Eco-Audits will be carried out in FY2016.
Eco-Audit Content
Compliance Audit
(1) Document Audit• Site location• Type and number of legally-designated facilities• Types of waste• Energy consumption• Exhaust and wastewater channels• Changes in facilities, production processes since the last
audit• Applicable laws and their range• State of improvement of notifications of deficiencies in
previous audit• State of submission of and changes to legal notifications
and reports• Frequency of measurement, validity and traceability of
measured data• Changes in management personnel due to internal
transfers
(2) On-site Inspections• Site location and relationship with surrounding sites• Conformity to statutory facility document audit (type,
number, scale, etc.)• State of management of individual facilities and
equipment, existence of abnormalities• Emergency containment in case of abnormality or
emergency• Site picture-taking• Appropriateness of actual work performed
Operations Audit
PLANValidity of Policy, Targets and Action Plans• Consistency with DNP Group policies and targets• Consistency with action plans and targets• Implementation system and schedule• Awareness level of employees
DOConfirm status of plan implementation and target achievement• Progress status of plan• Achievement of targets
CHECKStatus of progress management of plan• Holding of environment-related meetings• Content of environment-related meetings
ACTIONStatus of reviews by term• Review of previous term results and reflection in plan

DNP Group Environmental Report 2016 12
Changed operating procedure for automatic dishwasher
Changed operational conditions for activated carbon regeneration equipment
Environmental Risk Management
The DNP Group publishes regular Eco-Reports which cover trends in environmental regulations, and also conducts Eco-Audits to ensure full compliance with all laws and regulations. Our compliance efforts also include the establishment of and strict adherence to our own voluntary standards (air, water, noise, vibration, odor) and voluntary guidelines (chemical substance management, soil contamination measures), which exceed what is legally required.
The DNP Group handles many chemicals in its production processes. We have drawn up a Chemical Substance Management Guide for chemical substance handling, and have set up levees and emergency shutoff systems to prevent liquids from overflowing and installed two-tier holding tanks for the prevention of accidents at plants handling chemicals. We also stock up on materials that can be used during emergencies and hold emergency response drills to ensure the proper response in the event of an occurrence.
• Soil and Groundwater ContaminationThe DNP Group conducts soil inspections based upon our voluntary management guidelines. When soil contamination is discovered, we file a report with the office of the governor or mayor in charge of that prefecture or city, and upon receiving instructions from the local authorities, we implement appropriate measures for removing the contamination.
In addition to continuing the purification of pump water at one site in FY2015, we also inspected tanks, waste storage sites, and areas for storing equipment that handles waste PCBs to prevent soil contamination.
• PCB StoragePCBs are currently in storage at 18 sites, with 144 condensers and 30 transformers; a total of 174 units. The PCBs are contained in electrical equipment for-merly used in substation facilities at our plants. Fluo-rescent lighting ballasts and other equipment contain-ing PCBs have also been placed in storage. Storage consists of special containers in designated storage rooms at each site, managed under the strictest con-ditions in accordance with applicable regulations to ensure there is no leakage or loss. The PCBs in stor-age will gradually be disposed of as required by law according to the disposal plans for each region.
• Status of Legal ComplianceWhile we make all efforts to comply with environmental laws and regulations, over the past three years we have experienced three incidents in which air or water quality standards were exceeded and in each case improve-ment reports were submitted to the government. There are no ongoing legal disputes involving environmental issues. We have unfortunately had some complaints from areas neighboring our plants concerning noise and odors. Whenever we receive such complaints, we respond promptly by launching a thorough investiga-tion into the cause of the problem and by working to make improvements and prevent recurrence.
Occurrences (causes, improvements, and recurrence prevention measures)
February 24, 2014Tanabe Plant, DNP Technopack Governmental water analysis → pH measurement values exceeded regulatory standards for draining systems, so an improvement report was submitted.
The cause of excessive pH levels was the pH level of a special detergent used for an automatic dishwasher in the kitchen. We implemented procedures to confirm that the water inside the dishwasher after use of a special detergent was neutralized, and had pH levels within standard limits. After implementation, we were able to confirm through water quality tests that the values met those standards.
July 24, 2015Tanabe Plant, DNP TechnopackGovernmental measurement of concentration of volatile organic compounds (VOCs) in exhaust air → Values for VOC concentration exceeded the legal limit, so an improvement report was submitted.
The cause of the problem was found in the equipment that recovers and treats VOCs in exhaust gas. The adsorption ability of the activated carbon that adsorbs the VOCs had deteriorated. To prevent a recurrence, we are changing the operational conditions of the activated carbon regeneration equipment to improve the adsorption ability of the activated carbon, and are periodically monitoring its adsorption ability. After implementation of these steps, we were able to confirm that VOC concentration levels were within standard limits.
November 12, 2015Chikugo Plant, DNP TechnopackGovernmental water analysis → pH measurement values exceeded regulatory standards for draining systems, so an improvement report was submitted.
The cause of excessive pH levels was the failure of the wastewater neutralizing apparatus on the waste heat boiler. To prevent a recurrence, we repaired the controller and alarm device and will conduct periodic inspections. After implementation, we were able to confirm through water quality tests that the values met those standards.

DNP Group Environmental Report 2016 13
Certification Acquisition Status
Site Date Registered *1
Registration Organization
Okayama Plant, Imaging Communications Operations Nov. 1997 JIA-QA
Mihara East Plant, Fine Optronics Operations Jul. 1998 DNV
Okayama Plant, Lifestyle Materials Operations Jul. 2000 JIA-QA
DT Fine Electronics *2 Mar. 1997 JACO
Sayama Plant No.1, DNP Technopack Dec. 2001 SGS
Kobe Plant, Lifestyle Materials Operations Jan. 2002 JIA-QA
Tokyo Plant, DNP Fine Chemicals Jan. 2002 JCQA
Ushiku Plant, Information Innovation Operations Mar. 2002 DNV
Tokai Plant, DNP Technopack Mar. 2002 JCQA
Tien Wah Press (Singapore) May 2002 PSB
Chikugo Plant, DNP Technopack Jun. 2002 DNV
Sayama Plant, Imaging Communications Operations Oct. 2002 JIA-QA
Kurosaki Plant No.2, DNP Fine Optronics Co., Ltd. Jan. 2004 DNV
Tokyo Plant, Lifestyle Materials Operations Jan. 2004 JIA-QA
Kamifukuoka Plant, Fine Optronics Operations Mar. 2004 AJA
Itabashi Area, Sales Division 1, DNP Logistics Oct. 2004 AJA
Tokyo Plant, DNP Ellio Jan. 2005 LRQA
Osaka Plant, DNP Ellio Jan. 2005 LRQA
Warabi Plant, Information Innovation Operations Mar. 2005 DNV
Nara Plant, DNP Data Techno Kansai Jun. 2005 DNV
Tien Wah Press (Johor Bahru) Nov. 2005 PSB
Kashiwa Plant (incl. Utsunomiya Site), DNP Technopack Mar. 2006 JACO
Neyagawa Plant (incl. Tanabe Site), DNP Technopack Mar. 2006 JACO
DNP Photomask Europe S.p.A. Apr. 2006 CISQ
ISO 14001 Certificates
Site Date Registered *1
Registration Organization
DNP Fine Chemicals Utsunomiya Mar. 1997 JCQA
Akabane Area, DNP Logistics Dec. 2006 AJA
Izumizaki Plant, DNP High-performance Materials Co., Ltd. Mar. 2007 DNV
Yokohama Plant, DNP Technopack Dec. 2007 JIA-QA
Izumizaki Plant, DNP Technopack Aug. 2008 SGS
Kasaoka Plant, DNP Fine Chemicals Jan. 2009 JCQA
DNP Imagingcomm Europe B.V. Mar. 2009 LRQA
Mihara West Plant, Fine Optronics Operations May 2009 DNV
Okayama Plant, Fine Optronics Operations May 2009 DNV
DNP Indonesia (Pulogadung/Karawang) Aug. 2009 AJA
Hokkaido Coca-Cola Bottling Feb. 2010 SGS
Sayama Plant No.2, DNP Technopack Dec. 2011 JIA-QA
DNP Imagingcomm America Corporation Jun. 2012 NSF ISR
Kyoto Plant, DNP Data Techno Dec. 2013 DNV
Eco Action 21 Certificates
Site Date Registered *1
Registration Organization
Tokyo Head Office, DNP Trading Jan. 2006 IGES
Green Key Certification Status
Site Date Registered *1
Registration Organization
Hakone Training Center 2 May 2010 FEE
Registration Organization
JIA-QAJapan Gas Appliances InspectionAssociation, QA Center
DNVDet Norske Veritas AS (Norway)
JACOJapan Audit and CertificationOrganization for Environment andQuality
JCQAJapan Chemical Quality Assurance Ltd.
PSBPSB Certification Pte Ltd. (Singapore)
AJAAnglo Japanese American Registrars Ltd.
LRQALloyd’s Register Quality Assurance Ltd.
CISQFederazione Certificazione Italiana deiSistemi Qualità Aziendali (Italy)
SGSSGS Japan
IGESThe Institute for Global EnvironmentalStrategies
FEEFoundation for EnvironmentalEducation
NSF-ISRNSF International StrategicRegistrations
*1 Indicates the first registration date.*2 DT Fine Electronics registered as part of Toshiba Corporation (Semiconductor Company) (Kawasaki City, Kanagawa Pref.)
The DNP Group has established an independent environmental management system and is pursuing the acquisition of ISO 14001 certification at specific sites, depending on the type of work performed at those sites. (DNP organization names are as of June 30, 2016)

DNP Group Environmental Report 2016 14
Environmental Education
Type of Training Course Name/Description First Held Eligibility Time of Year
Education for New Recruits
Environmental Activity Overall (required) Basic environmental knowledge and conservation efforts of the DNP Group
1994 All new recruitsTotal Attendance7,757 people
When joining the company
Technical Seminar
Environment/Chemicals (optional)
Environmental Laws and Regulations
1999 TechniciansTotal Attendance 1,125 people
Once yearly
Network Learning Biodiversity 2010 All employees of the DNP Group At irregular
Intervals
Eco-Report Training
Environmental Issues of the Group (required) Domestic and international trends in environmental issues, revisions in environmental laws, degree of achievement of environmental targets, new targets, issues concerning specific sites
1993Environmental Committee
Promotion Office members andsite members
Twice yearly onissue of
Eco-Report
The DNP Group conducts environmental education programs according to level, working group, and function concerning the DNP Group’s environmental conservation efforts, environmental knowledge, environmental laws, and domestic and overseas trends concerning environmental issues. Our goal is for employees to gain the knowledge and management know-how necessary to improving employee environmental conservation consciousness and achieving our environmental goals. A correspondence course is held twice a year for everyone in the DNP Group on ISO 14001, lifecycle assessment (LCA), and other topics.
• Awards System InstitutedIn FY2012 we introduced an internal awards system. The awards are presented once a year and are reserved for plants that have made a special contribution through their environmental activities.
Such contributions include notable improvements in environmental performance, biodiversity protection activities, and renewable energy utilization. Winners are selected not only for specific accomplishments, but also in light of their results in internal environmental audits by meeting voluntary standards for environmental conservation (additional to legal requirements for air and water quality). In FY2015 awards were made to two plants for improvements in environmental performance.

DNP Group Environmental Report 2016 15
The DNP Group’s Business and Environmental Activities
DNP Group
Low-Carbon Society
DNP Group Environmental Management System
● Eco-Report ● Site Eco-Reports ● Internal environmental audit (Eco-Audit) ● Environmental education
Recycling Society Society Co-existing with Nature
Sustainable Society
Loss control through production improvements
Switch to low CO2-emission energy
Introduction of renewable energy
Promotion of green purchasing
Control of chemicals in materials
Purchasing that helps protect biodiversity
Installation and improvement of low-environmental impact facilities
(wastewater treatment facilities, odor reduction equipment, solvent collection equipment)
Use of recovered solvent
Environmental accounting
Reduction of air and water pollutants
Reduction of greenhouse gas emissions
Introduction of hybrid vehicles
Promotion of modal shift
Promotion of sales of environmentally conscious products and environmental awareness
Separation and collection of office paper
Use of recycled water
Establishment of voluntary plans
Reduction of emissions of PRTR-listed substances
Response to chemical substances (RoHS, REACH)
Rational use of energy
For greater life diversity: creation of green spaces at business sites
Development of environmentally conscious products
Practice of LCA
Use of recovered heat
Reduction of atmospheric emissions of VOCs
Environmental conservation management based on voluntary standards
Distribution efficiency
Production Division
Research Division
Recycling
Water
Air
Soil
WastePromotion of “zero emissions”Re-use
IN OUTOffering value
to society
Energy/Water
Materials
Environmentally conscious
products and services
Distribution Division
Marketing Sales Promotion Division
Undesired materials

DNP Group Environmental Report 2016 16
Table: Environmental Activity Targets and Results
Evaluation criteria ◎ Target exceeded by a wide margin ○ Target achieved or making steady progress toward target △ Making active efforts but target not achieved × Efforts insufficient
Topic Reference page Targets through FY2015 FY2015 results Evalu-
ation Targets through FY2020
Global warming prevention P 20 - 21 To reduce GHG emissions by 10% from the FY2005 levels by FY2020
and 20% by FY2030. (Includes overseas locations)Emissions in FY2005: 1.120 million tons 11.7% decrease
from that in FY2005 ◎ Reduce greenhouse gas emissions by 10% world-wide compared to FY2005 and 20% by FY2030.Emissions in FY2015: 0.989 million tons
Reduction of environmental impact incurred during transport
P 22 To reduce per-unit fuel use for transport (amount of fuel used/sales) by 1% per annum and 10% by FY2020 compared to FY2010.
Per unit in FY2010: 16.1 kl/billion yen 6.8% decrease from that in FY2010
○Reduce per-unit fuel use for transport by 1% per annum and 10% compared to FY2010.Per unit in FY2015: 15.0 kl/billion yen
VOCs P 23
To reduce emissions of VOCs (except for methane) by 20% compared to FY2010 by FY2015.
Emissions in FY2010: 6,729 tons 31.9% decrease from that in FY2010 ◎ Reduce emissions of all VOCs except for
methane by 35% compared to FY2010.Emissions in FY2015: 4,581 tons
Overseas, based on local laws and regulations, we plan to reduce atmospheric emissions of VOCs to the greatest extent possible through introduction of technologies and other measures.
Began operation of VOC recovery equipment at DNP Indonesia’s Karawang Plant ○
Comply with local laws and regulations and introduce technology and other measures to reduce, as much as practical, VOC emissions at our international business sites.
Reduction of industrial waste P 26 - 27
To reduce per-unit waste emissions (waste emissions/production) by 15% from the FY2010 level by FY2015. (Includes overseas locations)
Per unit in FY2010: 42.4 tons/billion yen 17% decrease from that in FY2010 ◎ Reduce per-unit waste emissions (waste emissions/
production) by 20% worldwide from FY2010.Per unit in FY2015: 35.4 tons/billion yen
To achieve zero emissions for the entire DNP Group by FY2015.Landfill waste rate in FY2014: 0.06% Maintained zero
emissions ◎ Maintain zero emissions at all DNP Group sites in Japan.Landfill waste rate in FY2015: 0.06%
Reduction of water usage P 28 To reduce per-unit water use by 1% by FY2015 (domestic +
international).Per unit in FY2014: 9.4 m³/million yen 9.6% decrease
from that in FY2014 ◎ Reduce per-unit water use by 25% over FY2010 worldwide.Per unit in FY2015: 8.5 m³/million yen
Development and sales of environmentally conscious products and services
P 30 - 31 Development and sales of environmentally conscious products and services to achieve 400 billion yen by FY2015.
Sales of 478.8 billion yen in FY2014 19.2% increase from that in FY2014
◎Development and sales of environmentally conscious products and services to achieve 600 billion yen.Sales of 570.8 billion yen in FY2015
Green purchasing P 29P 34
To increase the rate of materials purchased according to the DNP green purchasing standards to 50% by FY2015.
48.2% green purchasing rate for materials in FY2014 1.7 point decrease from that in FY2014 △ Emphasize procurement of raw materials,
and aim for purchasing rate of 100% for products compliant with Group Guidelines for Procurement of Paper for Printing and Converting.
46.5% green purchasing rate for materials in FY2015
To increase the purchase rate of environmentally certified products, such as those labeled with the Eco-Mark, of the total supplies (office supplies and equipment) to 85% by FY2015.
77.5% green purchasing rate for materials in FY2014 7.2 point increase from that in FY2014
○84.7% green purchasing rate for materials in FY2015
Environmental conservation P 12
To keep the maximum concentration of air emissions subject to emissions regulations at 70% of the required standard or less. 96% achievement rate of targets for FY2015 (voluntary target) ○ Maintain the maximum concentrations at
70% of the required standards or lessTo keep the maximum concentration of water emissions subject to wastewater regulations at 70% of the required standard or less. 99% achievement rate of targets for FY2015 (voluntary target) ○ Maintain the maximum concentrations at
70% of the required standards or lessTo keep the maximum concentration of odors at our site perimeters at 70% of the required standard or less. 97% achievement rate of targets for FY2015 (voluntary target) ○ Maintain the maximum concentrations at
70% of the required standards or lessTo keep the maximum level of noise at our site perimeters at 70% of the required standard or less. 98% achievement rate of targets for FY2015 (voluntary target) ○ Maintain the maximum levels at 70% of
the required standards or lessTo keep the maximum level of vibration at our site perimeters at 70% of the required standard or less. 100% achievement rate of targets for FY2015 (voluntary target) ◎ Maintain the maximum levels at 70% of
the required standards or less
Office environment P 28 To increase the rate of the fractional recovery of waste paper to 70% of that for general waste. 83.5% recovery of waste paper in FY2015 ◎
Increase the rate of the fractional recovery of waste paper to more than 70% of that for general waste.
DNP Group Environmental Report 2016 17
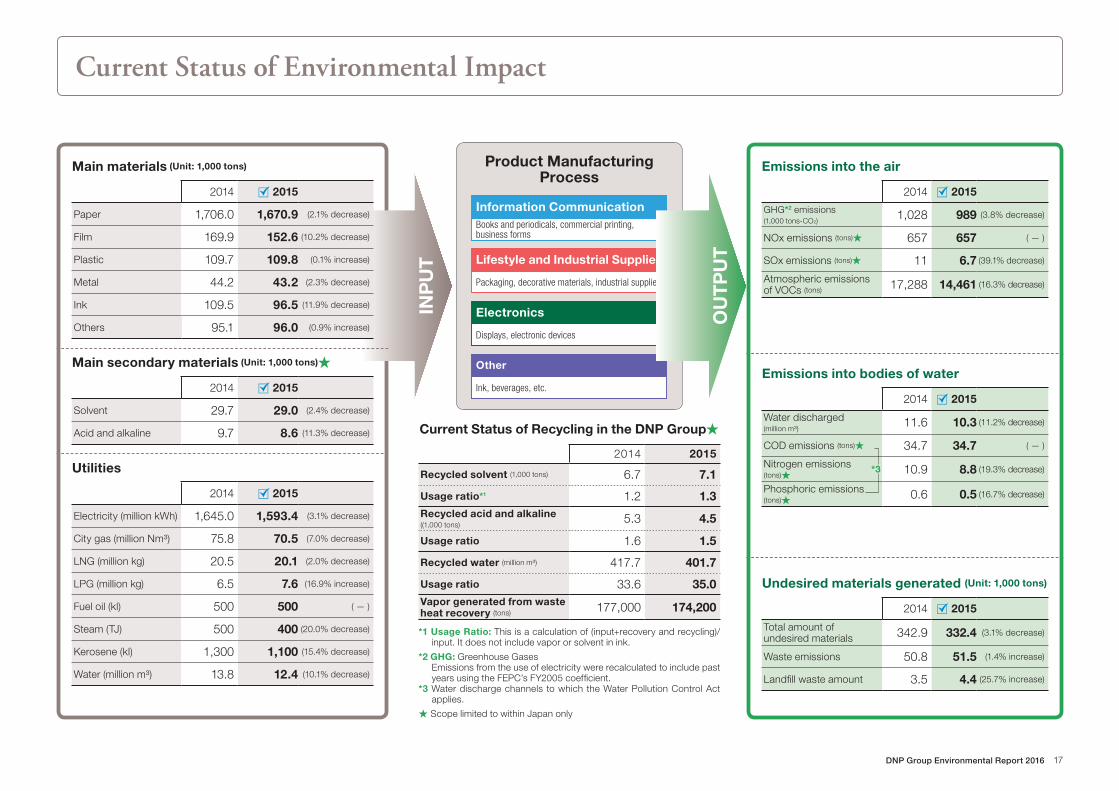
Current Status of Environmental Impact
Current Status of Recycling in the DNP Group★
2014 2015
Recycled solvent (1,000 tons) 6.7 7.1
Usage ratio*1 1.2 1.3Recycled acid and alkaline ((1,000 tons)
5.3 4.5
Usage ratio 1.6 1.5
Recycled water (million m3) 417.7 401.7
Usage ratio 33.6 35.0Vapor generated from waste heat recovery (tons) 177,000 174,200
Information Communication
Lifestyle and Industrial Supplies
Electronics
Other
Books and periodicals, commercial printing, business forms
Packaging, decorative materials, industrial supplies
Displays, electronic devices
Ink, beverages, etc.
OU
TP
UT
Product Manufacturing Process
*1 Usage Ratio: This is a calculation of (input+recovery and recycling)/input. It does not include vapor or solvent in ink.
*2 GHG: Greenhouse Gases Emissions from the use of electricity were recalculated to include past years using the FEPC’s FY2005 coefficient.
*3 Water discharge channels to which the Water Pollution Control Act applies.
★ Scope limited to within Japan only
Emissions into the air
2014 2015
GHG*2 emissions (1,000 tons-CO2)
1,028 989 (3.8% decrease)
NOx emissions (tons)★ 657 657 ( — )
SOx emissions (tons)★ 11 6.7 (39.1% decrease)
Atmospheric emissions of VOCs (tons) 17,288 14,461 (16.3% decrease)
Emissions into bodies of water
2014 2015
Water discharged (million m3)
11.6 10.3 (11.2% decrease)
COD emissions (tons)★ 34.7 34.7 ( — )
Nitrogen emissions (tons)★ 10.9 8.8 (19.3% decrease)
Phosphoric emissions (tons)★ 0.6 0.5 (16.7% decrease)
Undesired materials generated (Unit: 1,000 tons)
2014 2015
Total amount of undesired materials 342.9 332.4 (3.1% decrease)
Waste emissions 50.8 51.5 (1.4% increase)
Landfill waste amount 3.5 4.4 (25.7% increase)
INP
UT
Main materials (Unit: 1,000 tons)
2014 2015
Paper 1,706.0 1,670.9 (2.1% decrease)
Film 169.9 152.6 (10.2% decrease)
Plastic 109.7 109.8 (0.1% increase)
Metal 44.2 43.2 (2.3% decrease)
Ink 109.5 96.5 (11.9% decrease)
Others 95.1 96.0 (0.9% increase)
Main secondary materials (Unit: 1,000 tons)★
2014 2015
Solvent 29.7 29.0 (2.4% decrease)
Acid and alkaline 9.7 8.6 (11.3% decrease)
Utilities
2014 2015
Electricity (million kWh) 1,645.0 1,593.4 (3.1% decrease)
City gas (million Nm3) 75.8 70.5 (7.0% decrease)
LNG (million kg) 20.5 20.1 (2.0% decrease)
LPG (million kg) 6.5 7.6 (16.9% increase)
Fuel oil (kl) 500 500 ( — )
Steam (TJ) 500 400 (20.0% decrease)
Kerosene (kl) 1,300 1,100 (15.4% decrease)
Water (million m3) 13.8 12.4 (10.1% decrease)
*3

DNP Group Environmental Report 2016 18
0 500 1,000 1,500
DNP Group's GHG emissions (including international operations)
GHG emissions (1,000 t-CO2)0 20 40 60 80 100
DNP Group's waste emissions (including international operations)
Waste emissions (1,000 tons)
0 42 6 8
DNP Group's landfill waste (including international operations)
Landfill waste (1,000 tons)0 5,000 10,000 1015,000 20,000
DNP Group's VOC emissions (including international operations)
VOC emissions (t)
0.00 0.50 1.00 2.001.50
Emissions per-unit value (t-CO2/million yen)0 20 40 60 80 100
Emissions per-unit value (kg/million yen)
DNP Group's water discharged (including international operations)
0 5,000 10,000 15,000 20,000Water discharged (1,000 m³)
0 5 10 2015
Emissions per-unit value (m³/million yen)
0 5,000 10,000 15,000 20,000
DNP Group's water usage (including international operations)
Water usage (1,000 m³)
0 5 10 2015
Emissions per-unit value (m³/million yen)
0 42 6 8 10
Emissions per-unit value (kg/million yen)0 5 10 2015
Emissions per-unit value (t/billion yen)
1,125
1,118
1,098
0.71
0.74
0.76
1,0660.74
1,0280.70
9890.68
2010
2011
2012
2013
2014
2015
67
63
55
2010
2011
2012
2013
2014
2015
42.4
42.0
37.8
5538.1
5134.7
5235.4
14,400
14,200
13,800
2010
2011
2012
2013
2014
2015
9.5
9.1
9.4
12,4008.6
11,6008.0
10,3007.1
17,100
16,400
15,800
2010
2011
2012
2013
2014
2015
10.8
10.9
10.9
14,50010.0
13,8009.4
12,4008.5
5.1
5.6
4.4
2010
2011
2012
2013
2014
2015
3.2
3.7
3.0
14,026
13,714
17,616
2010
2011
2012
2013
2014
2015
8.8
9.1
12.2
3.42.3
3.52.4
4.43.0
17,45812.1
17,28811.8
14,4619.9
Environmental Impact and Environmental Efficiency

DNP Group Environmental Report 2016 19
10
Manufacturing of goodsand services
Upstreamleased assets
Capital goods
Fuel and energy-related activitiesnot included in Scope 1 or 2
Business travel andemployee commuting
DNP GroupManufacturing
of materials
End of life treatmentof sold products
Direct emissions from fuel combustion, etc.
Indirect emissions from use ofelectrical power and steam
Waste generatedin operations
Use of sold productsDownstreamtransportation &distribution
End of life treatmentof sold products
Processing ofsold products
Scope 2
Scope 3
Scope 1
Upstream transportation& distribution
~
Transportation ofraw materials
Processing ofsold products
Use of sold products
1.0 2.0 3.0 4.0 5.0 6.0 7.00
5.68
5.60
5.78
5.71
6.182011
2012
2013
2014
2015
Scope 3 GHG emissions across entire supply chain including overseas sites (Unit: million tons-CO2)
Category Manufacturing ofgoods and services
Category Upstream transportation & distribution ofraw materials and intermediate products
Category Downstream transportation& distribution
Category End of life treatment ofsold products
Efforts to Reduce GHG Emissions Across the Entire DNP Group Supply Chain
Greenhouse gas (GHG) emissions are one cause of global warming. The DNP Group is taking active steps to reduce GHG emissions on a global scale.
In developing environmentally conscious products, we consider it vital to un-derstand GHG emissions in the overall lifecycle of a product. We have therefore calculated GHG emissions across our entire supply chain including main over-seas sites (for FY2011 to FY2015) (Scope 3), not only at the stage of manufactur-ing but also including indirect emissions.
The Scope 3 emissions for FY2015 stood at 5.60 million t-CO2 and break down as follows: “Manufacturing of goods and services” (Category 1) at 63%, which accounted for the largest portion; “Downstream transportation & distribu-tion (finished products)” (Category 9) at 13%; “End of life treatment of sold prod-ucts” (Category 12) at 9%; “Upstream transportation & distribution of raw materi-als and intermediate products” (Category 4*1) at 8%. These four categories together accounted for 93% of the total.
We will continue to promote the reduction of emissions across our entire sup-ply chain in the future based on these results.
Calculation MethodThe Ministry of Economy, Trade and Industry (METI) and the Ministry of the Environ-ment (MOE) formulated and released the “General Guidelines on Supply Chain GHG Emission Accounting, Ver 1.0”*2 the standards of which our calculations*3 are based upon. (Of the 15 Scope 3 categories, Categories 8, 10, 13 and 14 were not applicable, while Category 15 was excluded from the calculation.)*1 Scope 1 emissions attributable to transportation and distribution carried out by
group companies were included under Category 4.*2 These guidelines were drawn up for the purpose of providing calculation methods,
etc., that are easy to use for Japanese companies based on the Scope 3 Standard, an international standard from the GHG Protocol.
*3 Main DNP business sites in Japan were set as the scope of calculations (excluding Hokkaido Coca-Cola Products and the Bookstore Group among others), in addi-tion to key overseas sites (PT DNP Indonesia, DNP Imagingcomm America Corpo-ration, and Tien Wah Press (Pte.) Ltd.).
In addition, the unit values database used for our calculations can be viewed on the MOE’s Green Value Chain Platform. (http://www.env.go.jp/earth/ondanka/supply_chain/gvc/index.html)
Management of greenhouse gas emissions across the entire supply chain

DNP Group Environmental Report 2016 20
1 Achieving a Low-Carbon Society
1,058
From left Energy source CO2 emissions Non-energy source CO2 emissions Other
Target value to be achieved in 2020(10% reduction from 2005)
2005 (base year)
2010
2011
2012
2013
2014
2015
Unit greenhouse gas emissions (Unit: 1,000 tons-CO2)
1,028
999
965
1,059
888
924
Session on saving energy in printing training
Practical skills in printing training(how to diagnose an air leak)
Greenhouse Gas Emissions Reduction
• Reducing Consumption of CO2-Generating EnergyThe DNP Group’s overall greenhouse gas emissions in FY2015 totaled 888,000 tons. This breaks down as fol-lows: energy source CO2 emissions, 866,000 tons; non-energy source CO2 emissions, 21,300 tons; meth-ane converted to CO2 emissions equivalent, 42 tons; N2O emissions, 460 tons. There were 30 tons of emis-sions of perfluorocarbons (PFCs) and 20 tons of sulfur hexafluoride (SF6), but no emissions of hydrofluorocar-bons (HFCs) or nitrogen trifluoride (NF3).
In FY2015, our main efforts to reduce CO2 emissions included conserving energy used for air conditioning and power, improving production line operations, efficient heating units, etc. Energy conservation subcommittees adapted to the characteristics of each business area were also formed. In FY2016, we will continue our aggressive efforts to limit greenhouse gas emissions by continuing with the switch to low CO2-emission fuels, introducing energy-saving equipment such as inverters, efficient air conditioners, and heating units, and improving production efficiency.
Greenhouse gas emissions volume The calculation of greenhouse gas emissions at domestic production sites due to electricity use, fuel use/combustion, burning of waste, and atmospheric emissions of HFCs/PFCs/SF6 is performed according to type of energy. For city gas, the computation is performed according to the quantity of heat in Appendix 4, “List of City Gas Suppliers and Supplied Quantity of Heat” (revised April 15, 2013) of the Requirements for Filling Out Periodic Reports Based on Articles 15 and 19-2 of the Act on the Rational Use of Energy. For other types of energy, the calculation is performed using the calorific value and emission factors contained in the revised Act on Promotion Global Warning Countermeasures (an enforcement ordinance published March 31, 2010 by the Ministry of the Environment and Ministry of Economy, Trade and Industry). Additionally, for electricity emission factors, the FEPC’s 2005 point-of-use CO2 emissions unit value of 0.423 (kg-CO2/kWh) was used uniformly. Also, the Guideline for Greenhouse Gas Emissions Calculation for Businesses (Draft Ver. 1.6) (July 28, 2005, partially revised; Ministry of the Environment) is used for re-calculating the base year greenhouse gas emissions due to the change in our aggregate accounting range resulting from M&As. The 2005 (base year) figure in the graph above is the sum of FY2005 domestic production site emissions and FY2009 non-production site emissions. Furthermore, Scope 1 emissions attributable to transportation and distribution carried out by group companies are not included.
Important steps that the DNP Group has taken lead-ing to a low-carbon society include reducing the con-sumption of forms of energy that generate CO2 (ener-gy conservation), switching to low CO2-emission fuels, and introducing renewable energy sources.
Energy Conservation Subcommittees
In FY2015, continuing on from the previous year, DNP carried out subcommittee activities based on the characteristics of each business area. New initiatives included the utilization of waste heat from offset rotary presses and the recycling of exhaust gas from air conditioners. At Infor-mation Communication plants this year a system was developed to reuse the previously unutilized high-temperature waste heat from deodoriz-ing equipment for the offset rotary press drying equipment, thereby reducing gas usage. At Lifestyle and Industrial Supplies plants, we rolled out measures to slash the amount of cooling water used when molding equipment is at rest, thereby reducing pump energy consumption. At Electronics plants, the amount of washing water for photomask washing equipment was optimized, reducing the amount of ultrapure water needed. Among the measures taken at each plant, the most effective measures were implemented at all plants, information about which con-tinued to be distributed through an “Energy Savings News” organ. In addition, in training provided for the manufacturing and personnel divisions at the Tsukuba Techno Center, talks were given on how to diagnose air leaks and other topics to stimulate energy-saving activities at plants.

DNP Group Environmental Report 2016 21
1 Achieving a Low-Carbon Society
0.1%4%0.2% 2%17% 2% 75%
0.1%4%0.2% 2%17% 3% 75%
0.1%3%0.2% 2%19% 3% 73%
0.2%0.2% 24% 3% 2%2% 68%
0.1%0.2% 21% 3% 3%2% 71%
0.3%0.2% 26% 4% 2%1% 66%
0.5%0.3% 31% 6% 0.3% 62%
583,500
595,700
561,500
548,900
529,900
510,000
490,400*
2005
2010
2011
2012
2013
2014
2015
From left Fuel oil Kerosene Utility gas LPG LNG Steam ElectricityTotal use(Unit: kl)
Note: Gasoline and diesel fuel for automobile use are also used (less than 0.2%) in addition to these fuels above.*Corrected from 510,000 kl in October 2016.
Fuel composition
Kuki Plant, Publication Printing OperationsOffset Rotary Press Waste Heat Reutilization
Manabu Ohara, Publication Printing Operations
The Kuki Plant for publication printing employs an integrated system for producing magazines that includes plates, print-ing, and binding. Our core piece of equipment is the offset rotary press. To combat the odor of ink drying, we use a cata-
lytic combustion process of deodorization. This type of treatment, however, consumes large amounts of city gas. Part of the waste heat generated through this combustion had been recovered within the deodorizing unit, but heat at a temperature of about 250 °C was still being released through a smokestack.
We therefore newly installed a waste heat recovery system (“Eco-return”) to reuse the recovered heat in the drying process, in combination with an automatic control system that we developed to maximize the amount of waste heat recovered. This initiative has reduced city gas consumption by approximately 20%.
The resulting reduction in greenhouse gas emissions is approximately 120 t-CO2 annually. We are now implementing this system with other equipment as an important effort to prevent further global warming.
Switching to Low CO2-Emission Fuels
• Shift to Energy with Lower CO2 EmissionsThe DNP Group is making progress in the switch to low CO2-emission fuels to reduce emissions of greenhouse gases.
We have been making the switch from diesel, ker-osene, and similar high CO2-emission petroleum fu-els into low CO2-emission utility gas, LPG (liquefied petroleum gas), and LNG (liquefied natural gas) since before 1990, and plan to continue to do so.
We are also moving ahead with renewable energy. DNP High-performance Materials’ Izumizaki Plant in-stalled a solar power generation system in 2009, while in FY2011 DNP Technopack Tanabe Plant and Ichigaya Kagacho No.2 Building each installed solar systems with respective capacities of about 30 kW. Furthermore a 10 kW solar system has been installed at the Ichigayatamachi Building, and in FY2015, sys-tems were installed at the Ichigaya Kagacho Building (36 kW), Takashomachi Building (24 kW), and Saya-ma Plant (6 kW). We also currently purchase 1.75 million kWh of Renewable Energy Certificates annu-ally to cover part of the power consumption used by manufacturing processes within the group (for print-ing, bookbinding and processing), the showroom of the Ichigayatamachi Building and other facilities.
Control damperN
ew w
aste h
ea
t rec
ove
ry system
Smokestack (air emissions)
Deodorizing unit
Drying unit150–180 °C
180 > 250 °C
250 < 420 °C
250 °C
27 °C350 °C
27 °C
Paper
HeatexchangerExisting heat
recovery
Gas burner
Deodorizingcatalyst
DNP Group Environmental Report 2016 22
1 Achieving a Low-Carbon Society
×20×0.004
*Amount used for domestic cargo transport
16.1 25,700
16.4 24,650
15.9
16.6
22,900
23,980
15.2 22,180
15.0
2010 (base year)
2011
2012
2013
2014
2015
Fuel use for transport* (Unit: kl converted to crude oil)
Bar graph / Per-unit fuel use for transport (Unit: kl/billion yen)
Line graph
Target value to be achieved in 2020(10% reduction from FY2010)
21,840
×2×0.004
*38 major offices in Japan under continuous operation during the period FY2010–FY2015
24,200
20,900
19,300
19,800
2010 (base year)
2011
2012
2013
2014
2015
Power consumption at major offices*(Unit: 1,000 kWh)
13.7%
18.4%
20.4%
18,80022.6%
18,00025.6%
Bar graph / Reduction rate compared to FY2010 Line graph
Anti-Global Warming Measures in Transport and at Our Offices
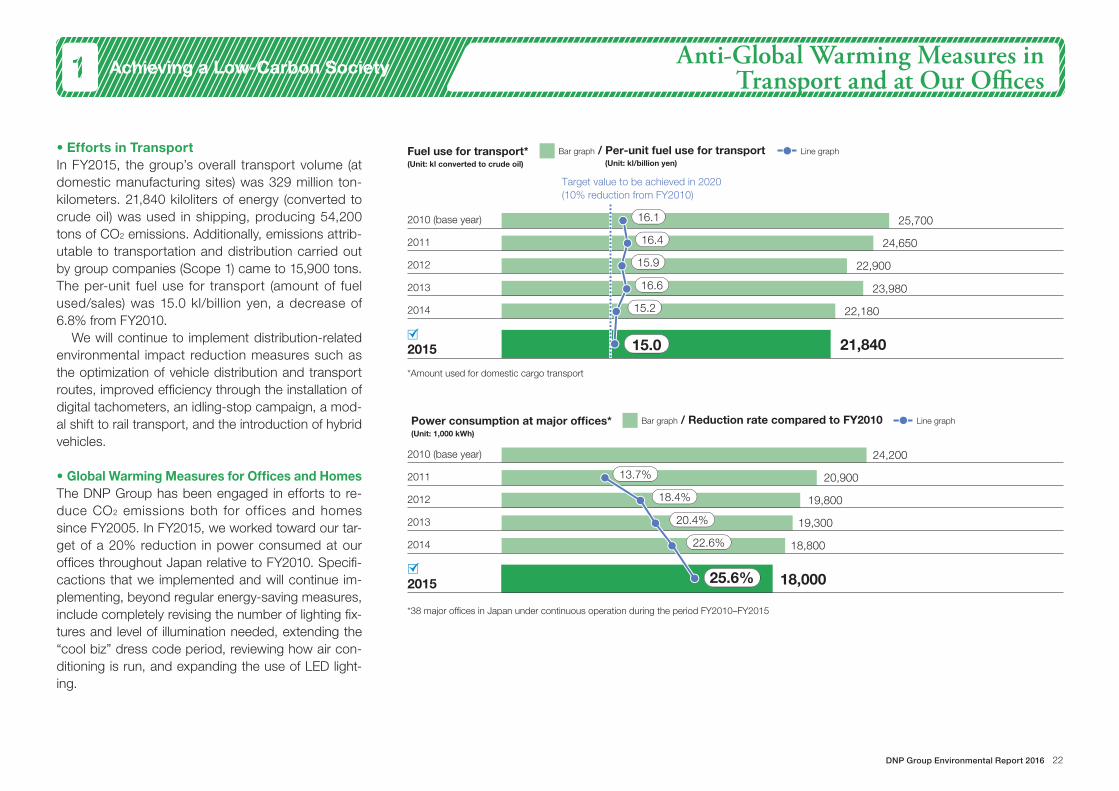
• Efforts in TransportIn FY2015, the group’s overall transport volume (at domestic manufacturing sites) was 329 million ton- kilometers. 21,840 kiloliters of energy (converted to crude oil) was used in shipping, producing 54,200 tons of CO2 emissions. Additionally, emissions attrib-utable to transportation and distribution carried out by group companies (Scope 1) came to 15,900 tons. The per-unit fuel use for transport (amount of fuel used/sales) was 15.0 kl/billion yen, a decrease of 6.8% from FY2010.
We will continue to implement distribution-related environmental impact reduction measures such as the optimization of vehicle distribution and transport routes, improved efficiency through the installation of digital tachometers, an idling-stop campaign, a mod-al shift to rail transport, and the introduction of hybrid vehicles.
• Global Warming Measures for Offices and HomesThe DNP Group has been engaged in efforts to re-duce CO2 emissions both for offices and homes since FY2005. In FY2015, we worked toward our tar-get of a 20% reduction in power consumed at our offices throughout Japan relative to FY2010. Specifi-cactions that we implemented and will continue im-plementing, beyond regular energy-saving measures, include completely revising the number of lighting fix-tures and level of illumination needed, extending the “cool biz” dress code period, reviewing how air con-ditioning is run, and expanding the use of LED light-ing.

DNP Group Environmental Report 2016 23
2 For Reduction of Environmental Pollutants
2010
2011
2012
2013
2014
2015
2010
2011
2012
2013
2014
2015
Dichloromethane (Unit: tons) Chlorofluorocarbons (Unit: tons) Dioxins and dioxin-like compounds (Unit: mg-TEQ)
2 2 4 6 82 4 64 6
SOx (Unit: tons) NOx (Unit: tons)
50 200 400 600 800100
Although dichloromethane was mainly used for washing in the printing process, we have pursued a switchover to substitutes. At present a certain amount is used as a solvent. Our atmospheric emissions have fallen from 53 tons in FY2001 to 0.7 tons in FY2015.
Sulfur oxide is emitted through burning high-sulfur fuel oil and kerosene. We are making ongoing efforts to discontinue use of fuel oil, and in FY2015 our emissions were 6.7 tons.
Nitrogen oxide is emitted when fuel is burned in production processes or when electric power is consumed. We have been working to reduce nitrogen oxide emissions by installing low NOx burners. NOx emissions in FY2015 amounted to 657 tons.
The ozone-depleting chemical HCFC-141b (1,1-dichloro-1-fluoroethane) is used as a cleaner, but our switch to substitutes in FY2010 caused emissions to drop to zero.
We totally eliminated small furnaces, for which burning control is difficult, and currently have five large-scale furnaces in operation, which are compliant with 2002 regulations. Atmospheric emissions in FY2015 amounted to 6.7 mg-TEQ.
0 0 0
6.7
0.0
0.02.3 2.3
2.90.0
0.0
0.0
0.3
0.1
0.7 0.0
5.9
7.9
3.0
0 0
6.7
11 697
706
683
10
10
10
65711
740
657
0.0
0.0
From left VOCs covered by PRTR VOCs not covered by PRTR
528
569
4,631
4,321
4,188
541 4,040
654
676
6,075
542
4,830
2010 (base year)
2011
2012
2013
2014
2015
6,729
5,506
5,173
4,849
4,757
4,581
OverallEmissions
×0.01
Reducing Air Pollutants
The Air Pollution Control Act regulates substances such as toxic air pollutants and ozone depleting sub-stances, including sulfur oxide (SOx) and nitrogen oxide (NOx), as well as volatile organic compounds (VOCs). These substances have an impact on health and the global environment, causing problems such as photochemical smog and ozone layer depletion. We at the DNP Group are working hard to monitor and reduce emissions of such substances.
• Reducing VOC EmissionsInks, solvents, adhesives, and cleaning solutions used in the printing process contain toluene and oth-er VOCs (volatile organic compounds). The DNP Group’s anti-VOC measures not only seek to regulate concentrations as required under the Air Pollution Control Act, but also to reduce emissions overall. We have been switching to substitute products with a lower environmental impact and installing equipment for VOC treatment and collection. These efforts have resulted in FY2015 in a 31.9% reduction in VOC emissions to 4,581 tons, in comparison with FY2010 (base year).
Air pollutant emissions
Atmospheric emissions of VOCs (Unit: tons)

DNP Group Environmental Report 2016 24
2 For Reduction of Environmental Pollutants
2010
2011
2012
2013
2014
2015
COD (Unit: tons)
10 20 30 40 50 60
2010
2011
2012
2013
2014
2015
2010
2011
2012
2013
2014
2015
Nitrogen (Unit: tons) Phosphorous (Unit: tons)
5 1.0 2.010 15 20
0
34.7
0 0
8.8 0.5
48.9
13.4 0.4
40.4
39.0
13.5
11.9
0.4
0.4
36.2
34.7
11.2 0.6
10.9 0.6
Reducing Water Pollutants
We detoxify and reduce the pollution load of the wastewater from our industrial processes and dining halls by using purification tanks and wastewater treatment equipment. We continued to conduct measures in FY2015, such as changing out the filtra-tion membranes and absorbent materials in waste-water processing equipment, improving wastewater treatment in our kitchens, and reducing nitrogen and phosphorous emissions.
Water pollutant emissions

DNP Group Environmental Report 2016 25
2 For Reduction of Environmental Pollutants
Substance Handled Consumed Removed/Consumed Recycled
To Atmo-sphere
PublicWater-ways
Soil Sewer Waste
Acetonitrile 3,200 − 190 − 32 − − − 3,000
2-aminoethanol 40,000 − − − − − − 26,000 14,000
Indium and its compounds 12,000 2,800 − 9,000 − − − − 230
Ethylbenzene 180,000 − 120,000 56,000 2,500 − − − 650
Ethylene glycol monomethyl ether 1,000 − 670 320 56 − − − −Ferric chloride 2,000,000 390,000 610,000 850,000 − − − − 140,000
Epsilon-caprolactam 6,300 3,200 2,000 − 120 − − − 970
Xylene 160,000 − 110,000 42,000 1,800 − − − 10,000
Chromium and chromium(III) compounds 44,000 16,000 0.9 12,000 − − − 2.2 16,000
Hexavalent chromium compounds 16,000 8,700 7,000 0.9 − − − 0.2 360
Vinyl acetate 1,500 1,500 1.1 − 0.5 − − − 10Inorganic cyanide compounds (except complex salts and cyanate) 1,800 − 230 − 480 − − − 1,000
Dichloromethane 2,100 − − − 700 − − − 1,400
2,6-Di-tert-butyl-4-methylphenol 1,000 − 680 290 39 − − − −Bromine 1,900 − − − − − − − 1,900
Dioxins and dioxin-like compounds − − − − 6.7 − − − 280
Water soluble copper salts (except complex salts) 280,000 57,000 18,000 200,000 − − − 1.2 600
Triethylamine 1,400 − − − − − − − 1,400
1,2,4-trimethylbenzene 19,000 − 4,600 13,000 1,900 − − − −1,3,5-trimethylbenzene 6,100 − 3,700 2,300 42 − − − 43
Toluene 12,000,000 2,000,000 7,000,000 1,400,000 530,000 − − − 630,000
Naphthalene 11,000 − 11,000 − 55 − − − 34
Nickel 34,000 23,000 1,600 9,200 − − − − 100
Nickel compounds 11,000 1,400 − 9.4 − − − − 10,000
Bis(2-ethylhexyl)phthalate 3,400 1,500 1,200 − 69 − − − 560
N-hexane 2,500 − 1,200 67 140 − − − 1,100
1,2,4-benzenetricarboxylic acid 1,2-anhydride 3,300 2,900 − − − − − − 420
Poly(oxyethylene) alkyl ether* 4,100 1,300 2,500 − 39 − − − 270
Formaldehyde 3,300 − − − 3,300 − − − −Manganese and its compounds 3,000 1,500 − 550 − − − 28 880
Methacrylic acid 14,000 14,000 − − − − − − −n-Butyl methacrylate 2,300 2,300 − − − − − − −Methyl methacrylate 25,000 25,000 − − 1.9 − − − 99
Methylenebis(4,1-phenylene) diisocyanate 2,300 2,300 − − − − − − −Morpholine 2,200 − 2,000 − 31 − − − 200
PRTR-listed substances 14,000,000 2,500,000 7,900,000 2,600,000 540,000 0 0 26,000 840,000
Chemical Substances Subject to the PRTR Law
(Unit: kg, Dioxin and dioxin-like compounds only: mg-TEQ)
Annual amounts of chemical substances handled at each plant above the defined re-por t ing levels set by the PRTR Law are tallied here (amounts listed to 2 signifi-cant figures, or to the near-est 0.1 for figures under 1).
*Limited to alkyls of carbon 12 through 15 or their compounds

DNP Group Environmental Report 2016 26
3 Building a Recycling Society
×1.4×0.3
107151 34 12
365
358
327
326
314
304
2010
2011
2012
2013
2014
2015
From left Information Communication Lifestyle and Industrial Supplies Electronics Other
Total
159 98 66 42
4 33 17 11
158 98 62 40
151 94 42 40
4 31 15 9
4 25 13 9
147 115 39 25
151 110 42 11
4 28 13 6
245 11 6
244 13 5
65
59
51
51
46
46
2010
2011
2012
2013
2014
2015
Total
Undesired material generation (Unit: 1,000 tons)
Waste emissions (Unit: 1,000 tons)
Production 21 ActivitiesWe are working together as a group to strengthen our production capabilities and improve responsiveness to marketplace changes in order to realize the DNP Group Vision 2015. We are creating a manufacturing structure capable of constant improvement with sustainable strength to improve profitability and as-set efficiencies in manufacturing.
Reducing Waste Products in Manufacturing Processes
To help build recycling into society we are engaged in efforts to improve resource productivity and increase the recycling of undesired material. These efforts are premised on the waste-free use of raw materials that go into manufacturing processes. Undesired material is recycled as much as possible to utilize limited resources efficiently.
We use waste per unit of production (waste emissions ( E + F [next page])/production volume) as a productivity indicator. In FY2015 waste per unit of production was 31.5 t/billion yen (domestic waste emissions/production), which is an improvement over 40.8 t/billion yen in FY2010. This reduction was achieved in part thanks to productivity gains made by implementing the Production 21 Activities, which set out to create a resilient production system in terms of quality, cost, delivery, and other factors. It was also the result of a reduction in waste volume through the extraction of valuable materials such as waste plastic and waste oil.
We use “zero emissions” as the indicator for the promotion of recycling undesired materials. Zero emissions represents an effort to reduce the landfill waste amount ( J + K [next page])/undesired materi-als production volume A [next page] to 0.5% or less; the rate for the group overall in FY2015 was 0.06%, maintaining the same figure as in the previous year. At present, 66 of our domestic manufacturing sites have achieved zero emissions.

DNP Group Environmental Report 2016 27
3 Building a Recycling Society
Undesired materialsproduction volume
303,600 t (100%)
Valuable waste233,000 t
(76.7%)
Materialsrecycled asresources31,700 t(10.4%)
Volumeof thermalrecycling
7,200 t(2.4%)
Interimwaste
processingoutsourced
7,000 t(2.3%)
Finaldisposalvolume(direct)100 t
(0.0%)
Finaldisposalvolume
(indirect)100 t
(0.0%)
Volumeoutsourced
Totalmaterials
input volume2,056,600 t
Waste notsubject to on-siteinterim processing40,400 t (13.3%)
Waste70,600 t(23.3%)
Wastesubject to on-siteinterim processing
30,200 t (9.9%)
Waste afteron-site
interim processing 5,600 t (1.8%)
a
G
A
CB
D
FE
H I
K
J
paper waste 65%
paper waste 83%
metal 1%
sludge 2%
waste oil 14%
waste plastic 8%
liquid waste 72%
other 26%
sludge 24%
waste plastic 32%
liquid waste 18%
metal 3%
waste oil 4%
liquid waste 2%waste plastic 7%
other 10%
sludge 26%
waste oil 7%
paper waste 5%
waste plastic 43%
liquid waste 9%
other 15%
residue 5%
sludge 10%
waste oil 10%
liquid waste 14%
paper waste 4%
waste plastic 42%
other 22%
sludge 11%
waste oil 10%
liquid waste 4%
paper waste 5%
waste plastic 48%
sludge 57%
other 1% paper waste 5%
waste plastic 37%
metal 2%
sludge 6%
waste plastic 16%
liquid waste 4%
waste oil 5%
other 2%
other 1%
other 3%
B
D
FE +
HG +
A
I
C
KJ +
Breakdown of Generated Waste Volume
DNP Technopack’s Sayama Plant No.2 manufactures items familiar to everyone—paper cups for food and beverages.
The aim of the plant is to contribute to the advancement of the DNP Group and society by developing and manufacturing paper-based products. The plant’s waste reduction initiatives began with setting a medium-term improvement plan based on an analysis of the current situation and the implementation of thorough sorting. Efforts have extended to the investigation of why certain things cannot be recycled and eliminating those causes. It is often said that “sorting creates resources and mixing creates garbage.” In order to overcome obstacles to sorting in the physical environment, we assembled all office and floor workers together, including those from related on-site companies, to perform simulations and verifications. These activities allowed us to resolve key issues, leading to the sale of the recycled materials and the restructuring of the sorting/recovery channels. We have been able to reduce the final waste disposal amount by 90% from 2010 as the base year, representing an annual reduction of about 1,200 tons each year, successfully removing the plant from a government list of large-scale producers of industrial waste. We will continue reducing all forms of waste, pursuing zero emissions, and working to reduce loss as important environmental efforts to benefit society, while fulfilling our responsibility to supply products.
Sayama Plant No. 2, DNP TechnopackShuichi Tsunoda,General Affairs Dept.

DNP Group Environmental Report 2016 28
3 Building a Recycling Society
×0.035×0.35
83.5 1,327
77.7 1,498
75.6 1,283
78.1 1,323
80.6 1,356
1,61783.5
2010
2011
2012
2013
2014
2015
Amount of waste paper collected (Unit: tons)
Used paper collection rate (Unit: %)
Bar graph
Line graph
×0.004
12,0008,000 16,0004,0000
16,700
16,000
15,300
14,000
13,200
11,900
2010
2011
2012
2013
2014
2015
Waste paper collectionGeneralwaste
Waste papercollection +
general wasteamount
Number ofsitesCardboard Magazines Newspapers High quality
paper
336 874 29 88 262 1,589 34
337 995 38 129 431 1,929 49
225 886 37 135 413 1,696 55
235 919 33 136 370 1,693 58
182 1,003 30 141 326 1,682 60
204 1,234 29 150 320 1,937 62
Note: Hokkaido Coca-Cola Bottling and DNP Fine Chemicals use water in products.
Waterconsumption11,900,000 m³
Flow through for processes thatuse the water recycling system
401,700,000 m³
Evaporation 2,060,000 m³
INP
UT
OU
TP
UT
Product240,000 m³
Wastewater9,700,000 m³
Flow through for processes that donot use the water recycling system
9,980,000 m³
0 200,000 400,000 600,000 12,0008,0004,0000
401,700
2010
2011
2012
2013
2014
2015
519,400 10,800
509,700
455,500
8,450
8,490
435,370 9,500
417,710 7,300
14,600
Domestic water use (Unit: 1,000 m³)
Recycled water use (Unit: 1,000 m³) Use of rainwater in office buildings, etc. (Unit: m³)
Waste paper collection: Waste paper collection/{waste paper collection + general waste amount (excluding cans, bottles, and garbage)} × 100
Recycled water: The total volume of water that flows through the heat exchange or cleaning equipment in our closed-cycle system in one year.
Use of Recycled Resources
• Office Paper RecyclingThe business of the DNP Group is closely connected to paper, and we have been separating and collecting paper at our offices for some time. In FY2015, waste paper was collected at 62 of 172 eligible offices, primarily large-scale offices, for a recycling rate of 83.5%, exceeding our target of 70%.
• Use of Recycled WaterWe are working hard to conserve water resources by promoting a closed-loop system in which water is recycled and reused instead of released. In this way we have been able to cut down on the high volume of water required for cleaning our products, air conditioning, and heating and cooling production machinery. We used 401.7 million cubic meters of recycled water in FY2015, about 35.0 times the amount of pipe water we used.
We are also making effective use of rainwater in our office buildings and other sites. In FY2015 we used 14,600 cubic meters of rainwater for toilet flushing and the watering of grounds.
Water Input-Output
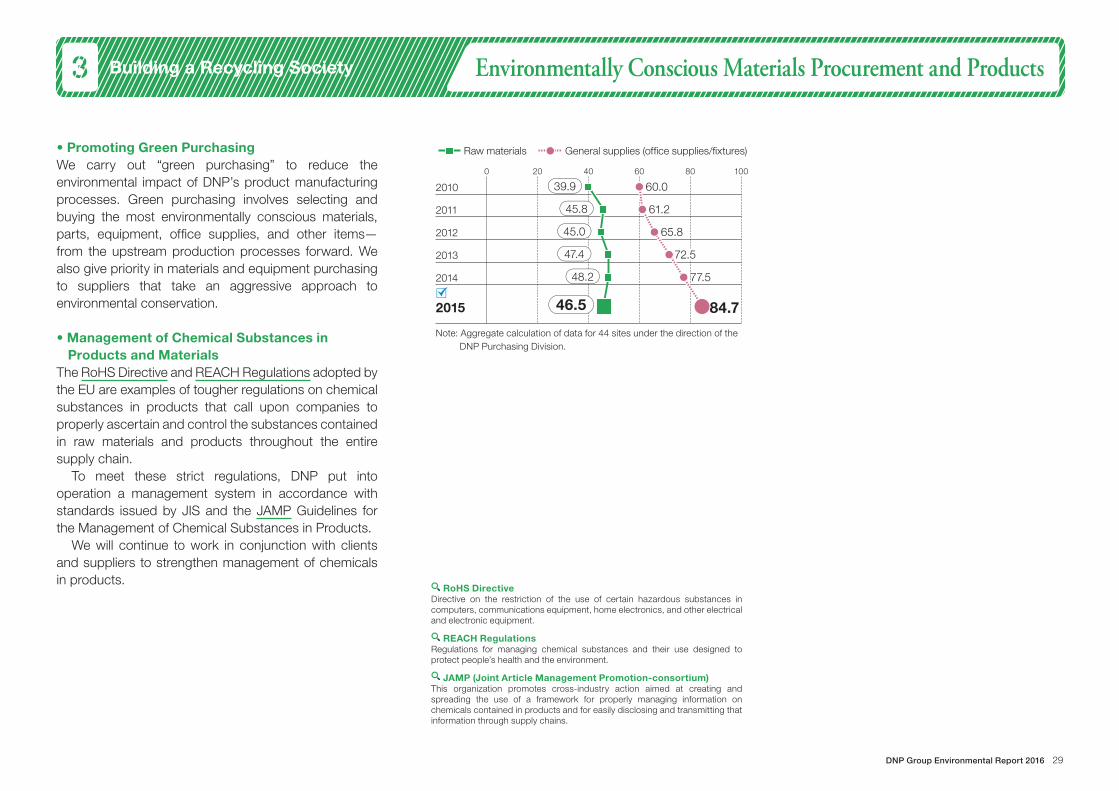
DNP Group Environmental Report 2016 29
3 Building a Recycling Society
0 20 40 60 80 100
×0.675
Raw materials General supplies (office supplies/fixtures)
39.9 60.0
45.8 61.2
45.0 65.8
72.5
84.746.5
2010
2011
2012
2013
2014
2015
Note: Aggregate calculation of data for 44 sites under the direction of the DNP Purchasing Division.
47.4
77.548.2
Environmentally Conscious Materials Procurement and Products
• Promoting Green PurchasingWe carry out “green purchasing” to reduce the environmental impact of DNP’s product manufacturing processes. Green purchasing involves selecting and buying the most environmentally conscious materials, parts, equipment, office supplies, and other items—from the upstream production processes forward. We also give priority in materials and equipment purchasing to suppliers that take an aggressive approach to environmental conservation.
• Management of Chemical Substances in Products and Materials
The RoHS Directive and REACH Regulations adopted by the EU are examples of tougher regulations on chemical substances in products that call upon companies to properly ascertain and control the substances contained in raw materials and products throughout the entire supply chain.
To meet these strict regulations, DNP put into operation a management system in accordance with standards issued by JIS and the JAMP Guidelines for the Management of Chemical Substances in Products.
We will continue to work in conjunction with clients and suppliers to strengthen management of chemicals in products.
RoHS DirectiveDirective on the restriction of the use of certain hazardous substances in computers, communications equipment, home electronics, and other electrical and electronic equipment.
REACH RegulationsRegulations for managing chemical substances and their use designed to protect people’s health and the environment.
JAMP (Joint Article Management Promotion-consortium)This organization promotes cross-industry action aimed at creating and spreading the use of a framework for properly managing information on chemicals contained in products and for easily disclosing and transmitting that information through supply chains.

DNP Group Environmental Report 2016 30
3 Building a Recycling Society
×0.024
200.8155.2 106.4 16.4
179.6279.3 96.2 15.7
176.348.7 101.2 43.6
318.0
336.0
355.7
369.8
478.8
570.8
2010
2011
2012
2013
2014
2015
Total sales From left Information Communication Lifestyle and Industrial Supplies Electronics Other
129.332.2 117.0 39.5
144.638.3 107.0 46.1
163.040.3 107.9 44.5
Super
Eco-Products
Eco-Products
*1 According to DNP testing: Maximum value from measurements taken between 9:00 a.m. and 6:00 p.m. on June 5, 2015*2 According to DNP testing: Measurements taken between 9:00 a.m. and 6:00 p.m. on July 21, 2014
Environmentally Conscious Products and Services
At DNP we have created the Environmentally Conscious Products and Services Development Guidelines to direct from the design stage the creation of environmentally conscious products, so as to reduce the environmental impact of our products throughout their lifecycle. To develop more eco-friendly products and services, in 2013 we introduced an in-house point rating system for products and services, according to which certain products earn the designation “Super Eco-Product” or “Eco-Product.”
We aim to increase sales of environmentally conscious products and services and expand the number of Super Eco-Products we offer, as well as further reducing the environmental impact of our products and services in the future.
DNP’s Environmentally Conscious Products and Services
Sales of environmentally conscious products and services (Unit: billion yen)
DNP Lighting Film
By simply applying to window glass, the film has an internal structure that reflects and disperses natural light coming in through a window toward the ceiling to brighten an entire room. Applied to north-facing windows with poor sunlight exposure, room brightness is doubled,*1 reducing energy consumption (electricity bill) for lighting by 13%.*2
• Development and Sales of Environmentally Conscious Products and Services
Sales of environmentally conscious products and services reached 570.8 billion yen in FY2015 and have exceeded FY2015 targets.
Thirty-five products have so far been designated as Super Eco-Products as of March 2016. DNP intends to continue developing more of such environmentally conscious products and services.
LifecycleThis covers every aspect of the lifetime of a product or service, from the point where the material resources that go into its manufacture are extracted from the Earth through production, distribution, use, and finally to when any waste is returned to the Earth.

DNP Group Environmental Report 2016 31
3 Building a Recycling Society
ReusabilityResource and energy conservation, reduction of GHG emissions
Recyclability
Sustainable use of resourcesReduction of environmental pollutants
Use of recycled materials, etc.
Long-term usability
Ease of treatment and disposal Making environmental burden visible and taking into consideration biodiversity
Supporting and promoting environment education and awareness
Elimination of ozone layer-damaging substances, heavy metals, volatile organic compounds, and prevention of release into the environment of nitrous oxides and other substances.
In the case of sites and parts, considerations regarding disassembly, cleaning, and refilling; establishment of a collection and reuse system that is easy for the purchaser to use.
Reduce the use of metals and fossil fuels. Promote energy-conserving products and systems.
Are the materials used in the product easy to recycle? Does the design allow for easy breakdown, disassembly, and separation of materials? Is there a collection and recycling system that is easy for the purchaser to use?
Utilize natural resources in a sustainable way.
Use as many co l lec ted and recyc led materials and parts as possible.
Consider the ease of repair and par ts replacement, length of maintenance and repair service, and the expandability of functions.
Attempt to place as little burden as possible on incinerator facilities and landfill sites.
Making visible any burden that should be reduced, and aiming to protect biodiversity.
Helping to create a sustainable society.
Example product • Peel-off Shipping Labels
These are shipping labels that are easily peeled off of packing paper or cardboard. The labels are one-ply, saving paper, and they make the recycling of cardboard and other packaging easy because they peel off cleanly.
Example product • Refill Pouch with Spout
Our Elbow Pouch is a refill-use pouch with improved opening and pouring features. It is useful in saving bottle resources, and post-refilling volume is reduced.
Example product• Environmentally Conscious Calendars
These calendars are made with recycled paper and low environmental impact ink. No metal or plastic need be removed post-use, because neither is used in their production.
Example product • Biomass Plastic Packaging Material
These film products are made partially from plant-based materials. Their production and use will help reduce emissions of CO2, a greenhouse gas, and the use of petroleum, a depleting natural resource.
Example product • Paper Carton Using Recycled Paper
These are printed materials that use compos-ites of used paper, such as used magazines and newspapers. Not only do they require fewer pa-per resources, but the use of low environmental impact soy ink and non-VOC ink is increasing.
Example product • Decorative Sheeting
Safmalle is our line of olefin-based decorative sheets for construction or decorative use, which meet the need for healthy, hygienic, and safe living space creation.
Example product • Transparent Vapor Deposition Film
This is a packaging-use clear cling film which cuts dioxin use because it is non-PVC. It is widely used in the packaging of food, toiletries, or daily items requiring a barrier.
Example product • Ultra Lightweight Injection-Molded Cup
The lightest injection-molded cup in the industry. The Carbon Footprint (CFP) Mark was acquired for the cup as an intermediate product. The lightened weight directly conveys the reduced use of resin.
Example product • Energy-Saving Apps and Other Services
This smartphone app helps you to check the use of electricity in your home to raise awareness of saving electricity.
52
6
31
7
4
89 10
Example product • BM Color Filters
These are color filters using a black matrix (BM) made of resin instead of metal. Development of this product has resulted in reduced environmental impact and cost.
BM
Guidelines for Developing Environmentally Conscious Products and Services with Example Products

DNP Group Environmental Report 2016 32
3 Building a Recycling Society Environmental Label Certification
We have earned environmental labeling certification such as CoC (Chain of Custody) certification and the Japan Environment Association’s Eco Mark. We are working to expand the sale of products with this labeling, so that their packaging and advertising can serve as means to educate consumers properly about the environmental aspects of our goods and services.
• Main Certification Acquisition Results
Eco Mark(Type 1 Environmental Label)
This environmental label is attached to products recognized as having low environmental impact throughout their lifecycle, from production through disposal, and as being useful to environmental conservation.
Acquired for mugs made of recycled
plasticReceived for
“construction use album” using used
paper
CoC Certification
CoC (Chain of Custody) This is a certificate of control throughout each stage of processing and distribution, by which wood products and materials (including paper products) taken from FSC-certified forests contain a fixed percentage or greater of certified material, and have no wood products or materials derived from illegally harvested sources mixed in.
Acquired by a total of 12 business units
Certification Type Acquired by*1 Acquisition Date*2
RegistrationOrganization
FSC-CoC
DNP Trading Dec. 03 SGS
Packaging Operations Dec. 05 SGS
Ichigaya Publication Printing Operations Mar. 06 SGS
DNP Multi Print Apr. 07 SGS
Tien Wah Press (Pte.) Ltd. May 08 DNV
Information Solutions Operations Aug. 08 SGS
Lifestyle Materials Operations Aug. 09 SGS
DNP Shikoku Dec. 11 SGS
DNP SP Tech May 14 JIA
PEFC-CoC
Packaging Operations Jan. 04 JIA
DNP Trading Jan. 08 SGS
Ichigaya Publication Printing Operations Mar. 11 SGS
Lifestyle Materials Operations Nov. 11 SGS
*1 Organizations and the names used for them as of March 31, 2016.*2 Date of initial registration. However, this is the date that Information Solutions Operations (August 2003) switched to multisite certification.
CoC Certification
Environmental LabelingEnvironmental Labeling: This is broadly divided into three types: Type 1, such as the Eco Mark (third party certification); Type 2, in which a company itself makes the declaration (self-declaration); and Type 3, in which environmental information is provided on the label, such as the EcoLeaf (environmental information labeling), with each having specifications under ISO or JIS. Reference information: “Environmental Labeling Database” of the Central Environment Council of the Ministry of the Environment
FSCForest Stewardship Council
PEFCProgramme for theEndorsement of ForestCertification Schemes
SGSSGS Japan
DNVDet Norske Veritas (Norway)
JIAJapan Gas AppliancesAssociation
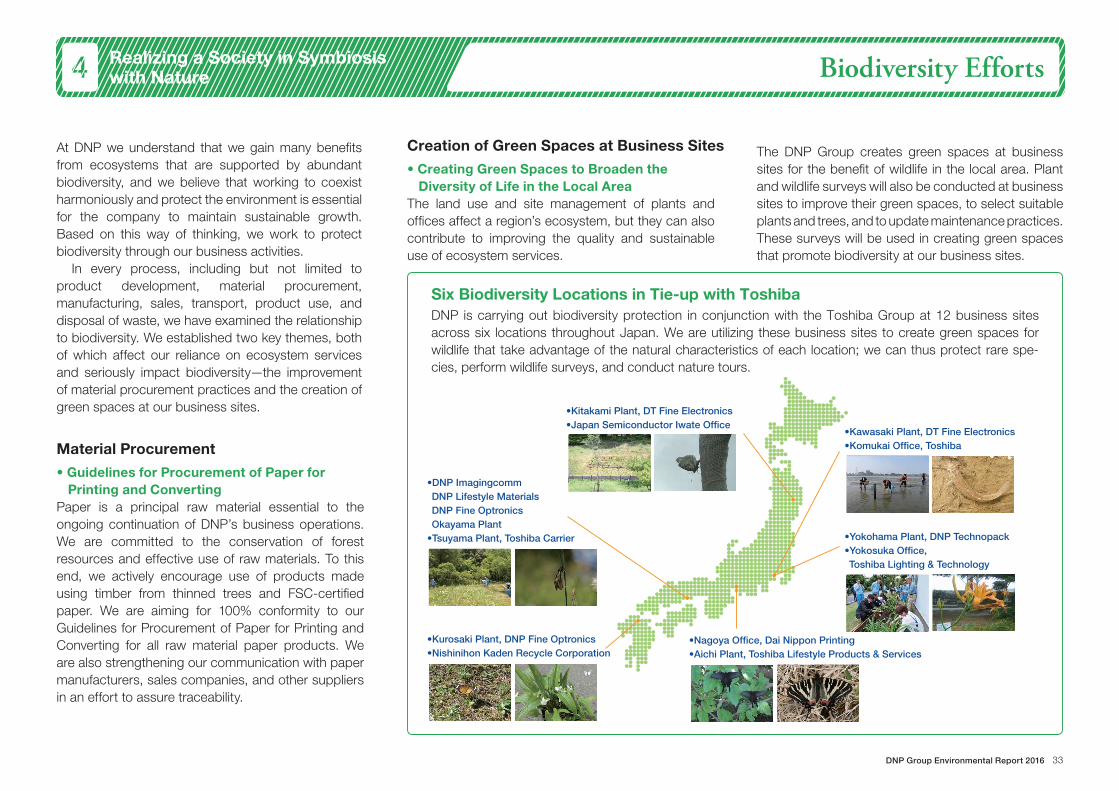
DNP Group Environmental Report 2016 33
4 Realizing a Society in Symbiosis with Nature
•DNP ImagingcommDNP Lifestyle MaterialsDNP Fine OptronicsOkayama Plant
•Tsuyama Plant, Toshiba Carrier
•Kurosaki Plant, DNP Fine Optronics•Nishinihon Kaden Recycle Corporation
•Yokohama Plant, DNP Technopack•Yokosuka Office, Toshiba Lighting & Technology
•Nagoya Office, Dai Nippon Printing•Aichi Plant, Toshiba Lifestyle Products & Services
•Kitakami Plant, DT Fine Electronics•Japan Semiconductor Iwate Office
•Kawasaki Plant, DT Fine Electronics•Komukai Office, Toshiba
Six Biodiversity Locations in Tie-up with ToshibaDNP is carrying out biodiversity protection in conjunction with the Toshiba Group at 12 business sites across six locations throughout Japan. We are utilizing these business sites to create green spaces for wildlife that take advantage of the natural characteristics of each location; we can thus protect rare spe-cies, perform wildlife surveys, and conduct nature tours.
Biodiversity Efforts
• Creating Green Spaces to Broaden the Diversity of Life in the Local Area
The land use and site management of plants and offices affect a region’s ecosystem, but they can also contribute to improving the quality and sustainable use of ecosystem services.
• Guidelines for Procurement of Paper for Printing and Converting
Paper is a principal raw material essential to the ongoing continuation of DNP’s business operations. We are committed to the conservation of forest resources and effective use of raw materials. To this end, we actively encourage use of products made using timber from thinned trees and FSC-certified paper. We are aiming for 100% conformity to our Guidelines for Procurement of Paper for Printing and Converting for all raw material paper products. We are also strengthening our communication with paper manufacturers, sales companies, and other suppliers in an effort to assure traceability.
Creation of Green Spaces at Business Sites
Material Procurement
The DNP Group creates green spaces at business sites for the benefit of wildlife in the local area. Plant and wildlife surveys will also be conducted at business sites to improve their green spaces, to select suitable plants and trees, and to update maintenance practices. These surveys will be used in creating green spaces that promote biodiversity at our business sites.
At DNP we understand that we gain many benefits from ecosystems that are supported by abundant biodiversity, and we believe that working to coexist harmoniously and protect the environment is essential for the company to maintain sustainable growth. Based on this way of thinking, we work to protect biodiversity through our business activities.
In every process, including but not limited to product development, material procurement, manufacturing, sales, transport, product use, and disposal of waste, we have examined the relationship to biodiversity. We established two key themes, both of which affect our reliance on ecosystem services and seriously impact biodiversity—the improvement of material procurement practices and the creation of green spaces at our business sites.
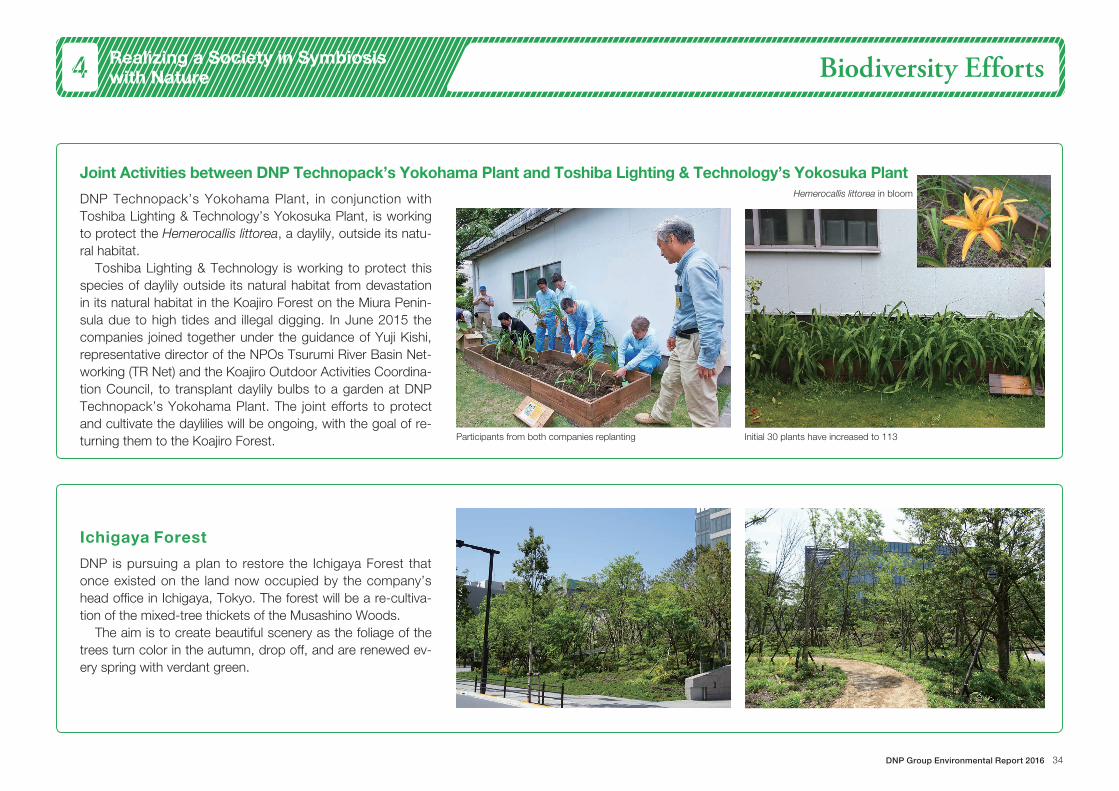
DNP Group Environmental Report 2016 34
4 Realizing a Society in Symbiosis with Nature
Joint Activities between DNP Technopack’s Yokohama Plant and Toshiba Lighting & Technology’s Yokosuka Plant
Ichigaya Forest
DNP Technopack’s Yokohama Plant, in conjunction with Toshiba Lighting & Technology’s Yokosuka Plant, is working to protect the Hemerocallis littorea, a daylily, outside its natu-ral habitat.
Toshiba Lighting & Technology is working to protect this species of daylily outside its natural habitat from devastation in its natural habitat in the Koajiro Forest on the Miura Penin-sula due to high tides and illegal digging. In June 2015 the companies joined together under the guidance of Yuji Kishi, representative director of the NPOs Tsurumi River Basin Net-working (TR Net) and the Koajiro Outdoor Activities Coordina-tion Council, to transplant daylily bulbs to a garden at DNP Technopack’s Yokohama Plant. The joint efforts to protect and cultivate the daylilies will be ongoing, with the goal of re-turning them to the Koajiro Forest.
DNP is pursuing a plan to restore the Ichigaya Forest that once existed on the land now occupied by the company’s head office in Ichigaya, Tokyo. The forest will be a re-cultiva-tion of the mixed-tree thickets of the Musashino Woods.
The aim is to create beautiful scenery as the foliage of the trees turn color in the autumn, drop off, and are renewed ev-ery spring with verdant green.
Participants from both companies replanting Initial 30 plants have increased to 113
Hemerocallis littorea in bloom
Biodiversity Efforts

DNP Group Environmental Report 2016 35
5 Environmental Accounting Target and Calculation Items
Targets1. As an environmental management tool for
the DNP Group(1) To evaluate and confirm the effectiveness of
environmental conservation activities(2) To determine the cost of and investment in
individual conservation measures and the Group’s overall environmental activities
(3) To monitor and evaluate the effects and achievements of activities performed throughout the year to ensure continuous improvement in our environmental performance
2. As a tool for communicating with society(1) To publicly announce the cost-benefit relationship
of environmental conservation efforts(2) To reflect the opinions of shareholders,
business partners, local residents, and others in environmental conservation activities
Environmental Accounting Calculation Standards
(1) Period covered: April 1, 2015 through March 31, 2016 (Environmental facilities are those considered as of March 31, 2016)
(2) Scope of coverage: At DNP and among its domestic group companies subject to consolidated financial accounting, 26 domestic manufacturers and one distribution company (p. 41, 42), plus non-manufacturing sites (three development centers, office buildings, sales offices, etc.). However, newly built plants are included in the capital investment.
(3) Monetary unit: All monetary figures are expressed in millions of yen, rounded off to the nearest million.
(4) Announcement format: We used the format designated in the Ministry of the Environment “Environmental Accounting Guideline” 2005 edition.
(5) Standards for calculation of environmental conservation costs1) Environmental conservation costs include depreciation expenses for investments.2) Personnel costs for full-time workers were calculated at the average labor cost per person, while personnel costs for
workers holding two or more posts were calculated at 1/10 or 1/5 the average personnel cost per person, depending on the worker’s assigned duty.
3) R&D costs are the total costs incurred by our three R&D centers and development departments within each operations field in the development of environmentally conscious products and manufacturing equipment.
(6) Standards for calculation of environmental conservation benefits1) DNP uses energy consumption per unit of sales as an efficiency indicator for the volume of resources (energy and water)
spent on business activities, as well as for the volume of waste materials and CO2 emissions.2) Benefits apply to all volatile organic compounds (VOCs), including chemical substances subject to the PRTR Law among
the atmospheric environmental pollutant emissions volume corresponding to business area costs.3) The benefit related to goods produced by business activities was reduction of the volume of greenhouse gases emitted
from all products shipped. Specifically, of the GHG emissions calculated according to the Scope 3 standards listed on p. 19, the categories used were: part of Category 4 (Upstream transportation & distribution), Category 9 (Downstream transportation & distribution), Category 10 (Processing of sold products), Category 11 (Use of sold products), and Category 12 (End of life treatment of sold products).
4) The benefit corresponding to the transportation environmental impact is converted to the energy usage reduction benefit to the shipper at the time the goods, etc., are transported.
(7) Standards for calculation of economic benefit of environmental conservation activities1) The benefit corresponding to resource circulation costs is calculated as the benefit from savings on waste disposal
costs. The amount of reduction is calculated as follows: (Benchmark period unit consumption – unit consumption for current period) × amount of business activity for current period.
2) Amount of business activity is based on domestic consolidated sales.3) Unit consumption is calculated as: waste disposal cost / domestic consolidated sales.4) The benchmark period unit consumption is the gross average value for the three-year period up to and including the
previous term.

DNP Group Environmental Report 2016 36
5 Environmental Accounting Table (1) Environmental Conservation Costs(categories corresponding to business activities)
CategoryInvestment Expense
Details of major effortsPage(s) on which data
is listedFY2014 FY2015 FY2014 FY2015
(1) Business area costs
1) Pollution prevention costs 634 611 2,057 2,023 VOC collection and disposal equipment, wastewater treatment facility 23-25
2) Global environmental conservation costs 256 463 395 374 Introduction of solar power generation equipment, conversion to inverters, waste
heat recovery, switching to energy-saving lighting20-22
3) Resource circulation costs 92 141 1,595 1,620 Furnace improvements, separation recycling, zero emissions (conversion to RPF/cement ingredients), resource recycling
26-28
(Total business area costs) 982 1,215 4,047 4,017
(2) Up/downstream costs 0 0 119 108 Container and packaging recycling expense burden, recycling system development
30-32
(3) Administration costs 3 0 2,183 2,206 ISO 14001 inspection and registration costs, environmental education costs, environmental report composition costs
8-14, 32, 44
(4) R&D costs 0 0 2,718 2,084 Research and development into environmentally conscious products and production methods
29-31
(5) Social activities costs 0 0 14 14 Environmental conservation of areas outside plant compounds, biodiversity conservation, support for activities of environmental conservation groups
33-34
(6) Environmental remediation 0 0 0 0 9-12
Total 985 1,215 9,081 8,430
● Environmental conservation costs to total costs ratio
Category Consolidatedtotal costs Costs Ratio Details of major environmental conservation costs
Page(s) onwhich data
is listed
Investment of current period 97,200 1,215 1.25% Introduction of solar power generation equipment, conversion to inverters, etc. 20
R&D cost of current period 31,826 2,084 6.55% Development of photovoltaic and fuel cell parts, development of products free of toxic substances, process loss reduction, etc.
29-31
FY2015 Assessments of Performance Data of Environmental AccountingEnvironmental Conservation Costs and Environmental Conservation Measures(1) The amount of capital invested in equipment to conserve the environment was increased from the previous fiscal year with the renewal of solar power generation
equipment, VOC treatment facilities and energy-saving equipment.(2) Expenses were reduced from the previous fiscal year owing to a review of development themes.

DNP Group Environmental Report 2016 37
5 Environmental Accounting Table (2) Environmental Conservation Benefits (1)
(1) Environmental conservation benefit related to resources input into business activities
Category ofenvironmental
conservation benefitCategory of indicator showing benefit
Indicator valuesRemarks
Page(s) onwhich data
is listedFY2014 FY2015 Difference
1) Benefit arising from supplied resources
Total energy inputvolume
Energy consumption (TJ) 19,770 19,000* -770 20-22
Unit consumption per domestic sales for theabove (TJ/billion yen)
16.0 16.2 0.2 Energy consumed per billion yen of domesticsales 20-22
Input volume ofwater
Water usage (1,000 m3) 13,200 11,900 -1,300 28
Unit consumption per domestic sales for theabove (1,000 m3/billion yen)
10.7 9.7 -1.0 Water usage per billion yen of domestic sales 28
Input volume ofmain raw materials
Supplied amount (1,000 tons) 2,098 2,057 -41 27
Amount of undesired materials generated/supplied (%)
15.0 14.8 -0.2 Ratio of unwanted materials to main raw materials 27
2) Environmental conservation benefit related to waste or environmental impact originating from business activities
Emissions to the air
SOx emissions (tons) 11 6.7 -4.3 17, 23
NOx emissions (tons) 657 657 0 17, 23
Environmental pollutant emissions volume (tons) 4,757 4,581 -176 VOC emissions volume 23
Water qualityCOD discharge (tons) 34.7 34.7 0 17, 24
Emissions of environmental pollutants(PRTR-listed substances) (tons)
0.0 0.0 0 There have been no emissions into public waters since FY2010 25
Waste emissionvolume
Generated undesired materials (1,000 tons) 314 304 -10 Including undesired materials other than main raw materials 26-27
Discharged waste (1,000 tons) 46.4 45.9 -0.5 26-27
Unit consumption per domestic sales for theabove (tons/billion yen)
37.7 37.6 -0.1 Discharged waste per billion yen of domestic sales 26-27
Recycle rate (%) 99.8 99.6 -0.2 By category: paper (100%), waste plastics (99.5%), metals (99.5%), and glass (98.1%) 26-27
Emissions of environmental pollutants(PRTR-listed substances) (tons)
960 840 -120 Total for 28 substances reported 25
Volume ofgreenhouse gasemission
Emissions of greenhouse gases (1,000 t-CO2) 924 888 -36 20-21
Unit consumption per domestic sales for theabove (tons/billion yen)
750 730 -20 Emissions per billion yen of domestic sales 20-21
*Corrected from 19,770 TJ in October 2016.

DNP Group Environmental Report 2016 38
5 Environmental Accounting Table (2) Environmental Conservation Benefits (2) (3)
(2) Environmental conservation benefit related to goods and services produced by business activities
Category ofenvironmental
conservation benefit
Category of indicatorshowing benefit
Indicator valuesRemarks
Page(s) onwhich data
is listedFY2014 FY2015 Difference
1) Benefit related to goods produced by business activities
CO2 emissions afterproduct shipment
CO2 emissions(1,000 t-CO2) 1,539 1,513 -26 19, 29-32
CO2 emissions / domestic sales(1,000 t-CO2/billion yen) 1.25 1.24 -0.01 CO2 emissions per billion yen of domestic sales 19, 29-32
(3) Other environmental conservation benefit
Category of indicator showing benefit FY2014 FY2015 Difference RemarksPage(s) onwhich data
is listed
Benefit related to the environmental impact of transportation
Energy usage amount during shipment of goods (kl) 22,180 21,840 -340 16, 22
Energy usage amount during transport / gross sales (kl/billion yen) 15.2 15.0 -0.2 Energy usage amount per billion yen of consolidated sales 16, 22

DNP Group Environmental Report 2016 39
5 Environmental Accounting Table (3) Economic Benefits of EnvironmentalConservation Activities
Economic benefits of environmentalconservation activities
AmountRemarks
Page(s) onwhich data
is listedFY2014 FY2015 Difference
(1) Increased sales 1) Economic benefit of R&D costs
Sales of environmentally conscious products 478,800 570,800 92,000 19% year-on-year increase in sales of environmentally conscious products 16, 30-32
(2) Increased income 2) Benefit of resource recycling costs
Income from recycling undesired materials 3,193 3,056 -137 Shift toward valuable materials such as waste plastics, etc. 26-27
(3) Cost saving 3) Benefit of resource recycling costs
Saving disposal costs by resource conservation 107 -8 -115 Worsened unit consumption owing to reduced amounts of valuable materials and stagnant domestic sales prices
26-27
FY2015 Assessments of Performance Data of Environmental Accounting
Environmental Conservation Benefits(1) Water usage and greenhouse gas emissions were again reduced from the previous year thanks to energy-saving and water-saving efforts and the effects of factory
streamlining. This resulted in an improvement in unit consumption.(2) Emissions of VOCs into the air were reduced from the previous year as a result of renewal and continued maintenance of VOC collection and removal equipment and
reductions in solvent use amounts. Waste emissions fell due to greater conversion into valuable materials, resulting in an improvement in unit consumption over the previous year. Amounts of undesired materials generated and materials input worsened owing to changes in product composition.
(3) Regarding the benefits related to goods produced by business activities, increased transport efficiency resulted in an improvement in unit consumption. Environmental burden from transport was also reined in.
Economic Benefits of Environmental Conservation Activities(1) Sales of environmentally conscious products gained 92.0 billion yen year-on-year, reaching 570.8 billion yen and surpassing the FY2015 sales target of 400 billion yen.(2) Business income from recycling undesired materials fell from the previous fiscal year due to worsening of the market environment. Consequentially, the economic benefits
calculated according to the basis outlined in (7) of the “Environmental Accounting Calculation Bases” on p. 35, i.e. “saving disposal costs by resource conservation,” were negative.
Ongoing Efforts
(1) Make further improvements in eco-efficiency through Production 21 Activities.
(2) Improve the use ratio of recyclable energy while systematically promoting replacement with energy-saving equipment to reduce greenhouse gas emissions.
DNP Group Environmental Report 2016 40
Results of Efforts
FY1972 Establishes the Environment Department within the head office to promote pollution prevention measures and communication with local residents
FY1990 Makes new efforts to deal with global environmental issues by establishing the Eco-Plan Promotion Office within the Environment Division
FY1992 Establishes the DNP Group Corporate Pledge and Code of Conduct for DNP Group Employees
Establishes the Eco-Plan Promotion Targets, the elaborated voluntary plan based on the Environmental Declaration of the Code of Conduct, and starts activities by 4 sub-committees
FY1993 Starts the Eco-Report System, which is part of the DNP Group’s environmental management system
FY1994 Remodels and expands the Environment Department into the Environment & Product Liability Department to strengthen our efforts toward environmental issues, including taking responsibility for the disposal of products we produce
FY1995 DNP wins the International Trade and Industry Minister’s Prize in the “4th Grand Prize for the Global Environment Award,” which commends companies and groups that contribute to the conservation of the global environment (The award was established in 1991 by the Japan Industrial Journal and the Fuji Sankei Communications Group, with special support by WWF Japan and sponsorship by the Ministry of the Environment, the Ministry of Economy, Trade and Industry, and the Japan Federation of Economic Organizations)
FY1996 Begins performing Eco-Audits, the internal environmental audit performed by the Eco-Plan Promotion Office to upgrade the Eco-Report System
FY1997 Okayama Plant, Information Media Supplies Operations becomes the first in the printing industry to acquire ISO 14001 certification
FY1998 Mihara Plant, Display Components Operations acquires ISO 14001 certification
Publishes the DNP Group Environmental Activity Report
FY2000 The Eco-Plan Promotion Office is dismantled and replaced with the DNP Environmental Committee to strengthen the system for promoting environmental activitiesDNP Facility Services becomes the first in the world to be certified for its comprehensive system with quality, environment, office safety, and HACCP
Okayama Plant, Decorative Interiors Operations acquires ISO 14001 certification
FY2001 DNP Tokai, and Sayama Plant, DNP Technopack acquire ISO 14001 certification
FY2002 DNP Tokai acquires FSC-CoC certification
Acquisition of ISO 14001 certification by: Kobe Plant, Decorative Interiors Operations; The Inctec (Tokyo, Kansai, and Utsunomiya Plants); Ushiku Plant, BF Operations; DNP Technopack Tokai; Singapore Plant, Tien Wah Press; Chikugo Plant, DNP Nishi Nippon; Kyoto Plant, Electronics Devices Operations; Sayama Plant, Information Media Supplies Operations; Ono Plant, DNP Media Create Kansai
FY2003 Environmental Report Division receives the “6th Environmental Report Grand Prize” for superior reporting
Acquisition of ISO 14001 certification by: Advanced Colortech; Tokyo Plant, Decorative Interiors Operations; Kamifukuoka Plant, Electronics Devices OperationsCommercial Printing Operations, DNP Media Create Kansai, and DNP Trading acquire FSC-CoC certification, Packaging Operations acquires PEFC-CoC certificationTwo types of fused thermal transfer materials of the Information Media Supplies Operations receive EPD “Type III” environmental labeling certification and registration
FY2004 DNP wins the Minister for the Environment’s Prize in the “14th Grand Prize for the Global Environment Award”
The “7th Environmental Report Prize” awarded for excellence
Fukuoka Plant, DNP Nishi Nippon; DNP Logistics; DNP Ellio (Tokyo and Osaka Plants); and Warabi Plant, BF Operations acquire ISO 14001 certification
Eco-Report System implemented at overseas sites
FY2005 “8th Environmental Report Prize / Sustainability Report Prize” awarded for excellence
DNP Data Techno Kansai; Johor Bahru Plant, Tien Wah Press; Otone Plant, Display Products Operations; and DNP Techno Polymer (Kashiwa and Kansai Plants) acquire ISO 14001 certificationIchigaya Publication Printing Operations; DNP Tohoku; and Yokohama Plant, Packaging Operations acquire FSC-CoC certification, DNP Tokai acquires PEFC-CoC certification
FY2006 DNP Photomask Europe; Akabane Office, DNP Logistics; DNP Techno Film (Kashiwa Plant and Izumizaki Plant); and DNP IMS Odawara acquire ISO 14001 certification
FY2007 “PRTR 2007 Awards” PRTR Honorable Mention (Tsuruse Plant)
DNP Gotanda Building wins the “Green Grand Prize” in the Shinagawa-ku “Green Award System”
DNP Technopack Yokohama (Yokohama Plant) and DNP Fine Chemicals acquire ISO 14001 certification
DNP Hokkaido and DNP Data Techno Kansai acquire FSC-CoC certification, DNP Hokkaido and DNP Trading acquire PEFC-CoC certification
FY2008 Izumizaki Plant, DNP Technopack; Kasaoka Plant, DNP Fine Chemicals; Okayama Plant, Opto-Materials Operations acquire ISO 14001 certification
IPS Operations and DNP Media Create Kansai acquire PEFC-CoC certification
FY2009 Mihara Plant, Opto-Materials Operations; DNP Indonesia (Pulo Gadung / Karawang); Kyoto Plant, Electronic Devices Operations; and Shiga Plant, Information Media Supplies Operations acquire ISO 14001 certificationKanto Bureau of Economy, Trade and Industry “Energy Management In Business Superiority Award” (received by Akabane Plant, Commercial Printing Operations)
Lifestyle Materials Operations acquires FSC-CoC certification
FY2010 DNP IMS Odawara receives the Kanagawa Prefecture Environmental Conservation (Air, Water, Soil) Award
Revision of DNP Group Environmental Targets
The DNP Emergent Evolution Forest Hakone Training Center 2 acquires Green Key certification
FY2011 DNP’s independently developed Energy-Saving Total Management System is implemented at 36 Tokyo Electric Power locations
New, leading-edge environmentally conscious plant for manufacturing flexible packaging is built in Kyotanabe
DNP Chubu becomes Ecostage-certified (Stage 1)
Sayama Plant, DNP Technopack Yokohama acquires ISO 14001 certification
DNP Shikoku acquires FSC-CoC certification and Lifestyle Materials Operations acquires PEFC-CoC certification
Reductions in power consumption in the processes of manufacturing photomasks earns DNP the Energy Conservation Grand Prize for excellent energy conservation equipment, Jury’s Special Prize awarded by the Energy Conservation Center, Japan (ECCJ)
FY2012 Guidelines for Procurement of Paper for Printing and Converting are established to protect biodiversity in our business operations, and projects to create green spaces are launched at Okayama Plant and DNP Chubu business sites
Volume of greenhouse gas emissions are announced according to Scope 3 standards
FY2013 Targets for reduction of water usage are set
Green Procurement Guidelines for Chemical Substances are set and management of chemical substances in products is strengthened
FY2014 Climate change prevention targets for FY2030 are set
DNP is selected by CDP’s Forest Program as sector leader in the Industrials & Autos sector
DNP wins a “Prize of Excellence (Judge’s Prize)” at the 18th Environmental Communication Awards
FY2015 DNP Group environmental targets are revised
CDP places DNP on its “A List”
DNP wins a “Prize of Excellence (Judge’s Prize)” at the 19th Environmental Communication Awards Note: Organizations and the names used for them as of that time.

DNP Group Environmental Report 2016 41
26
29, 30, 31, 32, 33, 34, 35
16, 17, 18
1927, 28
3
5
6, 7
1, 2
12 11
4
8, 9, 10
1424, 25
20, 21, 22
13
23
15
Domestic manufacturing sites with required business performance data disclosure (1)
Organizations and the names used for them are current as of March 31, 2016.
Applies to DNP and non-manufacturing sites of all domestic companies in the group that are subject to consolidated financial accounting.
Business segments
● Information Communication
“Other” refers to products that do not fall under the three segments or group companies manufacturing products that span multiple segments.
▲ Lifestyle and Industrial Supplies
■ Electronics
□ Other
*1 As of January 2015, Ichigaya Publication Printing Operations became Publication Printing Operations.*2 As of April 2015, changed segment from Lifestyle and Industrial Supplies to Information Communication.*3 As of April 2015, changed segment from Other to Lifestyle and Industrial Supplies.
Location No. Businesssegment Site Work content
Hokkaido
Higashi-ku, Sapporo 1 ● Sapporo Plant, DNP GraphicaSapporo Plant, DNP Data Techno Printing / bookbinding
Higashi-ku, Sapporo 2 ▲ Sapporo Plant, DNP Technopack Manufacturing of packaging
Kiyota-ku, Sapporo 3 □ Sapporo Plant, Hokkaido Coca-Cola Products Beverage manufacturing
Iwate Kitakami 4 ■ Kitakami Plant, DT Fine Electronics Manufacturing of electronic precision parts
Miyagi Miyagino-ku,Sendai 5 ● Sendai Plant, DNP Graphica Plate-making / printing / bookbinding
Fukushima Izumizaki, NishiShirakawa
6 ▲ Izumizaki Plant, DNP Technopack Manufacturing of packaging
7 ▲ Izumizaki Plant, DNP High-performance Materials Manufacturing of solar cell filler
Tochigi Tochigi
8 ● Utsunomiya Plant, DNP Graphica Printing / bookbinding
9 ▲ Utsunomiya Plant, DNP Technopack Manufacturing of packaging
10 □ DNP Fine Chemicals Utsunomiya Manufacturing of photographic materials and pharmaceuticals
IbarakiUshiku 11 ● Ushiku Plant, DNP Data Techno Manufacturing of various types of smart cards
Tsukuba 12 □ Tsukuba Techno Center, D.N.K. Manufacturing of printing machines and machine tools
Saitama
Higashimatsuyama 13 ● Higashimatsuyama Plant, Oguchi Book Binding & Printing Bookbinding
Shiraoka 14 ● Shiraoka Plant, DNP Book Factory Printing / bookbinding
Kawaguchi 15 ● Kawaguchi Plant, DNP Book Factory Printing
Miyoshi, Iruma
16 ● Tsuruse Plant, Publication Printing Operations*1 Plate-making / printing plate / printing / bookbinding
17 ▲ Tokyo Plant, DNP Lifestyle Materials Plate-making / printing plate / printing / processing
18 ● Miyoshi Plant, Oguchi Book Binding & Printing Bookbinding
Warabi 19 ● Warabi Plant, DNP Data Techno Plate-making / printing / processing
Sayama
20 ▲ Sayama Plant No.1, DNP Technopack Manufacturing of packaging
21 ▲ Sayama Plant No.2, DNP Technopack Manufacturing of packaging
22 ● Sayama Plant, DNP IMS*2 Manufacturing of thermal transfer carbon ribbons and dye-sublimation transfer materials
Fujimino 23 ■ Kamifukuoka Plant, DNP Fine Optronics Manufacturing of electronic precision parts
Kuki24 ● Kuki Plant, Publication Printing Operations*1 Printing plate / printing / bookbinding
25 ■ Saitama Plant, DNP High-performance Materials Manufacturing of electronic parts
Chiba Kashiwa 26 ▲ Kashiwa Plant, DNP Technopack Manufacturing of packaging
Tokyo
Shinjuku-ku27 ● Ichigaya Plant, Publication Printing Operations*1 Plate-making / printing plate / printing /
bookbinding
28 ● Enoki-cho Plant, DNP Graphica Plate-making / printing / bookbinding
Kita-ku
29 □ Kamiya Plant, DNP SP Tech Manufacturing of all types of advertising items
30 ● Akabane Plant, DNP Book Factory Printing
31 ● Akabane Plant, DNP Graphica Plate-making / printing / bookbinding
32 ● Kamiya Plant, DNP Book Factory Bookbinding
33 □ DNP Logistics Packaging / shipping
34 ▲ DNP Hoso*3 Processing filling and packaging
35 ● Kamiya Plant, Information Solutions Operations Printing / bookbinding / processing

DNP Group Environmental Report 2016 42
62 49
45
48
67
60, 61
56, 57, 58 50, 51, 52
6663, 64, 65
5455 46
41
47
59
53
42
44 43
37
36
3839, 40
*1 As of April 2015, changed segment from Lifestyle and Industrial Supplies to Information Communication.
Location No. Businesssegment Site Work content
Kanagawa
Kawasaki 36 ■ Kawasaki Plant, DT Fine Electronics Manufacturing of electronic precision parts
Tsuzuki-ku, Yokohama 37 ▲ Yokohama Plant, DNP Technopack Manufacturing of packaging
Midori-ku, Yokohama 38 □ Tokyo Plant, DNP Fine Chemicals Manufacturing of chemicals, etc.
Odawara39 ▲ Sagami Yoki Manufacturing of laminated tubes
40 ● Odawara Plant, DNP Imagingcomm*1 Photographic materials manufacturing
Aikawa, Aiko 41 ▲ Tokyo Plant, DNP Ellio Printing and processing metal sheets
Ishikawa Hakusan 42 □ Hokuriku Techno Center, D.N.K. Manufacturing of printing machines and machine tools
Gifu Nakatsugawa 43 ▲ Tokai Plant, DNP Technopack Manufacturing of packaging
Aichi Moriyama-ku, Nagoya 44 ● Nagoya Plant, DNP Graphica Plate-making / printing / bookbinding
Mie Kameyama 45 □ DNP Color Techno Kameyama Manufacturing of electronic precision parts
Kyoto
Ukyo-ku, Kyoto 46 ▲ Kyoto Plant, DNP Technopack Manufacturing of packaging
Minami-ku, Kyoto 47 ● Kyoto Plant, DNP Data Techno Manufacturing of various types of smart cards
Kyotanabe 48 ▲ Tanabe Plant, DNP Technopack Manufacturing of packaging
Nara Kawanishi, Shiki 49 ● Nara Plant, DNP Data Techno Manufacturing of various types of smart cards
OsakaNeyagawa
50 ▲ Neyagawa Plant, DNP Technopack Manufacturing of packaging
51 ▲ Osaka Plant, DNP Ellio Printing and processing metal sheets
52 □ Neyagawa Plant, DNP SP Tech Manufacturing of all types of advertising items
Kadoma 53 ● DNP Media Support Manufacturing of magnetic cards
HyogoOno 54 ● Ono Plant, DNP Graphica Printing plate / printing / bookbinding
Himeji 55 ■ DNP Precision Devices Himeji Manufacturing of electronic precision parts
OkayamaOkayama
56 ● Okayama Plant, DNP Imagingcomm Manufacturing of dye-sublimation transfer materials
57 ▲ Okayama Plant, DNP Lifestyle Materials Plate-making / printing plate / printing / processing
58 ■ Okayama Plant, DNP Fine Optronics*1 Manufacturing of electronic parts
Kasaoka 59 □ Kasaoka Plant, DNP Fine Chemicals Manufacturing of chemicals, etc.
Hiroshima Mihara60 ■ Mihara East Plant, DNP Fine Optronics Manufacturing of electronic precision parts
61 ■ Mihara West Plant, DNP Fine Optronics Manufacturing of electronic parts
Tokushima Tokushima 62 □ DNP Shikoku Plate-making / printing / manufacturing of packaging
Fukuoka
Yahatanishi-ku, Kitakyushu
63 ■ Kurosaki Plant No.1, DNP Fine Optronics Manufacturing of electronic precision parts
64 ■ Kurosaki Plant No.2, DNP Fine Optronics Manufacturing of electronic precision parts
Tobata-ku, Kitakyushu 65 ▲ Tobata Plant, DNP High-performance Materials Manufacturing of solar cell filler
Minami-ku, Fukuoka 66 ● Fukuoka Plant, DNP Graphica
Fukuoka Plant, DNP Data Techno Plate-making / printing / bookbinding
Chikugo 67 ▲ Chikugo Plant, DNP Technopack Manufacturing of packaging
Domestic manufacturing sites with required business performance data disclosure (2)
Organizations and the names used for them are current as of March 31, 2016.
Applies to DNP and non-manufacturing sites of all domestic companies in the group that are subject to consolidated financial accounting.
Business segments
● Information Communication
“Other” refers to products that do not fall under the three segments or group companies manufacturing products that span multiple segments.
▲ Lifestyle and Industrial Supplies
■ Electronics
□ Other
• DNP Media Art calculated under the Ichigaya Plant.• DNP Media Create calculated under the Enoki-cho Plant, Information Solutions Operations.• DNP Total Process Warabi calculated under the Warabi Plant, Information Solutions Operations.• DNP Micro Technica calculated under the Kamifukuoka Plant, DNP Fine Electronics.

DNP Group Environmental Report 2016 43
International manufacturing sites❶-
1
2
6
9 10
11
3
45
78
Country City NoBusinesssegment Site Work content
Italy Agrate Brianza ❶ ■ DNP Photomask Europe S.p.A. Manufacturing of photomasks
Denmark Karlslunde ❷ ■ DNP Denmark A/S Manufacturing of projection television screens
Netherlands Amsterdam ❸ ● DNP Imagingcomm Europe B.V. Manufacturing of information media supplies
USAConcord, NC ❹ ● DNP Imagingcomm America Corporation Manufacturing of information media supplies
Pittsburgh, PA ❺ ● DNP Imagingcomm America Corporation Manufacturing of information media supplies
Singapore Singapore ❻ ● Tien Wah Press (Pte.) Ltd. Offset printing and binding
Malaysia Johor Bahru❼ ● DNP Imagingcomm Asia Sdn. Bhd. Manufacturing of information media supplies
❽ ● Tien Wah Press (Pte.) Ltd. Offset printing and binding
IndonesiaPulo Gadung ❾ ▲ PT DNP Indonesia Manufacturing of packaging
Karawang ❿ ▲ PT DNP Indonesia Manufacturing of packaging
Vietnam Binh DuongProvince ⓫ ▲ DNP Vietnam Co.,Ltd. Manufacturing of packaging
❶,❷,❹,❺ April 2014–March 2015 totals ❸,❻–⓫ January 2015–December 2015 totals
Overseas manufacturing sites with required business performance data disclosure
Business segments
● Information Communication
▲ Lifestyle and Industrial Supplies
■ Electronics

DNP Group Environmental Report 2016 44
Independent Review Report Comments by an Independent Institution
Shiraoka Plant, DNP Book Factory
Izumizaki Plant, DNP Technopack
Okayama Plant, DNP Fine Optronics
On-site visit

作成部署およびお問合わせ先
CSR-Environment & Product Liability Department
1-1, Ichigaya Kagacho 1-chome, Shinjuku-ku, Tokyo 162-8001, Japan
Tel: +81-3-3266-2111
http://www.dnp.co.jp/eng/
Next issue scheduled for release in June 2017.
Published: June 2016 ©2016 DNP
Dai Nippon Printing Co., Ltd.