do behavioral biases vary across …lusardiworkshop/papers/agnew/agnewbehavioral...new behavioral...
TRANSCRIPT

1
DO BEHAVIORAL BIASES VARY ACROSS INDIVIDUALS?: EVIDENCE
FROM INDIVIDUAL LEVEL 401(K) DATA *
Julie R. Agnew
The College of William and Mary
Abstract: This paper investigates whether certain individuals are prone to behavioral biases in their 401(k) investments. Using demographic data and allocation information for over 73,000 employees, the biases examined include two “allocation biases” and a “participation bias.” The findings suggest that higher salaried employees tend to make significantly better choices. Participants earning $100,000 hold 12.7 percent less in company stock, are three percent less likely to follow the 1/n heuristic, and are 37.7 percent more likely to participate than those earning $46,000. Women make better choices in two of the three cases and evidence of mental accounting is found. JEL Classification Codes: G11 (Portfolio Choice), G23 (Pension Funds) Keywords: 401(k), Company Stock, Naïve Diversification Contact Information: Julie R. Agnew, The College of William and Mary, School of Business Administration, P.O. Box 8795, Williamsburg, Virginia 23187. Tel. (757) 221-2672. Fax. (757) 221-2937. E-mail: [email protected]. *The author thanks an anonymous large benefits provider for providing the 401(k) plan data and Stefan Bokor for his immense help in organizing the data. The author thanks Pierluigi Balduzzi, Hendrik Bessembinder, John Boschen, Alicia Munnell, Eric Jacquier, Peter Gottschalk, Shlomo Benartzi and an anonymous referee for their careful comments and insight. In addition, Jim Poterba, Josh Rauh, Henry Richardson and Steve Utkus were very helpful. The author thanks conference participants from the Retirement Research Consortium Fourth Annual Conference, the 2002 Financial Management Association Conference and the Frank Batten Young Scholars Conference. In addition, she thanks participants in seminars held at Boston College, Drexel University, the Federal Reserve Board of Governors, George Washington University, Georgia Tech, The College of William and Mary, University of Georgia, and the University of Richmond. She gratefully acknowledges financial support from a dissertation fellowship from the Center for Retirement Research. Any errors are my own. The research reported herein was performed pursuant to a grant from the U.S. Social Security Administration (SSA) funded as part of the Retirement Research Consortium. The opinions and conclusions are solely those of the author and should not be construed as representing the opinions or policy of SSA or any agency of the Federal Government. This paper was previously circulated under the title “Inefficient Choices in 401(k) Plans: Evidence from Individual Level Data.”

2
DO BEHAVIORAL BIASES VARY ACROSS INDIVIDUALS?: EVIDENCE FROM INDIVIDUAL LEVEL 401(K) DATA *
I. Introduction
There is growing literature suggesting that an individual’s investment decisions are
affected by behavioral biases. Researchers have explained financial decisions based on
behavioral theories such as excessive extrapolation, loyalty, and familiarity (Benartzi
(2001), Cohen (2004), Huberman (2001)). 401(k) plan data provide a fertile ground for
examining these behavioral biases because participants, who represent a diverse
population of working individuals, are faced with the same choice environment. At the
401(k) plan level, ample evidence exists that behavioral biases can be overcome or made
worse by 401(k) plan design (Benartzi (2001), Choi, Laibson, Madrian and Metrick
(2001)). Markedly less attention has been paid to these biases at the individual level.
The outstanding questions are does the propensity to follow behavioral biases vary across
individuals and are there common characteristics that matter? Previous literature has not
adequately addressed these questions, and this gap in the literature provides the
motivation for this paper.
This paper takes a deeper look into three behavioral biases by providing new
estimates of their severity at the individual level and examining whether certain types of
individuals are prone to these biases. The biases examined include two “allocation
biases,”—following naïve diversification strategies and investing in company stock, and
a “participation bias,” –opting not to participate in the company sponsored 401(k) plan.
Using a new dataset representing over 73,000 eligible participants, it is the first paper to
jointly model these three biases as functions of individual characteristics providing the
opportunity to assess the relative influence of these characteristics on these choices. This

3
paper improves on and complements previous analyses of the two allocation biases,
mainly because the majority of past studies have used plan level data that can lead to
aggregation bias in the results and do not address individual level heterogeneity in
decisions.1 This study takes advantage of individual level allocation data. These data
overcome the aggregate data problems and provide the opportunity to more strongly test
new behavioral theories, such as loyalty and its influence on company stock investment.
The principal finding suggests that higher salaried employees tend to make
significantly better choices in all three cases. Specifically, we find participants earning
$100,000 hold 12.7 percent less in company stock, are three percent less likely to follow
the 1/n heuristic, and are 37.7 percent more likely to participate than those earning the
average wage of $46,000. Women also appear to make better choices in two of the three
cases, viz., 401(k) participation and investment in company stock. This suggests that
behavioral biases do vary across individuals and highlights that plan-level analysis will
suffer from an omitted variable bias. This paper also finds more direct evidence of
“mental accounting” related to company stock holdings. Until now this theory has only
been studied at the plan level.
These findings suggest that empirical research should control for individual level
heterogeneity and that more research into why salary and gender matter is needed. On a
1 Huberman and Jiang (forthcoming) used individual level data in their analysis of how the number of investment
funds offered affects equity investment. They analyzed how many people followed the 1/n heuristic but did not focus
their discussion on the influence of individual characteristics. The study also did not investigate how the mental
accounting of company stock affected the 1/n strategy. Choi, Laibson, Madrian and Metrick’s (2004) company stock
allocation study used individual level demographic data with past company stock returns. They focused their discussion
on whether participants practice “feedback” investing not the role of individual characteristics on this decision.
4
practical level, these results can help plan sponsors identify high risk individuals with a
view toward improving plan design. The results may also be helpful in the current Social
Security debate over personal accounts by providing demographic insights into investor
behavior. Finally, these results have relevancy beyond the 401(k) literature and the
broader implications are discussed in the conclusion.
This paper begins with a consideration of the allocation topics because compared
to the participation choice, there has been relatively little research devoted to the
allocation biases at the individual level. The first topic studied is the naïve diversification
bias. Naïve diversification strategies can result when individuals are faced with
complicated decisions which cause them to fall back on simple rules of thumb. This
paper investigates one naïve strategy called the “framing 1/n heuristic.” This strategy is
considered irrational because investors divide their contributions evenly among the
number (n) of investment options offered. They do so regardless of the menu of
investment options presented and thus are influenced by the fund choices available. Our
paper finds that salary and employment tenure are negatively related to this practice. We
address a similar heuristic that is considered rational, “the conditional 1/n heuristic,” and
find highly compensated individuals are 7.4 percent more likely to follow this rule.
Turning to the second allocation bias, company stock investment, evidence
suggests that despite recent scandals individuals continue to invest heavily in company
stock. In fact, Hewitt (2003) reports from a sample of 1.5 million 401(k) plan
participants in 2003 that the average company stock balance was 41 percent and the
NASD recently issued a company stock warning to investors (NASD (2005)).

5
This paper examines the links between individual characteristics, past company
stock returns and company stock allocations. The influence of past company stock
performance and plan design on company stock holding has already been well
documented in the literature (Benartzi (2001), Choi, Laibson, Madrian and Metrick
(2004), Liang and Weisbenner (2002), Sengmuller (2002)). This study contributes to the
literature by analyzing the additional link between individual characteristics and company
stock holdings while controlling for past performance. The individual level data used in
this study offer more demographic detail than in past research and the returns are more
precisely calculated than those used in plan level studies. We find a one standard
deviation increase in short term returns increases company stock holdings by eight
percent and that short term returns matter more than long term returns. In addition, we
find that company stock allocations are greater for males, decrease with salary and are
higher for employees in the non-corporate divisions.
Finally, since lack of participation stands out as one of the most obvious
investment mistakes an individual can make, a brief study of participation choice is
included for completeness. We note that our findings are consistent with previous studies
and we find that the probability of participating increases with age, job tenure and salary.
The paper is organized as follows. Section II summarizes the dataset. Section III
describes the plan design and the asset allocation choices. Section IV summarizes the
demographic and employment characteristics of all the participants eligible to participate
in the plan. Section V and VI present the empirical results associated with naïve
diversification and company stock holdings, respectively. Section VII discusses the
participation level in this plan and Section VIII presents conclusions.

6
II. Data
This paper uses a detailed database supplied by an anonymous large benefits
provider. The cross-sectional data are from one large 401(k) plan with over 73,000
eligible employees.2 The plan is sponsored by a global consumer product company and
the entire sample is used to investigate the participation decision.
The study of the allocation biases are based on a smaller subsample of “active”
participants. This paper defines an active participant as a plan eligible participant who
made a contribution to the plan during the first two weeks of August 1998. The dataset
includes each active participant’s contribution allocation and for most of these
individuals the actual date that this allocation was chosen. For this allocation date,
company stock returns over various prior periods are calculated. A total of 28,793
participants are considered active participants.
Of these active participants, the allocation date is missing for 5,814 individuals who
were enrolled in the plan prior to 1992 and did not change their contribution allocations
after this date. The data are missing because the current administrator took over the plan
in 1992 and was not provided information regarding the design of the plan prior to this
date. Thus it is possible that a different set of fund choices may have been available prior
to 1992 or that an employer match may have been offered. Since features like these can
influence choice, this group might behave differently than participants who make
allocation decisions after 1992 (Benartzi (2001), Benartzi and Thaler (2001)).
The missing allocation decision date means that estimating company stock returns
prior to the allocation decision is not possible, nor is it possible to estimate the
2 An eligible employee is an employee that may participate in the 401(k) plan if he/she chooses.
7
individuals’ ages and the number of years employed at the time of the allocation decision.
For these reasons, these individuals are eliminated from the sample leaving 22,979 active
participants for the analysis.3
One of the most important features of these data is the detailed demographic
information. For each eligible participant, the individual’s participation status, salary,
birthdate, date of employment, compensation status and gender is available.
Finally, there are three additional features of these data that deserve mention. First,
the asset allocations of the contributions are broken down at the individual level.
Aggregate contribution plan data can blur the results if high contributing participants
invest differently than low contributing participants. The effect of large contribution
levels is analogous to the influence of large market capitalization stocks on a value-
weighted index. Furthermore, aggregation can exaggerate very weak relations at the
individual level. This is called aggregation bias. Huberman and Jiang (forthcoming) use
a simulation to demonstrate how aggregation bias can amplify individual level findings in
401(k) plans. Second, these data are from one plan. While multiple plan data are
appropriate for studying across-plan variation, they can create a potential for omitted
variable bias related to plan design or plan educational efforts. Analyzing one plan
eliminates this concern. A final advantage of the data are that allocations are based on
contributions not asset balances. Asset performance can move asset allocations based on
asset balances away from the participant’s intended allocation. Contribution allocations
do not suffer from this potential bias.
3 A separate analyses of the allocation biases including and controlling for this subgroup was completed. These
analyses are not reported here but the findings were qualitatively the same.

8
A disadvantage of this dataset is that information regarding participants’ assets
outside of the plan is not available. Another drawback of the dataset is that it is missing
some variables that have been shown to impact asset allocation decisions: such as marital
status, education and financial literacy (for example, Agnew, Balduzzi and Sunden
(2003), Sunden and Surette, (1998), Dwyer, Gilkeson and List (2002)).
III. Plan Design and Asset Choices
In this plan, each participant may allocate his/her retirement fund contributions
among four different investment vehicles: an equity income fund, an S&P 500 index
fund, a guaranteed income contract fund (GIC), and company stock.4 Participants have
the option to change their contribution allocations daily. The company offers no financial
incentive for investing in company stock nor do they offer an employer match. The
absence of an employer match is an advantage because it eliminates any confounding
effects caused by the match design.
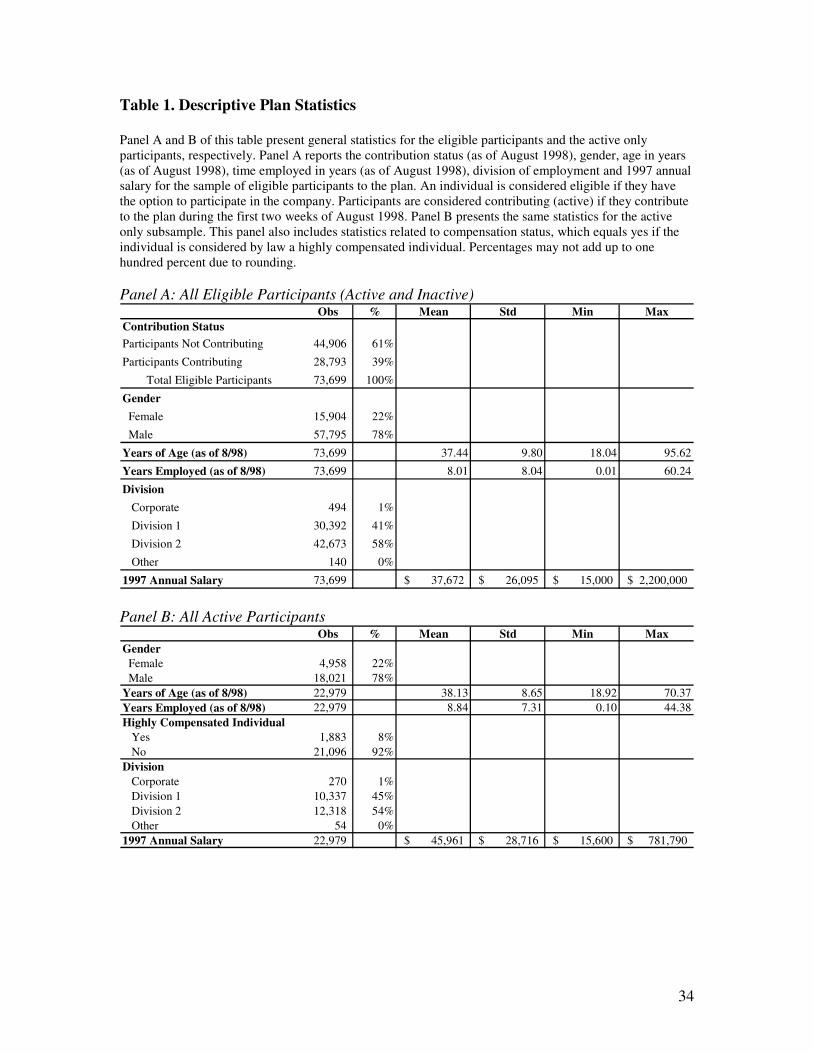
IV. Demographic and Employment Characteristics of Eligible Participants
Panel A of Table 1 describes the demographic and employment characteristics of
the eligible participants. These participants may or may not contribute to the plan. Age
and time employed are measured as of August 1998, while salary is the 1997 annual
salary. In contrast, age and time employed are measured as of the allocation decision date
4 A guaranteed income contract (GIC) fund, sometimes called a stable value fund, is a common offering in 401(k)
plans. It invests in GICs which are lending contracts between insurance companies and 401(k) plans. The 401(k) plan
lends the insurance company money over a fixed period of time. The insurance company then can invest in the money
in securities. In return, the insurance company pays interest to the 401(k) plan on the loan. The insurance company
guarantees the contracted interest payments and assumes all market, credit and reinvestment risk. The insurance
company profits by generating profits greater than the guaranteed interest it pays out to the plan. Typically, investors
interested in preserving capital and earning a steady income invest in GICs. These investments are considered low risk.

9
in the later nonparametric analysis and regression analysis. Individuals in this data
sample are predominately male (78 percent) with an average age of 37 years old. It is
noteworthy that the participants have relatively long average job tenures (8 years), which
may indicate strong company loyalty. The median time employed is almost five years
and is approximately one year greater than the 1996 national median of nearly four years
(CPS (1997)). [INSERT T1]
Participants in the company work in one of four different divisions. A majority of
the participants (99 percent) work in two large consumer product manufacturing
divisions, “Division 1” and “Division 2.” The “Corporate Division” employs one percent
of the 401(k) participants and 140 employees work for the “Other Division.”
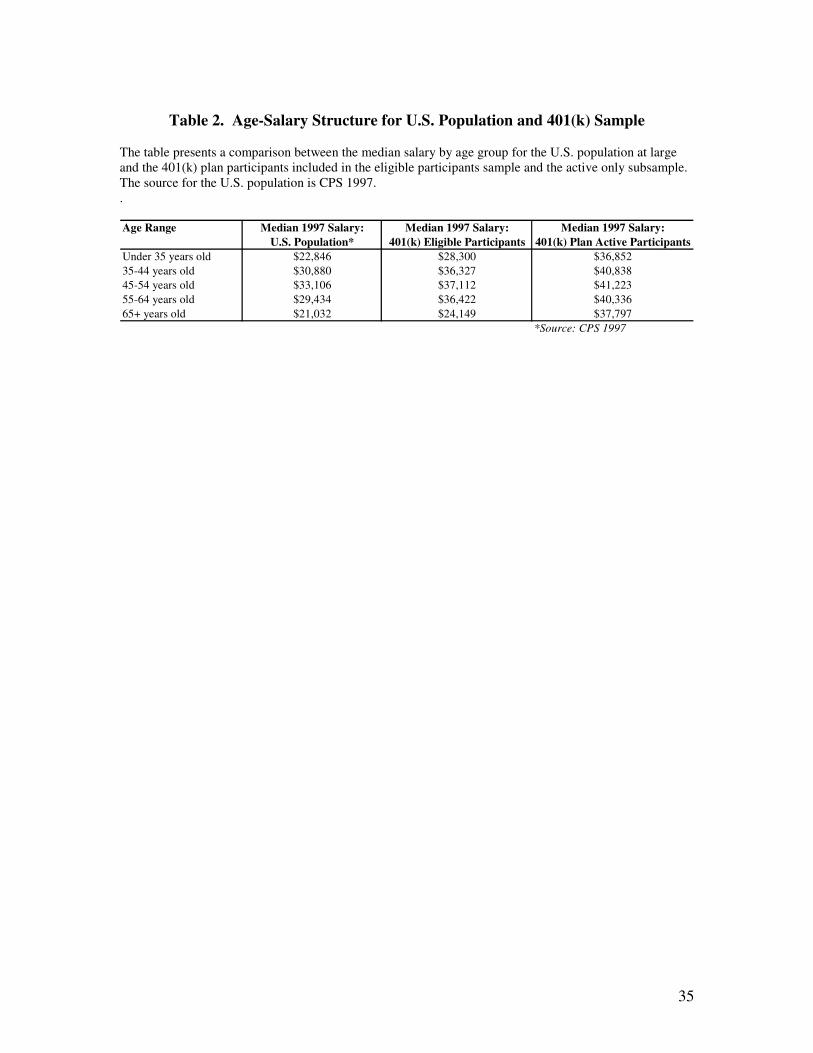
Participants earned mean 1997 salaries of approximately $37,700. Table 2 compares
the plan’s median salary by age group to the median salary of the U.S. population. The
table shows that participants in this plan earn more than the general population. However,
the relationship between salary and age is similar between the two groups. [INSERT T2]
Table 1, Panel B presents the same statistics as Panel A for the active participants
subsample. The ratio of males to females and the distribution of employees in each
division is the same as the whole sample. However, the mean age and time employed of
the participants in the subsample is slightly higher than the total sample. The median
time employed is nearly two years greater than the whole sample (6.45 years versus 4.77
years), suggesting that there are many new employees who have not yet joined the plan.5
Another interesting difference between the two samples is that the mean salary is close to
5 Although the database codes all the participants as immediately eligible, it is possible that there might have been a
duration of time before the eligible employees could join the plan. This would result in older ages and longer tenures
for the active sample.

10
8,000 dollars greater in the active sample. This suggests that individuals with higher
salaries tend to participate in the plan. This is supported in Table 2 where the median
salaries for each age group in the subsample are consistently higher than the total sample
and the U.S. population. Table 1, Panel B also presents statistics for the number of
participants considered highly compensated individuals. This is a legal designation based
on salary and company ownership. This status affects how much a participant can
contribute but does not restrict their allocation decisions.6 In this plan, approximately
eight percent of the sample is considered highly compensated.
Table 3 describes the demographic characteristics by division for the total sample
and the active subsample. The main difference between the four divisions in both samples
appears to be the salary distributions. Employees of the two smallest divisions make
significantly higher salaries than the other divisions. The Corporate Division’s mean
salary is approximately $97,000 for the total sample, while the Other Division’s mean
salary is approximately $129,000 in the total sample. These salaries compare to
approximately $40,000 and $35,000 earned in Division 1 and 2, respectively. Employees
in the two small divisions also earn significantly more in the tenth and ninetieth
percentiles of their sample. Except for the Corporate Division, the divisions are
6 Each year employers must identify employees that are considered highly compensated. This information is used by
the IRS to determine whether the 401(k) plan meets the non discrimination tests. These tests are designed to insure that
the tax breaks derived from participating in 401(k) plans are not limited to the wealthy employees. According to the
IRS website (http://www.irs.gov/publications/p560/ch01.html ), a highly compensated employee is an individual who
either owned more than 5% of the employer’s capital or profits at any time during the year or the preceding year, or for
the preceding year, received compensation above a specified level. In 2003, the salary limit for the preceding year was
$90,000. The IRS also indicates that the employer may choose to consider those employees ranked in the top 20% by
compensation as highly compensated.

11
predominately male. The groups do not differ significantly in terms of average age or
time employed. Consistent with the earlier results, the active subsample salaries are
higher than the salaries reported in the total sample. [INSERT T3]
V. Naïve Diversification
A. General Findings
In this section, three diversification heuristics are studied. The first, the “framing 1/n
heuristic,” is considered a naïve strategy because individuals distribute their contributions
equally among the n choices available. As a result, allocation decisions are influenced by
the fund choices available and can be considered irrational. Benartzi and Thaler (2001)
show that this strategy can lead to large ex ante welfare losses when the portfolio chosen
does not correspond to the individual’s risk preferences.7 We also analyze the “modified
1/n heuristic” where individuals treat company stock as a separate asset class. In this
modified version of the framing heuristic, they choose their company stock allocation
then divide their remaining funds among the remaining options available. The final
heuristic, the “conditional 1/n heuristic,” refers to the practice of dividing allocations
evenly among the funds chosen. The number of chosen funds may be smaller than the
funds offered. Huberman and Jiang (forthcoming) argue that, unlike the framing 1/n
heuristic, the conditional 1/n heuristic can be rational and is consistent with K-fund
separation theories.
7 To illustrate this, suppose that a 401(k) offers ten investment choices that include nine equity funds and one money
market fund. An individual following the 1/n heuristic, would allocate 10 percent of their contributions to each fund
resulting in a 90 percent allocation to equities. It is clear that this allocation would not be optimal for everyone
especially a participant nearing retirement.

12
In this study, the analyses of these heuristics are complicated by the fact that
company stock is an option in this plan. Huberman and Jiang (forthcoming) chose to
exclude company stock allocations in their calculations. As mentioned in the
introduction, any investment in company stock is considered inefficient in our study.
Thus, an investor who follows the conditional 1/n heuristic and includes company stock
in his investment choices cannot be considered to be making a rational decision.
Therefore, we refine the Huberman and Jiang’s (forthcoming) definition of the
conditional 1/n heuristic to include only individuals who divide their contributions evenly
(+/- one percent) among the n funds they chose and do not invest in company stock. In
contrast, an individual is considered to be following the framing 1/n heuristic if they put
25 percent (+/- one percent) of their contribution in each of the four funds. These two
groups are mutually exclusive. Participants considered following the modified 1/n rule
invest in all four funds and divide their non-company stock options equally.
We find a small percentage of the overall plan following the framing 1/n heuristic
which is consistent with Huberman and Jiang (forthcoming). In fact, less than four
percent follow the framing 1/n heuristic and only five percent follow the modified 1/n
heuristic. On the other hand, we find nearly eight percent followed the conditional 1/n
rule (excluding all company stock holders and one-fund holders). We find that most
participants (35 percent) allocate their entire contribution to only one fund and that a
majority (66 percent) of those participants invest their entire contribution in company
stock. If we broaden our definition of the conditional 1/n heuristic to include one-fund
investors not invested in company stock, then the percent of our sample following this
rule increases to 20 percent.

13
B. The Modified 1/n Heuristic
Using aggregate 401(k) plan data, Benartzi and Thaler (2001) find evidence that
individuals treat company stock as a separate asset class from other 401(k) investments.
As a result, some participants appear to follow a modified version of the 1/n heuristic by
making their company stock allocation separate from their investment in other equities.
The authors find indications that participants are then splitting their non-company stock
investment evenly among the non-company stock options. This is a form of mental
accounting (Thaler (1999)). In this paper, the behavior is referred to as the modified 1/n
heuristic.
The analysis in the current paper provides stronger tests of this practice. First, the
tests in this paper are based on contribution allocations rather than asset balance
allocations and, therefore, the influence of fund performance on allocations is not a
concern. Second, the individual level data allows for the calculation of the allocation of
non-company stock holdings by individual rather than by plan. This permits the
examination of the distribution of company stock holdings across individuals and avoids
aggregation bias (Huberman and Jiang (forthcoming)).
The analysis begins with an examination of the mean and median allocations to each
fund in Table 4. The first two columns of Table 4 list the mean and median allocations to
each fund and the last two columns list the modified mean and median allocations to each
fund. The modified allocations are simply the percent allocated to the particular non-
company stock investment vehicle divided by the total invested in non-company stock
investment vehicles. The first subsample includes all the participants that invest in all
four funds and comprises roughly thirteen percent of the sample. Notice that the results

14
tend to support the modified 1/n heuristic with modified allocations close to one-third,
which equates to evenly splitting the non-company stock contributions among the non-
company stock assets. The same exercise is repeated for subsamples of investors that
hold three funds including company stock. The results again tend to support Benartzi and
Thaler’s (2001) assertion that some individuals treat company stock as a separate asset
class and as a result slightly modify how they follow the 1/n rule. [INSERT T4]
Histograms provide additional detail. As an illustration, Figure 1 displays histograms
using the sample of participants who invest in all four funds. The histograms show the
frequency of company stock holdings and modified and unmodified holdings of the three
non-company stock investment vehicles. [INSERT F1]
Looking at the histograms, the difference is striking between the unmodified
allocation graphs (on the left) and the modified allocation graphs (on the right). The
unmodified histograms for the non-company stock funds have several probable
allocations. However, the modified frequencies are strongly centered at 33 percent. This
suggests that after adjusting for company stock holdings, these individuals allocate their
remaining assets evenly among the other funds in accordance with Benartzi and Thaler’s
(2001) assertion that some individuals treat company stock as a separate asset class and
as a result slightly modify how they follow the 1/n rule. The results for the other
subsamples presented in Table 4 are similar and available upon request.
C. Econometric Analysis
The final empirical question related to naïve diversification is what type of person is
most likely to follow the different heuristics? Since two strategies are considered
potentially irrational and the conditional 1/n heuristic is considered potentially rational,

15
we would not expect the same type of individuals to follow each. To test this four
dummy variables are constructed: a framing 1/n heuristic dummy, a modified 1/n
heuristic dummy, a conditional 1/n heuristic dummy excluding one-fund investors and a
conditional 1/n heuristic dummy including one-fund investors not invested in company
stock. These dummies equal one if the individual follows the particular heuristic and
zero if not.
Table 5 displays the results of a probit analysis using the different 1/n dummy
variables. For each 1/n variable, two regressions are run each with a different
compensation variable. The marginal effects of salary and employment tenure are
significant and negative for the two framing regressions. In contrast, salary and time
employed are positive for both the conditional 1/n heuristic and its broader definition.
This suggests that high salary individuals and participants with longer job tenures are less
likely to follow the potentially irrational framing 1/n rule, while on the other hand these
same individuals are more likely to follow the potentially rational conditional 1/n rule.
To highlight this finding, in the framing and modified 1/n regressions, an average
participant earning $100,000 would be three percent less likely to follow the rule than an
average participant earning $46,000. Similarly, a highly compensated individual is two
percent less likely to follow the rule. Conversely, a highly compensated individual is 7.4
percent more likely to the follow the broad definition of the conditional 1/n rule. One
explanation for this behavior is that the higher salaried individuals are more educated and
thus less likely to rely on simple rules for investing. Regarding job tenure, it is possible
that the employees’ understanding of their plan’s investment options increases with their

16
time on the job. Thus, this better understanding decreases the likelihood that they will
need to fall back on the 1/n rule. [INSERT T5]
VI. Company Stock Allocations
A. The Cost of Holding Company Stock
We now focus on the issue of the cost of holding company stock. The well-
publicized stories of employees losing their nest eggs after Enron and WorldCom
collapsed provide strong anecdotal evidence that investment in company stock is costly.
But is it is possible to actually quantify these costs of holding company stock for the
average investors? Several recent studies in the academic literature have attempted to do
this and all agree that the cost of holding stock is large. For example, Muelbroek (2002)
calculates the cost of holding company stock as the percent of the stock market’s value
that is sacrificed by not being fully diversified. In the case where ten percent of the
pension is invested in company stock, she calculates a cost of 25 percent for AMEX
firms.8 In addition, Poterba (2003) quantifies what a log-utility investor would be willing
to forgo in value of a portfolio invested entirely in the S&P 500 compared to portfolios
with various percentages of company stock investments. He finds that this investor
would be indifferent between foregoing 57 percent of the S&P 500 portfolio value for a
portfolio invested solely in company stock. These findings motivate the analysis below.
B. General Findings
Consistent with anecdotal evidence, participants in this 401(k) plan show a definite
tendency to invest in company stock. The overall mean allocation to company stock
8 This assumes that the pension assets represent 75 percent of the individual’s wealth and the individual has a 15 year
holding period. This figure equals 14 percent for NYSE firms and 36 percent for NASD firms.

17
holdings in this plan is quite high (45 percent) compared to the 10 percent legal
maximum defined benefit plans may hold. The large average allocation might be
partially explained by the above normal price performance of the plan’s company stock.
In this study, the company stock had an annualized stock price return just over 20 percent
over the 10-year period ending on December 31, 1997, compared to a S&P 500’s annual
return of 14.7 percent over the same time period. Benartzi (2001) shows that firms with
relatively high long run returns have higher company stock allocations than poor
performing firms. We will also control for past company stock in the regression analysis
presented later in this section.
The general patterns of company stock allocations also deserve mention. One
interesting feature of the data is that despite the absence of restrictions on the
participants’ allocations, 75 percent of the allocations are clustered within one percentage
point of zero, 25, 50, 75 and 100 percent. Furthermore, there is a clear tendency for
many of the participants (48 percent) to invest either all or none of their contributions to
company stock.
It is also interesting to examine the amount allocated to company stock in this plan in
terms of total dollars rather than percents. To calculate a rough estimate of this number
several simplifying assumptions were made. First, each individual’s 1998 contribution
amount is assumed to be equal to the number of dollars he/she contributed in 1997. The
1997 contribution amount is supplied in the dataset. This probably is a conservative
estimate of 1998 contributions. However, the alternative of annualizing the 1998 August
contributions was problematic because determining the frequency of the contributions
(weekly or biweekly) is difficult. Finally, it is assumed that the allocation percentages
18
that the individuals chose for their August 1998 contributions were held constant
throughout 1998. Given the documented inertia in 401(k) plans, this should be reasonable
assumption for most participants. By multiplying the estimated 1998 total dollar
contributions by the 1998 company stock percent allocation, an estimated company stock
allocation in dollars is calculated for each individual. Summing the estimated dollar
allocations across individuals provides an estimate of the total dollars contributed to
company stock. From this calculation, it is estimated that approximately $24.7 million
was allocated to company stock. This is 39 percent of the estimated $63.4 million
contributed to the plan in total. This percentage is very close to the 42 percent that
Benartzi (2001) reports in his study of aggregate data from 103 401(k) plans.
C. Nonparametric Analysis
This section presents a nonparametric analysis of the data that will complement the
regression analysis to follow. Table 6 reports the company stock allocations based on
demographic characteristics. The non-normal distribution of the company stock holdings
makes standard summary statistics, such as means and standard deviations, less
meaningful descriptors of the data. Therefore, in addition to these statistics, Table 6
reports the proportion of each demographic category that invests in six different
investment ranges: zero percent, 1-25 percent, 26-50 percent, 51-75 percent, 76-99
percent, and 100 percent. A simple test of proportions within each demographic category
and investment range is used to test whether a statistically significant difference exists. If
demographic characteristics do not matter, then a statistically significant difference in
proportions should not be found. For example, under the null hypothesis gender does not
matter. Therefore, the proportion of women investing 100 percent of their contributions

19
to company stock should not be statistically different than the proportion of men
investing 100 percent of their contribution to company stock. The bolded row in each
category is considered the base category and is used in each test of proportions. Table 6
reports the results of the test of proportions. [INSERT T6]
The first demographic category tested is gender. Empirical evidence suggests that
gender may proxy for financial education or risk tolerance. For example, research shows
that when a measure of financial education is not available, gender may serve as an
effective proxy for it. Dwyer, Gilkeson and List (2002) find that women typically have
less financial knowledge than men and that the educational disparities can substantially
explain the gender differences they find in risky mutual fund allocations.
Indeed, there is broad evidence suggesting that individuals overall lack a general
understanding of the risks associated with company stock investment and that education
may explain much of the variation in financial aptitude. A recent John Hancock
Financial Services’ survey (1999) highlights how individuals misread the risks of the
market. In the survey, respondents on average thought that a diversified stock fund was
more risky than investment in company stock. Similarly, Benartzi (2001) reports that 83
percent of respondents to a Morningstar survey believe that the overall stock market is
riskier than company stock. When this sample is limited to individuals with high school
education or less, this number increases to 93 percent. Thus, while company stock
investment may be seemingly irrational, upon closer examination it may be rational given
the individual’s financial knowledge.
Lack of financial knowledge may also lead to misperceptions of how 401(k)
information is used. For example, those lacking financial knowledge may suspect that

20
their managers are monitoring their company stock holdings. They may fear that a low
investment in company stock signals to their employers that they “lack commitment”
which will, in turn, harm their job prospects. As a result, their large investment in
company stock may be a rational decision based on misinformation.9
If gender is a proxy for differences in financial knowledge, then men might be
expected to invest less in company stock than women. On the other hand, empirical
research has found that men are more likely to invest in riskier assets or trade more in
riskier assets than women leading to the opposite conclusion (for example, Agnew,
Balduzzi and Sunden (2003), Barber and Odean (2001); Sunden and Surette (1998)). 10
The tests of proportions support the latter. In all but two percent ranges, there is a
statistically significant (albeit economically small) difference in the proportion of men
investing in each investment range than women. The most significant difference between
the proportion of women and men investing in company stock is at the 100 percent
investment range. Observe that 24 percent of the men allocate their entire contribution to
company stock compared to 22 percent of the women and that this difference is
significant at the one percent level. The mean allocation to company stock by men is 45
percent compared to 44 percent for women although the medians are equal.
9 I thank Hendrik Bessembinder for this insight.
10 In terms of trading and turnover of equity investments, Barber and Odean (2001) find a significant difference
between men and women. They find that men trade 45 percent more than women. However, using brokerage account
data from 35,000 households, they find only a very small difference in equity ownership as a percent of net worth
between males and females. On average, they find that women in their sample invest 13.3 percent of their net worth in
equities compared to men who invest 13.2 percent.

21
Interestingly, the gender differences obtained here are weaker than those found by
Clark, Goodfellow, Shieber and Warwick (1999). In their study of several 401(k) plans,
men invested an average 41 percent to company stock compared to 27 percent for
women. These differences in findings could be a result of different plan designs or varied
long run company stock performance across plans.
The next two sections of Table 6 demonstrate the influence of compensation level,
either salary or compensation status, on company stock investment. Compensation is
considered positively related to financial knowledge and suggests the hypothesis that
employees who earn relatively high salaries or are considered highly compensated should
hold less company stock.
Alternatively, compensation may be a proxy for an employee’s opportunities for
stock based compensation. Generally, greater opportunities exist for higher salaried
employees to receive stock based compensation than for their lower wage counterparts.
This is the case in this company.11 Research shows that highly paid executives are
concerned about diversifying their company stock holdings but are often reluctant to sell
their stock based compensation. As a result they are finding sophisticated ways to hedge
their holdings. Results from one recent paper suggest that executives diversify their
company stock holdings through the use of zero cost collars and equity swaps (Ofek and
Yermack (2000)). Additional research shows that executives with high stock ownership
negate much of the impact from their stock compensation by selling previously owned
11 Three plans are offered in this company. One plan is open to all full-time employees and the number of options
available is based on earnings. The second and third plans are targeted at middle and senior management. The options
in these plans are based on reaching performance goals. Thus, higher salaried and middle and upper management
employees have more opportunities to earn stock options than lower salaried employees.

22
shares (Bettis, Bizjak and Lemmon (2001)). Given the demonstrated lengths that these
senior managers go to diversify their holdings, one might expect that they will hold
smaller amounts of company stock in their 401(k) accounts.
The results support both theories. Table 6 shows a decrease from the lowest wage
category to the highest wage category in the proportion of individuals allocating their
entire contribution to company stock. Twenty seven percent of the under $25,000
category invest their whole contribution to company stock compared to 15 percent of the
$100,000 plus category. The reverse trend is observed in the proportion of individuals
who invest nothing in company stock. Here, 22 percent of the under $25,000 category
invest nothing in company stock compared to 42 percent of the over $100,000 group.
This difference in proportions is significant at the one percent level. This supports results
from Goodfellow and Schieber’s (1997) study of 24 different plans where low-wage
earners were more likely to hold company stock than high-wage earners. Table 6 also
shows similar investment patterns made by highly compensated individuals.
Similar to gender, age may proxy for risk tolerance. Many life cycle theories
predict that individuals will hold less risk in their financial portfolio as they age.
Jagannathan and Kocherlakota (1996) suggest that young investors have a long stream of
future income. As individuals age, this stream of future income shortens diminishing the
value of their human capital. Therefore, they suggest that individuals should offset this
decline in the value of their human capital by reducing the risk of their financial portfolio.
Bodie, Merton, and Samuelson’s (1992) model leads to a similar prediction. In their
model, individuals can respond to low realized asset returns by increasing their supply of
labor. However, labor flexibility generally declines with age. Therefore, like the

23
previous model, older individuals are expected to hold more conservative investments in
their financial portfolios.
Table 6 is consistent with the stated life cycle hypotheses. Note that in Table 6,
age is measured at the time the allocation decision is made. The 65 plus age category
will not be discussed because it includes only 6 participants. Notice that as individuals
age there is a downward trend in the proportion of participants investing their entire
contribution to company stock. On the extreme ends, 19 percent of those between 55-64
years old invest their entire contribution to company stock compared to 24 percent of the
participants under 35 years old. The difference in proportions is significant at the one
percent level. This trend is reversed and significant in the proportions investing nothing
in company stock.
Time employed may also proxy for risk tolerance, as well as loyalty or familiarity.
The latter two theories would predict a positive relationship. Table 6 results show that
the percentage of participants that hold zero percent in company stock increases with the
time employed. A less marked decline is observed in the 100 percent category but the
proportion of each group 100 percent invested in company stock is still relatively less
than the group of employees with zero to two years of work experience. Twenty six
percent of those with less than two years experience invest their entire contribution to
company stock compared to 22 percent of those with greater than 26 years experience.
These findings are not consistent with loyalty and familiarity but are consistent with
the prediction of the Degeorge, Jenter, Moel and Tufano (2004) model. They use job
tenure as a proxy for the firm-specificity of an individual’s human capital. These authors
argue that an individual’s firm specific human capital grows with the time he/she is
24
employed by a firm. As a result, the individual’s need to diversify away from company
stock increases with his/her job tenure.
The results show that the employee’s company division also explains some variation
in company stock holdings. One possible explanation is that probability of earning stock
based compensation varies with divisions. For example, a corporate division may have
more employees eligible for stock based compensation than a division comprised mostly
of factory workers. Thus, the expected average allocation to company stock would be
relatively lower in the corporate division compared to the other divisions. The
occupation type may also provide information about the employee’s education level
beyond that obtained from salary information. It seems likely that a corporate division
may be more heavily comprised of executives with college degrees, while a factory
division may have a higher percentage of blue-collar workers with high school degrees.
On the other hand, the division variables may also proxy for many other unobservables so
care must be taken not to over interpret these results.
In this study, the predominate occupation does differ between divisions. A discussion
with the benefits administrator indicates that the Corporate Division consists mainly of
executives, while the employees of Division 1 and Division 2 tend to be factory workers.
As predicted, Table 6 shows the Corporate Division has the lowest proportion of
individuals investing their entire contribution to company stock and the highest
proportion of individuals who invest nothing in company stock. These results support the
theory that either the executives in the Corporate Division are limiting their company
stock holdings to compensate for stock based compensation or they are doing so because

25
they have a relatively better understanding of the inherent risks of company stock
investment. One other possible theory is that the factory workers are more loyal.
D. Econometric Analysis of Company Stock Holdings
The nonparametric evidence suggests that there are relationships between the
demographic variables and company stock holdings. This section will econometrically
test for the joint effects of these factors on company stock allocations. In addition, it will
control for the effects of past company stock performance.
Table 7 presents a two-limit censored regression model that tests the effects of the
individual characteristics on company stock allocations.12 Note, however that the
prevalence of company stock allocations clustered at zero, 25, 50, 75 and 100 percent
makes it possible that the errors from the two-limit censored regression are not normally
distributed. If this is true, the usual estimators based on the log-likelihood for this
regression model are inconsistent (Greene (1997)). Therefore, as a robustness check, an
ordered probit regression is also estimated using company stock allocations grouped into
six categories (0%, 1%-25%, 26%-50%, 51%-75%, 76%-99%, 100%). The ordered
probit results support the findings from the two-limit censored regression model and are
available on request.
Two models are estimated, each with a different variable measuring compensation,
and the results are reported in Table 7. Model 1 uses salary and Model 2 uses an
indicator variable that equals one if the individual is considered a highly compensated
individual and zero if not. The results suggest that men invest 3.0 percent more of their
12 Agnew, Balduzzi and Sunden (2003) use this model to study the relationship between demographic characteristics
and equity allocations in one 401(k) plan.

26
contributions to company stock than women, supporting the theory that men tend to make
more risky asset allocation choices. Salary is also significantly related to company stock
holdings. The results suggest for every additional 10,000 dollars in compensation
company stock holdings fall by approximately two percent. In this case, salary may be a
proxy for financial education or the amount of stock based compensation. The division of
employment also has a significant role in company stock holdings. In model 1 (2),
relative to the Corporate Division, participants in Division 1 invest 11 percent (17
percent) more to company stock. Similarly, participants in Division 2 invest 20 percent
(26 percent) more to company stock. The results support the hypothesis that either the
executives in the Corporate Division are limiting their company stock holdings to
compensate for stock based compensation or they are limiting their company stock
holdings because they have a relatively better understanding of the inherent risks in
company stock investment. Interestingly, age and time employed are not significantly
related to company stock holdings in Model 1. Time employed has a very small negative
influence on company stock holdings in Model 2. [INSERT T7]
Finally, the results support Benartzi’s (2001) findings that past raw buy and hold
returns are positively related to company stock holdings. He finds 10 year returns have
the most significant influence, whereas we find short term returns (one year buy and hold
returns) produce the most significant results (based on pseudo r-squareds). We test
returns over different periods ranging from one to ten years. Our results are supported by
Sengmuller (2002) who finds two to three year returns are most closely related to
company stock holdings. Most likely our ability to control for inertia by more precisely

27
calculating the buy and hold returns for each individual causes the differences in results.
Sengmuller (2002) also controls for inertia in his study.
In this analysis, the sample returns range from a minimum of negative 19 percent to a
maximum of positive 78 percent. The average return is 28 percent, with a standard
deviation of 20 percent. The results of the regression predict that a one standard
deviation increase in company stock returns will increase company stock holdings by 8.0
percent.13 Interestingly, these results are contrary to what an optimal individual holding
stock options would do in response to strong stock performance. An optimizing
individual would reduce company stock holdings because the hedge ratios on awarded
options increase with stock returns.14
VII. Plan Participation
Finally, the analysis turns to plan participation. Choosing not to participate in a
401(k) plan is the most obvious error an individual can make and is well researched in the
literature. The literature shows a clear link between plan level and individual level
characteristics. Munnell, Sunden and Taylor (2001/2002) provide a summary of the
findings and the behavioral explanations behind the results. Therefore, this section will
focus primarily on how consistent our results are with previous findings and how they
compare with the other results in this paper.
In this plan, of the 73,699 eligible participants in the total sample, 39 percent
made at least one contribution during the first two weeks of August 1998. This
13 The result found is very close to Sengmuller (2002) finding. He finds that after controlling for the effects of inertia,
a positive one standard deviation change in one year returns (22 percent) will result in an increase in company stock
inflows of 5 percentage points by those considered “active changers.”
14 I thank an anonymous referee for making this point.

28
participation rate is low compared to other studies.15 One reason might be that the
definition of active participant in this study is fairly restrictive because it limits
participants to those who made a contribution during the first two weeks of August 1998.
Other studies use different definitions. For example, Clark and Schieber (1998) define an
active participant as a person who made at least one contribution in a single year.
At the individual level, previous literature shows that salary, age and time employed
are related to participation. Low wage earners may be less likely to participate than high
wage earners due to the greater liquidity constraints they bear, the reduced tax breaks
they earn due to their lower tax brackets and the higher replacement rates they earn from
Social Security. The positive relationship with age may be because people grow more
interested in their retirement savings as time goes by. Finally, the positive relationship
between participation and time employed may be a result of individual’s vesting
schedules increasing over time and their growing familiarity with the plan. For further
discussion of why these characteristics might matter, see Munnell, Sunden and Taylor
(2001/2002).
In order to test whether a common factor exists that relates to the efficiency of all
three choices and to examine whether participants in this study’s plan are behaving
similarly to participants in other plans, a probit regression of the participant’s decision is
modeled. Table 8 present the findings. The findings are consistent with previous work
and, most importantly, one characteristic, salary, is found to be related to the efficiency of
15 For example, Clark and Schieber’s (1998) found that on average 73.5% of eligible employees participated in their
401(k) plans in their analysis of plan data from 19 firms with 700 to 10,000 employees. Similarly, Munnell, Sunden,
and Taylor (2002) report a 72% mean participation rate among eligible employees using the 1998 Survey of Consumer
Finances data.

29
all three decisions (Tables 5, 7 and 8). In the participation regression, salary plays a large
role. For example, compared to an average participant earning $46,000 dollars, an
average participant earning $100,000 would be 37.7 percent more likely to participate.
This same individual would be expected to hold 12.7 percent less in company stock and
be 3.0 percent less likely to follow the framing 1/n heuristic. [INSERT T8]
In addition, gender plays a statistically significant role in two of the biases-
participation and company stock allocations. In both cases, women make better choices,
with women being four percent more likely to participate than men and expected to hold
two or three percent less in company stock.
VIII. Conclusion
This paper examines the influence of individual characteristics on behavioral
biases in 401(k) plan allocation decisions. The database pertains to a single plan with
over 73,000 eligible participants consisting of a diverse set of individuals that are
presented with similar investment choices. The investment biases studied are the naïve
1/n heuristic and its variations, investment in company stock, and the decision not to
participate in the plan.
The goal of this paper is to determine whether the propensities to follow biases
vary across individuals and whether a common characteristic can be found. The 401(k)
literature has already documented the importance of plan design and this paper
contributes to the literature by highlighting the importance of individual characteristics.
The principal finding suggests that higher salaried employees tend to make
significantly better choices in all three cases. Women also appear to make better choices
in two of the three cases, viz., 401(k) participation and investment in company stock.

30
These findings highlight the need to control for individual heterogeneity in empirical
work, as well as indicate some directions for future research. For example, although
several theories are presented in this paper to explain why gender and salary matter,
additional work is needed to study these theories in detail. In particular, data on
individual level financial literacy would be useful to understand the salary results. On a
practical level, these results can help plan sponsors identify high risk individuals with a
view toward improving plan design. The results may also be helpful in the current Social
Security debate over personal accounts by providing demographic insights into investor
behavior.
Finally, this research has implications beyond the 401(k) literature. For example,
studies suggest that the empirical failures of the C-CAPM are a result of including non-
market participants in the sample studied (Brav, Constantinides and Geczy (2001),
Mankiw and Zeldes (1991), Vissing-Jorgensen (2001)). This is because the C-CAPM,
just like the I-CAPM, assumes that individuals participate in the markets. The theories
also assume that individuals hold well diversified portfolios. Our study suggests that low
salaried market participants are less likely to hold well diversified portfolios because they
tend to concentrate their assets in one security, company stock. In addition, they are
more likely to follow naïve diversification strategies, which generally will not result in a
well-diversified portfolio. As a result, our findings suggest that a sample of higher
income market participants is more likely to meet the diversification conditions
established by the underlying C-CAPM, and thus should perform better in an empirical
analysis of the model.
31
References Agnew, J., P. Balduzzi and A. Sunden. “Portfolio Choice and Trading in a Large 401(k)
Plan.” American Economic Review, 93 (2003), 193-215. Barber, B. M., and T. Odean. “Boys will be Boys: Gender, Overconfidence, and
Common Stock Investment.” Quarterly Journal of Economics, 116 (2001), 261-292.
Benartzi, S. “Excessive Extrapolation and the Allocation of 401(k) Accounts to Company
Stock?” Journal of Finance, 56 (2001), 1747-1764. Benartzi, S. and R. Thaler. “Naive Diversification Strategies in Retirement Saving Plans.” American Economic Review, 91 (2001), 79-98.
Bettis, J. C.; J. Bizjak and M. Lemmon. “Managerial Ownership, Incentive Contracting,
and the Use of Zero-Cost Collars and Equity Swaps by Corporate Insiders.” Journal of Financial and Quantitative Analysis, 36 (2001), 345-370.
Bodie, Z.; R.C. Merton, and W. F. Samuelson. “Labor Supply Flexibility and Portfolio Choice in a Life Cycle Model.” Journal of Economic Dynamics and Control, 16 (1992), 427-449.
Brav, A.; G. M. Constantinides and C. C. Geczy. “Asset Pricing with Heterogeneous Consumers and Limited Participation: Empirical Evidence.” Journal of Political
Economy, 110 (2002), p. 793-824. Choi, J. J.; D. Laibson, B. Madrian and A. Metrick. “Defined Contribution Pensions: Plan
Rules, Participant Decisions and the Path of Least Resistance.” NBER Working Paper 8655 (2001).
Choi, J. J.,. D. Laibson, B. Madrian and A. Metrick. “Employee Investment Decisions
about Company Stock.” In Pension Design and Structure: New Lessons From Behavioral Finance, O.S. Mitchell and S. Utkus, eds. New York, New York: Oxford University Press Inc., New York (2004)
Clark, R. L. and S. Schieber. “Factors Affecting Participation Levels in 401(k) Plans.” In Living with Defined Contribution Plans, O.S. Mitchell and S. J. Schieber, eds. Philadelphia, PA: University of Pennsylvania Press (1998)
Clark, R. L., G. P. Goodfellow, S. J. Schieber, and D.Warwick, “Making the Most of
401(k) Plans: Who’s Choosing What?” In Forecasting Retirement Needs and Retirement Wealth. O. Mitchell, P. B. Hammond and A. M. Rappaport, eds. Philadelphia, PA: University of Pennsylvania Press (1999)
Cohen, L. “Loyalty Based Portfolio Choice”, Working Paper, The University of Chicago
(2004).

32
CPS. “Employee Tenure in the Mid-1990s.” In CPS Publications (30 January 1997).
Degeorge, F., D. Jenter, A. Moel and P. Tufano. “Selling Company Shares to Reluctant
Employees: France Telecom’s Experience.” Journal of Financial Economics, 71 (2004), 169-202.
Dugas, C. “Don’t Bank 401(k) on Employer’s Stock. If Company hits Bad Spot,” Retirement Plan Can Tank, USA Today, Money Section: 3B (4 August 2000).
Dwyer, P., J. Gilkeson, and J. List. “Gender Differences in Revealed Risk Taking:
Evidence from Mutual Fund Investors.” Economic Letters, 76 (2002), pp.151-159. Goodfellow, G. P. and S. J. Schieber, “Investment of Assets in Self-Directed Retirement
Plans.” In Positioning Pensions for the Twenty-First Century, M. S. Gordon, O. S. Mitchell, and M. M. Twinney, eds. Philadelphia, PA: University of Pennsylvania Press (1997)
Greene, W. H. Econometric Analysis, Prentice-Hall, Inc. Upper Saddle River, New Jersey
(1997). Hewitt Associates LLC, 2003 Hewitt Universe Benchmarks- How Well Are
Employees Saving and Investing in 401(k) Plans (2003). Huberman, G. 2001, “Familiarity Breeds Investment.” Review of Financial Studies, 14
(2001), 659-680. Huberman, G., S. Iyengar and W. Jiang. “Defined Contribution Pension Plans:
Determinants of Participation and Contribution Rates.” Columbia University Working Paper (2003).
Huberman, G. and W. Jiang. “Offering vs. Choice in 401(k) Plans: Equity Exposure and
Number of Funds.” Journal of Finance, (forthcoming). Jagannathan, R., and N. R, Kocherlakota. “Why Should Older People Invest less in
Stocks Than Younger People.” Federal Reserve of Minneapolis, Quarterly Review Summer (1996), 11-23.
John Hancock Financial Services. The Sixth Defined Contribution Plan Survey (1999). Liang, N., and S. Weisbenner. “Investor Behavior and Purchase of Company Stock in
401(k) Plans- The Importance of Plan Design.” Board of Governors of the Federal Reserve System Working Paper (2002).
Mankiw, G. N. and S. P. Zeldes. “The Consumption of Stockholders and
Nonstockholders.” Journal of Financial Economics, 29 (1991): 97-112.
33
Meulbroek, L. “Company Stock in Pension Plans: How Costly Is It?” Harvard Business
School Working Paper 02-058 (2002). Munnell, A. H., A. Sunden, and C. Taylor. “What Determines 401(k) Participation and
Contributions?” Social Security Bulletin, 64 (2001/2002), 64-75. NASD Press Release, “NASD Warns Investors Too Much Company Stock Can
Jeopardize Financial Future: Diversification is Key to Reducing Risk.” February 17, 2005.
Ofek, E. and D. Yermack. “Taking Stock: Equity-Based Compensation and the Evolution
of Managerial Ownership.” Journal of Finance, 55 (2000), 1367-1384. Poterba, J. M., “Lessons from Enron: Employer Stock and 401(k) Plans.” American
Economic Review, 93 (2003), 398-404. Sengmuller, P., 2002, “Performance Predicts Asset Allocation: Company Stock in 401(k) Plans.” Columbia University Working Paper (2002). Sunden, A. E., and B. J. Surette. “Gender Differences in the Allocation of Assets in
Retirement Savings Plans.” American Economic Review, 88 (1998): 207-211. Thaler, R. H. “Mental Accounting Matters.” Journal of Behavioral Decision Making 12
(1999), 183-206. Vissing-Jorgensen, A. “Limited Asset Market Participation and the Elasticity of
Intertemporal Substitution.” Journal of Political Economy 110 (2002), 825-853.
34
Table 1. Descriptive Plan Statistics
Panel A and B of this table present general statistics for the eligible participants and the active only participants, respectively. Panel A reports the contribution status (as of August 1998), gender, age in years (as of August 1998), time employed in years (as of August 1998), division of employment and 1997 annual salary for the sample of eligible participants to the plan. An individual is considered eligible if they have the option to participate in the company. Participants are considered contributing (active) if they contribute to the plan during the first two weeks of August 1998. Panel B presents the same statistics for the active only subsample. This panel also includes statistics related to compensation status, which equals yes if the individual is considered by law a highly compensated individual. Percentages may not add up to one hundred percent due to rounding.
Panel A: All Eligible Participants (Active and Inactive) Obs % Mean Std Min Max
Contribution Status
Participants Not Contributing 44,906 61%
Participants Contributing 28,793 39%
Total Eligible Participants 73,699 100%
Gender
Female 15,904 22%
Male 57,795 78%
Years of Age (as of 8/98) 73,699 37.44 9.80 18.04 95.62
Years Employed (as of 8/98) 73,699 8.01 8.04 0.01 60.24
Division
Corporate 494 1%
Division 1 30,392 41%
Division 2 42,673 58%
Other 140 0%
1997 Annual Salary 73,699 37,672$ 26,095$ 15,000$ 2,200,000$ Panel B: All Active Participants
Obs % Mean Std Min Max
Gender
Female 4,958 22%
Male 18,021 78%
Years of Age (as of 8/98) 22,979 38.13 8.65 18.92 70.37
Years Employed (as of 8/98) 22,979 8.84 7.31 0.10 44.38
Highly Compensated Individual
Yes 1,883 8%
No 21,096 92%
Division
Corporate 270 1%
Division 1 10,337 45%
Division 2 12,318 54%
Other 54 0%
1997 Annual Salary 22,979 45,961$ 28,716$ 15,600$ 781,790$
35
Table 2. Age-Salary Structure for U.S. Population and 401(k) Sample The table presents a comparison between the median salary by age group for the U.S. population at large and the 401(k) plan participants included in the eligible participants sample and the active only subsample. The source for the U.S. population is CPS 1997. .
Age Range Median 1997 Salary: Median 1997 Salary: Median 1997 Salary:
U.S. Population* 401(k) Eligible Participants 401(k) Plan Active Participants
Under 35 years old $22,846 $28,300 $36,852
35-44 years old $30,880 $36,327 $40,838
45-54 years old $33,106 $37,112 $41,223
55-64 years old $29,434 $36,422 $40,336
65+ years old $21,032 $24,149 $37,797
*Source: CPS 1997

36
Table 3. Descriptive Plan Statistics by Division This table breaks down each division by demographic information for the total sample. Panel A and the active only sample Panel B. Panel A reports gender, 1997 annual salary, age (as of August 1998), time employed (as of August 1998), and time enrolled in the plan (as of August 1998). In addition to those statistics, Panel B reports the percent of the sample 100% invested in company stock and compensation status (HCE). HCE stands for highly compensated individual.
Panel A: All Eligible Participants (Active and Inactive) Division Number of
Employees
% of Division
Male
Mean Age
(Years)
Mean Time
Employed
(Years) Corporate 494 51% 42.76 11.80
Division 1 30,392 85% 37.18 9.32
Division 2 42,673 74% 37.56 7.03
Other 140 86% 40.95 10.49
Division Median
Salary
Mean Salary Salary-10th
Percentile
Salary- 90th
Percentile Corporate 57,000$ 97,343$ 31,000$ 190,000$
Division 1 34,920$ 39,737$ 20,000$ 59,330$
Division 2 31,769$ 35,210$ 19,760$ 52,100$
Other 148,250$ 129,393$ 81,005$ 160,000$
Panel B. All Active Participants
Division Number of
Employees
% of Division
Male
Mean Age
(Years)
Mean Time
Employed
(Years)
% Division
100% Invested
in Company
Stock Corporate 270 47% 41.92 10.98 10%
Division 1 10,337 81% 37.58 9.64 21%
Division 2 12,318 77% 38.51 8.11 26%
Other 54 85% 40.66 9.85 15%
Division Median
Salary
Mean Salary Salary-10th
Percentile
Salary- 90th
Percentile
% of Division
HCE
Corporate 64,000$ 95,681$ 35,000$ 190,000$ 40%
Division 1 39,645$ 47,134$ 25,688$ 72,200$ 9%
Division 2 38,752$ 43,496$ 25,771$ 63,800$ 6%
Other 155,000$ 135,127$ 90,190$ 160,000$ 98%

37
Table 4. Asset Allocations and Modified Asset Allocations This table presents the allocations and modified asset allocations for investors who hold company stock and invest in either two or three additional assets. The modified allocations reflect the percentage of the non-company stock holdings the asset class represents. Percentages may not add up to one hundred percent because of rounding.
Invest in All Assets 3,011 obs
Investment Vehicle Mean Allocation
Median
Allocation
Mean Modified
Allocation
Median
Modified
Allocation
Company Stock 32% 25%
Equity Income Fund 23% 25% 34% 33%
S&P 500 Index Fund 25% 25% 36% 33%
GIC 20% 20% 30% 33%
Invest in Company Stock, Equity Income and GIC Fund 279 obs
Investment Vehicle Mean Allocation
Median
Allocation
Mean Modified
Allocation
Median
Modified
Allocation
Company Stock 41% 47%
Equity Income Fund 30% 25% 51% 50%
S&P 500 Index Fund
GIC 29% 25% 49% 50%
Invest in Company Stock, Equity Income and S&P 500 Index Fund 4,084 obs
Investment Vehicle Mean Allocation
Median
Allocation
Mean Modified
Allocation
Median
Modified
Allocation
Company Stock 38% 34%
Equity Income Fund 30% 30% 48% 50%
S&P 500 Index Fund 33% 30% 52% 50%
GIC
Invest in Company Stock, S&P 500 Index and GIC Fund 560 obs
Investment Vehicle Mean Allocation
Median
Allocation
Mean Modified
Allocation
Median
Modified
Allocation
Company Stock 44% 50%
Equity Income Fund
S&P 500 Index Fund 29% 25% 52% 50%
GIC 27% 25% 48% 50%

38
Table 5. Marginal Effects from Probit Regression–1/n Heuristic The table presents the marginal effects calculated from the results of a probit regression. The dependent variable equals one if the individual follows the specific heuristic defined in the table. “Male” is a dummy variable equal to one if the participant is male, zero otherwise. “Salary” is the annual 1997 salary (unit: ten thousand dollars). “Age” is the age of the participant at the time the allocation decision is made (unit: years). The marginal effect of age takes into account a non-linear effect of age. “Time Employed” equals the time the participant has been employed at the time the allocation decision is made (unit: years). “Compensation Status” is a dummy variable that equals one if the individual by law is considered highly compensated, otherwise it equals zero. “Division #” and “Other” are dummy variables that equal one if the participant is in that division. The Corporate Division is the omitted dummy. Robust standard errors, reported in parentheses, are adjusted for heteroskedacity. The psuedo R-squared is the log-likelihood value on a scale from zero to one, where zero corresponds to the constant-only model and one corresponds to perfect prediction (a log-likelihood of zero). ** (*) indicates significance at the 1% (5%) level.
Other)2 Division1 Divisionon)Compensati(or Salary EmployedTimeAgeAgeMale(1) Prob(Y: model The 876542
3210 βββββββββ ++++++++Φ==
Heuristic Name Strict Conditional 1/n (dF/dx) Broad Conditional 1/n (dF/dx)
Independent Variables (1) (2) (1) (2) (1) (2) (1) (2)
Male (1)0.0000 -0.0014 0.0009 -0.0006 0.0024 0.0038 0.0037 0.0059
(0.0032) (0.0032) (0.0035) (0.0036) (0.0044) (0.0044) (0.0064) (0.0064)
Age 0.0003 0.0002 0.0002 0.0001 0.0015 ** 0.0016 ** 0.0023 ** 0.0025 **
(0.0002) (0.0002) (0.0002) (0.0002) (0.0003) (0.0003) (0.0004) (0.0004)
Time Employed -0.0014 ** -0.0016 ** -0.0018 ** -0.0020 ** 0.0009 ** 0.0010 ** 0.0019 ** 0.0020 **
(0.0003) (0.0003) (0.0003) (0.0003) (0.0003) (0.0003) (0.0005) (0.0005)
Salary -0.0057 ** -0.0057 ** 0.0047 ** 0.0075 **
(0.0009) (0.0009) (0.0006) (0.0009)
Compensation Status (1)
-0.0197 ** -0.0191 ** 0.0511 ** 0.0742 **
(0.0041) (0.0049) (0.0080) (0.0108)
Division 1 (1)0.0176 0.0280 0.0104 0.0221 0.0339 0.0193 -0.0054 -0.0230
(0.0172) (0.0175) (0.0175) (0.0175) (0.0183) (0.0169) (0.0235) (0.0228)
Division 2 (1)0.0081 0.0181 0.0013 0.0131 0.0276 0.0127 -0.0245 -0.0433
(0.0163) (0.0159) (0.0171) (0.0166) (0.0174) (0.0164) (0.0237) (0.0231)
Other (1)
dropped dropped dropped dropped 0.0636 0.0460 -0.0141 -0.0265
(0.0529) (0.0477) (0.0530) (0.0503)
Number of Observations 22,925 22,925 22,925 22,925 22,979 22,979 22,979 22,979
Psuedo R-squared 0.0181 0.0119 0.0163 0.0115 0.0161 0.0143 0.0131 0.0124(1) dF/dx is for a discrete change of the dummy variable from 0 to 1
individual invests 1/n among the n
funds chosen and company stock
investment is not allowed. Equals
one if a one-fund investor.
25 percent is invested in each of
the four funds offered.
individual invests in all four
funds and non-company stock
holdings are equally split.
Possibly Inefficent Decision Possibly Efficient Decision
individual invests 1/n among the n
funds chosen and company stock
investment is not allowed. Equals
zero if a one-fund investor.
Modified 1/n (dF/dx)Framing 1/n (dF/dx)
Dependent variable equals
one if …

39
Table 6. Summary Statistics of Company Stock Holdings This table reports summary statistics for company stock holdings based on demographic characteristics. The sample is the active only sample. In addition to the mean and median allocations, the table presents the proportion of each demographic category invested in each of the six investment ranges. The first row of each demographic category (bolded) is considered the base category. Within each investment range and demographic category, a test of proportions is run. ** (*) stars beside the proportions denote a statistically significant difference from the base category at the one (five) percent level. Percentages may not add up to one hundred percent due to rounding.
Demographic
Category
Obs.
0% 1-25% 26-50% 51-75% 76-99% 100% Median Mean
All 22,979 24.7% 15.3% 27.7% 6.9% 2.1% 23.3% 40.0% 44.9%
Sort by Gender:
Male 18,021 24.8% 15.1% 27.4% 6.8% 2.2% 23.7% 40.0% 45.2%
Female 4,958 24.4% 16.3% * 28.8% * 7.1% 1.7% * 21.7% ** 40.0% 43.8%
Annual Salary:
Under $25,000 1,976 21.7% 16.7% 26.7% 6.0% 1.5% 27.4% 50.0% 48.3%
$25,000-$49,000 15,369 23.4% 14.8% * 27.7% 6.9% 2.2% * 25.0% * 50.0% 46.8%
$50,000-$74,999 3,749 24.9% ** 17.2% 29.6% * 7.3% 2.2% * 18.7% ** 35.0% 41.7%
$75,000-$99,999 919 35.2% ** 15.3% 27.4% 7.1% 1.3% 13.7% ** 25.0% 34.2%
$100,000+ 966 42.2% ** 13.4% * 22.9% * 5.9% 1.0% 14.6% ** 25.0% 31.8%
Highly Compensated
Individual:
Yes 1,183 36.3% 14.7% 25.8% 6.6% 1.2% 15.5% 25.0% 34.8%
No 21,096 23.7% ** 15.4% 27.9% * 6.9% 2.2% ** 24.0% ** 40.0% 45.8%
Age:
Under 35 years old 11,075 21.8% 16.2% 28.2% 7.4% 2.5% 24.0% 49.9% 46.7%
35-44 years old 8,075 26.4% ** 15.1% * 27.3% 6.9% 1.7% ** 22.5% * 40.0% 43.7%
45-54 years old 3,144 28.5% ** 13.4% ** 27.5% 5.3% ** 1.9% 23.4% 40.0% 43.4%
55-64 years old 679 35.1% ** 13.0% * 26.4% 4.9% * 1.3% 19.4% ** 30.0% 38.3%
65+ years old 6 66.7% ** 0.0% 33.3% 0.0% 0.0% 0.0% 0.0% 14.0%
Time Employed:
0-2 years 7,359 21.4% 17.2% 27.5% 5.7% 1.8% 26.4% 49.9% 47.4%
3-5 years 4,571 22.8% 16.5% 28.9% 7.4% ** 2.2% 22.3% ** 40.0% 45.1%
6-10 years 4,497 24.0% ** 14.8% ** 28.2% 8.3% ** 2.7% ** 22.1% ** 40.0% 45.2%
11-15 years 2,914 28.7% ** 13.7% ** 27.6% 7.4% ** 1.9% 20.8% ** 40.0% 42.3%
16-20 years 2,118 30.5% ** 12.2% ** 26.7% 7.6% ** 2.0% 21.1% ** 40.0% 42.2%
20-25 years 948 32.7% ** 12.8% ** 25.5% 5.3% 1.3% 22.5% ** 34.0% 40.9%
26-50 years 572 34.6% ** 10.7% * 27.3% 3.7% * 2.1% 21.7% * 30.0% 39.9%
Division:
Corporate 270 35.9% 23.0% 27.4% 3.3% 0.4% 10.0% 25.0% 28.8%
Other 54 42.6% 13.0% 25.9% 3.7% 0.0% 14.8% 20.0% 30.9%
Division 1 10,337 26.4% ** 16.3% ** 28.3% 6.6% * 1.9% 20.5% ** 35.0% 42.2%
Division 2 12,318 23.0% ** 14.4% ** 27.3% 7.1% * 2.3% * 25.9% ** 50.0% 47.6%
Company
Stock
Allocation
Percent of Sample Within Each Investment Range
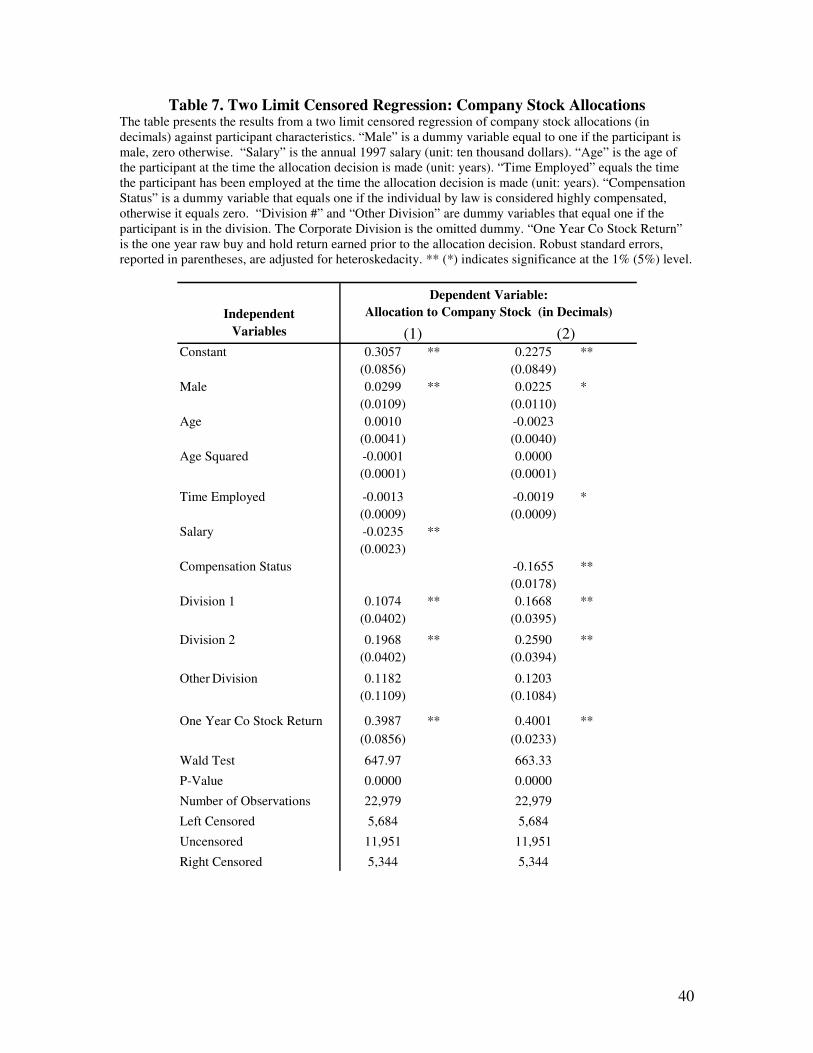
40
Table 7. Two Limit Censored Regression: Company Stock Allocations The table presents the results from a two limit censored regression of company stock allocations (in decimals) against participant characteristics. “Male” is a dummy variable equal to one if the participant is male, zero otherwise. “Salary” is the annual 1997 salary (unit: ten thousand dollars). “Age” is the age of the participant at the time the allocation decision is made (unit: years). “Time Employed” equals the time the participant has been employed at the time the allocation decision is made (unit: years). “Compensation Status” is a dummy variable that equals one if the individual by law is considered highly compensated, otherwise it equals zero. “Division #” and “Other Division” are dummy variables that equal one if the participant is in the division. The Corporate Division is the omitted dummy. “One Year Co Stock Return” is the one year raw buy and hold return earned prior to the allocation decision. Robust standard errors, reported in parentheses, are adjusted for heteroskedacity. ** (*) indicates significance at the 1% (5%) level.
Independent
Variables (1) (2)Constant 0.3057 ** 0.2275 **
(0.0856) (0.0849)
Male 0.0299 ** 0.0225 *
(0.0109) (0.0110)
Age 0.0010 -0.0023
(0.0041) (0.0040)
Age Squared -0.0001 0.0000
(0.0001) (0.0001)
Time Employed -0.0013 -0.0019 *
(0.0009) (0.0009)
Salary -0.0235 **
(0.0023)
Compensation Status -0.1655 **
(0.0178)
Division 1 0.1074 ** 0.1668 **
(0.0402) (0.0395)
Division 2 0.1968 ** 0.2590 **
(0.0402) (0.0394)
Other Division 0.1182 0.1203
(0.1109) (0.1084)
One Year Co Stock Return 0.3987 ** 0.4001 **
(0.0856) (0.0233)
Wald Test 647.97 663.33
P-Value 0.0000 0.0000
Number of Observations 22,979 22,979
Left Censored 5,684 5,684
Uncensored 11,951 11,951
Right Censored 5,344 5,344
Allocation to Company Stock (in Decimals)
Dependent Variable:
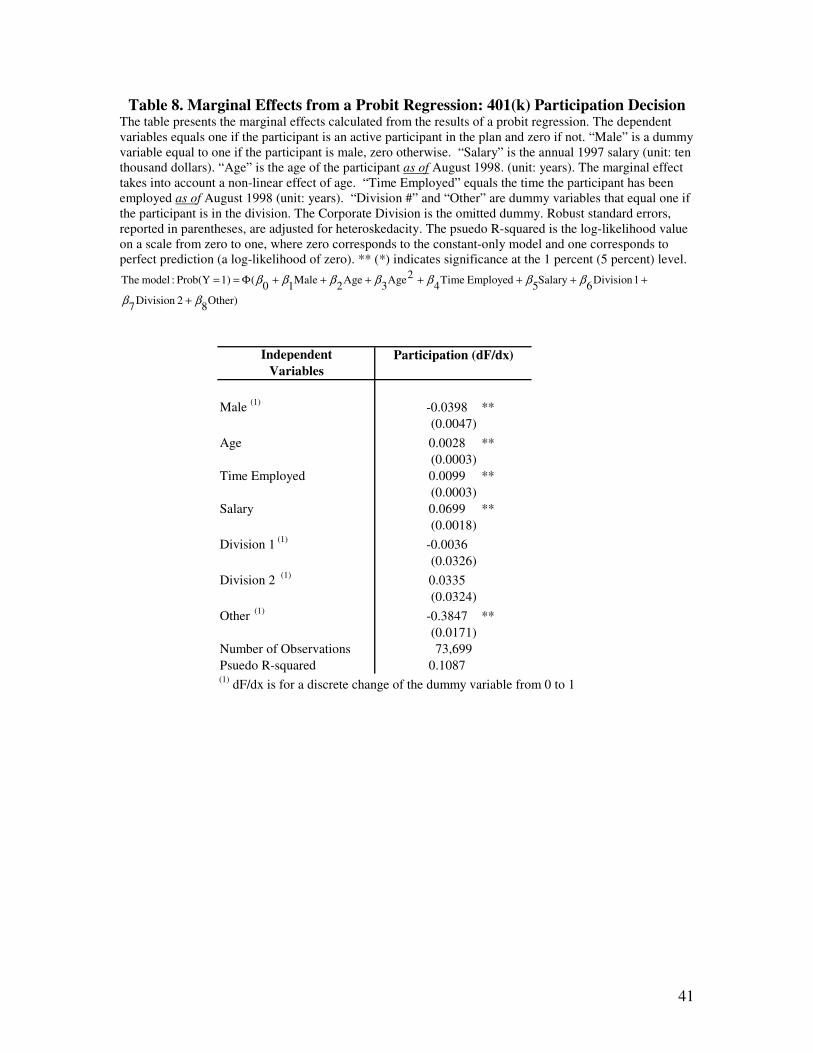
41
Table 8. Marginal Effects from a Probit Regression: 401(k) Participation Decision The table presents the marginal effects calculated from the results of a probit regression. The dependent variables equals one if the participant is an active participant in the plan and zero if not. “Male” is a dummy variable equal to one if the participant is male, zero otherwise. “Salary” is the annual 1997 salary (unit: ten thousand dollars). “Age” is the age of the participant as of August 1998. (unit: years). The marginal effect takes into account a non-linear effect of age. “Time Employed” equals the time the participant has been employed as of August 1998 (unit: years). “Division #” and “Other” are dummy variables that equal one if the participant is in the division. The Corporate Division is the omitted dummy. Robust standard errors, reported in parentheses, are adjusted for heteroskedacity. The psuedo R-squared is the log-likelihood value on a scale from zero to one, where zero corresponds to the constant-only model and one corresponds to perfect prediction (a log-likelihood of zero). ** (*) indicates significance at the 1 percent (5 percent) level.
Other)8
2 Division7
1 Division6
Salary5
EmployedTime4
2Age3
Age2
Male10
(1) Prob(Y: model The
ββ
βββββββ
+
+++++++Φ==
Independent
Variables
Male (1)
-0.0398 **
(0.0047)
Age 0.0028 **
(0.0003)
Time Employed 0.0099 **
(0.0003)
Salary 0.0699 **
(0.0018)
Division 1 (1)
-0.0036
(0.0326)
Division 2 (1)
0.0335
(0.0324)
Other (1)
-0.3847 **
(0.0171)
Number of Observations 73,699
Psuedo R-squared 0.1087(1)
dF/dx is for a discrete change of the dummy variable from 0 to 1
Participation (dF/dx)

42
Figure 1. Histograms These histograms display the frequency of participants’ allocations to each fund. The reported allocations (unmodified) and the allocations adjusted for company stock holdings (modified) are presented. The modified allocations represent the relative percent allocated to the non-company stock funds.
Panel A. Sample that Invests in All Four Funds- 3,011 observations
Unmodified Allocations Allocations Modified for Company Stock
1/n=.25
05
00
10
00
14
00
Fre
qu
en
cy
0.1.2.3.4.5.6.7.8.91Equity Income
1/n=.25
05
00
10
00
14
00
Fre
qu
en
cy
0.1.2.3.4.5.6.7.8.91S&P 500
1/n=.33
05
00
10
00
14
00
Fre
qu
en
cy
0.1.2.3.4.5.6.7.8.91Modified Equity Income
1/n=.33
05
00
10
00
14
00
Fre
qu
en
cy
0.1.2.3.4.5.6.7.8.91Modified S&P 500
1/n=.25
05
00
10
00
14
00
Fre
qu
en
cy
0.1.2.3.4.5.6.7.8.91GIC
1/n=.25
05
00
10
00
14
00
Fre
qu
en
cy
0.1.2.3.4.5.6.7.8.91Company Stock
1/n=.33
05
00
10
00
14
00
Fre
qu
en
cy
0.1.2.3.4.5.6.7.8.91Modified GIC