do chair independence and succession planning … annual meetings...do chair independence and...
TRANSCRIPT

Do Chair Independence and SuccessionPlanning Influence CEO Turnover?
Christian von Drathen�
First Draft: September, 2013
This Draft: November, 2014
Abstract
There is widespread concern that corporate boards do not suffi-
ciently punish chief executive officers (CEOs) for poor performance.
Board effectiveness in ousting CEOs may be affected by chief execu-
tives who also chair the board or influence the succession planning
process. This article explores how chair independence and succes-
sion planning influence CEO turnover. I address endogeneity is-
sues using a trinomial probit regression system of CEO turnover that
models chair independence and succession planning endogenously.
I find that succession planning has a larger positive effect on CEO
turnover than suggested by previous research. I also find that chair
independence actually reduces the probability of succession plan-
ning because it creates a friction with the common relay succession
model. There is a negative overall effect of chair independence on
CEO turnover.�Jindal School of Management, The University of Texas at Dallas (UTD), 800 West
Campbell Road, Richardson, TX 75080, USA. Email: [email protected]. I thankUlf Axelson, Vicente Cuñat, Vassilis Hajivassiliou, Daniel Paravisini, Christopher Polk,Joel Shapiro and seminar participants at LSE for helpful comments and discussions. Allerrors are my own.
1
1 Introduction
There is widespread concern that corporate boards do not sufficiently pun-ish chief executive officers (CEOs) for poor performance. This may becaused by CEO entrenchment where boards retain chief executives whoshareholders would rather see fired. Board effectiveness in ousting CEOsmay be affected by chief executives who also chair the board (CEO duality)or influence the succession planning process. Empirical research showsthat CEO turnover is less sensitive to poor stock returns when firms havedual CEO-chairs (Dahya et al. (2002), Goyal and Park (2002)), and that thelikelihood of turnover decreases when firms have no succession plan andno heir apparent is available (Naveen (2006)). Accordingly, corporate gov-ernance rules were established to encourage boards to separate the chiefexecutive role from the chairperson1 and to introduce succession planningprocedures2. However, an important issue with these studies is that theygenerally rely on variation in corporate decision variables, which is un-likely to be random. In particular, endogeneity in chair independence andsuccession planning cannot be ruled out and standard regression resultsmay be biased.
In this article, I explore how chair independence and succession plan-ning affect CEO turnover by improving corporate governance and reduc-ing entrenchment. I address concerns regarding simultaneity and omit-ted variables in chair independence and succession planning by using a
1On December 16, 2009, the SEC announced a rule (SEC Release No. 33-9089; 34-61175; http://www.sec.gov/rules/final/2009/33-9089.pdf) that requires listed compa-nies to disclose the board leadership structure, including whether the firm has combinedthe CEO and chairperson position, and explain why such a leadership structure is appro-priate.
2On October 27, 2009, the SEC eliminated the ordinary business exclusion de-fense (SEC Release No. 33-9089; 34-61175; http://www.sec.gov/rules/final/2009/33-9089.pdf) employed by firms unable or unwilling to disclose their CEO succession plan-ning process to shareholders. In changing its prior view, the SEC recognized that inade-quate CEO succession planning represents an important business risk and flags a firm’sgovernance policy issue that goes beyond daily management of the firm. Successionplanning is considered "a key board function and a significant policy (and governance)issue . . . so that a company is not adversely affected by a vacancy in leadership."
2
trivariate probit system to estimate the effect on CEO turnover. Firms ex-ecute their succession plans by appointing an heir apparent to the boardof directors, usually a separate President, Chief Operating Officer, or ViceChair. I find that such succession planning increases the probability ofCEO turnover by at least 20%. When there are no succession candidatessome chief executives are retained even though shareholders may prefer tohave them replaced. Succession planning therefore seems to reduce CEOentrenchment by eliminating a friction to turnover.
The trivariate probit system permits a chair independence effect onsuccession planning and I find a significantly negative correlation. Thismay be caused by the common relay succession model, where CEO duality(no independence) coincides with an heir apparent (succession planning).The overall effect of chair independence is therefore negative and reducesthe likelihood of CEO turnover by 4%. This unexpected result may arisebecause the positive effect of improved monitoring by independent chairsis exceeded by the frictions arising from fewer relay successions. Chair in-dependence does not seem to reduce CEO entrenchment enough to com-pensate for the reduction in heirs apparent by barring relay successions.
I address concerns regarding unobserved managerial ability by select-ing samples of natural retirements and forced turnover. CEO ability can-not be directly observed, but corporate boards learn it over time untilit becomes a known quantity (Taylor (2010)). CEOs who survive boardscrutiny until retirement age are therefore likely to have high average abil-ity while CEOs who are forced to leave earlier most likely have low aver-age ability (Fee et al. (2010)). I find that coefficient estimates are consistentacross these samples and conclude that a bias caused by unobserved CEOability is unlikely.
This article supports corporate governance rule changes that enhancesuccession planning but provides no evidence for policies that promotechair independence.
The literature on CEO turnover is well established and rooted in corpo-rate governance theory. According to Jensen and Meckling (1976), Fama(1980), and Jensen and Ruback (1983), agency theory predicts that the
3

separation of corporate ownership from control encourages managers tomaximize private benefits and decrease shareholder value. Such manage-rial behavior is typically blamed on the unwillingness or inability of cor-porate boards to effectively exercise their role as shareholder representa-tives. Fama and Jensen (1983) show that ineffective corporate governanceemerges from boards dominated by firm managers. Weisbach (1988) ob-serves that manager-dominated boards are less likely to dismiss CEOs forpoor firm performance. Chair independence has come under particularscrutiny. Agency theory suggests that chair and CEO roles be separated inorder to increase board independence and enable better oversight. Con-sistent with agency theory, Goyal and Park (2002) and Dahya et al. (2002)show that chair independence increases the likelihood of turnover withrespect to firm performance.
Parrino (1997) suggests that firms evaluate trade-offs in turnover andsuccession decisions. The potential benefit of replacing a chief executivewith a successor increases with the expected improvement in match qual-ity between firm requirements and executive characteristics, but decreaseswith uncertainty in measuring these characteristics and fixed costs of CEOturnover. Taylor (2010) shows that corporate boards learn unobservableCEO ability over time until it becomes a know quantity. Vancil (1987) fo-cuses on CEO succession planning and finds that relay successions area common pattern. The firm selects an heir apparent several years be-fore the CEO’s anticipated retirement date, the heir apparent and outgo-ing chief executive work together until the CEO leaves, and the retiringCEO remains chairperson for a few years before also transferring chair-manship to the successor. Dual CEO-chairs are therefore a normal stageduring the common relay succession cycle. Naveen (2006) revisits succes-sion planning and finds that many U.S. firms use a relay process for insidesuccessions. The departing CEO’s age also plays an important role in topexecutive changes. Murphy (1999) documents that most CEO turnoverrelates to natural retirements.
This article is organized as follows. Section 2 develops testable hy-potheses. Section 3 discusses the empirical strategy. The sample and de-
4

scriptive statistics are presented in Section 4. Section 5 shows the mainresults, and Section 6 concludes.
2 Hypotheses
Corporate governance theory suggests that chair independence reducesCEO entrenchment and therefore has a positive effect on CEO turnover.Empirical research shows that succession planning also has a positive ef-fect on CEO turnover. However, chair independence is related to succes-sion planning and therefore has an indirect effect on CEO turnover as well:relay successions require both an heir apparent and a dual CEO-chair, whoremains as dependent chair after the turnover event. Since chair indepen-dence rules out the relay succession model, there may also be fewer heirsapparent and less CEO turnover. Any positive direct effect of chair in-dependence on CEO turnover could therefore be countered by a negativeindirect effect from less effective succession planning.
I motivate the test hypotheses for the effect of chair independence andCEO succession planning on turnover as well as their interaction. Thereare three hypotheses for testing how chair independence and successionplanning, both directly and indirectly, affect CEO turnover.
Direct Effects (DE)
Chair independence decreases entrenchment. The dual role of a CEO-chair creates conflicts of interest. Such conflict may arise because incen-tives to remain CEO are strong and can lead to entrenchment. As chair-person of the board, CEO-chairs may be able to influence the board intheir own turnover decisions as well as influence the board’s successionplanning process. Chief executives usually have superior information re-garding candidate ability. CEO entrenchment strategies to delay turnoverand succession may include, for example, downplaying candidate abilityor ousting an heir apparent. Separating the chairperson from the chiefexecutive role eliminates these conflicts of interest.
5

DE1: Chair independence makes CEO turnover more likely.
Succession planning facilitates inside successions. Firms engage insuccession planning in order to facilitate managerial successions. An heirapparent is typically a firm insider and designated successor to a retiringchief executive. The absence of an heir apparent leaves only other less suit-able inside or unknown outside successors, which might be more costlyand risky. Succession planning that produces an heir apparent shouldtherefore increase the probability of turnover.
DE2: Succession planning makes CEO turnover more likely.
Indirect Effects (IE)
Relay successions require CEO duality. Relay successions are char-acterized by chief executives taking the chairperson role and by boardsselecting an heir apparent prior to the management transition. The pro-motion of chief executives to dual CEO-chairs typically takes place beforethe appointment of the heir apparent. CEO duality usually precedes heirapparent in the relay succession cycle. Since chair independence rules outthe relay succession model there may also be fewer heirs apparent.
IE: Chair independence makes succession planning less likely.These three hypotheses provide tests for both the overall effect of chair
independence on CEO turnover (DE1) and the indirect effect through thesuccession planning channel (IE and DE2). These tests can be used todisentangle the direct and indirect effect of chair independence on CEOturnover and show which dominates.
3 Empirical Strategy
Measuring the effect of chair independence and succession planning onCEO turnover is a challenge. The firm’s decisions on chair independence,succession planning, and CEO turnover are made simultaneously. For
6
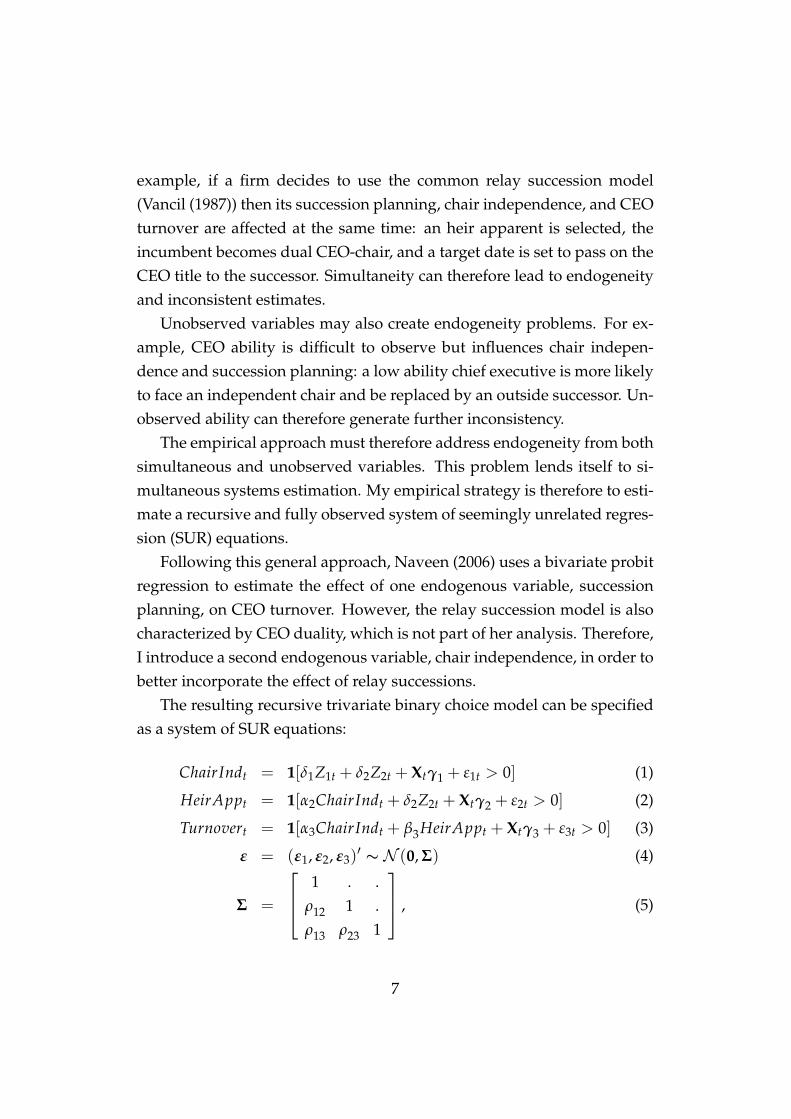
example, if a firm decides to use the common relay succession model(Vancil (1987)) then its succession planning, chair independence, and CEOturnover are affected at the same time: an heir apparent is selected, theincumbent becomes dual CEO-chair, and a target date is set to pass on theCEO title to the successor. Simultaneity can therefore lead to endogeneityand inconsistent estimates.
Unobserved variables may also create endogeneity problems. For ex-ample, CEO ability is difficult to observe but influences chair indepen-dence and succession planning: a low ability chief executive is more likelyto face an independent chair and be replaced by an outside successor. Un-observed ability can therefore generate further inconsistency.
The empirical approach must therefore address endogeneity from bothsimultaneous and unobserved variables. This problem lends itself to si-multaneous systems estimation. My empirical strategy is therefore to esti-mate a recursive and fully observed system of seemingly unrelated regres-sion (SUR) equations.
Following this general approach, Naveen (2006) uses a bivariate probitregression to estimate the effect of one endogenous variable, successionplanning, on CEO turnover. However, the relay succession model is alsocharacterized by CEO duality, which is not part of her analysis. Therefore,I introduce a second endogenous variable, chair independence, in order tobetter incorporate the effect of relay successions.
The resulting recursive trivariate binary choice model can be specifiedas a system of SUR equations:
ChairIndt = 1[δ1Z1t + δ2Z2t + Xtγ1 + ε1t > 0] (1)
HeirAppt = 1[α2ChairIndt + δ2Z2t + Xtγ2 + ε2t > 0] (2)
Turnovert = 1[α3ChairIndt + β3HeirAppt + Xtγ3 + ε3t > 0] (3)
ε = (ε1, ε2, ε3)0 s N (0, Σ) (4)
Σ =
264 1 . .ρ12 1 .ρ13 ρ23 1
375 , (5)
7
where 1[�] is the indicator function, X is a matrix of controls, ρij reflects thecorrelation between the error terms εi and εj, and the dots refer to symmet-rical elements in the lower matrix part.
Stage one (Eq. 1) defines the endogenous binary choice variable chairindependence. If the chair of the board during year t is neither the currentnor a former CEO of the firm, then the chairperson is independent andChairIndt is set to 1. Z1 and Z2 are instruments.
Stage two (Eq. 2) defines the endogenous binary choice variable heirapparent. If the board of directors during year t includes a President, ChiefOperating Officer (COO), or Vice Chair who is not the current CEO, thenthe firm has a succession plan and HeirAppt is set to 1. Z2 is an instrument.
Stage three (Eq. 3) defines the endogenous binary choice variable CEOturnover. If the CEO changes during year t, then the firm experiences aCEO turnover event and Turnovert is set to 1.
The SUR system is recursive because in each stage the endogenousvariables of previous stages appear on the RHS: chair independence is anexplanatory variable for heir apparent, while both chair independence andheir apparent are explanatory variables for CEO turnover. The SUR sys-tem is also fully observed: the endogenous variables on the RHS (Eq. 2and Eq. 3) are actual observations and not estimates. This system permitscorrelation between the error terms in each stage (Eq. 5).
The SUR system can be estimated consistently using limited informa-tion maximum likelihood (LIML). Consistency requires identically but notindependently distributed errors in each stage, and homoskedasticity inthe final stage. Wilde (2000) shows that recursive multi-equation limiteddependent variable models do not require exclusion restrictions for pa-rameter identification3. Therefore all stages, except the final one, do notneed to be fully specified and can omit influential variables.
Wooldridge (2010)4 cautions against relying solely on nonlinearity inmultivariate probit models for parameter identification, and suggests to
3Wilde (2000) proves that a single varying exogenous regressor per equation is suffi-cient to eliminate problems with small variation identification in multi-equation probitmodels using endogenous indicator variables.
4p. 599
8

use exclusion restrictions. It is therefore conservative to use two instru-ments with three exclusion restrictions for the SUR system:
1. Post-SOX indicator. The Sarbanes-Oxley (SOX) act, enacted in July2002, enhances the oversight role of public company boards. It strength-ens non-executive director independence, particularly for audit com-mittees. SOX also increases chair independence and can be consid-ered an exogenous shock. However, the legislative scope does notcover succession planning and CEO turnover. The post-SOX indi-cator is therefore an instrument for chair independence and can beexcluded from the succession planning and CEO turnover equations.Any SOX effect on succession planning and CEO turnover is thus at-tributed to the chair independence channel.
2. Conditional candidate age indicator. Executives promoted to the ex-ecutive board are succession candidates well before their official se-lection as heir apparent (Naveen (2006)). Candidates for heir appar-ent are also usually younger than the incumbent CEO. Low candi-date age increases the likelihood of succession planning (heir appar-ent) and can be considered exogenous, after controlling for candidateavailability. However, it is not plausible that conditional candidateage has a direct effect on CEO turnover. Candidate age between 44and 52, conditional on candidate availability, is therefore an instru-ment for succession planning and chair independence that can beexcluded from the CEO turnover equation. Any candidate age effecton CEO turnover is accordingly attributed to the succession plan-ning and chair independence channel.
These exclusion restrictions deliver an identified model. I estimate theSUR system using simulated maximum likelihood methods based on theGHK algorithm5.
5The GHK algorithm was developed independently by Geweke (1989), Hajivassiliouand McFadden (1998), and Keane (1994). It is implemented in Stata for general condi-tional mixed processes with the user-written command cmp by Roodman (2011).
9
3.1 Unobserved Ability
The effect of managerial ability on board decisions could generally beeliminated by conditioning on it. However, it is difficult to directly ob-serve executive ability and there are no good proxies or instruments. Myempirical strategy is therefore to condition on managerial ability by select-ing samples where executive ability is likely to be similar.
Corporate boards receive various public and private signals in orderto learn unobservable managerial ability over time (Taylor (2010)). CEOsurvival is accordingly related to ability: chief executives surviving boardscrutiny long enough to enter natural retirement should have high aver-age ability, and those that are forced out sooner should have low averageability (Weisbach (1988), Fee et al. (2010)). I therefore select two samplesthat are likely to differ in CEO ability: natural retirements with high CEOability, and forced turnover with low CEO ability. If the regression coeffi-cients are robust for different levels of CEO ability then a bias caused byunobserved heterogeneity is unlikely.
4 Data
4.1 Sample Selection
The primary data source is BoardEx, which provides information on ex-ecutive management and non-executive board members by firm for thefiscal years from 1999 to 2008. The data set is merged with Compustat foraccounting and stock market information. The sample is restricted to non-financial U.S. firms6 with a minimum of $10 million in total assets wherethe chief executive is known at the beginning and end of each fiscal year.Interim successors, identified by either the title interim or acting chief ex-ecutive or by a CEO tenure of less than one year, are excluded. A turnoverevent occurs when the chief executive leaves the firm.
After selecting the initial sample I categorize CEO turnover further by
6SIC codes between 6000 and 6999 are excluded.
10

type. I select news articles from Factiva that contain the name of each de-parting chief executive during a two-year window around the turnoverdate to classify the likely cause of the departure. Forced turnover and nat-ural retirements are identified according to the classification used by Par-rino (1997). Forced turnover is selected with the following procedure: first,all turnover where a CEOs is reported to be fired is classified as forced.Second, all other turnover in which CEOs are under age 60 are reviewedfurther. If the report does not mention that: (i) the exit is health-related,(ii) the departing CEO either takes a new job in or outside the firm, leavesfor personal or other reasons unrelated to the firm, or (iii) the chief execu-tive departs in a natural retirement, then such turnover is also classified asforced. Retirement is natural when a CEO retires and announces it at leastsix months before leaving the firm.
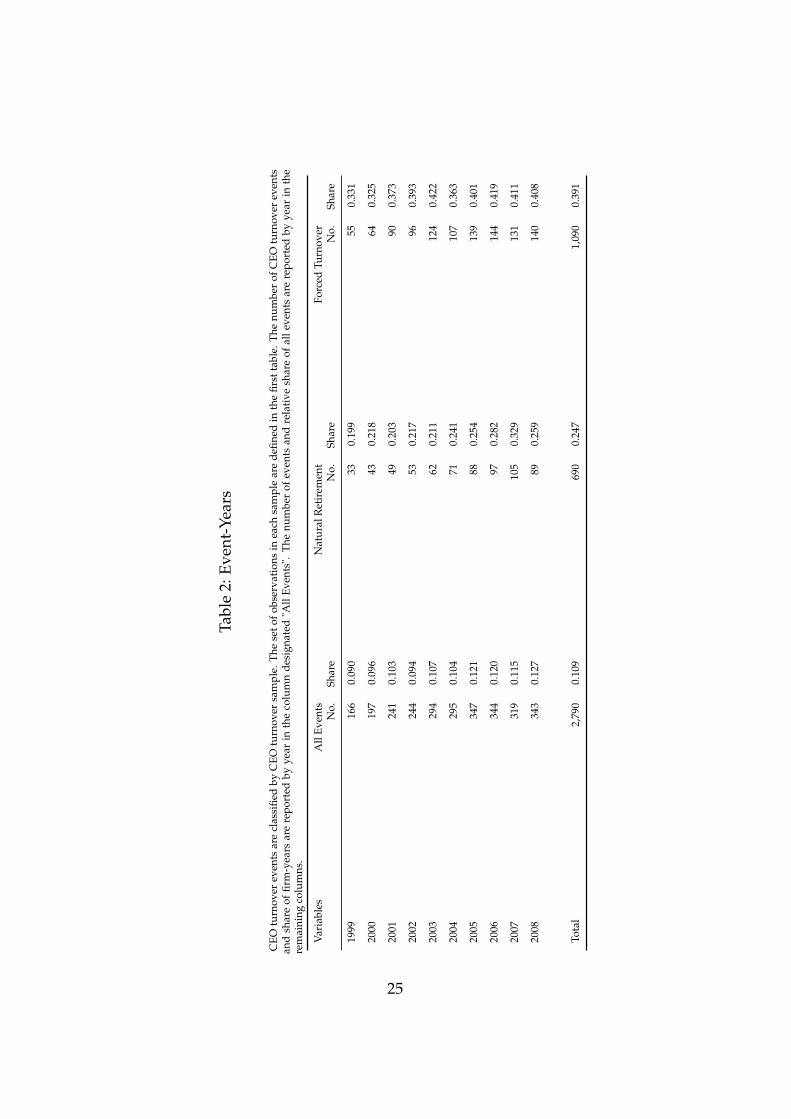
Table 1 shows a panel data set with 25, 622 firm-years, 2, 250 firms,4, 665 chief executives, and 2, 790 CEO turnover events. Of these, 690 arenatural retirements and 1, 090 are forced CEO turnover.
Each turnover event typically comes with a succession. A relay succes-sion is a planned succession, characterized by an incoming CEO who waspreviously heir apparent and a departing CEO who stays on as chairper-son. An heir apparent is a firm insider with a tenure of at least one yearwho is either president, chief operating officer, or vice chairperson of thefirm prior to the transition. Chair independence is defined here as a chair-person who is neither the current nor a former chief executive. Relay suc-cession and chair independence are mutually exclusive: relay successionsby definition require a CEO who stays on as chairperson, and thereforethe chair is not independent.
4.2 Descriptive Statistics
Since the BoardEx database is not widely used in CEO turnover research,I report several key descriptive statistics for the sample.
Table 2 reports the distribution of CEO turnover by year. The overallannual turnover rate is 10.9% and consistent with Parrino (1997), Naveen
11
(2006), and Fee et al. (2010). The average share of natural CEO retirementsis 24.7% and the average share of forced CEO turnover is 39.1%, the latterdisplaying an upward trend.
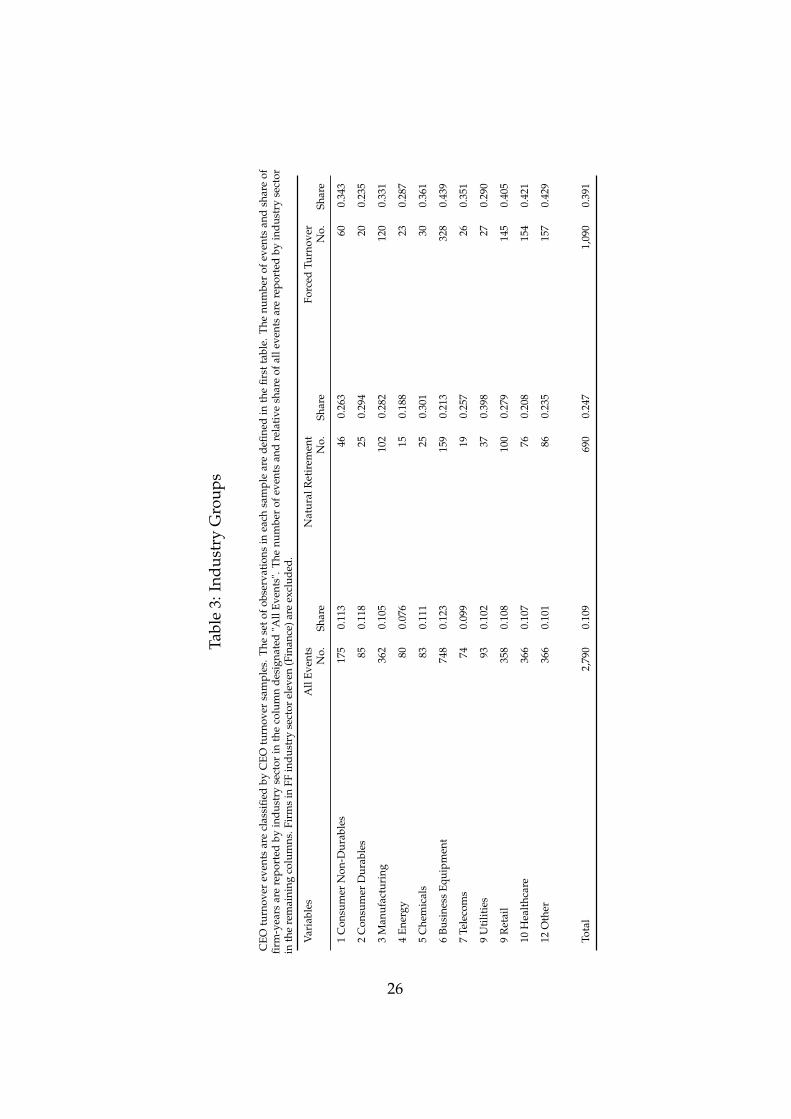
Table 3 illustrates the industry distribution of CEO turnover using theFama-French 12-industry classification system7. While the turnover ratevaries little across industry sectors, the proportion of natural retirementsand forced turnover varies considerably across sectors, this most likelyreflects differences in industry maturity and competition.
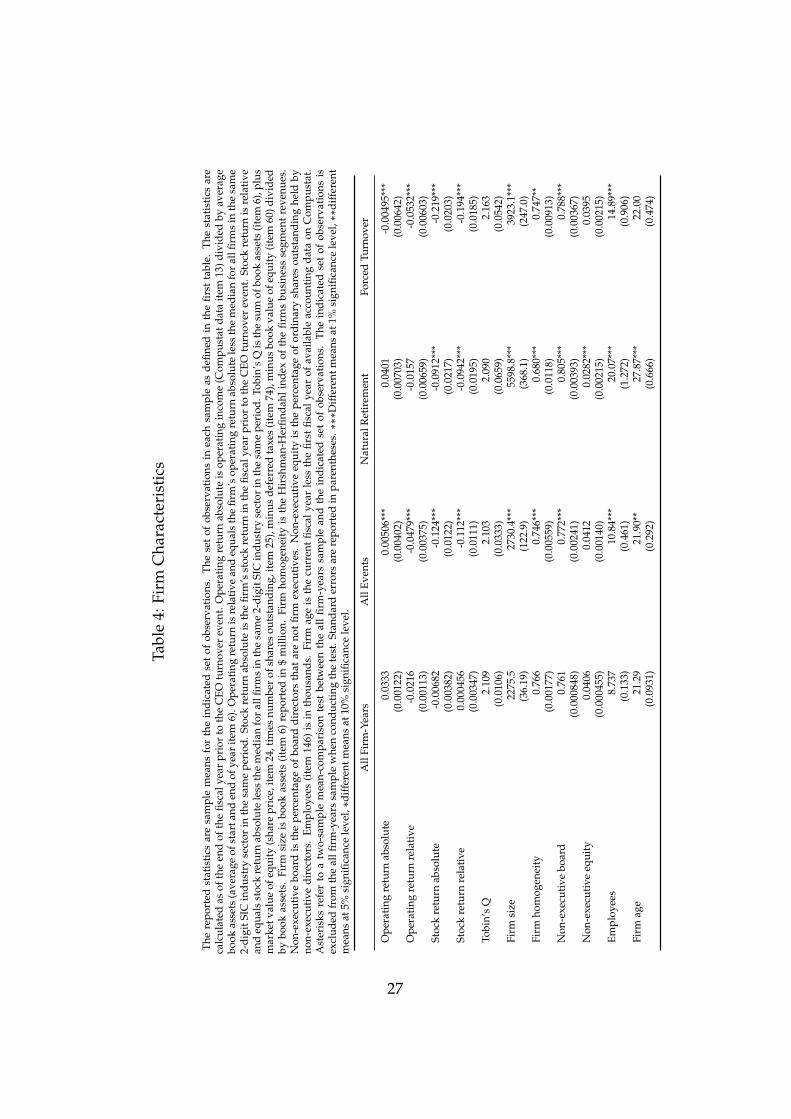
Table 4 presents firm characteristics. Turnover events are preceded bylow operating and stock returns. Firm size, age, and homogeneity, alongwith the proportion of non-executive board members are also correlatedwith CEO turnover.
Table 5 shows characteristics for incoming (Panel A) and outgoing CEOs(Panel B). The average CEO successor is 51.8 years old and replaces a 58.2year-old predecessors after a tenure of 7.7 years. Overall 28.4% of out-going chief executives have an independent chair of the board and 44.2%appoint an heir apparent. For natural retirements the average departureage is 59.4 years and CEO tenure is 7.2 years, 25.3% have an independentchairperson, and 44.9% have planned for their succession with an heir ap-parent. For forced turnover the average exit age is 54.8 years and tenureis 6.1 years, 34.2% have an independent chair, and 32.8% have an heir ap-parent.
Panel B also displays the succession type for departing chief execu-tives. Relay successions account for 23.3%, other inside successions for41.7%, and outside successions for 34.9% of all CEO turnover, respectively.Relay successions represent only 10.6% but outside successions accountfor 40.7% of forced turnover.
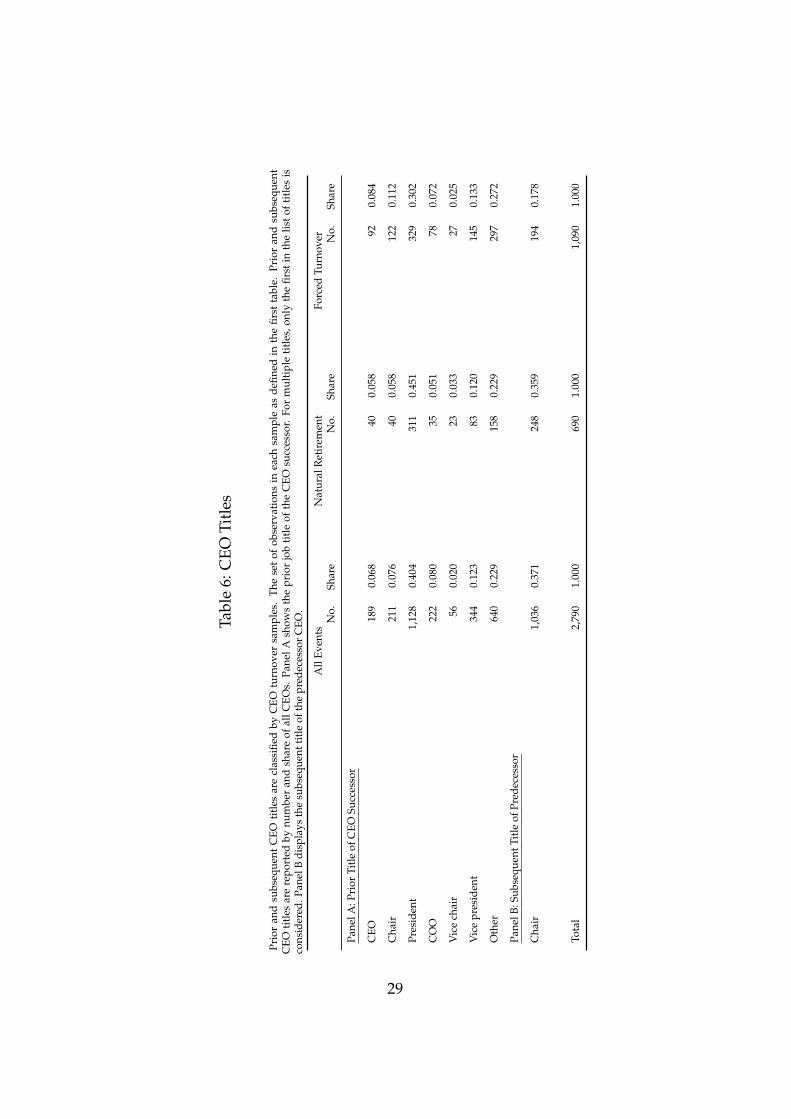
Table 6 presents the prior title of the incoming and subsequent tile ofthe outgoing CEO, respectively. Of the incoming CEOs 6.8% were CEOat another firm, while 7.6% were chairperson, 40.4% president, 7.8% chiefoperating officer, and 1.8% vice chair at the firm, respectively. Of the out-
7Definition of Fama-French 12-industry classification available athttp://mba.tuck.dartmouth.edu/pages/faculty/ken.french/
12
going CEOs 37.1% stay on as chairperson.There is a close relationship between chair independence, succession
planning and CEO turnover.Figure 1 presents the proportion of firms that have an independent
chairperson, i.e. a chair who is neither the current nor a former CEO.This figure shows that chair independence is strongly correlated with CEOturnover. The increase in chair independence around CEO turnover re-flects the fact that departing dual CEO-chairs do not always become non-executive chairperson.
Figure 2 displays the share of firms that plan CEO successions by ap-pointing an heir apparent. It shows that succession planning is stronglycorrelated with CEO turnover, particularly for natural retirements. Theshare of heirs apparent increases before the CEO turnover period and de-creases afterwards. This reflects that most firms only install one heir ap-parent who either becomes the next chief executive or typically leaves.
5 Results
The multivariate results are presented in three parts. First, I present a stan-dard probit regression of CEO turnover on exogenous covariates. Second,I display a "naïve" probit regression of CEO turnover that adds chair inde-pendence and succession planning but erroneously treats these endoge-nous variables as exogenous. Third, I show my main result: a trinomialprobit regression system of CEO turnover that models chair independenceand succession planning endogenously. These approaches produce signif-icantly different results and show that treating endogenous variables asexogenous can lead to large errors.
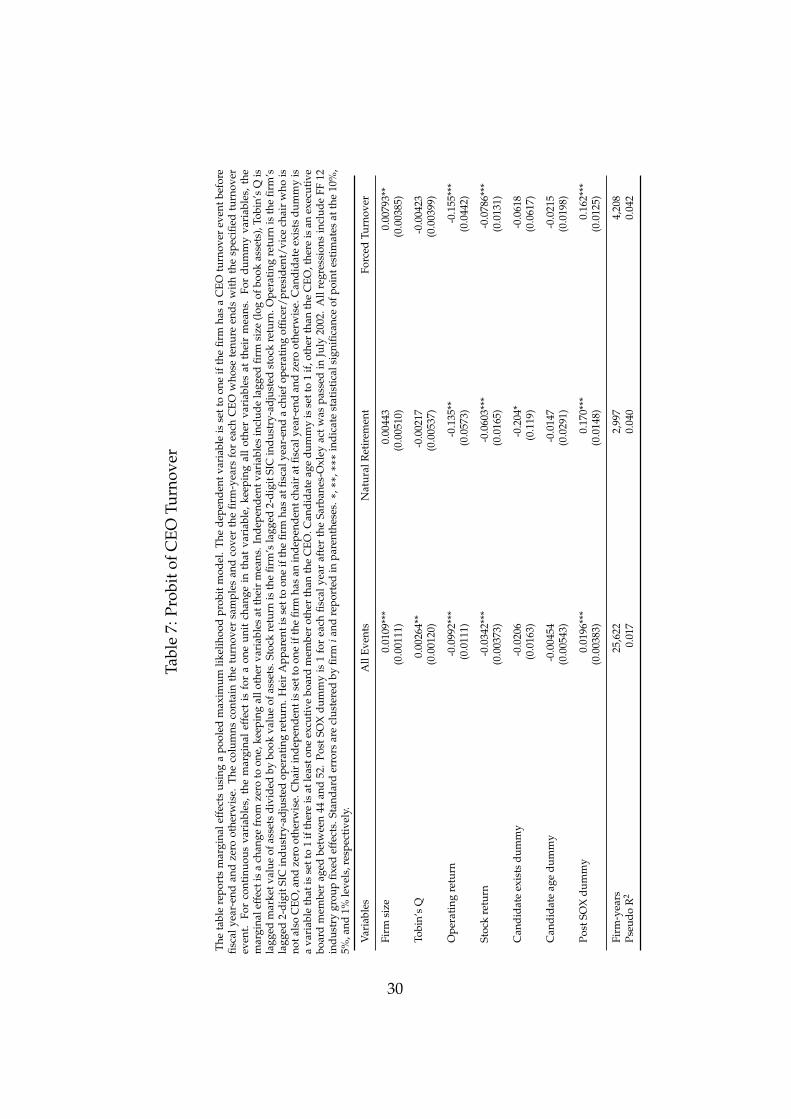
5.1 Standard Probit Regression
Table 7 shows the marginal effects for a standard probit regression of CEOturnover on exogenous variables. Industry-adjusted operating and stockreturns are significantly negative. This is consistent with the relative per-
13
formance evaluation hypothesis where firm performance measured rel-ative to industry benchmarks reveals CEO ability and untalented chiefexecutives are replaced. The post-Sarbanes-Oxley (SOX) dummy is alsosignificant, indicating that after 2002 CEO turnover increased.
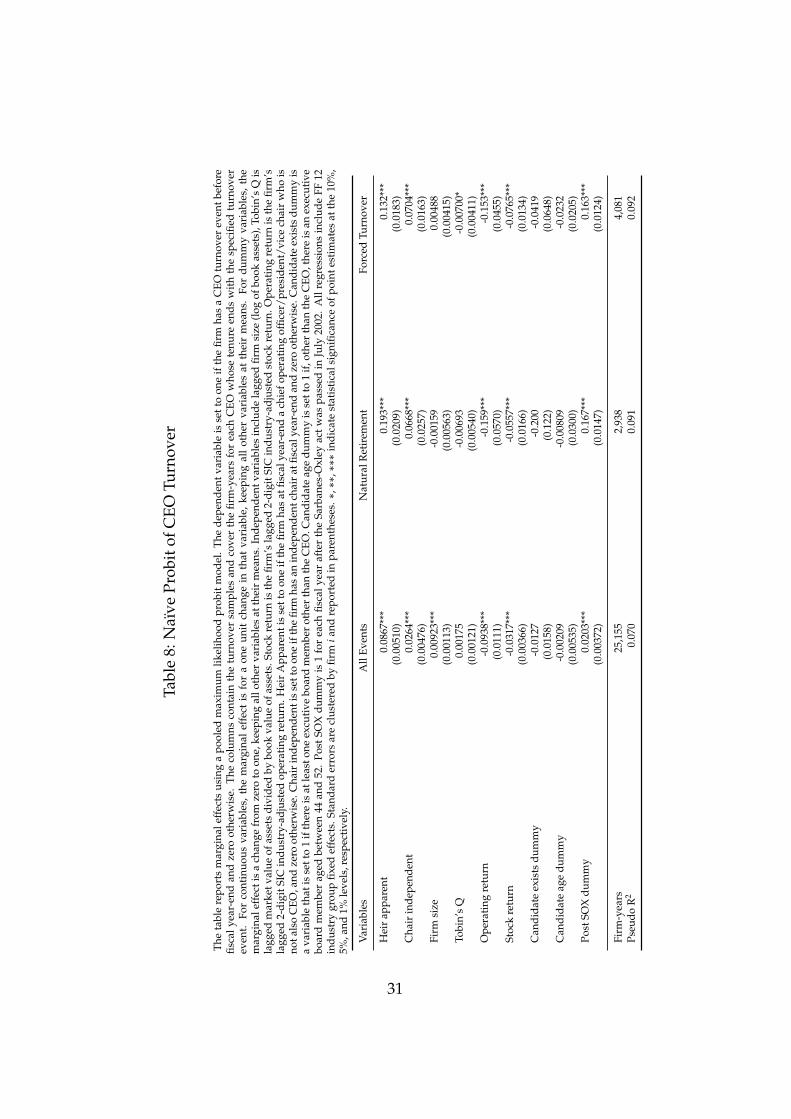
5.2 Naïve Probit Regression
Next, I analyze a naïve regression that ignores the endogeneity in chair in-dependence and succession planning. Firms most likely determine chairindependence and succession planning simultaneously but ignoring si-multaneity usually leads to inconsistent estimates. In order to explore theseverity of this issue it is instructive to compare these results with the morerobust methods further on.
Table 8 displays the marginal effects for a probit regression of CEOturnover on several exogenous variables, as well as on the endogenousvariables succession planning and chair independence. Succession plan-ning (heir apparent) seems to have a highly significant effect that increasesthe probability of CEO turnover by 19.3% for natural retirements, 13.2%for forced turnover, and 8.7% overall. Chair independence also appearsto have a highly significantly effect that increases the likelihood of CEOturnover by 6.7% for natural retirements, 7.0% for forced turnover, and2.6% overall.
The naïve regression results rely on the assumption that successionplanning and chair independence are exogenous, which is not plausible. Ifthese variables are functions of other variables then these estimates couldbe inconsistent. It is therefore better to use a model that is flexible enoughto deal with endogenously determined variables.
5.3 Trivariate Probit Regression System
I use a system of recursive, fully observed, and seemingly unrelated re-gressions (SUR) in order to estimate a model with endogenous variables.The SUR model includes three stages: the first stage is a standard probit
14
regression for chair independence (Eq. 1); the second stage is a bivariateprobit for succession planning (heir apparent) on chair independence (Eq.2); and the third stage is a trivariate probit for CEO turnover on chair in-dependence and succession planning (Eq. 3). For better identification Iimpose one exclusion restriction on the second stage and two on the thirdstage.
Table 9 shows the first stage, reporting the marginal effects of a probitregression for chair independence on exogenous covariates. Firm size hasa significantly negative correlation with chair independence since largerfirms are less likely to have an independent director chairing the board.Operating return has a significantly negative correlation with chair inde-pendence because underperforming firms are more likely to have an in-dependent chair. The insignificant coefficient for the natural retirementsample may reflect upward earnings management by retiring CEOs. Can-didate age between 44 and 52 (after controlling for candidate existence)has a significantly positive correlation with chair independence. Execu-tive board members within that age group are more likely to serve underan independent chairperson. Chair independence also increases signifi-cantly during the post-SOX years.
The candidate age dummy (after controlling for candidate existence)and the post-SOX dummy serve as instruments in the SUR model. Table 9shows that both are significantly correlated with chair independence andtherefore relevant instruments for the first stage.
Table 10 presents the second stage, displaying the marginal effects ofa bivariate probit regression for succession planning (heir apparent) onchair independence and exogenous variables. Firm size is positively cor-related with succession planning; the larger a firm, the larger its internaltalent pool and the higher the likelihood of an internal heir apparent. To-bin’s Q is positively correlated with succession planning; the higher themarginal value of the firm, the higher the return to talent and the higherthe likelihood of an internal heir apparent.
Chair independence is weakly negatively correlated with successionplanning since independent chairs are less likely to appoint an heir appar-
15
ent from inside the firm. Chair independence is structurally incompatiblewith relay successions where the departing dual CEO-chair remains on theboard as a (dependent) chairperson. The test result is consistent with hy-pothesis IE that chair independence makes succession planning less likely.
The candidate age dummy (after controlling for candidate existence)is an instrument in the SUR model. Table 10 shows that it is significantlycorrelated with succession planning and therefore a relevant instrumentfor the second stage.
The SUR model uses fully observed dependent variables in all stagesand estimates the correlation between the respective error terms. Thisproperty makes it robust to omitted variable problems in all stages ex-cept the final. The regression estimates are consistent even if influentialvariables are omitted in the first stage. The correlation between the errorterms for the first (chair independence) and second (heir apparent) stageis reported as atanh(ρ12) and significantly negative. This shows that thereis an endogenous relationship between succession planning and chair in-dependence.
Table 11 presents the third and final stage. It presents the marginaleffects for a trivariate, recursive probit regression of CEO turnover on suc-cession planning (heir apparent), chair independence and exogenous vari-ables.
Succession planning (heir apparent) is significantly correlated with CEOturnover, increasing the likelihood of CEO turnover by 32.3% for naturalretirements, 22.0% for forced turnover, and 20.4% overall. Firms that havean heir apparent are much more likely to fire a chief executive. Withoutan heir apparent in place, firms show a greatly reduced willingness to dis-miss the CEO, possibly due to the higher cost and risk of using an untestedsuccessor from inside or outside the company. These results are consistentwith hypothesis DE2 that succession planning makes CEO turnover morelikely.
Chair independence is significantly correlated with CEO turnover, de-creasing the likelihood of CEO turnover by 4.0% overall (the coefficientestimates are similar for both natural retirements and forced turnover but
16
less significant). Independent chairs are less likely to fire a CEO. Thesetest results are not consistent with hypothesis DE1 because chair indepen-dence makes CEO turnover less likely.
The explanation seems to be as follows: A relay succession alwayscomes with both an heir apparent and a dependent chair. Chair inde-pendence therefore rules out relay successions, and CEO turnover is nega-tively affected by fewer (relay) heirs apparent. Any positive effect for chairindependence on CEO turnover seems to be exceeded by the negative ef-fect from the succession planning (heir apparent) channel.
Industry-adjusted operating and stock returns are significantly nega-tive. This is again consistent with the relative performance evaluation hy-pothesis.
The correlation between the error terms for the first (chair indepen-dence) and second (heir apparent) stage is again atanh(ρ12), for the first(chair independence) and third (CEO turnover) stage is atanh(ρ13), and forthe second (heir apparent) and third (CEO turnover) stage is atanh(ρ23).The correlation is in all cases highly significant and shows that there is anendogenous relationship between chair independence, succession plan-ning, and CEO turnover.
When comparing these results with the naïve regressions above it seemsthat endogeneity indeed greatly influences the estimates for chair inde-pendence and the existence of an heir apparent. The correlation betweensuccession planning (heir apparent) and CEO turnover is approximatelytwice that suggested by the single-equation model. The correlation be-tween chair independence and CEO turnover changes sign and becomessignificantly negative. Clearly there is a substantial bias in the naïve single-equation regressions and renders them useless when endogeneity is present.
Succession planning seems to have an even larger effect on CEO turnoverthan suggested by previous research. Chair independence does not seemto sufficiently improve corporate governance. Instead, chair independencerules out the common relay succession model and appears to cause fric-tions that exceed its potential benefits.
17
6 Conclusion
There is extensive literature on the individual determinants of CEO turnover.However, only a few articles have examined more complex systems of cor-porate decision making and address endogeneity issues in observationaldata.
This paper analyzes how chair independence and succession planninginfluence CEO turnover. I use a recursive SUR system in order to provideconsistent estimates of decision variables that are determined simultane-ously with omitted variables. A new comprehensive data set permits theselection of a large sample.
The analysis shows that succession planning has an even larger effecton CEO turnover than suggested by previous research. Chair indepen-dence has a significantly negative effect on succession planning due tofrictions with the common relay succession model. Overall, chair inde-pendence makes CEO turnover less likely.
Subsamples of natural CEO retirements and forced turnover show thatthese results are not driven by unobserved hetherogeneity in CEO ability.
These results differ markedly from a naïve regression that ignores en-dogeneity in chair independence and succession planning, as well as demon-strating that great care must be exercised when analyzing the effect of en-dogenous corporate decision variables.
18
References
Dahya, J., J. McConnell, and N. Travlos (2002). The Cadbury Committee,Corporate Performance, and Top Management Turnover. Journal ofFinance 57(1), 461–483.
Fama, E. (1980). Agency Problems and the Theory of the Firm. Journalof Political Economy, 288–307.
Fama, E. and M. Jensen (1983). Separation of Ownership and Control.Journal of Law & Econonmics 26, 301.
Fee, C., C. Hadlock, and J. Pierce (2010). Managers Who Lack Style:Evidence from Exogenous CEO changes. Working paper, MichiganState University.
Geweke, J. (1989). Bayesian Inference in Econometric Models UsingMonte Carlo Integration. Econometrica, 1317–1339.
Goyal, V. and C. Park (2002). Board Leadership Structure and CEOTurnover. Journal of Corporate Finance 8(1), 49–66.
Hajivassiliou, V. and D. McFadden (1998). The Method of SimulatedScores for the Estimation of LDV Models. Econometrica, 863–896.
Jensen, M. and W. Meckling (1976). Theory of the Firm: Managerial Be-havior, Agency Costs and Ownership Structure. Journal of FinancialEconomics 3(4), 305–360.
Jensen, M. and R. Ruback (1983). The Market for Corporate Control: TheScientific Evidence. Journal of Financial Economics 11(1-4), 5–50.
Keane, M. (1994). A Computationally Practical Simulation Estimator forPanel Data. Econometrica, 95–116.
Murphy, K. (1999). Executive Compensation. Handbook of LaborEconomics 3, 2485–2563.
Naveen, L. (2006). Organizational Complexity and Succession Planning.Journal of Financial & Quantitative Analysis 41(03), 661–683.
19
Parrino, R. (1997). CEO Turnover and Outside Succession: A Cross-Sectional Analysis. Journal of Financial Economics 46(2), 165–197.
Roodman, D. (2011). Fitting Fully Observed Recursive Mixed-ProcessModels with CMP. Stata Journal 11(2), 159–206.
Taylor, L. A. (2010). Why are CEOs Rarely Fired? Evidence from Struc-tural Estimation. Journal of Finance 65(6), 2051–2087.
Vancil, R. F. (1987). Passing the Baton: Managing the Process of CEO Succession.Harvard Business School Press, Boston, MA.
Weisbach, M. (1988). Outside Directors and CEO Turnover. Journal ofFinancial Economics 20, 431–460.
Wilde, J. (2000). Identification of Multiple Equation Probit Models withEndogenous Dummy Regressors. Economics Letters 69(3), 309–312.
Wooldridge, J. M. (2010). Econometric Analysis of Cross Section and Panel Data, 2nd edition.MIT Press, Cambridge, MA.
20
7 Figures and Tables
21

Figure 1: Chair Independence by Period
0.1
.2.3
.4.5
Sha
re
5 4 3 2 1 0 1 2 3 4 5Event Year
Natural Retirement Forced Turnover
22

Figure 2: Heir Apparent by Period
.1.2
.3.4
.5S
hare
5 4 3 2 1 0 1 2 3 4 5Event Year
Natural Retirement Forced Turnover
23

Tabl
e1:
Sam
ple
Stat
isti
cs
The
sam
ple
incl
udes
allC
EOs
iden
tifie
dfr
omBo
ardE
xbe
twee
n19
99an
d20
08.
This
data
isth
enm
erge
dw
ith
Com
pust
atfo
rac
coun
ting
and
stoc
kpr
ice
info
rmat
ion.
The
data
seti
sre
stri
cted
tono
n-fin
anci
alfir
ms
inco
rpor
ated
inth
eU
.S.w
ith
am
inim
umof
US$
10m
illio
nin
tota
lass
ets
whe
reth
eid
enti
tyof
the
CEO
iskn
own
atth
ebe
ginn
ing
and
end
ofea
chfis
caly
ear.
Inte
rim
succ
esso
rs,i
dent
ified
byei
ther
the
titl
ein
teri
mor
acti
ngch
ief
exec
utiv
e,or
bya
CEO
tenu
reof
less
than
one
year
,are
excl
uded
.Atu
rnov
erev
enth
asoc
curr
edw
hen
the
iden
tity
ofa
chie
fexe
cuti
veat
fisca
lyea
r-en
ddi
ffer
sfr
omth
atat
the
begi
nnin
gof
afis
caly
ear.
The
natu
ralr
etir
emen
tan
dfo
rced
exit
subs
ampl
esar
eca
tego
rize
dac
cord
ing
toa
met
hod
desc
ribe
din
Parr
ino
(199
7).
No.
Shar
e
All
firm
-yea
rs25
,622
All
com
pani
es2,
250
All
CEO
s4,
665
CEO
Turn
over
Sam
ples
All
even
ts2,
790
1.00
0
Nat
ural
reti
rem
ent
690
0.24
7
Forc
edtu
rnov
er1,
090
0.39
1
24
Tabl
e2:
Even
t-Ye
ars
CEO
turn
over
even
tsar
ecl
assi
fied
byC
EOtu
rnov
ersa
mpl
e.Th
ese
tofo
bser
vati
ons
inea
chsa
mpl
ear
ede
fined
inth
efir
stta
ble.
The
num
ber
ofC
EOtu
rnov
erev
ents
and
shar
eof
firm
-yea
rsar
ere
port
edby
year
inth
eco
lum
nde
sign
ated
"All
Even
ts".
The
num
ber
ofev
ents
and
rela
tive
shar
eof
alle
vent
sar
ere
port
edby
year
inth
ere
mai
ning
colu
mns
.
Var
iabl
esA
llEv
ents
Nat
ural
Ret
irem
ent
Forc
edTu
rnov
erN
o.Sh
are
No.
Shar
eN
o.Sh
are
1999
166
0.09
033
0.19
955
0.33
1
2000
197
0.09
643
0.21
864
0.32
5
2001
241
0.10
349
0.20
390
0.37
3
2002
244
0.09
453
0.21
796
0.39
3
2003
294
0.10
762
0.21
112
40.
422
2004
295
0.10
471
0.24
110
70.
363
2005
347
0.12
188
0.25
413
90.
401
2006
344
0.12
097
0.28
214
40.
419
2007
319
0.11
510
50.
329
131
0.41
1
2008
343
0.12
789
0.25
914
00.
408
Tota
l2,
790
0.10
969
00.
247
1,09
00.
391
25
Tabl
e3:
Indu
stry
Gro
ups
CEO
turn
over
even
tsar
ecl
assi
fied
byC
EOtu
rnov
ersa
mpl
es.
The
seto
fobs
erva
tion
sin
each
sam
ple
are
defin
edin
the
first
tabl
e.T
henu
mbe
rof
even
tsan
dsh
are
offir
m-y
ears
are
repo
rted
byin
dust
ryse
ctor
inth
eco
lum
nde
sign
ated
"All
Even
ts".
The
num
ber
ofev
ents
and
rela
tive
shar
eof
alle
vent
sar
ere
port
edby
indu
stry
sect
orin
the
rem
aini
ngco
lum
ns.F
irm
sin
FFin
dust
ryse
ctor
elev
en(F
inan
ce)a
reex
clud
ed.
Var
iabl
esA
llEv
ents
Nat
ural
Ret
irem
ent
Forc
edTu
rnov
erN
o.Sh
are
No.
Shar
eN
o.Sh
are
1C
onsu
mer
Non
-Dur
able
s17
50.
113
460.
263
600.
343
2C
onsu
mer
Dur
able
s85
0.11
825
0.29
420
0.23
5
3M
anuf
actu
ring
362
0.10
510
20.
282
120
0.33
1
4En
ergy
800.
076
150.
188
230.
287
5C
hem
ical
s83
0.11
125
0.30
130
0.36
1
6Bu
sine
ssEq
uipm
ent
748
0.12
315
90.
213
328
0.43
9
7Te
leco
ms
740.
099
190.
257
260.
351
9U
tilit
ies
930.
102
370.
398
270.
290
9R
etai
l35
80.
108
100
0.27
914
50.
405
10H
ealt
hcar
e36
60.
107
760.
208
154
0.42
1
12O
ther
366
0.10
186
0.23
515
70.
429
Tota
l2,
790
0.10
969
00.
247
1,09
00.
391
26
Tabl
e4:
Firm
Cha
ract
eris
tics
The
repo
rted
stat
isti
csar
esa
mpl
em
eans
for
the
indi
cate
dse
tof
obse
rvat
ions
.Th
ese
tof
obse
rvat
ions
inea
chsa
mpl
eas
defin
edin
the
first
tabl
e.T
hest
atis
tics
are
calc
ulat
edas
ofth
een
dof
the
fisca
lyea
rpr
ior
toth
eC
EOtu
rnov
erev
ent.
Ope
rati
ngre
turn
abso
lute
isop
erat
ing
inco
me
(Com
pust
atda
tait
em13
)div
ided
byav
erag
ebo
okas
sets
(ave
rage
ofst
arta
nden
dof
year
item
6).O
pera
ting
retu
rnis
rela
tive
and
equa
lsth
efir
m’s
oper
atin
gre
turn
abso
lute
less
the
med
ian
for
allfi
rms
inth
esa
me
2-di
gitS
ICin
dust
ryse
ctor
inth
esa
me
peri
od.
Stoc
kre
turn
abso
lute
isth
efir
m’s
stoc
kre
turn
inth
efis
caly
ear
prio
rto
the
CEO
turn
over
even
t.St
ock
retu
rnis
rela
tive
and
equa
lsst
ock
retu
rnab
solu
tele
ssth
em
edia
nfo
ral
lfirm
sin
the
sam
e2-
digi
tSIC
indu
stry
sect
orin
the
sam
epe
riod
.Tob
in’s
Qis
the
sum
ofbo
okas
sets
(ite
m6)
,plu
sm
arke
tval
ueof
equi
ty(s
hare
pric
e,it
em24
,tim
esnu
mbe
rof
shar
esou
tsta
ndin
g,it
em25
),m
inus
defe
rred
taxe
s(i
tem
74),
min
usbo
okva
lue
ofeq
uity
(ite
m60
)div
ided
bybo
okas
sets
.Fi
rmsi
zeis
book
asse
ts(i
tem
6)re
port
edin
$m
illio
n.Fi
rmho
mog
enei
tyis
the
Hir
shm
an-H
erfin
dahl
inde
xof
the
firm
sbu
sine
ssse
gmen
tre
venu
es.
Non
-exe
cuti
vebo
ard
isth
epe
rcen
tage
ofbo
ard
dire
ctor
sth
atar
eno
tfir
mex
ecut
ives
.N
on-e
xecu
tive
equi
tyis
the
perc
enta
geof
ordi
nary
shar
esou
tsta
ndin
ghe
ldby
non-
exec
utiv
edi
rect
ors.
Empl
oyee
s(i
tem
146)
isin
thou
sand
s.Fi
rmag
eis
the
curr
ent
fisca
lyea
rle
ssth
efir
stfis
caly
ear
ofav
aila
ble
acco
unti
ngda
taon
Com
pust
at.
Ast
eris
ksre
fer
toa
two-
sam
ple
mea
n-co
mpa
riso
nte
stbe
twee
nth
eal
lfir
m-y
ears
sam
ple
and
the
indi
cate
dse
tof
obse
rvat
ions
.T
hein
dica
ted
set
ofob
serv
atio
nsis
excl
uded
from
the
allfi
rm-y
ears
sam
ple
whe
nco
nduc
ting
the
test
.Sta
ndar
der
rors
are
repo
rted
inpa
rent
hese
s.���D
iffer
entm
eans
at1%
sign
ifica
nce
leve
l,��
diff
eren
tm
eans
at5%
sign
ifica
nce
leve
l,�d
iffer
entm
eans
at10
%si
gnifi
canc
ele
vel.
All
Firm
-Yea
rsA
llEv
ents
Nat
ural
Ret
irem
ent
Forc
edTu
rnov
er
Ope
rati
ngre
turn
abso
lute
0.03
330.
0050
6***
0.04
01-0
.004
95**
*(0
.001
22)
(0.0
0402
)(0
.007
03)
(0.0
0642
)O
pera
ting
retu
rnre
lati
ve-0
.021
6-0
.047
9***
-0.0
157
-0.0
532*
**(0
.001
13)
(0.0
0375
)(0
.006
59)
(0.0
0603
)St
ock
retu
rnab
solu
te-0
.006
82-0
.124
***
-0.0
912*
**-0
.219
***
(0.0
0382
)(0
.012
2)(0
.021
7)(0
.020
3)St
ock
retu
rnre
lati
ve0.
0004
56-0
.112
***
-0.0
942*
**-0
.194
***
(0.0
0347
)(0
.011
1)(0
.019
5)(0
.018
5)To
bin’
sQ
2.10
92.
103
2.09
02.
163
(0.0
106)
(0.0
333)
(0.0
659)
(0.0
542)
Firm
size
2275
.527
30.4
***
5598
.8**
*39
23.1
***
(36.
19)
(122
.9)
(368
.1)
(247
.0)
Firm
hom
ogen
eity
0.76
60.
746*
**0.
680*
**0.
747*
*(0
.001
77)
(0.0
0559
)(0
.011
8)(0
.009
13)
Non
-exe
cuti
vebo
ard
0.76
10.
772*
**0.
805*
**0.
788*
**(0
.000
848)
(0.0
0241
)(0
.003
93)
(0.0
0367
)N
on-e
xecu
tive
equi
ty0.
0406
0.04
120.
0282
***
0.03
95(0
.000
455)
(0.0
0140
)(0
.002
15)
(0.0
0215
)Em
ploy
ees
8.73
710
.84*
**20
.07*
**14
.89*
**(0
.133
)(0
.461
)(1
.272
)(0
.906
)Fi
rmag
e21
.29
21.9
0**
27.8
7***
22.0
0(0
.093
1)(0
.292
)(0
.666
)(0
.474
)
27

Tabl
e5:
CEO
Cha
ract
eris
tics
The
repo
rted
stat
isti
csar
esa
mpl
em
eans
for
the
indi
cate
dse
tof
obse
rvat
ions
.Th
ese
tof
obse
rvat
ions
inea
chsa
mpl
eas
defin
edin
the
first
tabl
e.T
hest
atis
tics
are
calc
ulat
edas
ofth
een
dof
the
fisca
lyea
rpr
ior
toth
eC
EOtu
rnov
erev
ent(
unle
ssst
ated
othe
rwis
e).
Pane
lAsh
ows
stat
isti
csfo
rth
eC
EOsu
cces
sor
and
Pane
lBfo
rth
epr
edec
esso
r.A
geis
inye
ars
atfis
caly
ear-
end.
Col
lege
issh
are
ofC
EOs
wit
hgr
adua
tede
gree
.MBA
issh
are
ofC
EOs
wit
hM
BAde
gree
.Org
aniz
atio
nalt
enur
eis
year
sin
sam
efir
mat
fisca
lyea
r-en
d.In
dust
ryte
nure
isye
ars
inpu
blic
U.S
.firm
insa
me
2-di
gitS
ICin
dust
ryse
ctor
atfis
caly
ear-
end.
Lead
ersh
ipte
nure
isye
ars
asC
EOor
ashe
irap
pare
ntat
fisca
lyea
r-en
d.C
hair
inde
pend
ence
isth
esh
are
ofch
airs
who
are
nott
hecu
rren
tor
afo
rmer
CEO
.Hei
rap
pare
ntis
shar
eof
CEO
sw
hoha
veat
leas
ton
ehe
irap
pare
nt.
Ast
eris
ksre
fer
toa
two-
sam
ple
mea
n-co
mpa
riso
nte
stbe
twee
nth
eal
lfirm
-yea
rssa
mpl
ean
dth
ein
dica
ted
seto
fob
serv
atio
ns.
The
indi
cate
dse
tof
obse
rvat
ions
isex
clud
edfr
omth
eal
lfirm
-yea
rssa
mpl
ew
hen
cond
ucti
ngth
ete
st.
Stan
dard
erro
rsar
ere
port
edin
pare
nthe
ses.���
Diff
eren
tmea
nsat
1%si
gnifi
canc
ele
vel,��
diff
eren
tmea
nsat
5%si
gnifi
canc
ele
vel,�
diff
eren
tmea
nsat
10%
sign
ifica
nce
leve
l.
All
Firm
-Yea
rsA
llEv
ents
Nat
ural
Ret
irem
ent
Forc
edTu
rnov
er
Pane
lA:C
EOSu
cces
sor
Age
55.0
551
.78*
**52
.41*
**52
.29*
**(0
.051
2)(0
.142
)(0
.269
)(0
.238
)C
olle
ge0.
799
0.84
2***
0.88
3***
0.86
1***
(0.0
0250
)(0
.006
91)
(0.0
123)
(0.0
105)
MBA
0.27
30.
324*
**0.
367*
**0.
339*
**(0
.002
78)
(0.0
0886
)(0
.018
4)(0
.014
3)O
rgan
izat
iona
lten
ure
13.3
17.
008*
**7.
515*
**6.
335*
**(0
.065
7)(0
.163
)(0
.357
)(0
.255
)Pa
nelB
:Pre
dece
ssor
Age
61.0
758
.23*
**59
.35*
**54
.84*
**(0
.086
7)(0
.168
)(0
.302
)(0
.227
)C
EOte
nure
7.99
27.
664*
**7.
230*
**6.
136*
**(0
.070
4)(0
.138
)(0
.264
)(0
.170
)O
rgan
izat
iona
lten
ure
15.9
813
.86*
**15
.19*
11.5
6***
(0.1
17)
(0.2
19)
(0.4
59)
(0.3
04)
Cha
irin
depe
nden
t0.
257
0.28
4***
0.25
30.
342*
**(0
.002
76)
(0.0
0871
)(0
.016
8)(0
.014
7)H
eir
appa
rent
0.28
90.
442*
**0.
499*
**0.
328*
**(0
.002
83)
(0.0
0940
)(0
.019
0)(0
.014
2)R
elay
succ
essi
on0.
0254
0.23
3***
0.22
9***
0.10
6***
(0.0
0098
3)(0
.008
01)
(0.0
160)
(0.0
0931
)O
ther
insi
desu
cces
sion
0.04
540.
417*
**0.
401*
**0.
487*
**(0
.001
30)
(0.0
0934
)(0
.018
7)(0
.015
1)O
utsi
desu
cces
sion
0.03
810.
349*
**0.
370*
**0.
407*
**(0
.001
20)
(0.0
0903
)(0
.018
4)(0
.014
9)
28
Tabl
e6:
CEO
Titl
es
Prio
ran
dsu
bseq
uent
CEO
titl
esar
ecl
assi
fied
byC
EOtu
rnov
ersa
mpl
es.
The
set
ofob
serv
atio
nsin
each
sam
ple
asde
fined
inth
efir
stta
ble.
Prio
ran
dsu
bseq
uent
CEO
titl
esar
ere
port
edby
num
ber
and
shar
eof
allC
EOs.
Pane
lAsh
ows
the
prio
rjo
bti
tle
ofth
eC
EOsu
cces
sor.
For
mul
tipl
eti
tles
,onl
yth
efir
stin
the
listo
fti
tles
isco
nsid
ered
.Pan
elB
disp
lays
the
subs
eque
ntti
tle
ofth
epr
edec
esso
rC
EO.
All
Even
tsN
atur
alR
etir
emen
tFo
rced
Turn
over
No.
Shar
eN
o.Sh
are
No.
Shar
e
Pane
lA:P
rior
Titl
eof
CEO
Succ
esso
r
CEO
189
0.06
840
0.05
892
0.08
4
Cha
ir21
10.
076
400.
058
122
0.11
2
Pres
iden
t1,
128
0.40
431
10.
451
329
0.30
2
CO
O22
20.
080
350.
051
780.
072
Vic
ech
air
560.
020
230.
033
270.
025
Vic
epr
esid
ent
344
0.12
383
0.12
014
50.
133
Oth
er64
00.
229
158
0.22
929
70.
272
Pane
lB:S
ubse
quen
tTit
leof
Pred
eces
sor
Cha
ir1,
036
0.37
124
80.
359
194
0.17
8
Tota
l2,
790
1.00
069
01.
000
1,09
01.
000
29
Tabl
e7:
Prob
itof
CEO
Turn
over
The
tabl
ere
port
sm
argi
nale
ffec
tsus
ing
apo
oled
max
imum
likel
ihoo
dpr
obit
mod
el.
The
depe
nden
tvar
iabl
eis
sett
oon
eif
the
firm
has
aC
EOtu
rnov
erev
entb
efor
efis
caly
ear-
end
and
zero
othe
rwis
e.Th
eco
lum
nsco
ntai
nth
etu
rnov
ersa
mpl
esan
dco
ver
the
firm
-yea
rsfo
rea
chC
EOw
hose
tenu
reen
dsw
ith
the
spec
ified
turn
over
even
t.Fo
rco
ntin
uous
vari
able
s,th
em
argi
nal
effe
ctis
for
aon
eun
itch
ange
inth
atva
riab
le,
keep
ing
all
othe
rva
riab
les
atth
eir
mea
ns.
For
dum
my
vari
able
s,th
em
argi
nale
ffec
tis
ach
ange
from
zero
toon
e,ke
epin
gal
loth
erva
riab
les
atth
eir
mea
ns.I
ndep
ende
ntva
riab
les
incl
ude
lagg
edfir
msi
ze(l
ogof
book
asse
ts),
Tobi
n’s
Qis
lagg
edm
arke
tval
ueof
asse
tsdi
vide
dby
book
valu
eof
asse
ts.S
tock
retu
rnis
the
firm
’sla
gged
2-di
gitS
ICin
dust
ry-a
djus
ted
stoc
kre
turn
.Ope
rati
ngre
turn
isth
efir
m’s
lagg
ed2-
digi
tSIC
indu
stry
-adj
uste
dop
erat
ing
retu
rn.H
eir
App
aren
tis
sett
oon
eif
the
firm
has
atfis
caly
ear-
end
ach
iefo
pera
ting
offic
er/p
resi
dent
/vic
ech
air
who
isno
tals
oC
EO,a
ndze
root
herw
ise.
Cha
irin
depe
nden
tis
sett
oon
eif
the
firm
has
anin
depe
nden
tcha
irat
fisca
lyea
r-en
dan
dze
root
herw
ise.
Can
dida
teex
ists
dum
my
isa
vari
able
that
isse
tto
1if
ther
eis
atle
asto
neex
cuti
vebo
ard
mem
ber
othe
rth
anth
eC
EO.C
andi
date
age
dum
my
isse
tto
1if
,oth
erth
anth
eC
EO,t
here
isan
exec
utiv
ebo
ard
mem
ber
aged
betw
een
44an
d52
.Po
stSO
Xdu
mm
yis
1fo
rea
chfis
caly
ear
afte
rth
eSa
rban
es-O
xley
act
was
pass
edin
July
2002
.A
llre
gres
sion
sin
clud
eFF
12in
dust
rygr
oup
fixed
effe
cts.
Stan
dard
erro
rsar
ecl
uste
red
byfir
mia
ndre
port
edin
pare
nthe
ses.�,��
,���
indi
cate
stat
isti
cals
igni
fican
ceof
poin
test
imat
esat
the
10%
,5%
,and
1%le
vels
,res
pect
ivel
y.
Var
iabl
esA
llEv
ents
Nat
ural
Ret
irem
ent
Forc
edTu
rnov
er
Firm
size
0.01
09**
*0.
0044
30.
0079
3**
(0.0
0111
)(0
.005
10)
(0.0
0385
)
Tobi
n’s
Q0.
0026
4**
-0.0
0217
-0.0
0423
(0.0
0120
)(0
.005
37)
(0.0
0399
)
Ope
rati
ngre
turn
-0.0
992*
**-0
.135
**-0
.155
***
(0.0
111)
(0.0
573)
(0.0
442)
Stoc
kre
turn
-0.0
342*
**-0
.060
3***
-0.0
786*
**(0
.003
73)
(0.0
165)
(0.0
131)
Can
dida
teex
ists
dum
my
-0.0
206
-0.2
04*
-0.0
618
(0.0
163)
(0.1
19)
(0.0
617)
Can
dida
teag
edu
mm
y-0
.004
54-0
.014
7-0
.021
5(0
.005
43)
(0.0
291)
(0.0
198)
Post
SOX
dum
my
0.01
96**
*0.
170*
**0.
162*
**(0
.003
83)
(0.0
148)
(0.0
125)
Firm
-yea
rs25
,622
2,99
74,
208
Pseu
doR
20.
017
0.04
00.
042
30
Tabl
e8:
Naï
vePr
obit
ofC
EOTu
rnov
er
The
tabl
ere
port
sm
argi
nale
ffec
tsus
ing
apo
oled
max
imum
likel
ihoo
dpr
obit
mod
el.
The
depe
nden
tvar
iabl
eis
sett
oon
eif
the
firm
has
aC
EOtu
rnov
erev
entb
efor
efis
caly
ear-
end
and
zero
othe
rwis
e.Th
eco
lum
nsco
ntai
nth
etu
rnov
ersa
mpl
esan
dco
ver
the
firm
-yea
rsfo
rea
chC
EOw
hose
tenu
reen
dsw
ith
the
spec
ified
turn
over
even
t.Fo
rco
ntin
uous
vari
able
s,th
em
argi
nal
effe
ctis
for
aon
eun
itch
ange
inth
atva
riab
le,
keep
ing
all
othe
rva
riab
les
atth
eir
mea
ns.
For
dum
my
vari
able
s,th
em
argi
nale
ffec
tis
ach
ange
from
zero
toon
e,ke
epin
gal
loth
erva
riab
les
atth
eir
mea
ns.I
ndep
ende
ntva
riab
les
incl
ude
lagg
edfir
msi
ze(l
ogof
book
asse
ts),
Tobi
n’s
Qis
lagg
edm
arke
tval
ueof
asse
tsdi
vide
dby
book
valu
eof
asse
ts.S
tock
retu
rnis
the
firm
’sla
gged
2-di
gitS
ICin
dust
ry-a
djus
ted
stoc
kre
turn
.Ope
rati
ngre
turn
isth
efir
m’s
lagg
ed2-
digi
tSIC
indu
stry
-adj
uste
dop
erat
ing
retu
rn.H
eir
App
aren
tis
sett
oon
eif
the
firm
has
atfis
caly
ear-
end
ach
iefo
pera
ting
offic
er/p
resi
dent
/vic
ech
air
who
isno
tals
oC
EO,a
ndze
root
herw
ise.
Cha
irin
depe
nden
tis
sett
oon
eif
the
firm
has
anin
depe
nden
tcha
irat
fisca
lyea
r-en
dan
dze
root
herw
ise.
Can
dida
teex
ists
dum
my
isa
vari
able
that
isse
tto
1if
ther
eis
atle
asto
neex
cuti
vebo
ard
mem
ber
othe
rth
anth
eC
EO.C
andi
date
age
dum
my
isse
tto
1if
,oth
erth
anth
eC
EO,t
here
isan
exec
utiv
ebo
ard
mem
ber
aged
betw
een
44an
d52
.Po
stSO
Xdu
mm
yis
1fo
rea
chfis
caly
ear
afte
rth
eSa
rban
es-O
xley
act
was
pass
edin
July
2002
.A
llre
gres
sion
sin
clud
eFF
12in
dust
rygr
oup
fixed
effe
cts.
Stan
dard
erro
rsar
ecl
uste
red
byfir
mia
ndre
port
edin
pare
nthe
ses.�,��
,���
indi
cate
stat
isti
cals
igni
fican
ceof
poin
test
imat
esat
the
10%
,5%
,and
1%le
vels
,res
pect
ivel
y.
Var
iabl
esA
llEv
ents
Nat
ural
Ret
irem
ent
Forc
edTu
rnov
er
Hei
rap
pare
nt0.
0867
***
0.19
3***
0.13
2***
(0.0
0510
)(0
.020
9)(0
.018
3)C
hair
inde
pend
ent
0.02
64**
*0.
0668
***
0.07
04**
*(0
.004
76)
(0.0
257)
(0.0
163)
Firm
size
0.00
923*
**-0
.001
590.
0048
8(0
.001
13)
(0.0
0563
)(0
.004
15)
Tobi
n’s
Q0.
0017
5-0
.006
93-0
.007
00*
(0.0
0121
)(0
.005
40)
(0.0
0411
)O
pera
ting
retu
rn-0
.093
8***
-0.1
59**
*-0
.153
***
(0.0
111)
(0.0
570)
(0.0
455)
Stoc
kre
turn
-0.0
317*
**-0
.055
7***
-0.0
765*
**(0
.003
66)
(0.0
166)
(0.0
134)
Can
dida
teex
ists
dum
my
-0.0
127
-0.2
00-0
.041
9(0
.015
8)(0
.122
)(0
.064
8)C
andi
date
age
dum
my
-0.0
0209
-0.0
0809
-0.0
232
(0.0
0535
)(0
.030
0)(0
.020
5)Po
stSO
Xdu
mm
y0.
0203
***
0.16
7***
0.16
3***
(0.0
0372
)(0
.014
7)(0
.012
4)
Firm
-yea
rs25
,155
2,93
84,
081
Pseu
doR
20.
070
0.09
10.
092
31

Tabl
e9:
Prob
itof
Cha
irIn
depe
nden
ce
The
tabl
ere
port
sm
argi
nale
ffec
tsus
ing
apo
oled
max
imum
likel
ihoo
dpr
obit
mod
el.
The
depe
nden
tvar
iabl
eis
sett
oon
eif
the
firm
has
anin
depe
nden
tcha
irat
fisca
lye
ar-e
ndan
dze
root
herw
ise.
The
colu
mns
cont
ain
the
turn
over
sam
ples
and
cove
rth
efir
m-y
ears
for
each
CEO
who
sete
nure
ends
wit
hth
esp
ecifi
edtu
rnov
erev
ent.
For
cont
inuo
usva
riab
les,
the
mar
gina
leff
ecti
sfo
ra
one
unit
chan
gein
that
vari
able
,kee
ping
allo
ther
vari
able
sat
thei
rm
eans
.For
dum
my
vari
able
s,th
em
argi
nale
ffec
tis
ach
ange
from
zero
toon
e,ke
epin
gal
loth
erva
riab
les
atth
eir
mea
ns.I
ndep
ende
ntva
riab
les
incl
ude
lagg
edfir
msi
ze(l
ogof
book
asse
ts),
Tobi
n’s
Qis
lagg
edm
arke
tva
lue
ofas
sets
divi
ded
bybo
okva
lue
ofas
sets
.Sto
ckre
turn
isth
efir
m’s
lagg
ed2-
digi
tSIC
indu
stry
-adj
uste
dst
ock
retu
rn.O
pera
ting
retu
rnis
the
firm
’sla
gged
2-di
git
SIC
indu
stry
-adj
uste
dop
erat
ing
retu
rn.H
eir
App
aren
tis
sett
oon
eif
the
firm
has
atfis
caly
ear-
end
ach
iefo
pera
ting
offic
er/p
resi
dent
/vic
ech
air
who
isno
tals
oC
EO,
and
zero
othe
rwis
e.C
hair
inde
pend
ent
isse
tto
one
ifth
efir
mha
san
inde
pend
ent
chai
rat
fisca
lyea
r-en
dan
dze
root
herw
ise.
Can
dida
teex
ists
dum
my
isa
vari
able
that
isse
tto
1if
ther
eis
atle
ast
one
excu
tive
boar
dm
embe
rot
her
than
the
CEO
.Can
dida
teag
edu
mm
yis
set
to1
if,o
ther
than
the
CEO
,the
reis
anex
ecut
ive
boar
dm
embe
rag
edbe
twee
n44
and
52.P
ostS
OX
dum
my
is1
for
each
fisca
lyea
raf
ter
the
Sarb
anes
-Oxl
eyac
twas
pass
edin
July
2002
.All
regr
essi
ons
incl
ude
FF12
indu
stry
grou
pfix
edef
fect
s.St
anda
rder
rors
are
clus
tere
dby
firm
iand
repo
rted
inpa
rent
hese
s.�,��
,���
indi
cate
stat
isti
cals
igni
fican
ceof
poin
test
imat
esat
the
10%
,5%
,and
1%le
vels
,res
pect
ivel
y.
Var
iabl
esA
llEv
ents
Nat
ural
Ret
irem
ent
Forc
edTu
rnov
er
Firm
size
-0.0
276*
**-0
.051
5***
-0.0
423*
**(0
.003
83)
(0.0
0890
)(0
.007
62)
Tobi
n’s
Q-0
.002
40-0
.004
32-0
.009
84(0
.003
18)
(0.0
0747
)(0
.006
83)
Ope
rati
ngre
turn
-0.1
65**
*-0
.039
0-0
.123
*(0
.030
4)(0
.076
8)(0
.069
6)St
ock
retu
rn-0
.003
11-0
.009
71-0
.017
6(0
.004
86)
(0.0
132)
(0.0
119)
Can
dida
teex
ists
dum
my
0.00
429
-0.2
42*
0.06
16(0
.033
9)(0
.146
)(0
.063
8)C
andi
date
age
dum
my
0.03
25**
*-0
.007
94-0
.019
9(0
.012
1)(0
.034
2)(0
.029
5)Po
stSO
Xdu
mm
y0.
0932
***
0.09
61**
*0.
0999
***
(0.0
0703
)(0
.019
0)(0
.018
9)
Firm
-yea
rs25
,622
2,99
74,
208
Pseu
doR
20.
036
0.08
20.
060
32
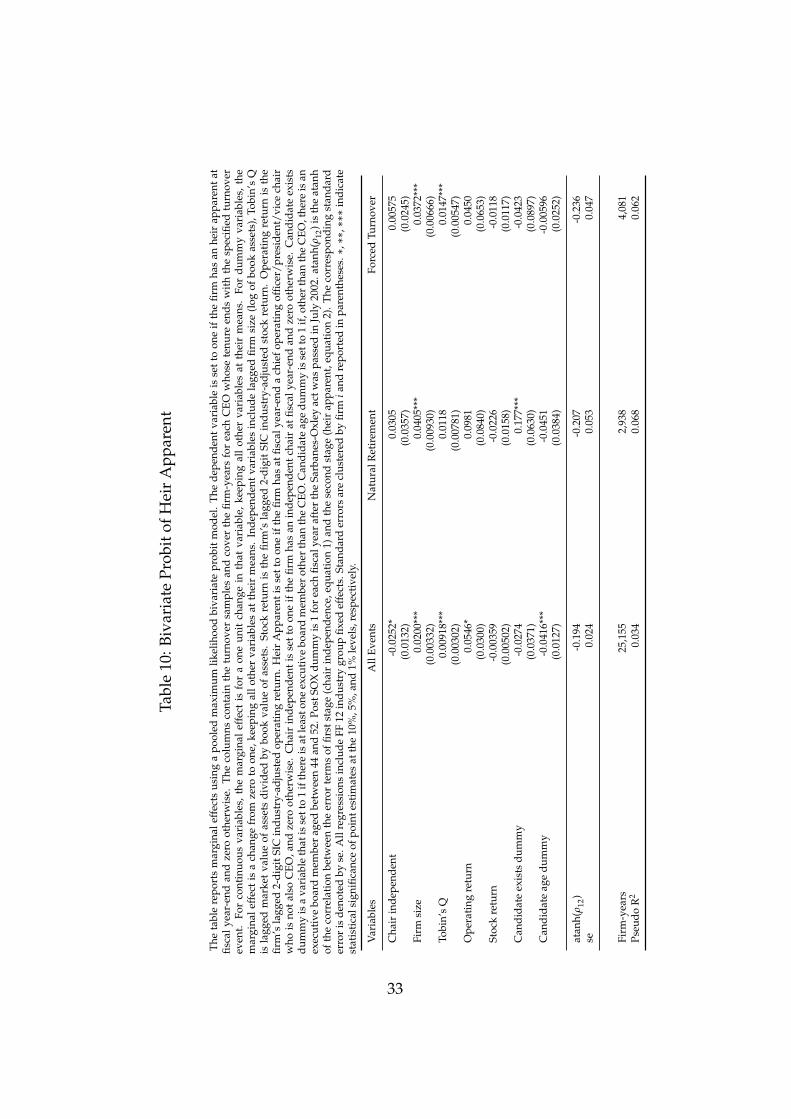
Tabl
e10
:Biv
aria
tePr
obit
ofH
eir
App
aren
t
The
tabl
ere
port
sm
argi
nale
ffec
tsus
ing
apo
oled
max
imum
likel
ihoo
dbi
vari
ate
prob
itm
odel
.Th
ede
pend
entv
aria
ble
isse
tto
one
ifth
efir
mha
san
heir
appa
rent
atfis
caly
ear-
end
and
zero
othe
rwis
e.Th
eco
lum
nsco
ntai
nth
etu
rnov
ersa
mpl
esan
dco
ver
the
firm
-yea
rsfo
rea
chC
EOw
hose
tenu
reen
dsw
ith
the
spec
ified
turn
over
even
t.Fo
rco
ntin
uous
vari
able
s,th
em
argi
nal
effe
ctis
for
aon
eun
itch
ange
inth
atva
riab
le,
keep
ing
all
othe
rva
riab
les
atth
eir
mea
ns.
For
dum
my
vari
able
s,th
em
argi
nale
ffec
tis
ach
ange
from
zero
toon
e,ke
epin
gal
loth
erva
riab
les
atth
eir
mea
ns.
Inde
pend
ent
vari
able
sin
clud
ela
gged
firm
size
(log
ofbo
okas
sets
),To
bin’
sQ
isla
gged
mar
ket
valu
eof
asse
tsdi
vide
dby
book
valu
eof
asse
ts.
Stoc
kre
turn
isth
efir
m’s
lagg
ed2-
digi
tSI
Cin
dust
ry-a
djus
ted
stoc
kre
turn
.O
pera
ting
retu
rnis
the
firm
’sla
gged
2-di
gitS
ICin
dust
ry-a
djus
ted
oper
atin
gre
turn
.H
eir
App
aren
tis
sett
oon
eif
the
firm
has
atfis
caly
ear-
end
ach
iefo
pera
ting
offic
er/p
resi
dent
/vic
ech
air
who
isno
tal
soC
EO,a
ndze
root
herw
ise.
Cha
irin
depe
nden
tis
set
toon
eif
the
firm
has
anin
depe
nden
tch
air
atfis
caly
ear-
end
and
zero
othe
rwis
e.C
andi
date
exis
tsdu
mm
yis
ava
riab
leth
atis
sett
o1
ifth
ere
isat
leas
tone
excu
tive
boar
dm
embe
rot
her
than
the
CEO
.Can
dida
teag
edu
mm
yis
sett
o1
if,o
ther
than
the
CEO
,the
reis
anex
ecut
ive
boar
dm
embe
rag
edbe
twee
n44
and
52.P
ostS
OX
dum
my
is1
for
each
fisca
lyea
raf
ter
the
Sarb
anes
-Oxl
eyac
twas
pass
edin
July
2002
.ata
nh(ρ
12)i
sth
eat
anh
ofth
eco
rrel
atio
nbe
twee
nth
eer
ror
term
sof
first
stag
e(c
hair
inde
pend
ence
,equ
atio
n1)
and
the
seco
ndst
age
(hei
rap
pare
nt,e
quat
ion
2).
The
corr
espo
ndin
gst
anda
rder
ror
isde
note
dby
se.A
llre
gres
sion
sin
clud
eFF
12in
dust
rygr
oup
fixed
effe
cts.
Stan
dard
erro
rsar
ecl
uste
red
byfir
mia
ndre
port
edin
pare
nthe
ses.�,��
,���
indi
cate
stat
isti
cals
igni
fican
ceof
poin
test
imat
esat
the
10%
,5%
,and
1%le
vels
,res
pect
ivel
y.
Var
iabl
esA
llEv
ents
Nat
ural
Ret
irem
ent
Forc
edTu
rnov
er
Cha
irin
depe
nden
t-0
.025
2*0.
0305
0.00
575
(0.0
132)
(0.0
357)
(0.0
245)
Firm
size
0.02
00**
*0.
0405
***
0.03
72**
*(0
.003
32)
(0.0
0930
)(0
.006
66)
Tobi
n’s
Q0.
0091
8***
0.01
180.
0147
***
(0.0
0302
)(0
.007
81)
(0.0
0547
)O
pera
ting
retu
rn0.
0546
*0.
0981
0.04
50(0
.030
0)(0
.084
0)(0
.065
3)St
ock
retu
rn-0
.003
59-0
.022
6-0
.011
8(0
.005
02)
(0.0
158)
(0.0
117)
Can
dida
teex
ists
dum
my
-0.0
274
0.17
7***
-0.0
423
(0.0
371)
(0.0
630)
(0.0
897)
Can
dida
teag
edu
mm
y-0
.041
6***
-0.0
451
-0.0
0596
(0.0
127)
(0.0
384)
(0.0
252)
atan
h(ρ
12)
-0.1
94-0
.207
-0.2
36se
0.02
40.
053
0.04
7
Firm
-yea
rs25
,155
2,93
84,
081
Pseu
doR
20.
034
0.06
80.
062
33

Tabl
e11
:Tri
vari
ate
Prob
itof
CEO
Turn
over
The
tabl
ere
port
sm
argi
nale
ffec
tsus
ing
apo
oled
max
imum
likel
ihoo
dtr
ivar
iate
prob
itm
odel
,whi
chis
spec
ified
asa
recu
rsiv
e,fu
llyob
serv
ed,s
eem
ingl
yun
rela
ted
regr
essi
on(S
UR
).Th
ede
pend
entv
aria
ble
isse
tto
one
ifth
efir
mha
sa
CEO
turn
over
even
tbef
ore
fisca
lyea
r-en
dan
dze
root
herw
ise.
The
colu
mns
cont
ain
the
turn
over
sam
ples
and
cove
rth
efir
m-y
ears
for
each
CEO
who
sete
nure
ends
wit
hth
esp
ecifi
edtu
rnov
erev
ent.
For
cont
inuo
usva
riab
les,
the
mar
gina
lef
fect
isfo
ra
one
unit
chan
gein
that
vari
able
,kee
ping
allo
ther
vari
able
sat
thei
rm
eans
.For
dum
my
vari
able
s,th
em
argi
nale
ffec
tis
ach
ange
from
zero
toon
e,ke
epin
gal
loth
erva
riab
les
atth
eir
mea
ns.I
ndep
ende
ntva
riab
les
incl
ude
lagg
edfir
msi
ze(l
ogof
book
asse
ts),
Tobi
n’s
Qis
lagg
edm
arke
tval
ueof
asse
tsdi
vide
dby
book
valu
eof
asse
ts.S
tock
retu
rnis
the
firm
’sla
gged
2-di
gitS
ICin
dust
ry-a
djus
ted
stoc
kre
turn
.Ope
rati
ngre
turn
isth
efir
m’s
lagg
ed2-
digi
tSIC
indu
stry
-adj
uste
dop
erat
ing
retu
rn.H
eir
App
aren
tis
set
toon
eif
the
firm
has
atfis
caly
ear-
end
ach
iefo
pera
ting
offic
er/p
resi
dent
/vic
ech
air
who
isno
tals
oC
EO,a
ndze
root
herw
ise.
Cha
irin
depe
nden
tis
sett
oon
eif
the
firm
has
anin
depe
nden
tcha
irat
fisca
lyea
r-en
dan
dze
root
herw
ise.
Can
dida
teex
ists
dum
my
isa
vari
able
that
isse
tto
1if
ther
eis
atle
asto
neex
cuti
vebo
ard
mem
ber
othe
rth
anth
eC
EO.C
andi
date
age
dum
my
isse
tto
1if
,oth
erth
anth
eC
EO,t
here
isan
exec
utiv
ebo
ard
mem
ber
aged
betw
een
44an
d52
.Pos
tSO
Xdu
mm
yis
1fo
rea
chfis
cal
year
afte
rth
eSa
rban
es-O
xley
actw
aspa
ssed
inJu
ly20
02.a
tanh
(ρ12
)is
the
atan
hof
the
corr
elat
ion
betw
een
the
erro
rte
rms
offir
stst
age
(cha
irin
depe
nden
ce,e
quat
ion
1)an
dth
ese
cond
stag
e(h
eir
appa
rent
,equ
atio
n2)
.ata
nh(ρ
13)i
sth
eat
anh
ofth
eco
rrel
atio
nbe
twee
nth
eer
ror
term
sof
first
stag
e(c
hair
inde
pend
ence
,equ
atio
n1)
and
the
thir
dst
age
(CEO
turn
over
,equ
atio
n3)
.at
anh(
ρ23
)is
the
atan
hof
the
corr
elat
ion
betw
een
the
erro
rte
rms
ofse
cond
stag
e(h
eir
appa
rent
,equ
atio
n2)
and
the
thir
dst
age
(CEO
turn
over
,equ
atio
n3)
.Th
eco
rres
pond
ing
stan
dard
erro
rsar
ede
note
dby
se.
All
regr
essi
ons
incl
ude
FF12
indu
stry
grou
pfix
edef
fect
s.St
anda
rder
rors
are
clus
tere
dby
firm
iand
repo
rted
inpa
rent
hese
s.�,��
,���
indi
cate
stat
isti
cals
igni
fican
ceof
poin
test
imat
esat
the
10%
,5%
,and
1%le
vels
,res
pect
ivel
y.
Var
iabl
esA
llEv
ents
Nat
ural
Ret
irem
ent
Forc
edTu
rnov
er
Hei
rap
pare
nt0.
204*
**0.
323*
**0.
220*
**(0
.008
62)
(0.0
196)
(0.0
184)
Cha
irin
depe
nden
t-0
.040
4***
-0.0
429
-0.0
413*
(0.0
0933
)(0
.034
1)(0
.024
6)Fi
rmsi
ze0.
0049
9***
-0.0
185*
**-0
.009
01**
(0.0
0129
)(0
.006
35)
(0.0
0435
)To
bin’
sQ
0.00
0385
-0.0
155*
**-0
.014
0***
(0.0
0135
)(0
.005
44)
(0.0
0415
)O
pera
ting
retu
rn-0
.114
***
-0.1
78**
*-0
.171
***
(0.0
127)
(0.0
625)
(0.0
468)
Stoc
kre
turn
-0.0
317*
**-0
.057
6***
-0.0
734*
**(0
.003
88)
(0.0
161)
(0.0
131)
atan
h(ρ
12)
-0.2
12-0
.227
-0.2
62se
0.03
00.
061
0.05
4at
anh(
ρ13
)0.
339
0.33
90.
318
se0.
036
0.06
40.
052
atan
h(ρ
23)
-0.5
41-0
.665
-0.3
87se
0.02
40.
048
0.04
2
Firm
-yea
rs25
,155
2,93
84,
081
Pseu
doR
20.
052
0.08
20.
068
34