do domestic firms learn to export from foreign … papers or... · web viewdo domestic firms learn...
TRANSCRIPT

Do Domestic Firms learn to Export from Foreign Owned Firms? Evidence from
Kenya
Bethuel Kinyanjui KinuthiaTracking Development Project
African Studies centre, Leiden University The Netherlands
&
School of EconomicsUniversity of Nairobi
Kenya
Abstract
Attracting foreign direct investment (FDI) inflows has been a major concern of most governments in developing countries. The rationale for this is that FDI is believed to bring many benefits to the host countries in terms of productivity, employment, technology among others. This paper investigates the existence of export spillovers in Kenya for the period 2000-2005 using firm level data. More specifically, export spillovers in the manufacturing industry and the channels of transmission of such spillovers are analysed. Using the Heckman selection model, there is evidence of demonstration effects on the domestic firms export decision but not on their export propensity. There is also evidence of negative spillovers from competition and the information channels on both the decision to export as well as the export propensity. There is need to increase FDI participation in the manufacturing sector, as well the introduction of policies to mitigate effects of negative spillovers that may arise.
Keywords: foreign firms, domestic firms, export spillovers, Kenya
1. Introduction
This paper investigates the existence of export spillovers and their transmission mechanisms from foreign to domestic owned firms in Kenya. In recent times, literature on spillovers has acknowledged that exports could be an important source of spillovers. By their very nature they comprise a pure form of technology spillovers, since domestic firms may learn to export by interacting with foreign owned firms within the host country. Starting with the paper by Bernard and Jensen (1995), many studies have found that exporting firms usually perform better than domestic market oriented firms. With regard to this issue, the ongoing debate in the international trade literature is based on this crucial question: do successful firms export, or does exporting lead to higher firm productivity? Up to now, two different but not mutually exclusive types of answers have been found in the literature: the first most in favour of the self selection of better firms into export markets (e.g. Bernard and Jensen, 1999) and the other in favour of the learning by exporting hypothesis (e.g. Van Biesebroeck, 2005).
However, until recently, the role played by foreign firms or other external sources in influencing the export performance of local firms’ has been rather scarce. Moreover, studies looking for export spillovers differ in several important aspects, such as the definition of export spillovers and/or the level of data disaggregating causing econometric results to show mixed evidence. For example Aitken et. al., (1997);
1

Greenaway et. al., (2004); Kneller and Pisu, (2007); Greenaway and Kneller, (2008) and Koenig et. al., (2010) all find the existence of export spillovers. On the other hand, Barrios et. al., (2003) and Bernard and Jensen (2004) find no evidence of export spillovers. Other studies suggest that export spillovers from FDI in the host country depend on the characteristics of domestic firms and industries in terms of human capital participation, financial market development and the technology gap (Anwar and Nguyen, 2011; Keller and Pisu, 2005). Furthermore, Gorg and Strobl (2005) emphasize the importance of linkages for allowing technology and pecuniary externalities from FDI to occur. Hence, although reasonable attempts have been made to understand whether foreign firms are a source of export spillovers, the findings remain largely inconclusive. Moreover, only few studies have devoted considerable attention in understanding their transmission channels.
Using a developing country’s experience, this paper enhances this debate by focusing on export spillovers in Kenya and explores the possibility of foreign owned firms affecting trade through their impact on domestic firms using firm level data for the period 2000-2005. The rest of the paper is organised as follows. In the next section, an overview of FDI and the manufacturing sector in Kenya is presented. Section two presents a review of the literature on export spillovers and their transmission mechanisms. A discussion on the data and the empirical model is presented in section three. The econometric results follow in section four, while the final section contains the conclusion and policy implication of the study.
1.1 FDI and the development of the manufacturing sector in Kenya
Kenya is a relatively big country with a total land area of 582.65 thousand square kilometres. It has a population of approximately 40 million people and is located strategically along the East Africa coast. Foreign investment has been of considerable significance in financing development in Kenya, not only in the manufacturing but also in the primary and tertiary sectors. Before independence in 1963, bulk of it went to primary production and plantations. The few manufacturing industries established up to World War II, were mainly for basic processing of agricultural exports and the processing of food for the local market. After the War, British manufacturing firms began to invest directly in manufacturing, in part, because of the competition from non-British trading firms, which threatened Britain's share in the Kenyan market (Rweyemamu, 1987).
After independence, FDI within the manufacturing sector increased significantly partly due to a government policy, which restricted it from the traditional agricultural sector, allowing for resettlement of the landless citizens. Increased foreign participation in the manufacturing sector resulted in a 50 percent increase in industrial output between the period 1964 and 1970. The 100 percent increase in the annual level of investment, was foreign owned. This growth happened within an import substitution (ISI) environment implemented since early 1950s. The government used a combination of tariffs and quotas supplemented by foreign allocation measures such as overvaluing exchange rates to maintain import costs low and favourable credit and interest rate policies intended to subsidize the manufacturing of consumer goods (Swainson, 1980: 119; Gachino, 2006).
2

Under ISI, the Kenyan economy was characterised by rapid economic growth, a period referred to as the 'golden economic period' due to the high GDP growth rate levels recorded (see Graph 1). The GDP growth rate averaged above 7 percent in period 1965-1972, while manufacturing value added grew by over 10 percent in the period 1964-1971. Among the reasons for this dramatic growth was that, Kenya had maintained a favourable investment climate making it an attractive locale for foreign investment (Obrien and Ryan, 2001). However, Bradshaw (1988) observed that although that was the case, Kenya's liberal repatriation policies had resulted in more international investment income, leaving in the form of profit remittances than inflows into the country, forcing the government to institute various measure such as Capital Issues Committee in 1971 to curb this trend.1
Graph 1: Selected Kenya's growth rates
-10
-5
0
5
10
15
20
25
30
35
Years
% g
row
th ra
tes
per a
nnum
GDP Manufacturing value added
Source: World Development Indicators (2010)
According to graph 1 above, Kenya’s performance began to falter in the 1970s due to several reasons among them being the oil crisis, decline in the coffee prices, poor macroeconomic management, collapse of the East African Community, drought and the world economic recession in the early 1980s. Ensuing economic distortions resulted in severe structural constraints and macro economic imbalances (Fahnbulleh, 2006). Moreover, the inward looking policies pursued at the time, under ISI made it difficult for firms to effectively participate and compete in the export markets (GOK, 1994).
Further, the economic stagnation in the mid 1980s and 1990s affected Kenya’s industrialization process with consequent effects on labour productivity (Gachino and Rasiah, 2003). Political instability in neighbouring countries particularly Uganda, also drew away markets and investments from Kenya. In addition, macro economic constraints arising from a collapse in the IMF’s Structural Adjustment Program (SAPs) in 1986 (Mwega and Ndungu, 2002), massive destruction of infrastructure due to El Nino rains and weak institutions, all contributed to economic stagnation (Phillip and Obwana, 2000; Todaro, 2000; Rasiah and Gachino, 2005). Hence, although Kenya introduced a number of instruments to promote FDI and export oriented industrialization during this period, these factors slowed down the development of the manufacturing sector. However, it’s important to note that manufactured exports 1 From 1974, firms with high repatriation rate had their local borrowing rights restricted by the Central Bank. The government also attempted to cut down on the level of management remittances and technical fees by imposing a 14 percent withholding tax. These efforts discouraged foreign investors to some extent.
3

registered considerable growth in real terms with a sharp increase in 1991 later falling in 1993 which can be attributed to the effects of the Goldenberg scandal on the exchange rate in addition to the liberalization efforts 2(graph 2 below).
Graph 2: FDI and Manufactured Exports
0.00
100.00
200.00
300.00
400.00
500.00
600.00
700.00
800.00
1970
1972
1974
1976
1978
1980
1982
1984
1986
1988
1990
1992
1994
1996
1998
2000
2002
2004
2006
2008
Years
USD
Mill
ions
-60
-40
-20
0
20
40
60
80
% a
nnua
l gro
wth
FDI inflows Manufactured exports
Source: UNCTAD (2009) and World Development Indicators (2010)
Foreign owned firms in Kenya since the 1970s have invested in a wide range of sectors. Most notably, they have played a major role in floriculture and horticulture, with close to 90 percent of flowers being controlled by foreign affiliates. In the manufacturing sector, FDI has concentrated on the consumer goods sector, such as food and beverage industries. This has changed in the recent years with the growth of the garment sector, because of the African Growth and Opportunities Act (AGOA). Of the 34 companies involved in AGOA, 28 are foreign; most of them concentrated in the Export Processing Zones (EPZs). FDI is also distributed in other sectors including services, telecommunication among others. 55 percent of the foreign firms are concentrated in Nairobi, while Mombasa accounts for about 23 percent, with the reminder going to other parts in Kenya. The main form of FDI establishment has been through Greenfield. The traditional sources of foreign investments in Kenya are Britain, United States of America (USA), Germany, South Africa, Netherlands, Switzerland and more recently China and India (UNCTAD, 2005; Onjala, 2008; Kamau et. al., 2009).
2. Foreign Direct Investment and Export Performance
Within the international trade literature, it has been recognised that foreign owned firms can directly benefit the trade performance of the host economy through their own exporting activity (Blake and Pain, 1994; Barry and Bradley, 1997). However, from a theoretical view, few insights have been provided for export spillovers. Krautheim (2008) building on network theory, shows how the exchange of information between firms exporting to the same industry, reduces the individual 2 Goldenberg International was set up in 1990 to export gold and diamond jewellery from Kenya in return for a 35 percent premium on the exchange rate in contrast to the normal premium of 20 percent for exporters. Little or no gold was actually exported; a scheme was established to round-trip the sale of export dollars to the Central Bank of Kenya (essentially, buy dollars at the official exchange rate, sell them back at a 35 percent premium as “gold exports” and then repeat the process). It was finally uncovered in 1992 (Warutere, 2005).
4
(FDI
) (Ex
pt)

fixed cost to export and increases the probability of exporting. Rauch and Watson (2003) also show that when a commercial relationship begins, there might be uncertainty for the buyer on the ability of the supplier to successfully fill larger orders. The agglomeration of exporters can increase the buyer's information on the quality of the suppliers favouring larger orders and hence important at the firm level.
Export spillovers may be transmitted through several channels. First, domestic firms can learn from the exporting activities of foreign subsidiaries in the host country through information externalities. Subsidiaries may have easier access to information on foreign markets because they form part of a multinational enterprise. Exporting involves fixed costs, which might include the establishment of distribution networks, creation of transport infrastructure, investment in advertising to gain public exposure, research about foreign markets to gain intelligence on consumers’ tastes, market structure, competitors, regulations and so on. These will be lower for foreign owned firms, as they already have knowledge and experience of operating in foreign markets and can benefit from network economies and know-how of managing international marketing, distribution and serving of their products. Other channels of diffusion of information on foreign market conditions are trade associations and other industry organisations of which foreign owned firms are prominent members. A transfer of this knowledge would constitute information spillover (Greenaway et. al., 2004; Aitken et. al., 1997; Blostrom and Kokko, 1998).
A second channel of export spillover is through the competition effect. Gorg and Greenaway (2004) observe that unless an incoming firm is offered monopoly status, it will produce competition with indigenous firms. If indigenous firms are unable to imitate the multinational’s technology and production processes, the entry of the foreign owned firm puts pressure on them to use existing technology more efficiently, yielding productivity gains. Greater competition leading to a reduction in X-inefficiency is analogous to one of the standard gains from arm’s length trade and is frequently identified as one major source of gain. In addition, competition may increase the speed of adoption of new technology. Increased efficiency of firms as a result of competition allows them to start exporting. However, foreign owned firms can result in negative spillovers in case the domestic firms cannot learn to compete with them.
Exports spillovers can also occur through the demonstration or imitation effects, which is the third channel. Greenaway et. al., (2004) and Fosfuri et.al., (2001) observe that significant contribution of MNCs to the available stock of technology knowledge may result in imitation by domestic firms, thereby benefiting them. Gorg and Greenaway (2004) note that this is common for new products and processes. An important mechanism is reverse engineering whose scope depends on product/process complexity, with simple manufacturers and processes easier to imitate than more complex ones. Similarly, the same principle applies for managerial/organizational innovations, though these are easier to imitate. Hence, any upgrading to local technology deriving from imitation could result in spillover, with consequential benefits for the productivity of local firms.
Proximity to foreign affiliates might be conducive to stronger export spillovers since it facilitates the acquisition of those knowledge parts and competencies and so on, that might lead to exports (Kneller and Pisu, 2007; Aitken et.al.,1997). Blomstrom and
5

Kokko (1998) and Gorg and Strobl, (2005) further observe that the export operations of foreign owned firms may influence local firms in other additional ways. For example, direct effects occur when local firms are employed as suppliers and sub-contractors to the foreign owned firms. Although local suppliers do not always export under their own name, they too can benefit from access to foreign markets. This may allow them to expand output and achieve economies of scale. Through this kind of linkage, it is likely that export oriented foreign owned firms provide knowledge about various aspects including foreign market conditions such as foreign preferences design, packaging and product quality. This information can be used profitably in the supplier companies’ other operations. If the knowledge gained as a supplier to a foreign owned firm helps a company establish own direct exports to a foreign market, then we have export spillovers.
In addition, Melitz (2004) and Bernard et. al., (2003) have shown that firms display considerable heterogeneity with regard to the extent to which they serve the foreign markets. They suggest that firms that do export are larger and more productive than those that do not. This is accounted for by firm heterogeneity and fixed export costs. Because of fixed costs charges, only productive firms find it profitable to sell goods abroad. This may imply that export spillovers from foreign owed firms may affect domestically owned firms through mechanisms that raise their productivity.
In Kenya, several studies have investigated various kinds of spillovers arising for the presence of foreign owned firms (even though none focuses on export spillovers) with mixed findings. Langdon (1981), in a study of FDI in the Kenyan soap industry, reports that the entry of foreign MNCs also introduced mechanized production, and local firms found themselves unable to sell handmade soap in the urban markets. Instead, they were forced to introduce mechanized techniques to stay in business. Similarly, Jenkins (1990) found that foreign entry into the Kenyan footwear industry led to increased competition and changes in the production techniques of local firms. Moreover, Gachino (2006) found evidence that foreign presence generated positive technology spillovers in Kenya manufacturing industry through demonstration effects.
In addition, Gershenberg (1987) found evidence that multinational enterprises in Kenya train indigenous managers and spread know how. Likewise, Kamau et. al., (2009) observed that within the Export Processing Zones (EPZ) in Kenya, employees leave mainly the garments firms after acquiring training and experience, to team-up with local investors to establish other garment factories or even starting their own small scale garment firms. On the other hand, Phelps et. al., (2008) found that although the African growth and opportunity act (AGOA) has created opportunities in the textile industries, there have been limited backwards linkages as well as a lack of growth of competitive local cotton and textile industries. This has left the industry vulnerable to the terms on which AGOA grants Kenyan firms access to the United States market.
Some studies have also shown that exporting firms in Kenya possess superior characteristics compared to non exporting firms. Rasiah and Gachino (2005) found evidence of superior technology, productivity and export intensity level of foreign firms compared to local firms. Graner and Isaksson (2009) found evidence of learning effects from export participation by manufacturing firms in Kenya. In addition, they show that exporters are more efficient than non exporters. Were and Mugerwa (2009)
6

also found that exporters in the manufacturing sector paid higher wages at the start of the liberalization period, but domestic competition has since reduced the effect.
In conclusion, literature on export spillovers has identified various channels through which foreign owned firms can influence the exporting behaviour of domestic firms. However, due to the existence of various mechanisms through which export spillovers may occur, several proxies are used by different authors, and it is difficult to adequately capture them since they are unobservable in nature. Spillovers may take different forms and therefore different proxies may be needed to capture them. In addition, positive impact of foreign presence may take time and may actually also be negative initially because of for example competition of markets, workers and so on, before turning positive. Moreover, firm heterogeneity has been found to influence exporting and has recently been included in empirical studies. Finally, although various studies in Kenya have examined different mechanisms through which foreign owned firms affect domestic firms, none of the studies have considered export spillovers, a task that this study undertakes.
3. Data considerations and the empirical model
3.1 Data Considerations
The firm level data used in this study was obtained from the annual surveys conducted by the Ministry of Industrialization3. These surveys began in 1988 and did collect annual data on information pertaining to all firms operating in the Kenyan manufacturing industry but for unknown reasons were discontinued after 2005. This is a rich data set containing many firm characteristics and is based on the international standard of industrial classification (ISIC). The information collected includes firm ownership, year of establishment, domestic and exports sales, domestic and imported raw materials, capacity utilization and value of utilities consumed, fixed assets and capital investment by nationality, detailed information on employees, research and expenditure and much more. Table 1 below presents a breakdown of the dataset used in terms of ownership for the period 2000-2005. Some firms were however dropped because they missed many observations which were of interest in this study. Unlike some studies, all the firms whose data was available were included in the analysis regardless of whether this data was available for consecutive years or not4.
Table 1: Classification of firms according to ownership 2000 2001 2002 2003 2004 2005Foreign 317 345 327 339 365 352Local 605 668 647 572 584 649Total 922 1013 974 911 949 1001
For the purpose of this study firms with at least 10 percent of their nominal capital owned by foreigners are defined as foreign owned firms, while the rest are considered
3 Formerly the Ministry of Trade and Industry.4 Some studies have focused on firms whose data for at least three consecutive years were available. Bigsten et. al., (2004) argue that this is the minimum time period necessary to control for unobserved company effects in the econometric analysis and use this approach for Africa. Also Greenaway et. al., (2004) used this approach. In this study this is not considered necessary since it is considered necessary to exploit the unbalanced panel data set to the fullest.
7

locally owned.5 As de Mello (1997) has observed, this definition is restrictive since FDI comprises of bundles of capital stocks, know-how, and technology among other things which are not taken into account. Furthermore, firms today can exercise various forms of control over distance enterprises without direct ownership (Winder, 2006). Data deflation is a necessary condition, especially in time series analysis in order to remove data fluctuations that might exist due to inflationary effects over time in the economy. Due to lack of suitable deflators, the GDP deflator is used to deflate both output and export values6.
Table A.1 in the appendix presents a correlation matrix of the variables of study while, Table 2 below, presents the mean values of different characteristics across all firms. The different spillover variables have high correlations and this can make the estimates less reliable if included simultaneously, hence they are included separately in the estimations. In table 2, a comparison is made between foreign and domestic firms. In addition, each group is further categorised based on whether firms participate in the export market or not. For all the firms, exporters have higher turnover, employment, average wages, and labour productivity. They are also older compared to non exporters. Exporting foreign owned firms are more productive than the non exporting ones. In addition, these firms are on average 9 years older than the non exporting firms.
It can be further observed from table 2 that exporting foreign owned firms have higher labour productivity, wages, and employment compared to exporting domestic firms. Domestic exporting firms however, have higher turnover than the exporting foreign owned firms. Foreign owned non exporting firms are also superior to domestic owned non exporting firms. They pay higher wages, have higher turnover and are slightly older. These results are consistent with findings by Graner and Isaksson (2009) and Rasiah and Gachino (2005), on superiority of exporting firms over non exporting firms in Kenya.
Table 2: Mean characteristics of the firms for the sample period (2000-2005) Variables
Foreign owned firms Domestic owned firmsExporters Non Exporters Exporters Non Exporters
Average Wage (kshs, 000) 309 302 263 198Turnover(kshs, million) 408,475 62,227 420,141 48, 949Labour productivity (kshs, million) 1,115 0.902 0.824 0. 511Employees 113.75 13.27 71.73 14.54Age (yrs) 27.41 18.56 27.29 18.45
Finally, Table A.2 in the appendix presents a detailed comparison of the sample and the registered firms with the ministry. This list contained firms that had registered until 2004. In 1999 the list contained 1933 registered firms. This figure increased by 41 firms in 2000, 37 firms in 2001, 31 firms in 2002, 10 in 2003 and 6 in 2004 7. For each year, firms that presented most of the information were considered. On average
5 This definition was adopted because the Kenya national authorities use the same benchmark. This definition follows that of OECD and UNCTAD.6 This approach was followed by Gachino (2006) except that the export values were deflated using export price indices for manufactured goods. Biggs et. al., (2004) use firm specific deflators based on export share-weighted averages of the domestic and international prices to control for variations in the exchange rates.7 The list did not contain firms that had been closed down. Only the number of new firms was updated.
8

the firms used for analysis in this paper represent about 50 percent of those registered by the ministry. However, firm representation varies across sectors. Foreign owned firms are over represented in four of the sectors with more than 50 percent of the firms contained in the register. They are least represented in the woods and wood products sector with about 31 percent of the firms contained in the register. Domestic firms on the other hand, are over represented in five sectors with more than 50 percent of firms contained in the register. They are least represented in the food, beverage and tobacco and the textile, apparel and leather sectors with 31 percent of firms in the register. This representation is taken into account when estimating the sectoral level measures of foreign presence8.
3.2 Empirical model
Following after Aitken et. al., (1997) and Greenaway et. al., (2004), an empirical model is developed to analyse the effects of foreign owned firms on export behaviour of domestic firms. The export behaviour is considered to involve two decisions: first, whether to export and second, what proportion of output to export. The econometric analysis is framed such that it not only accounts for both decisions, but also for the fact that they are interdependent. This specification avoids selectivity biases associated with focusing exclusively on export propensity of exporting firms, which would cast doubt on econometric results. The export decision is expressed as follows:
(1)
while the export propensity equation is expressed as follows:
(2)
where ~ ; ~ ; and ~ bi-variate normal and the subscripts i, s and y refer to the firms, sectors and years,
respectively. Detailed definitions of the variables are set out in table 3 below.
Equation (1) estimates the export decision based on the full sample of firms. EXP is a dichotomous dependent variable, which takes the value of 1 or 0 depending on whether the domestic firm decides to export or not. This equation also performs the sample selection for the second model that focuses exclusively on the export propensity of the subset of firms that do decide to export. The dependent variable in equation (2) is expressed in terms of the share of output exported, which is the ratio of exports to total turnover.
3.2.1 Firm specific variables
Several variables are included to reflect firm’s heterogeneity as follows. W is defined as the ratio of total wages (remuneration) to the number of employees in each firm. A positive relationship between average labour remuneration and the probability of a
8 There is no way of establishing the sampling frame used and therefore the register may or may not be representative of firms. Besides, to the best of my knowledge, the number of firm establishments in Kenya is unknown.
9

firm being an exporter would capture the importance of skills for competitiveness of the Kenyan firms’ production in the world market. A negative relationship on the other hand, would suggest that high labour cost discourages exports. This is consistent with the export production as being labour intensive in developing countries.
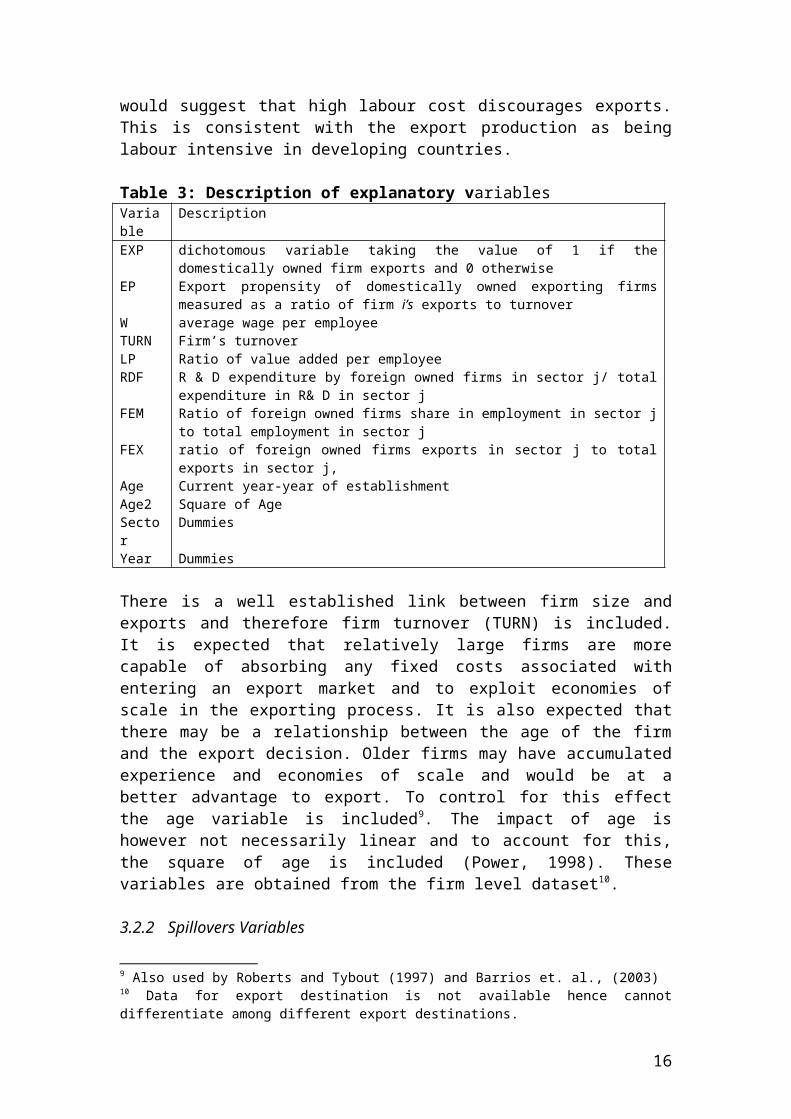
Table 3: Description of explanatory variablesVariable
Description
EXP dichotomous variable taking the value of 1 if the domestically owned firm exports and 0 otherwise
EP Export propensity of domestically owned exporting firms measured as a ratio of firm i’s exports to turnover
W average wage per employeeTURN Firm’s turnoverLP Ratio of value added per employeeRDF R & D expenditure by foreign owned firms in sector j/ total expenditure
in R& D in sector jFEM Ratio of foreign owned firms share in employment in sector j to total
employment in sector jFEX ratio of foreign owned firms exports in sector j to total exports in sector
j, Age Current year-year of establishmentAge2 Square of AgeSector DummiesYear Dummies
There is a well established link between firm size and exports and therefore firm turnover (TURN) is included. It is expected that relatively large firms are more capable of absorbing any fixed costs associated with entering an export market and to exploit economies of scale in the exporting process. It is also expected that there may be a relationship between the age of the firm and the export decision. Older firms may have accumulated experience and economies of scale and would be at a better advantage to export. To control for this effect the age variable is included9. The impact of age is however not necessarily linear and to account for this, the square of age is included (Power, 1998). These variables are obtained from the firm level dataset10.
3.2.2 Spillovers Variables
Building on the theoretical model developed earlier, export spillovers are measured using three proxies. First is the proportion of expenditure of Research and Development (RDF) carried out by foreign owned firms in a given sector. This captures the contribution of foreign owned firms to the available stock of technological knowledge, on the assumption that the more innovation activities carried out by these firms, the larger the potential for imitation from which domestic firms can benefit. Second is the relative weight of foreign owned firms in total employment in a sector (FEM). It accounts for the relative importance of these firms at the sector level in the domestic market. The greater their relative importance, the
9 Also used by Roberts and Tybout (1997) and Barrios et. al., (2003) 10 Data for export destination is not available hence cannot differentiate among different export destinations.
10
stronger the competitive pressure on domestic firms11. Third is the relative importance of foreign owned firms export activities in a sector (FEX). It is assumed that the greater their importance in the exports of a given sector, the higher the scope for domestic firms to benefit from information externalities12. Positive coefficients are expected for RDF, FEM and FEX. There may be also a possible link between export spillovers and productivity. More productive firms are also more likely to export and therefore one can expect more export spillovers for high productivity firms. Moreover, this may suggest the need for an interaction term. Thus, omitting firm productivity could lead to an overestimation of export spillovers and therefore a labour productivity variable (LP) is included13. It is assumed that LP will affect the decision to export but not how much to export and hence included in the equation 1 only. These variables are also obtained from the firm level dataset.
Given the choice of variables in this study, there is a possibility of some of them being endogenous. While this is recognised as a potential problem, recent literature on firm level determinants of exporting suggest that this is unlikely to be a serious problem (see Bernard and Jensen 1999; Clerides et. al., 1998; Greenaway et. al., 2004). Moreover, following after Aitken et. al., (1997) the model is estimated for a sample restricted to domestic firms. In addition, as a robustness check, another model is estimated based on a sample restricted to foreign owned firms using spillover variables from the domestic firms.
4. Econometric Results
The Heckman selection model is used to estimate equation (1) and (2) since it takes into account the truncated nature of the sub samples of firms in the export propensity model and incorporates a sample selection mechanism given by the export decision equation. The firm level data for the 6 years is pooled, clustering it by firm, which allows the use of robust standard errors and unspecified serial correlation within the firms, while assuming independence between them. Due to the high correlation between the spillover variables their results are reported separately.
4.1 The export decision
11 Similar spillover measures have been used in several studies to include Aitken . al., (1997) and Greenaway et. al.,(2004). However other measures of spillovers include vertical and horizontal industrial linkages as used by Kneller and Pisu (2007).12 This variable was also used by Aitken et. al., (1997) and Barrios et. al.,(2003). However, they weigh the variable with the ratio of total exports of foreign owned firms to total exports. There is no convincing justification for that approach hence in this study no adjustment is made on the variable.13 Three main approaches have been used in literature to measure total factor productivity. The first technique employs the semi-parametric approach of Levinsohn and Petrin (2003) by taking unobserved firm specific productivity shocks into account where the unobserved shock is measured by the use of intermediate inputs. The second method is the estimation of a semi-parametric and non-linear least squares regression of Buettner (2003) which also considers endogenous R&D in the total factor productivity calculation. Finally, it can be measured using a simple labour productivity measure which is calculated from the ratio of value added over total labour. In this study, the last measure is used due to data availability.
11

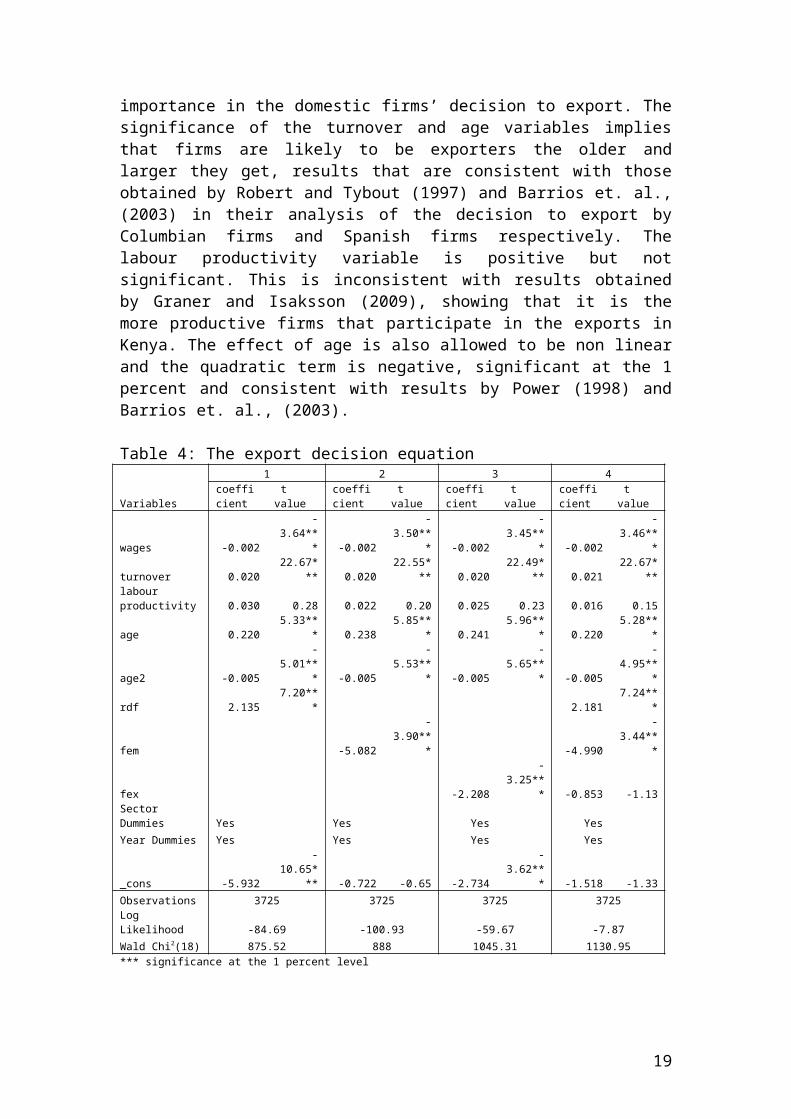
The results of the export decision estimation are presented in table 4 below. Based on the results, the average wage, turnover, age and age square are significant at the 1 percent level, suggesting their importance in the domestic firms’ decision to export. The significance of the turnover and age variables implies that firms are likely to be exporters the older and larger they get, results that are consistent with those obtained by Robert and Tybout (1997) and Barrios et. al.,(2003) in their analysis of the decision to export by Columbian firms and Spanish firms respectively. The labour productivity variable is positive but not significant. This is inconsistent with results obtained by Graner and Isaksson (2009), showing that it is the more productive firms that participate in the exports in Kenya. The effect of age is also allowed to be non linear and the quadratic term is negative, significant at the 1 percent and consistent with results by Power (1998) and Barrios et. al., (2003).
Table 4: The export decision equation
Variables
1 2 3 4coefficient t value
coefficient t value
coefficient t value
coefficient t value
wages -0.002 -3.64*** -0.002 -3.50*** -0.002 -3.45*** -0.002 -3.46***turnover 0.020 22.67*** 0.020 22.55*** 0.020 22.49*** 0.021 22.67***labour productivity 0.030 0.28 0.022 0.20 0.025 0.23 0.016 0.15age 0.220 5.33*** 0.238 5.85*** 0.241 5.96*** 0.220 5.28***age2 -0.005 -5.01*** -0.005 -5.53*** -0.005 -5.65*** -0.005 -4.95***rdf 2.135 7.20*** 2.181 7.24***fem -5.082 -3.90*** -4.990 -3.44***fex -2.208 -3.25*** -0.853 -1.13Sector Dummies Yes Yes Yes YesYear Dummies Yes Yes Yes Yes_cons -5.932 -10.65*** -0.722 -0.65 -2.734 -3.62*** -1.518 -1.33Observations 3725 3725 3725 3725Log Likelihood -84.69 -100.93 -59.67 -7.87Wald Chi2(18) 875.52 888 1045.31 1130.95*** significance at the 1 percent level
The average wage coefficient is negative and is in contrast with findings by Aitken et. al., (1997); Barrios et. al., (2003); Bernard and Jensen (2004) where export production is considered relatively skill-intensive due to high wages. The negative wage coefficient obtained in this study provides evidence of labour intensive export oriented foreign owned firms, which would be interested in cost effectiveness including low wages14. The results are however consistent with findings by Were and Mugerwa (2009), who observe that while better wages were important in attracting workers to the export sector at the beginning of trade liberalization in Kenya in the 1990s, increased competition for skilled workers raised wages more generally across the manufacturing sector, while also forcing firms to reduce labour. This was done mainly through the substitution of casual labour, and this could be a potential source of wage inequality in Kenya.
The spillover variables are also considered in table 4 above. There is evidence of positive spillovers on the domestic firms export decision through the demonstration effects as presented in column one. There is also evidence of negative spillovers through the competition and information channels as presented in column two and
14 It may suggest that in a labour surplus economy, exporting firms can obtain cheap labour and demand the most from them.
12

three. The evidence of demonstration effects in Kenya is consistent with findings by Langdon (1981) and Gachino (2006). This seems to suggest that domestically owned firms in some sectors are influenced by the R&D expenditure of foreign owned firms. This is mainly through the imitation or copying their new products or easy processes. Indeed, Greenaway et.al.,(2002) has found that in UK there are significant spillovers from R&D activities of foreign firms to domestic firms, but not from the R&D activities of domestic firms to other firms. However, Barrios et.al.,(2003) observed that R&D spillovers, whether from domestic or multinational firms do not appear to encourage exporting activities from domestic firms in Spain. The negative effects from the competition channel suggest that foreign owned firms may have introduced stiff competition in the Kenyan markets which negatively affected domestic firms in the short run. This is in contrast with the findings by Greenaway et. al., (2002) who found that the relative importance of multinationals in the domestic markets is positively and significantly associated with a higher probability that the domestic firms is exporting. The lack of information spillovers also suggests that concentration of foreign firms in given sectors does not necessarily benefit domestic firms. Similarly, Barrios et.al., (2003) failed to find evidence information spillovers from exporting activities of foreign owned firms on domestic firms in the same sector but in contrast found evidence that domestic firms located in export oriented sectors are more likely to be exporters. Moreover, as Ruane and Southland (2007) have observed, it is likely that foreign owned firms producing exclusively for exports, can be a source of negative export spillovers. However, Aitken et.al., (1997) and Greenaway et.al., (2002) found statistically significant information spillovers from exporting activities of multinationals.
4.2 The export propensity
The results of the export propensity estimation are presented in table 5 below.
Table 5: The export propensity equation
Variablecoefficient t value
coefficient t value
coefficient t value
coefficient t value
wages -5.8E-05 -0.88 -5.99E-05 -0.91 -4.08E-05 -0.64 -4.11E-05 -0.66turnover 3.5E-05 5.51*** 3.47E-05 5.51*** 3.45E-05 5.69*** 3.39E-05 5.71***age 0.003 0.62 0.003 0.67 0.003 0.67 0.003 0.83age2 -6.9E-05 -0.84 -7.27E-05 -0.9 -6.63E-05 -0.85 -7.74E-05 -1.02rdf 0.02 0.47 0.05 1.71*
fem -0.73-
9.51*** -0.92-
11.47***fex -0.43 2.76*** -1.05 6.66***Sector Dummies Yes Yes Yes YesYear Dummies Yes Yes Yes Yes_cons 0.26 3.45*** -0.08 -0.59 0.85 9.33*** 0.24 1.79*Observations 3725 3725 3725 3725Censored Observations 2604 2604 2604 2604Uncensored Observations 1121 1121 1121 1121Log Likelihood -84.69 -100.93 -59.67 -7.87Wald Chi2(18) 875.52 888 1045.31 1130.95
-0.02 -0.03 -0.03 -0.02
0.12 0.12 0.12 0.12Wald test for independence of equations(sigma=0) 9.14 8.54 8.46 7.15
13

prob>chi2(1) 0.00 0.00 0.00 1.00***,* significance at the 1 and 10 percent level
The results show that domestic firm’s export propensity is dependent on turnover, which is positive and significant at the 1 percent level. This result is consistent with the findings by Greenaway et.al., (2002) in the UK. There is also evidence that negative competition and information spillovers significantly affect the domestic firms export propensity. All the results above include sector and year dummies.
4.3 Robustness check
In order to establish robustness of the spillover measures, equation 13 is estimated using additional measures of spillovers. Demonstration effects are re-estimated following after Barrios et.al., (2003) who measured R&D spillovers as, the ratio of the research and development expenditure by both foreign and domestic firms to their sales or turnover (RDF1). Competition effects are also measured following after Aitken et. al. (1997) who measure the export activity of multinationals as the ratio of foreign owned firms exports in sector j over total exports in the same sector, relative to the importance of the foreign owned firms exports in total exports (FEM1).
Table 6: Robustness checkNew spillover measures Domestic firm spillovers to FDIVariable Coefficient z value Variable Coefficient z value
Export decision Export decisionRDF1 2.65 6.07*** RDD 0.13 0.62FEM1 -3.37 -9.33*** DEM -0.25 -0.40
DEX 0.43 0.34Export Propensity Export Propensity
RDF1 1.43 2.67*** RDD 0.02 0.44FEM1 -0.11 -2.71*** DEM -0.05 -0.54
DEX 0.38 1.80*
***, * significance level at 1 and 10 percent
The results presented in table 6 above, support the evidence of demonstration effects and negative competition effects from foreign owned firms on domestic firms. In addition, the impact of domestic firms’ presence on foreign firm owned firms exporting behaviour is estimated using RDD, DEM and DEX (defined as before but now for domestic firms) for the demonstration, competition and information spillovers channels. Results contained in column two in table 6 above, do not find evidence of export spillovers from domestic firms at the 5 percent level of significance, further confirming that export spillovers are generated by foreign owned firms in Kenya. Finally, the added-variables plots for the exports decision and the measure of foreign presence are generated using a linear probability model, and presented in graphs 6(a)-6(c) below. Upon removing the outliers the results do not change, hence robust.
Graph 6(a): RDF Graph 6(b): FEX Graph 6(c): FEM
14

-3-2
-10
1e(
ev
| X )
-.4 -.2 0 .2e( rdf | X )
coef = .63182594, se = .05733137, t = 11.02
-3-2
-10
1e(
ev
| X )
-.05 0 .05 .1 .15e( fex | X )
coef = -.36754369, se = .25791502, t = -1.43
-3-2
-10
1e(
ev
| X )
-.1 -.05 0 .05 .1e( fem | X )
coef = -.09306249, se = .20831382, t = -.45
5. Conclusion and Policy Implications
The aim of this paper was to investigate whether domestic firms are influenced to export by foreign owned firms. It was noted that although there are many studies addressing export spillovers, few studies especially in Africa have attempted to specifically exploring the special link between foreign and domestic owned firms. In Kenya, there is no study that has investigated the existence of export spillovers from foreign owned firms to domestic firms. The literature on spillovers suggests that foreign owned firms operating in host countries can be important sources of export spillovers. This is because they can create transport infrastructure or disseminate information about foreign markets that can be useful to local firms. In addition, this literature has identified various channels through which these spillovers take place. This paper, examined three important channels of export spillovers namely information externalities, demonstration effects and competition effects. Using firm level panel data for the period 2000-2005, a firm’s export decision and the export propensity decision was estimated using the Heckman selection model.
The results revealed that a firm’s decision to export in Kenya is influenced by average wages, turnover, age and age square. The export propensity of on the other hand is affected by turnover. The results also reveal that indeed, foreign firms influence the export decision of domestic firms positively through demonstration effects. There is also evidence of negative spillovers from competition and information channels. What implications does this have for policy?
At the outset this paper acknowledged the extensive policy competition between governments to attract foreign direct investment. This is based on the assumption of externalities being present. In this paper we have noted Kenya’s long commitment to attracting foreign direct investment as shown through the pursuit of various policies and institutions. However, these efforts do not appear to have yielded much fruit because FDI in Kenya compared to other countries especially those from the newly industrialised countries from South East Asia remains very low. In addition to aggressive efforts aimed at increasing FDI inflows in the manufacturing sector in Kenya, there is need to investigate the causes of the negative spillovers, in order to consider ways that may reverse this trend, in line with the Kenya’s government vision of making firms in the manufacturing sector internationally competitive.
15
References
Aitken B., G.H.Hanson and A.E. Harrison (1997) “Spillover, foreign investment and export behaviour,” Journal of International Economics 43(1-2): 103-132
Anwar, S and L.P. Nguyen (2011) “ Foreign Direct Investment and export spillovers: Evidence from Vietnam,” International Business Review 20(2): 177-193
Barrios, S., H.Gorg and E.Strobl (2003) “Explaining Firms’ Export Behaviour: R&D and the Destination Market,” Oxford Bulletin of Economics and Statistics 65(4): 475-496
Barry, F. and J. Bradley (1997) “FDI and the trade: the Irish host-country experience,” Economic Journal 107(445):1798-1811
Bernard, A. and J. B. Jensen (1999) “Exceptional exporter performance: cause, effect, or both?” Journal of International economics 47 (1): 1–25
Bernard, A. and J.B. Jensen (2004) “Why Do Some Firms Export?” The Review Economics and Statistics 86(2): 561-569
Bernard, A. B. and J. B. Jensen (1995) “Exporters, Jobs, and Wages in U.S. Manufacturing: 1976–1987,” Brookings Papers on Economic Activity: Microeconomics, 1995:67–119.
Bernard, A., J. Eaton, J.B. Jensen and S. Kortum (2003) “Plants and Productivity in International Trade”, The American Economic Review 93(4):1268-1290.
Bigsten, A., Collier, P., Dercon, S., Fafchamps, M., Gauthier, B., Gunning, J.W., Oduro, A., Oostendorp, R., Pattillo, C., So¨derbom, M., Teal, F., A. Zeufack (2004) “Do African manufacturing firms learn from exporting,” Journal of Development Studies 40(3):115– 141
Blomstrom, M and A. Kokko (1998) “Multinational Corporations and Spillovers,” Journal of Economic Surveys 12(2): 1-31
Bradshaw, Y.W. (1988) “Reassessing Economic Dependency and Uneven Development: The Kenyan Experience,” American Sociological Review 53(5):693-708
Buettner, T. (2003) “R&D and the Dynamics of Productivity,” mimeo, London School of Economics
Clerides, S., S. Lach, and J. Tybout (1998) “Is learning by exporting important? Microdynamic evidence from Colombia, Mexico, and Morocco,” Quarterly Journal of Economics 113(3): 903–948
de Mello, L. (1997) “Foreign Direct Investment in Developing Countries and Growth: A Selective Survey”, Journal of Development Studies, 34(1) : 1-34.
Fahnbulleh, M. (2006) “In search of Economic Development in Kenya : Colonial Legacy and Post-Independent Realities,” Review of African Political Economy 33(107): 33-47
Fosfuri, A., M. Motta., and T. Ronde (2001) “Foreign Direct Investment and spillovers through workers’ mobility,” Journal of International Economics 55(1): 205-222
Gachino, G. and R. Rasiah (2003) “Labour Productivity, Exports and Skills Formation: Comparing Foreign and Local Firms in Kenyan Manufacturing
16

Industry”. Paper presented at the International Workshop FDI-Assisted Development, Oslo 22-24 May 2003
Gachino, G.G. (2006) Foreign Direct Investment, Spillovers and Innovations: The case of Kenyan Manufacturing Industry. PhD Thesis. Maastricht
Gershenberg, I. (1987) “The Training and Spread of Managerial Know How, A Comparative Analysis of Multinational and Other Firms in Kenya,” World Development 15 (7): 931-939
Gorg, H. and D. Greenaway (2004) “Much Ado about Nothing? Do Domestic Firms Really Benefit from Foreign Direct Investment?” World Bank Research Observer, 19(2): 171-197.
Gorg, H. and E. Strobl (2005) “Foreign Direct Investment and Local Economic Development: Beyond Productivity Spillovers,” in Theodore, H. Moran, Edward, M. Graham and Magnus Bloomstrom (eds) Does Foreign Direct Investment promote Development? Washington, DC: Institute for International Economics and the Center for Global Development
Government of Kenya (1994) The Seventh National Development Plan. Resource Mobilization for Sustainable Development. Nairobi, Kenya. Government Printers
Graner, M. and A. Isaksson (2009) “Firm efficiency and the destination of exports: Evidence from Kenya plant level data,” The Developing Economies 47(3): 279-306
Greenaway, D. and R. Kneller (2008) “Exporting, Productivity and Agglomeration,” European Economic Review 52(5): 919-939
Greenaway, D., N.Sousa and K.Wakelin (2004) “Do domestic Firms Lean to Export from Multinationals?” European Journal of Political Economy 20(4): 1027-1043
Jenkins, R. (1990) “Comparing foreign subsidiaries and local firms in LDCs: Theoretical issues and empirical evidence,” Journal of Development Studies 26(2): 205-228.
Kamau, P., D. McCormick and N. Pinaud (2009) “The Developmental Impact of Asian Drivers on Kenya with Emphasis on Textiles and Clothing Manufacturing,” The World Economy 32(11): 1586-1612
Kneller, R. and M. Pisu (2005) “Export-Oriented FDI in the UK,” Oxford Review of Economic Policy 20(3): 424-439
Kneller, R. and M. Pisu (2007) “Industrial Linkages and Export Spillovers from FDI,” The World Economy 30(1):105-134
Koenig, P., F. Mayneris and S. Poncet (2010) “Local export spillovers in France,” European Economic Review 54(4): 622-641
Krautheim, S. (2008) “Gravity and Information: Heterogeneous Firms, Exporter Networks and the Distance Puzzle,” EUI Mimeo.
lake, A.P. and N. Pain (1994) “Investigating Structural Change In UK Export Performance: The Role Of Innovation And Direct Investment,” NIESR Discussion Paper No.71
Langdon, S. (1981) Multinational Corporations in the Political Economy of Kenya. London; Macmillan.
Levinsohn, J. and A. Petrin (2003) “Estimation Production Functions Using Inputs to Control for Unobservables,” Review of Economic Studies 70 (2): 317–341.
Melitz, M. (2004) “The Impact of Trade on Intra-Industry Reallocations and Aggregate Industry Productivity,” Econometrica 71(6):1695-1725
17

Mwega, F.M. and N.S. Ndung’u (2002) “Explaining African Economic Growth Performance: The Case of Kenya,” Draft final report prepared for the AERC collaborative project on Explaining African Economic Performance
O’Brien, F. S. and T.C. Ryan (2001) ‘Kenya’, In Devarajan S., Dollar, D., and Holmgren, T., (Eds.), Aid and Reform in Africa: Lessons from ten case studies, Washington D.C. The World Bank
Onjala, J. (2008) “A Scoping Study on China-Africa Economic Relations: The Case of Kenya,” Working Paper Africa Economic Research Consortium.
Phelps, N.A., Stillwell, J. C. H., and R. Wanjiru (2008) “Broken Chain? AGOA and Foreign Direct Investment in the Kenya Clothing Industry,” World Development. 37(2): 215-325
Phillips, L.C. and M. Obwana (2000) “Foreign Direct Investment in East Africa: Interaction and Policy Implications”. African Economic Policy Discussion Paper number 67.
Power, L. (1998) “The missing link: technology, investment and productivity,” Review of Economics and Statistics 80(2): 300-313
Rasiah, R. and G. Gachino (2005) “Are Foreign Firms more Productive, and Export and Technological Intensive than Local Firms in Kenyan Manufacturing?” Oxford Development Studies 33(2):211-228
Rauch, J.E and J. Watson (2003) “Starting small in an unfamiliar environment,” International Journal of Industrial Organization 21(7): 1021-1042
Robert, M.J and J.R.Tybout (1997) “The decision to export in Columbia: an empirical model of entry with sunk costs,” American Economic Review 87(4): 545-564
Rweyemamu, N.A. (1987) “Foreign Investment Policy: Kenya’s experience,” In Cable V., and Persaud, B., (Eds) Developing with foreign Investment. The Common Wealth Secretariat. USA.
Swainson, N. (1980) The Development of Corporate Capitalism in Kenya 1918-1977. Berkeley and Los Angeles. University of California
Todaro, M. (2000) Economic Development. Reading, Mass Addison-Wesley.UNCTAD (2005) Investment Policy Review, Kenya: New York and Geneva.Van Biesebroeck J. (2005) “Exporting raises productivity in sub-Saharan African
manufacturing firms,” Journal of International Economics 67(2):393-391Warutere, P. (2005) “The Goldenberg Conspiracy: The Game of Paper Gold, Money
and Power,” The Institute for Security Studies Occasional Paper 177, September.
Were, M. and S.K. Megerwa (2009) “Do Exporting Firms Pay Higher Wages? Evidence from Kenya’s Manufacturing Sector,” African Development Review 21(3): 435-453
Winder, G.M. (2006) “Webs of Enterprise 1850-1914: Applying a Broad Definition of FDI”, Annals of the Association of American Geographers 96 (4): 788-806.
18
19

Table A.1: Correlation MatrixVARIABLES WAGES PROFIT TURNOVER LABOUR~P R&D FUNDS AGE RDF FEM FEXWAGES 1PROFIT -0.1553 1TURNOVER -0.1497 0.8587 1LABOURPROP 0.3255 0.2871 0.2917 1R&D -0.1444 0.6255 0.619 0.2558 1FUNDS -0.035 -0.0059 -0.0101 -0.031 0.0142 1AGE -0.1802 0.4757 0.4979 0.3331 0.5068 0.1005 1RDF 0.0096 0.017 0.0356 0.047 0.0379 0.0603 0.0075 1FEM 0.0463 0.0701 0.1276 0.117 0.0735 0.0807 0.0942 0.5706 1FEX 0.0659 0.04 0.0914 0.1274 0.048 0.0675 0.116 0.5871 0.8329 1
Table A.2:Classification of Firms across sectors 2000 2001 2002 2003 2004 2005 Rep
Registered firms by 2005
ISIC Code Industry Classification For Dom For Dom For Dom For Dom For Dom For Dom For Doc For Dom Total31 food, beverage and tobacco 54 73 57 79 52 76 59 55 61 62 57 67 0.53 0.31 107 224 34132 Textile, Apparel and leather 47 48 53 62 50 64 52 57 55 51 53 55 0.45 0.31 114 179 29333 Wood and wood products 15 64 17 65 14 61 15 63 14 62 12 66 0.31 0.54 47 118 16534 Paper and paper products 26 63 24 67 25 63 27 59 27 61 23 67 0.45 0.70 56 90 14835 Chemical, petroleum and plastics 42 87 46 92 43 87 40 89 41 87 45 91 0.37 0.40 117 222 34936 Non metallic mineral products 29 47 33 53 32 55 31 52 37 53 34 56 0.80 0.54 41 98 13937 Basic metal industries 31 56 35 59 30 52 33 57 38 55 31 58 0.63 0.55 52 103 165
38Fabricated metal products, machinery and equipment 22 56 23 63 25 57 25 59 27 58 26 62 0.40 0.42 61 142 203
39 Other manufacturing industries 51 111 57 128 56 132 57 81 65 95 71 127 0.59 0.60 101 186 287
Total 317 605 345 668 327 647339 572 365 584 352 649 686 1362 2058
Key: For=Foreign; Dom = Domestic; Rep = Representation = ratio of average for the period 2000-2005 to the sampling frame per sector
20