do employers prefer undocumented workers? evidence from ... · do employers prefer undocumented...
TRANSCRIPT
Do Employers Prefer Undocumented Workers?
Evidence from China’s Hukou System
Peter Kuhna
Kailing Shenb
April 23, 2015 This research is supported by the National Natural Science Foundation of China through Grant No. 71203188, titled "Impacts of Hukou, Education and Wage on Job Search and Match: Evidence Based on Online Job Board Microdata".
1
In many labor markets, employers face a choice between workers with different forms of residency rights, including permanent residents, temporary residents and undocumented workers.
Popular and academic claims about employers’ hiring choices in this situation both tend to be contradictory:
-employers discriminate against temporary migrants (for taste reasons, or to protect locals) -employers prefer temporary migrants (because they are cheaper, or work harder).
2
But, despite substantial literatures on:
-temporary migrants (Dustmann 2000); legal permanent residence (Borjas and Tienda 1993, Rivera-Batiz 1999, Kossoudji and Cobb-Clark 2002, Barcellos 2010) -effects of race, ethnicity, and gender and unemployment status on employers’ hiring decisions (Bertrand and Mullainathan 2004, Oreopoulos 2011, Neumark 1996, Kroft et al. 2013)
No one (to our knowledge) has studied employers’ hiring choices between workers with and without permanent residency rights in any jurisdiction.
3
This paper studies employers’ choices between workers with different residence rights in the unique context of China’s hukou system. Noteworthy features of China’s hukou system:
-residency rights are assigned by city and provincial governments -workers without permanent residence rights are a large share of many urban labor markets -unlike U.S. undocumented workers who have an incentive to hide from the authorities, workers with non-local hukou can be studied relatively easily -still, a number of host government policies make it very difficult for non-registered workers to settle permanently and raise a family. -these (and other) restrictions may make non-registered workers either more or less attractive to employers.
4
Our goals: To understand how urban Chinese employers ‘read’ resumes: is local hukou (LH) a positive or a negative attribute, ceteris paribus? Or, equivalently, does having permanent residence confer an advantage or disadvantage on a jobseeker in the ‘hiring race’? And how does this vary with job and worker type? We’ll argue later in the paper that answering this question might shed some interesting, more general light on urban Chinese labor markets.

5
Our empirical approach:
We use internal records of XMRC.com, an Internet job board serving private sector employers in a medium-sized Chinese coastal city (Xiamen). On this board, we compare the call-back rates of observationally identical local hukou (LH) and non-local hukou (NLH) applicants to the same jobs.
6
Some methodological contributions: 1. Illustrate potential of job board data to study the value of credentials:
-while credentials are not randomly assigned, job board data: -don’t require fictitious resumes -for recall decisions, the scope for omitted ability bias is limited
-can be almost instantly (and continuously) available
-cover a broader labor market at lower cost than resume audits
-broader spectrum makes it easier to study job-worker match effects -larger sample facilitates the study of multiple resume dimensions, such as education, school type and ID, experience, citizenship, gender, photo, etc.

7
2. Highlight an important limitation of hiring studies (including our own): For reasons discussed below, choice of estimation sample probably ‘matters more’ here than in studies of wage gaps. This is a concern, since estimation samples in resume audit studies tend to be quite limited:
Bertrand-Mullainathan (2004): Sales, administrative support, clerical, and customer service jobs.
Kroft et al. (2013): online postings for Sales, Customer Service, Administrative Support, and Clerical jobs.
Oreopoulos (2011): Jobs that accepted applications via direct e-mail and required three to seven years of experience and an undergraduate degree.
8
Why does sampling matter so much? Consider a hiring study in a labor market where a favored group of workers has preferential access to a set of ‘good’ (e.g. high wage) jobs.
If “good” jobs are overrepresented in the analysis sample, studies can overstate the favored group’s advantage in getting job offers.
If “bad” jobs are overrepresented in the sample, one could even observe a higher callback rate among the disfavored group. This would not imply an absence of discrimination against the disfavored group.
Essentially, while a wage advantage is always good news, a hiring rate advantage may or may not be—it depends on the set of jobs in your sample.
9
Our main results:
Despite evidence suggesting discrimination against migrants from other sources (wage gaps, experiments, exclusion from certain jobs), non-local hukou (NLH) is an advantage in the competition for a large set (in fact, a majority) of urban jobs: those in the private sector. This preference is especially strong in jobs requiring low levels of skill.
10
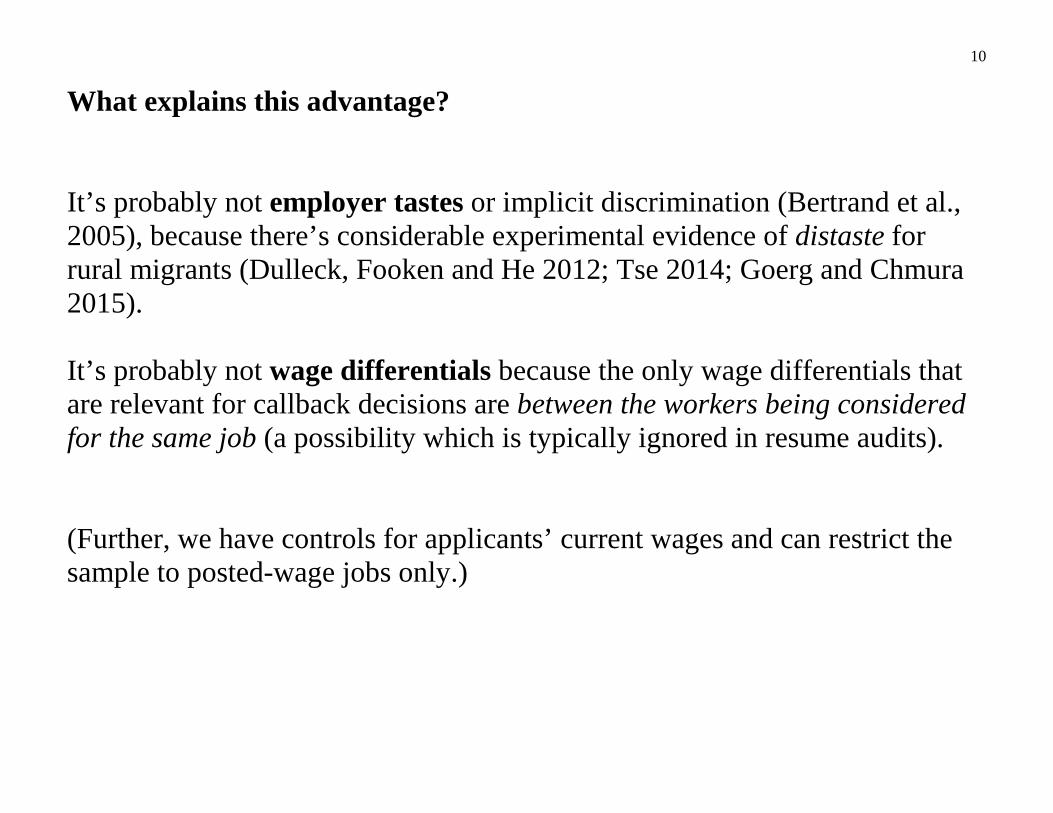
What explains this advantage? It’s probably not employer tastes or implicit discrimination (Bertrand et al., 2005), because there’s considerable experimental evidence of distaste for rural migrants (Dulleck, Fooken and He 2012; Tse 2014; Goerg and Chmura 2015). It’s probably not wage differentials because the only wage differentials that are relevant for callback decisions are between the workers being considered for the same job (a possibility which is typically ignored in resume audits). (Further, we have controls for applicants’ current wages and can restrict the sample to posted-wage jobs only.)
11
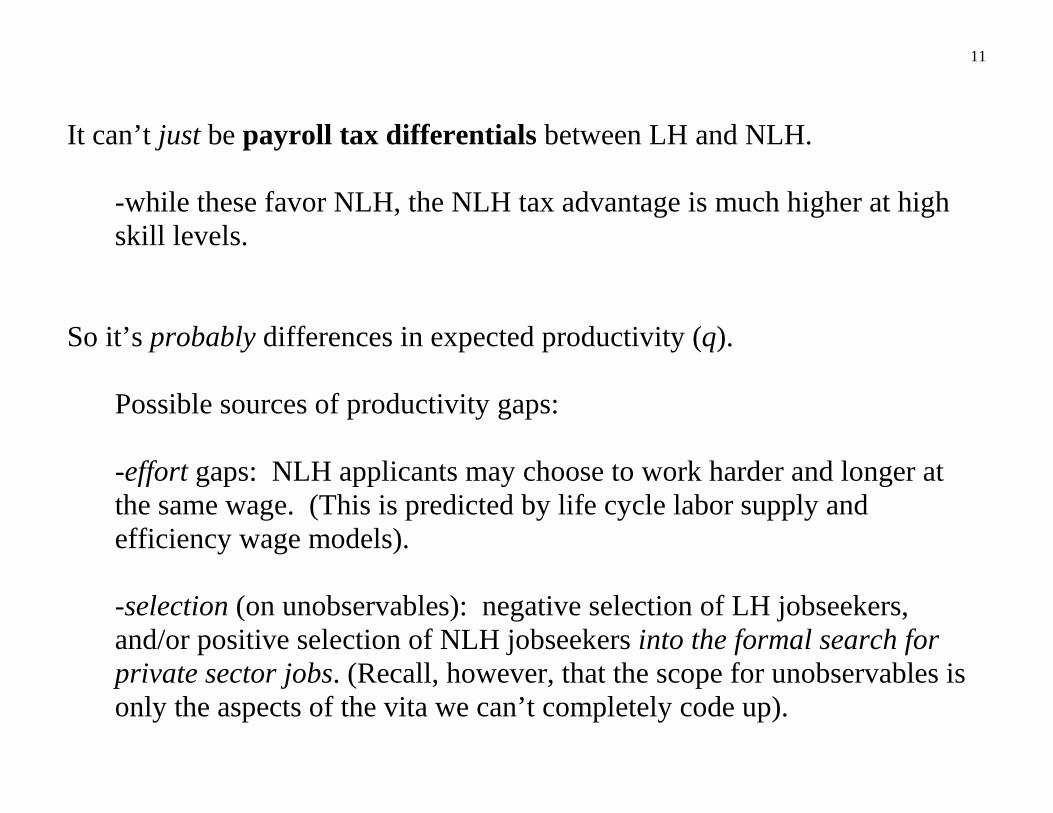
It can’t just be payroll tax differentials between LH and NLH. -while these favor NLH, the NLH tax advantage is much higher at high
skill levels.
So it’s probably differences in expected productivity (q). Possible sources of productivity gaps:
-effort gaps: NLH applicants may choose to work harder and longer at the same wage. (This is predicted by life cycle labor supply and efficiency wage models).
-selection (on unobservables): negative selection of LH jobseekers, and/or positive selection of NLH jobseekers into the formal search for private sector jobs. (Recall, however, that the scope for unobservables is only the aspects of the vita we can’t completely code up).

12
The Plan:
1. What is hukou?
2. Data and Methods
3. Results
4. Explanations: Why do firms prefer NLH workers?
5. Discussion

13
1. What is hukou?
14
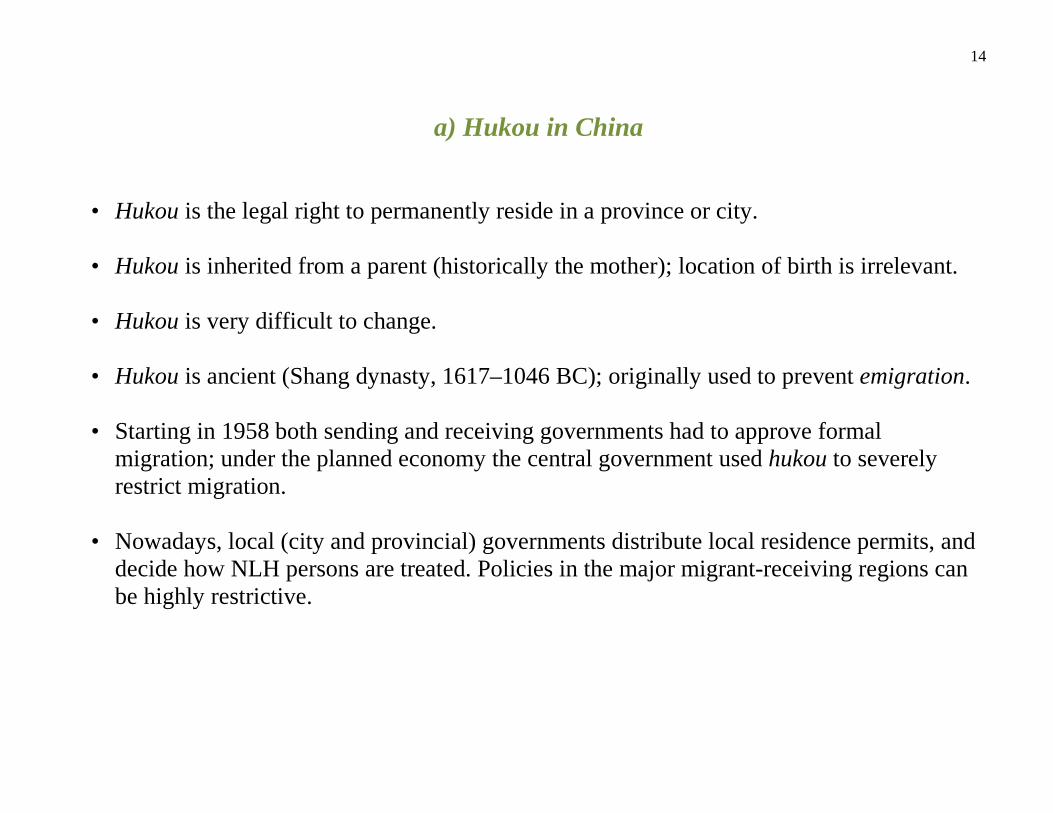
a) Hukou in China
• Hukou is the legal right to permanently reside in a province or city.
• Hukou is inherited from a parent (historically the mother); location of birth is irrelevant.
• Hukou is very difficult to change.
• Hukou is ancient (Shang dynasty, 1617–1046 BC); originally used to prevent emigration.
• Starting in 1958 both sending and receiving governments had to approve formal migration; under the planned economy the central government used hukou to severely restrict migration.
• Nowadays, local (city and provincial) governments distribute local residence permits, and decide how NLH persons are treated. Policies in the major migrant-receiving regions can be highly restrictive.
15
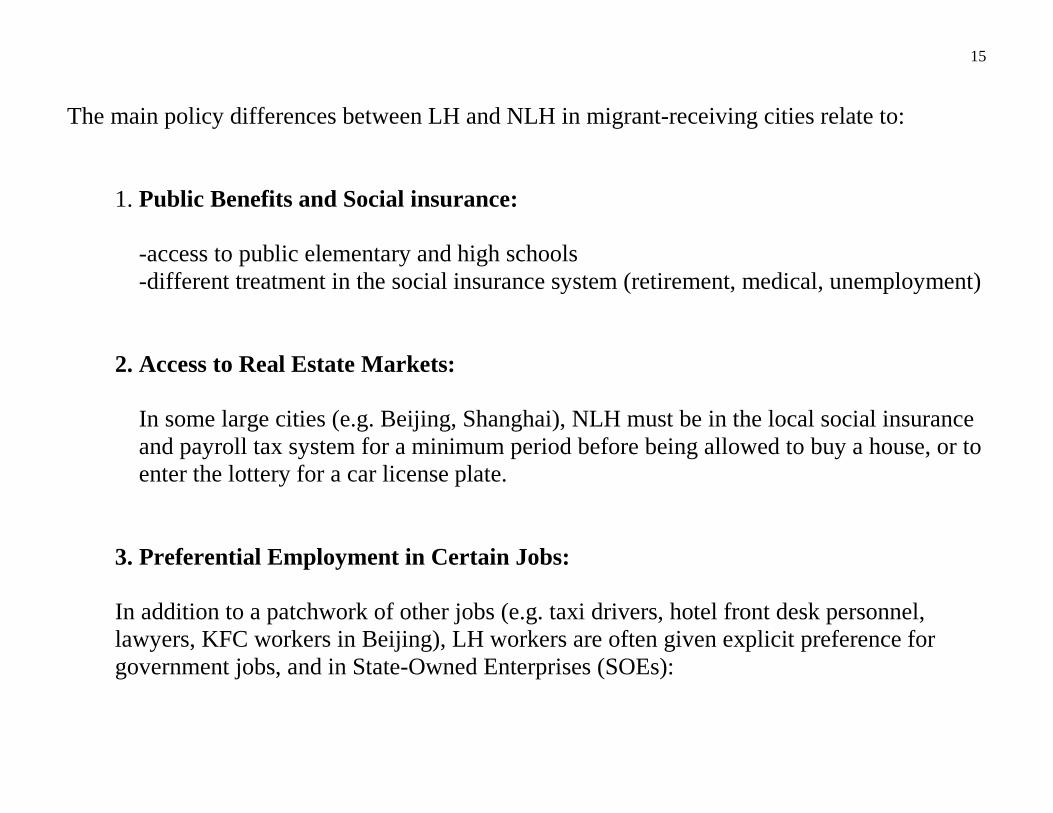
The main policy differences between LH and NLH in migrant-receiving cities relate to:
1. Public Benefits and Social insurance: -access to public elementary and high schools -different treatment in the social insurance system (retirement, medical, unemployment)
2. Access to Real Estate Markets: In some large cities (e.g. Beijing, Shanghai), NLH must be in the local social insurance and payroll tax system for a minimum period before being allowed to buy a house, or to enter the lottery for a car license plate.
3. Preferential Employment in Certain Jobs: In addition to a patchwork of other jobs (e.g. taxi drivers, hotel front desk personnel, lawyers, KFC workers in Beijing), LH workers are often given explicit preference for government jobs, and in State-Owned Enterprises (SOEs):

16
Aluminum Corporation of China 2012 college graduates recruitment notice
Aluminum Corporation of China is the central management of key state enterprises, mainly engaged in aluminum, copper, rare and rare earth resources development and other non-ferrous metals, smelting, processing, trade, and related engineering and technical services. The main products ranked second in the world production of alumina, aluminum ranked third in the world, ranked the world's fifth-aluminum timber, is also China's largest copper joint ventures. The company has four consecutive years of Fortune 500 companies. According to the development needs, the company is headquartered in Beijing and units for college recruiting 2012 graduates are welcome in each of Beijing, outstanding college graduates to the company to venture outside Beijing, Beijing, the proportion of students with Jingwaishengyuan which is 3:7. First, the basic conditions Good quality expertise and team spirit; ambitious, responsible, positive, rigorous style; has good spoken and written English and text writing skills; health. Second, recruitment positions and requirements
Job Status By Science Education Compensation Management Human Resource Management Graduate
Tax Management Finance and Economics Graduate Development of new materials
Metallic material molding, machining Graduate
Mechanical Design Mechanical design, simulation Graduate (Note: Beijing students, education can be relaxed) Third, the recruitment process Voluntary registration, qualification, written examination and interview, for receiving and other procedures. Fourth, registration (A) Application Deadline: January 9, 2012 to February 28, 2012 (B) Registration: submit personal information online. Do not accept on-site, telephone, mail and other ways to register. (C) submit the address: http:// hr.chalco.com.cn

17
From Wenda.so.com: Outsiders can do a taxi driver in Beijing? aimeiaishenghu | Lv4 | Viewed 189 times | From Q & PC Edition 2013-05-20 13:25 My dad would like to open a taxi, but the taxi companies not to foreign accounts, and my family moved to Beijing are 7-8 years, and also bought a house here, my dad had a driver's license of A2, 9 years of driving experience on the road to Beijing also very familiar with, but is not, where the account has a relationship with the car right? Satisfactory answer
Report | 2013-05-20 23:26
Very sorry, your father can not engage in the Beijing taxi industry. Taxi in Beijing opened the first condition is that you must have a father Beijing official account. According to the Beijing Municipal Transportation Authority and the Beijing taxi management regulations, Beijing taxi drivers must meet the following conditions: (a) have permanent residence in the city, 60-year-old male and female 50 years of age, in good health, get a driver's license more than three years. Tourist passenger car drivers must also engage in more than three years of continuous large and medium-sized passenger car driving to work; (b) compliance with laws and regulations; (c) revoked the operating certificate of eligibility shall expire over five years; (d) by the City Traffic administrative department of examination and obtain a certificate. Additional information: Non-Beijing accounts, guaranteed by the Pekingese is not allowed. Beijing's 121 existing taxi companies do not own the rights to recruit foreign accounts taxi driver. Taxi Zhunjia Zheng training schools are not enrolling students in other provinces account. I have a better answer, continue to answer Knowledge
• Outsiders can be a taxi driver in Beijing do an answer • Foreigners are not allowed to open in Beijing taxis do an answer • Foreigners in Beijing carve a taxi? 1 answer • Foreigners are not allowed to open in Beijing taxis do an answer
18
b) Hukou in Xiamen:
(During our sample period: July 2010 – June 2011)
1. Public Benefits and Social insurance: Conditional on being in the system, LH and NLH workers are treated identically by the unemployment insurance, worker’s compensation, and childbirth benefits systems. They are treated differently by the two most important social insurance programs: --retirement and medical insurance— paying lower taxes and receiving lower benefits. Section 5 provides details. NLH and LH children both enjoy free tuition in elementary and junior middle schools, but LH children have priority in admissions. Remaining places are assigned by lottery among NLH children.
In practice, access for NLH children can be very limited:
19
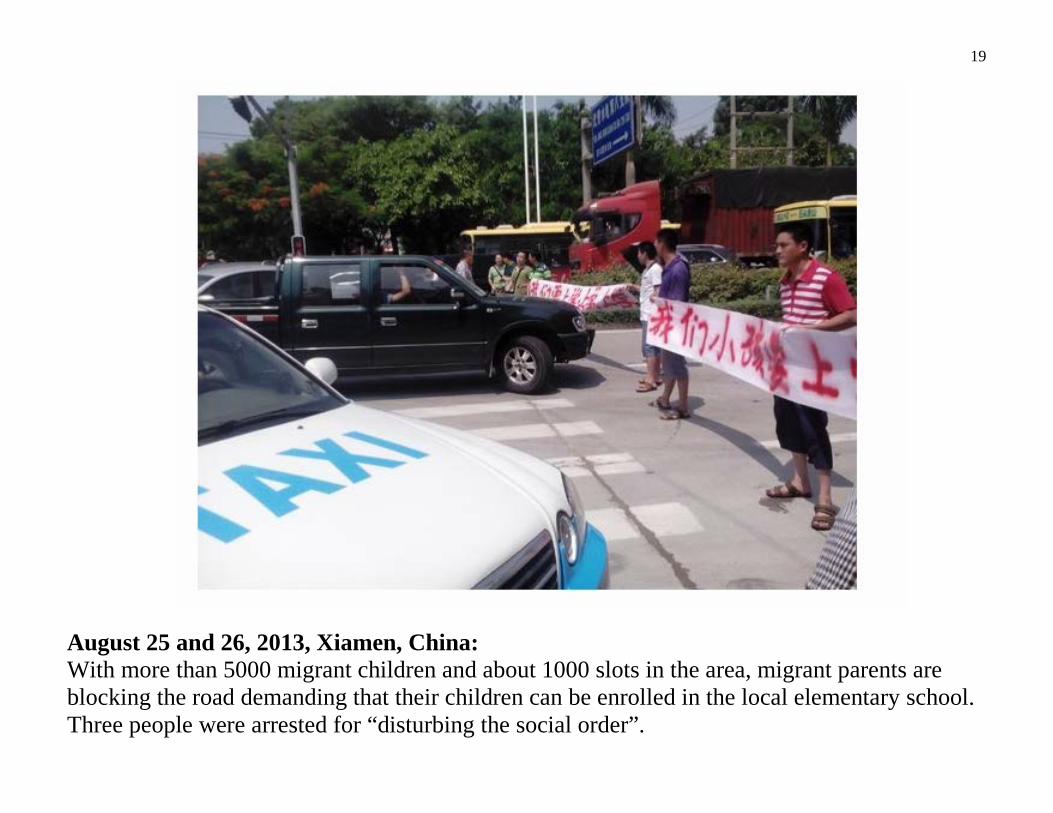
August 25 and 26, 2013, Xiamen, China: With more than 5000 migrant children and about 1000 slots in the area, migrant parents are blocking the road demanding that their children can be enrolled in the local elementary school. Three people were arrested for “disturbing the social order”.
20
2. Access to Real Estate Markets:
NLH persons may can purchase a maximum of one apartment, after a minimum residency period.
3. Preferential Employment in Certain Jobs: We have no direct evidence of restrictions, but LH workers are highly overrepresented in SOEs and the public sector. That said, explicit local government labor market policy objectives tend to emphasize protection of LH (reducing unemployment rates, helping displaced workers), while encouraging growth in the number of NLH employed.
Overall, our impression is that Xiamen is somewhat more welcoming to NLH than the ‘hottest’ destination cities (BeiShangGuang), but its policies still make it difficult for migrants to settle down and raise a family.
21
c) Characteristics of LH and NLH in Urban China
(2005 Census data)
22
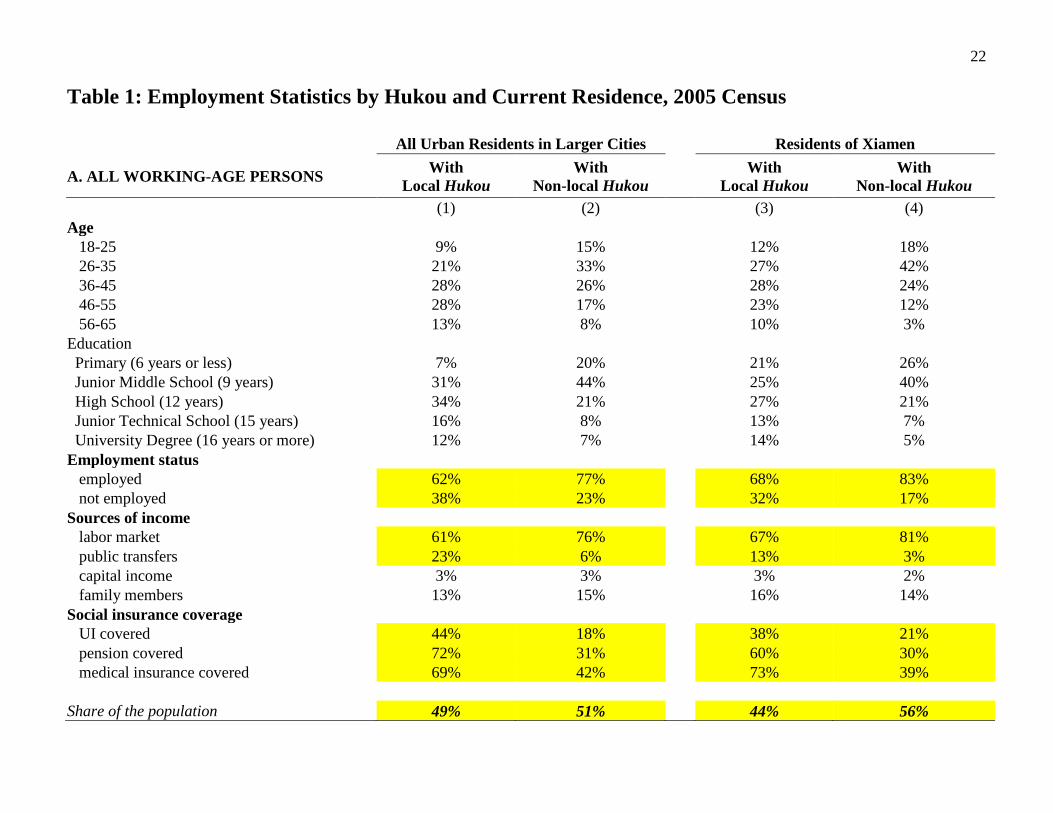
Table 1: Employment Statistics by Hukou and Current Residence, 2005 Census All Urban Residents in Larger Cities Residents of Xiamen
A. ALL WORKING-AGE PERSONS With Local Hukou
With Non-local Hukou
With Local Hukou
With Non-local Hukou
(1) (2) (3) (4) Age 18-25 9% 15% 12% 18% 26-35 21% 33% 27% 42% 36-45 28% 26% 28% 24% 46-55 28% 17% 23% 12% 56-65 13% 8% 10% 3% Education Primary (6 years or less) 7% 20% 21% 26% Junior Middle School (9 years) 31% 44% 25% 40% High School (12 years) 34% 21% 27% 21% Junior Technical School (15 years) 16% 8% 13% 7% University Degree (16 years or more) 12% 7% 14% 5% Employment status employed 62% 77% 68% 83% not employed 38% 23% 32% 17% Sources of income labor market 61% 76% 67% 81% public transfers 23% 6% 13% 3% capital income 3% 3% 3% 2% family members 13% 15% 16% 14% Social insurance coverage UI covered 44% 18% 38% 21% pension covered 72% 31% 60% 30% medical insurance covered 69% 42% 73% 39% Share of the population 49% 51% 44% 56%
23
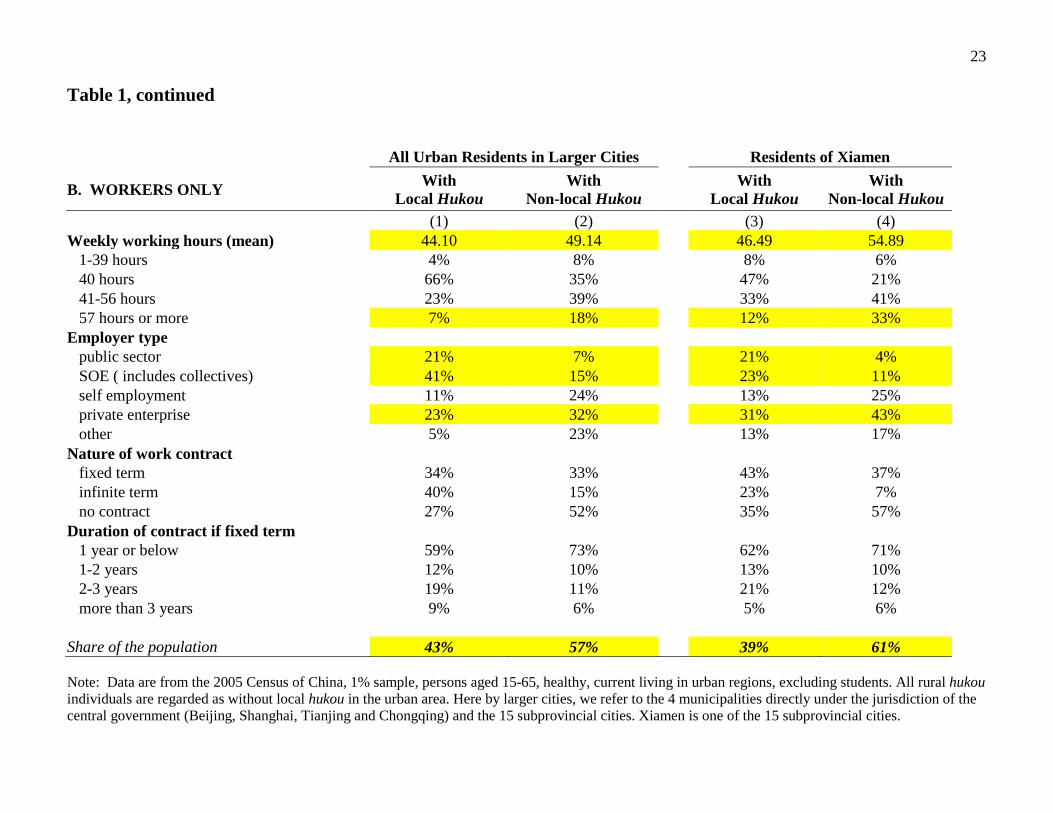
Table 1, continued
Note: Data are from the 2005 Census of China, 1% sample, persons aged 15-65, healthy, current living in urban regions, excluding students. All rural hukou individuals are regarded as without local hukou in the urban area. Here by larger cities, we refer to the 4 municipalities directly under the jurisdiction of the central government (Beijing, Shanghai, Tianjing and Chongqing) and the 15 subprovincial cities. Xiamen is one of the 15 subprovincial cities.
All Urban Residents in Larger Cities Residents of Xiamen
B. WORKERS ONLY With Local Hukou
With Non-local Hukou
With Local Hukou
With Non-local Hukou
(1) (2) (3) (4) Weekly working hours (mean) 44.10 49.14 46.49 54.89 1-39 hours 4% 8% 8% 6% 40 hours 66% 35% 47% 21% 41-56 hours 23% 39% 33% 41% 57 hours or more 7% 18% 12% 33% Employer type public sector 21% 7% 21% 4% SOE ( includes collectives) 41% 15% 23% 11% self employment 11% 24% 13% 25% private enterprise 23% 32% 31% 43% other 5% 23% 13% 17% Nature of work contract fixed term 34% 33% 43% 37% infinite term 40% 15% 23% 7% no contract 27% 52% 35% 57% Duration of contract if fixed term 1 year or below 59% 73% 62% 71% 1-2 years 12% 10% 13% 10% 2-3 years 19% 11% 21% 12% more than 3 years 9% 6% 5% 6% Share of the population 43% 57% 39% 61%
24
Thus, in 2005: 61% of Xiamen’s employed population (and 68 % of its private sector workers) were NLH.

25
2. Data and Methods
26
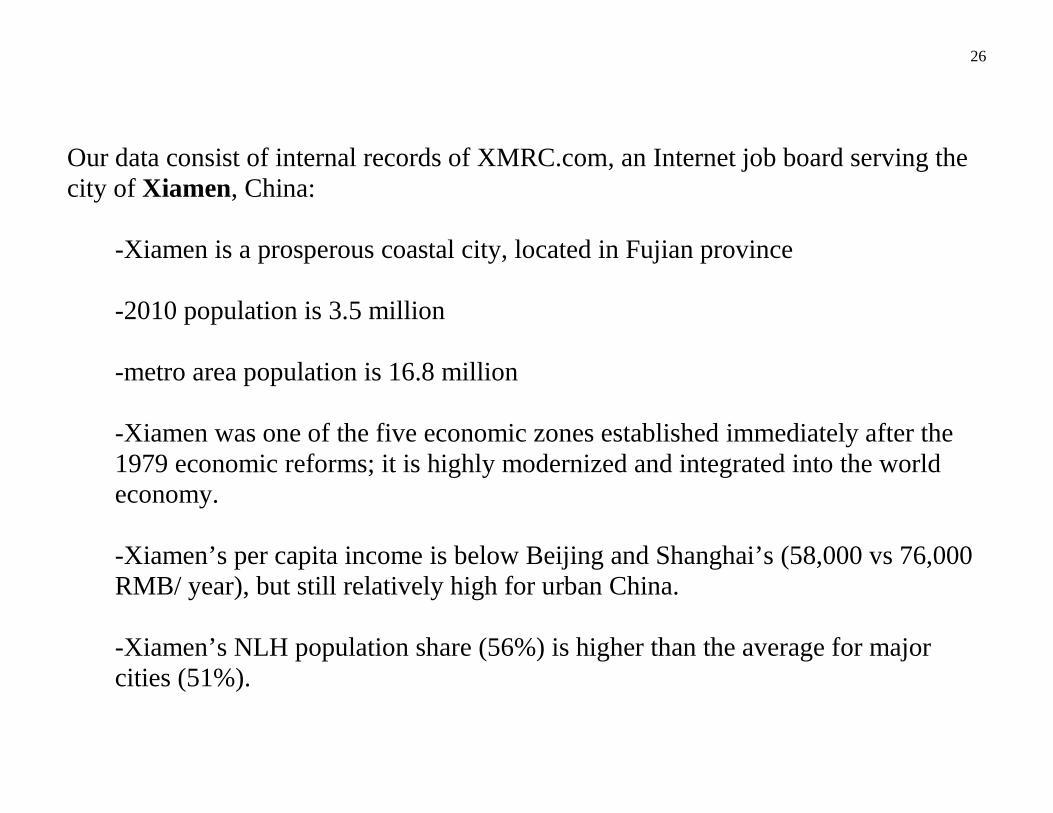
Our data consist of internal records of XMRC.com, an Internet job board serving the city of Xiamen, China:
-Xiamen is a prosperous coastal city, located in Fujian province -2010 population is 3.5 million -metro area population is 16.8 million -Xiamen was one of the five economic zones established immediately after the 1979 economic reforms; it is highly modernized and integrated into the world economy. -Xiamen’s per capita income is below Beijing and Shanghai’s (58,000 vs 76,000 RMB/ year), but still relatively high for urban China.
-Xiamen’s NLH population share (56%) is higher than the average for major cities (51%).
27
XMRC (http://www.xmrc.com.cn):
-went online in early 2000
-is one of two job boards specializing in the Xiamen metro area -both boards serve private sector employers almost exclusively (SOEs and the public sector recruit through other channels). -XMRC is a privately-operated US-style job board, with posted ads and resumes, on-line job applications, and on-line callbacks. -the other board, XMZYJS is a government-run job posting service. Resumes aren’t posted, and applications take place by phone or in person. Most jobs posted here require less than 9 years of education.
28
Other noteworthy features of XMRC: -A wide range of occupations and skill levels are represented -LH and NLH applicants on the board have on average very similar observed qualifications -NLH applicants vastly outnumber LH on XMRC, at 91 percent of applicants and 92 percent of applications. While this seems large, recall that 68 percent of Xiamen’s 2005 private sector employment was NLH, and that XMRC may be a gateway for non-residents to move to Xiamen.
29
Our sample is an inflow sample of ads: We started with all the ads for jobs in Xiamen that received their first application in our designated time frame (May 1st , 2010 to October 30th, 2010). Then we asked XMRC to provide us with all the resumes that applied to those ads, plus information on all the firms that posted those ads. We also have a mapping of which resumes applied to which ads, and a record of which resumes were contacted by the firm posting each ad via XMRC. We continue monitoring all the ads posted during the above window until January 13, 2011 (74 days after Oct. 30 2010) to identify any contacts that occurred. Most contacts occur very quickly (within 2 weeks of application). Being contacted by a firm via XMRC after submitting an application is our indicator of worker success in the hiring process. Since our goal is to estimate which workers are selected by firms for interviews or employment, the sample of ads used in this paper further restricts attention to ads that received at least one response from the firm via XMRC.
30
Other Sampling and Data Notes: We dropped ads:
-with minimum requested age below 18, or maximum requested age over 60 -offering more than 10,000 yuan/month -requesting a master’s, professional or PhD degree -for more than 10 vacancies (not clear the occupation is unique) -with missing firm information -from a very small number of SOEs -where the job located outside Xiamen city (to fix payroll taxes)
We dropped cvs:
-with current wage above 10,000 yuan/month -with missing or foreign hukou
We dropped applications:
-that couldn’t be matched to an ad and a worker -(as noted) that never resulted in a contact
LH in our data refers to Xiamen city hukou; workers with Fujian but not Xiamen hukou are treated as non-local.
31
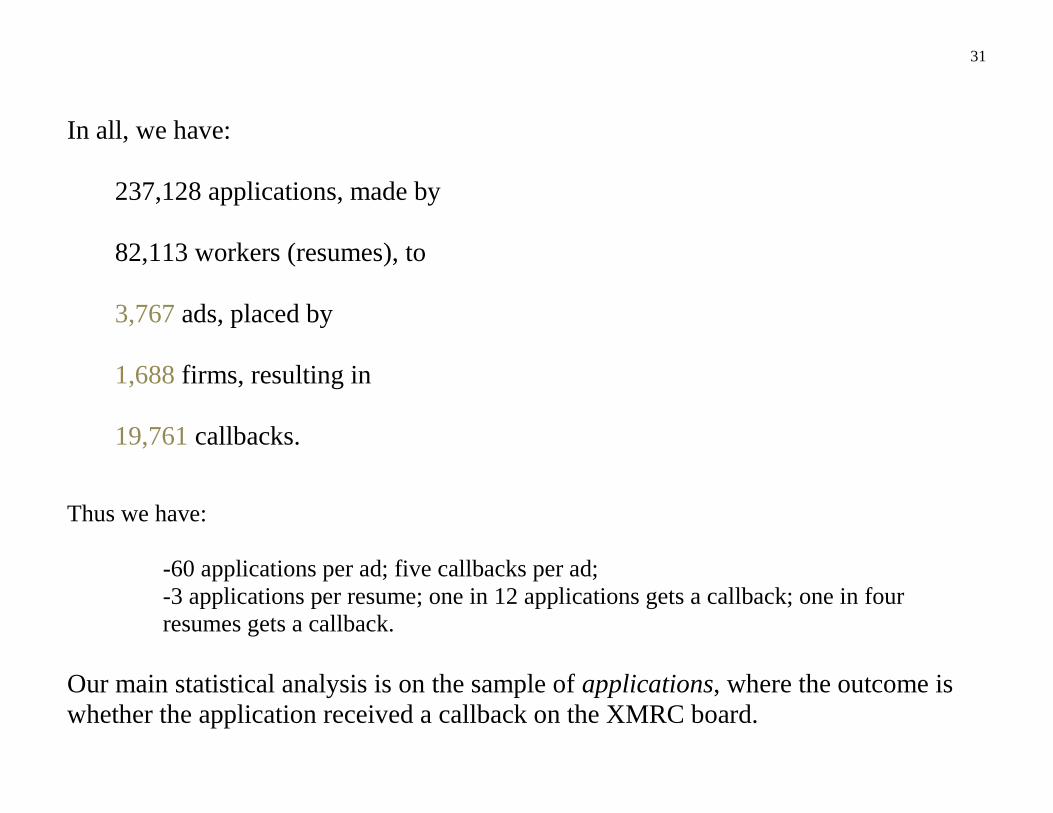
In all, we have:
237,128 applications, made by 82,113 workers (resumes), to 3,767 ads, placed by 1,688 firms, resulting in 19,761 callbacks.
Thus we have:
-60 applications per ad; five callbacks per ad; -3 applications per resume; one in 12 applications gets a callback; one in four resumes gets a callback.
Our main statistical analysis is on the sample of applications, where the outcome is whether the application received a callback on the XMRC board.
32
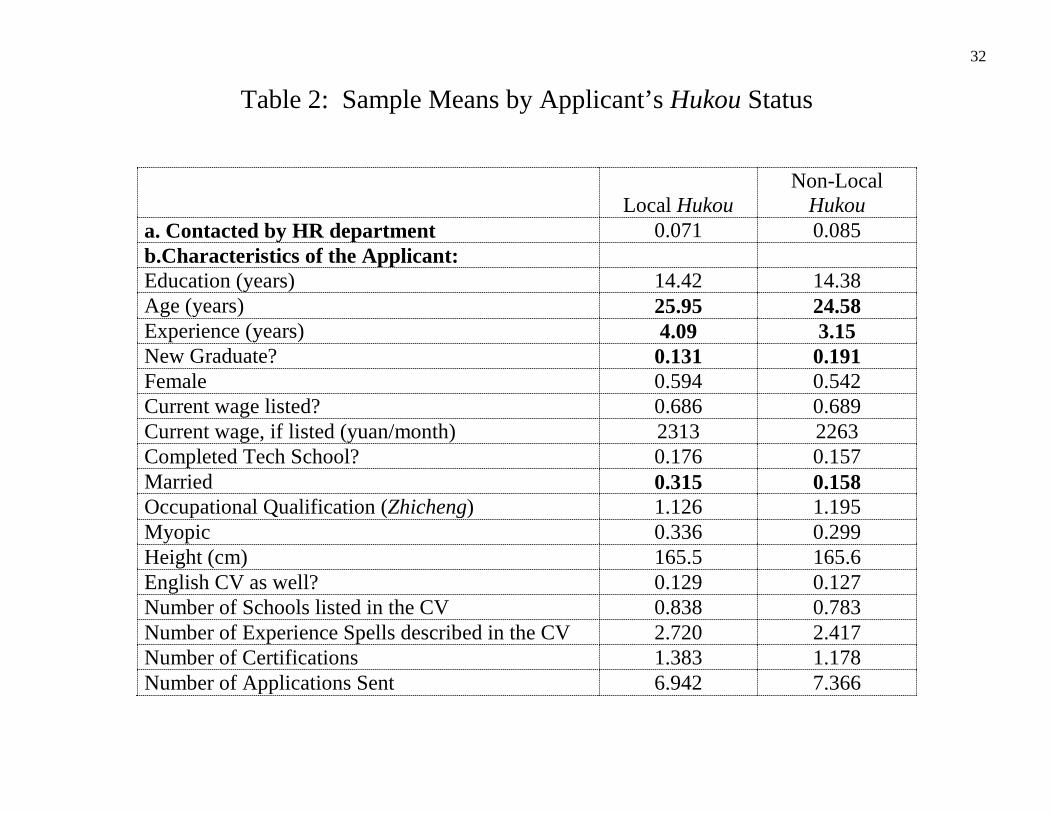
Table 2: Sample Means by Applicant’s Hukou Status
Local Hukou Non-Local
Hukou a. Contacted by HR department 0.071 0.085 b.Characteristics of the Applicant: Education (years) 14.42 14.38 Age (years) 25.95 24.58 Experience (years) 4.09 3.15 New Graduate? 0.131 0.191 Female 0.594 0.542 Current wage listed? 0.686 0.689 Current wage, if listed (yuan/month) 2313 2263 Completed Tech School? 0.176 0.157 Married 0.315 0.158 Occupational Qualification (Zhicheng) 1.126 1.195 Myopic 0.336 0.299 Height (cm) 165.5 165.6 English CV as well? 0.129 0.127 Number of Schools listed in the CV 0.838 0.783 Number of Experience Spells described in the CV 2.720 2.417 Number of Certifications 1.383 1.178 Number of Applications Sent 6.942 7.366

33
LH and NLH job applicants are very similar on observables; if anything NLH applicants have slightly less human capital. Specifically, NLH job applicants are:
-younger -more likely to be looking for their first job -have lower current wages.
The same share of LH and NLH resumes are in English. Overall, there’s no evidence that LH are negatively selected on observables.
34
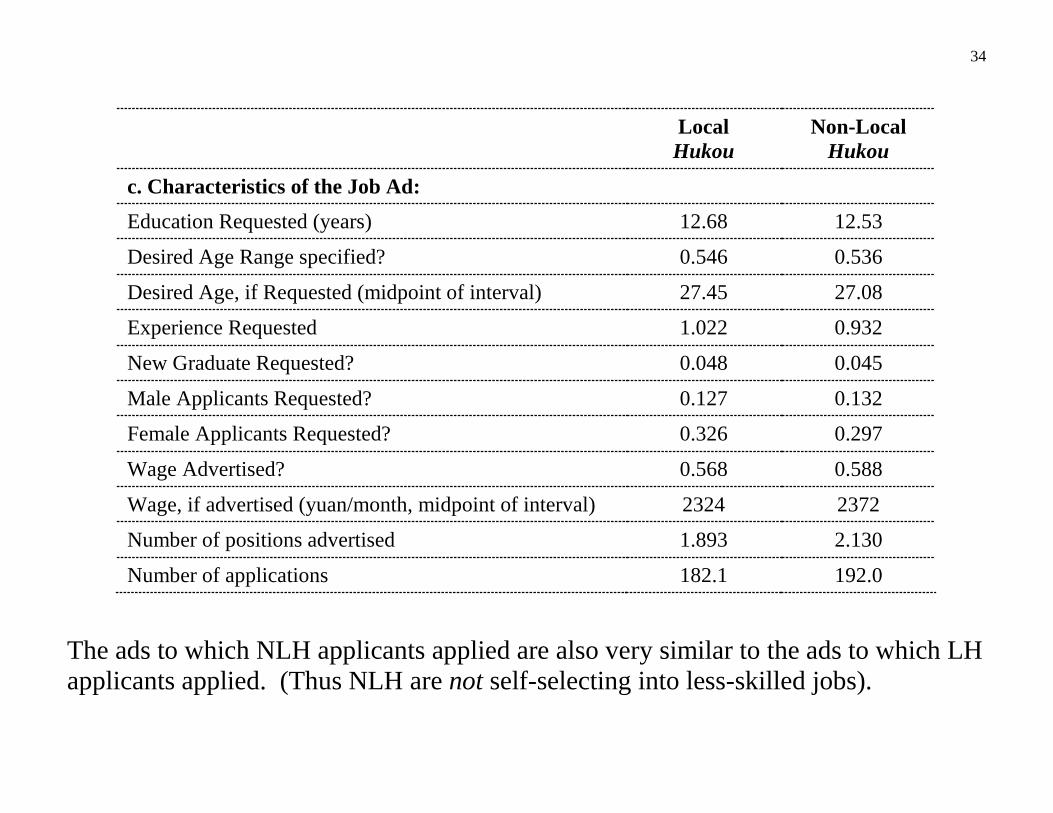
The ads to which NLH applicants applied are also very similar to the ads to which LH applicants applied. (Thus NLH are not self-selecting into less-skilled jobs).
Local Hukou
Non-Local Hukou
c. Characteristics of the Job Ad:
Education Requested (years) 12.68 12.53
Desired Age Range specified? 0.546 0.536
Desired Age, if Requested (midpoint of interval) 27.45 27.08
Experience Requested 1.022 0.932
New Graduate Requested? 0.048 0.045
Male Applicants Requested? 0.127 0.132
Female Applicants Requested? 0.326 0.297
Wage Advertised? 0.568 0.588
Wage, if advertised (yuan/month, midpoint of interval) 2324 2372
Number of positions advertised 1.893 2.130
Number of applications 182.1 192.0
35
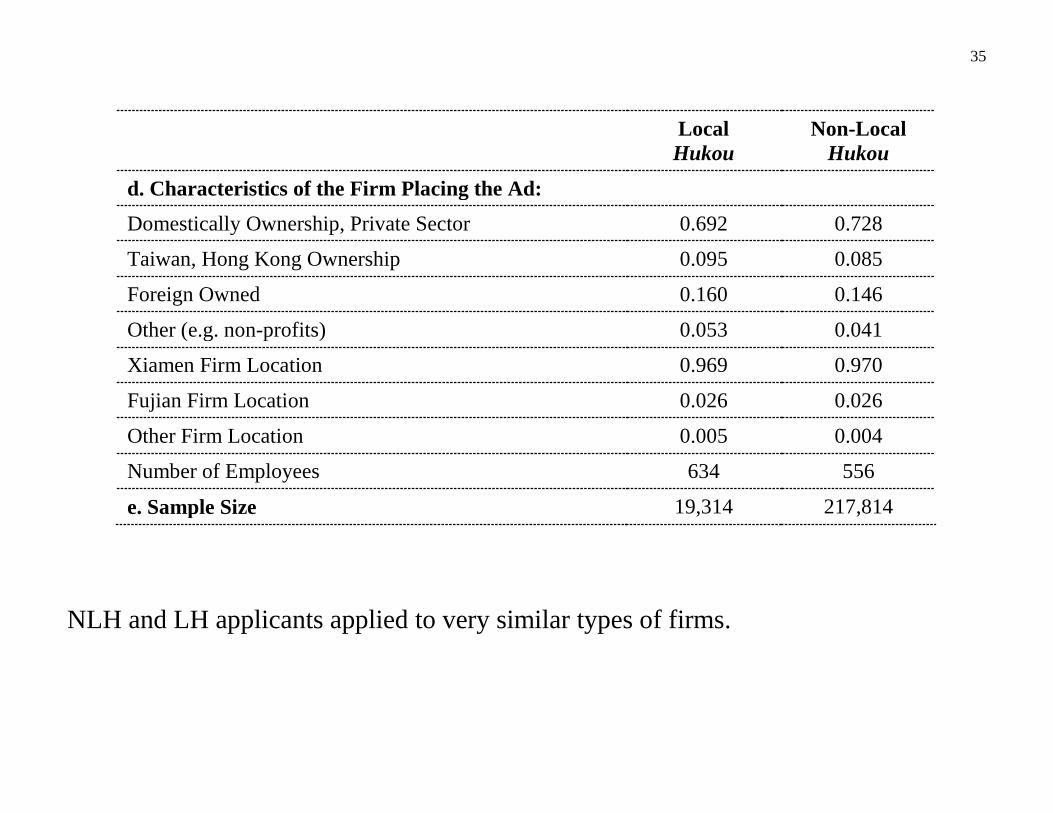
NLH and LH applicants applied to very similar types of firms.
Local Hukou
Non-Local Hukou
d. Characteristics of the Firm Placing the Ad:
Domestically Ownership, Private Sector 0.692 0.728
Taiwan, Hong Kong Ownership 0.095 0.085
Foreign Owned 0.160 0.146
Other (e.g. non-profits) 0.053 0.041
Xiamen Firm Location 0.969 0.970
Fujian Firm Location 0.026 0.026
Other Firm Location 0.005 0.004
Number of Employees 634 556
e. Sample Size 19,314 217,814
36
Note: All the above patterns are very similar in the sample of 82,113 applicants (as opposed to the 237,128 applications). That is because NLH and LH workers submitted roughly the same number of applications during our sample period: 2.9 versus 2.7 respectively. Combining the slightly higher application rate among NLH with the gap in callbacks per application yields mean callback rates per vita of .247 and .194 for NLH and LH respectively.

37
Comparing these numbers to Table 1, how do workers on XMRC compare with the Xiamen labor market?
-XMRC ads are for much younger, better educated workers

38
3. Results
39
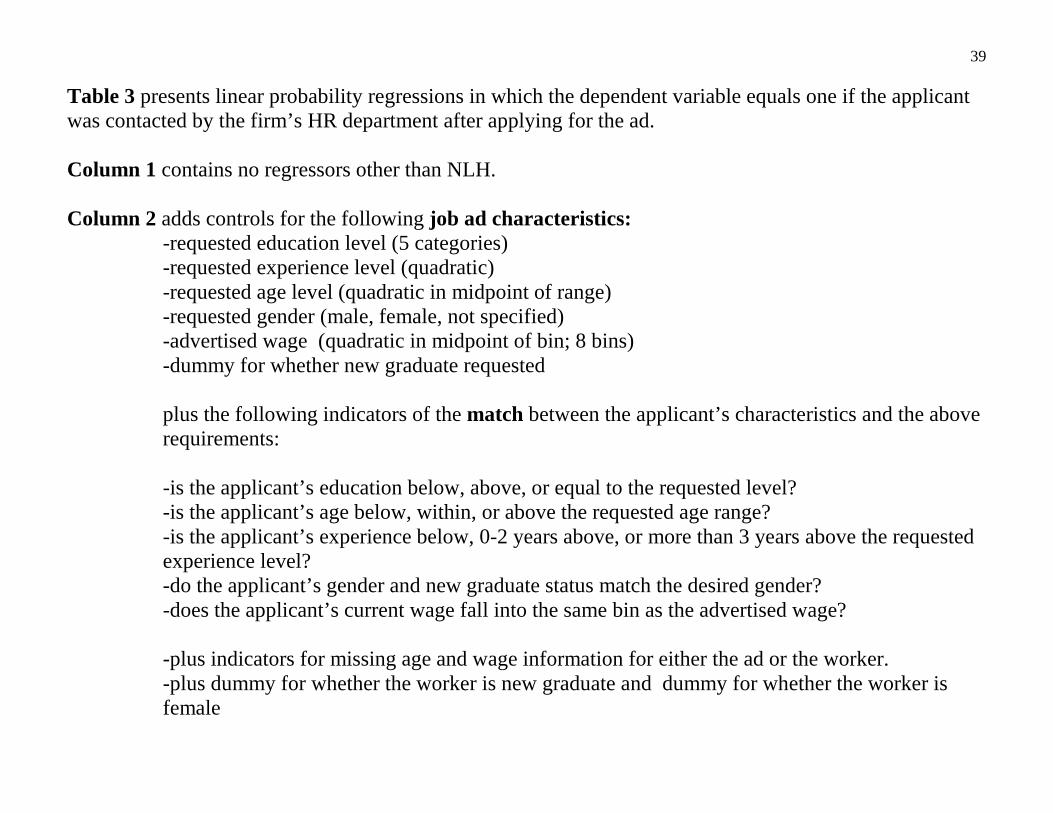
Table 3 presents linear probability regressions in which the dependent variable equals one if the applicant was contacted by the firm’s HR department after applying for the ad. Column 1 contains no regressors other than NLH. Column 2 adds controls for the following job ad characteristics:
-requested education level (5 categories) -requested experience level (quadratic) -requested age level (quadratic in midpoint of range) -requested gender (male, female, not specified) -advertised wage (quadratic in midpoint of bin; 8 bins) -dummy for whether new graduate requested plus the following indicators of the match between the applicant’s characteristics and the above requirements: -is the applicant’s education below, above, or equal to the requested level? -is the applicant’s age below, within, or above the requested age range? -is the applicant’s experience below, 0-2 years above, or more than 3 years above the requested experience level? -do the applicant’s gender and new graduate status match the desired gender? -does the applicant’s current wage fall into the same bin as the advertised wage? -plus indicators for missing age and wage information for either the ad or the worker. -plus dummy for whether the worker is new graduate and dummy for whether the worker is female

40
Column 3 adds controls for the following worker (CV) characteristics (these characteristics are not mentioned in job ads very often):
-attended a technical school? -applicant’s ZhiCheng rank (6 categories) -whether the CV is in English -number of schools attended -number of job experience spells -number of certifications reported -height (interacted with applicant gender) -myopic indicator (interacted with applicant gender) -marital status (interacted with applicant gender)
Column 4 adds occupation fixed effects (for the job; 35 categories). Column 5 adds two indicators of the amount of competition for the job:
-the number of positions advertised (plus dummy for unspecified) -the number of persons who applied to the ad.
Column 6 adds firm fixed effects. Column 7 adds job ad fixed effects, dropping all ad characteristics (including occupation, firm and job competition measures) Note: Sample size drops between columns 3 and 4 because height information is missing for 1.9 percent of the cvs.

41
Table 3: Effects of Non-Local Hukou on the Probability of Employer Contact, Linear Probability Models
(1) (2) (3) (4) (5) (6) (7) Non-Local Hukou (NLH) .0140*** .0125*** .0114*** .0100*** .0117*** .0082*** .0080*** (.0028) (.0026) (.0025) (.0024) (.0023) (.0019) (.0019) Education less than requested -.0067 -.0133** -.0130** -.0122** -.0103*** -.0101*** (.0049) (.0055) (.0052) (.0053) (.0026) (.0025) Education more than requested -.0043 .0016 .0000 -.0005 .0020 .0021 (.0031) (.0038) (.0037) (.0038) (.0017) (.0016) Age less than requested -.0008 -.0025 -.0025 -.0003 -.0096*** -.0120*** (.0058) (.0058) (.0058) (.0052) (.0033) (.0032) Age more than requested -.0292*** -.0270*** -.0255*** -.0157** -.0211*** -.0264*** (.0087) (.0088) (.0084) (.0074) (.0071) (.0076) Experience less than requested -.0067 -.0070 -.0076 -.0103** -.0110*** -.0112*** (.0057) (.0057) (.0054) (.0052) (.0025) (.0025) Experience more than requested .0003 -.0003 -.0007 -.0003 -.0016 -.0015 (.0032) (.0028) (.0027) (.0026) (.0017) (.0016) Wage below advertised .0004 -.0001 -.0009 -.0019 -.0005 .0002 (.0040) (.0040) (.0038) (.0038) (.0023) (.0022) Wage above advertised -.0004 .0001 -.0011 -.0019 -.0074*** -.0084*** (.0039) (.0039) (.0039) (.0042) (.0023) (.0023) Sex differs from requested -.0109** -.0105** -.0085* -.0060 -.0060* -.0051 (.0050) (.0050) (.0047) (.0045) (.0033) (.0031) Number of positions advertised (/100) .5345** .3016 (.2177) (.2015) Number of applicants (/100) -.0134*** -.0088*** (.0027) (.0023) Detailed CV controls No No Yes Yes Yes Yes Yes Occupation Fixed Effects No No No Yes Yes Yes No Firm Fixed Effects No No No No No Yes No Ad Fixed Effects No No No No No No Yes Observations 237,128 237,128 232,600 232,600 232,600 232,600 232,600 R-squared .0002 .0045 .0050 .0172 .0269 .2710 .2955
Standard errors in parentheses, clustered by ad. *** p<0.01, ** p<0.05, * p<0.1 (Clustering by ad and app makes no difference.)
42
In all specifications, NLH workers have a greater chance of receiving an employer contact than LH workers. The fact that this estimate is so similar with and without ad fixed effects means that NLH workers aren’t disproportionately directing their applications to ads where they are more likely to get hired. (Instead, NLH workers apply to the same mix of jobs, but achieve differential success when they get there…)
43
4. Explanations:
Why might employers’ hiring decisions depend
on workers’ hukou?

44
a) Discriminatory Tastes: If anything, there is some distaste in urban China for interacting with non-local workers (Dulleck, Fooken and He 2012).
45
b) Payroll tax differentials: For retirement insurance:
LH workers and their employers contribute 8% and 14% of the worker’s average monthly salary (up to three times the city average: 9114 RMB/month)
NLH workers and their employers each contribute 8 percent of the monthly minimum wage (900 RMB).
For medical insurance:
LH workers and their employers contribute 2% and 7% of average monthly salary
NLH workers and their employers each contribute 2% of the monthly minimum wage
(NLH and LH workers enjoy similar unemployment insurance, worker’s compensation and fertility insurance.)

46
Together, these amount to a substantial payroll tax advantage for NLH workers, especially at higher wage levels:
Total employer plus employee payroll tax rates: Notes: The mean offered and current wages in our data are 2373 and 2267 RMB/month respectively. 98 percent of offered and current wages in our data are between 1000 and 5000 RMB/month.
So, if payroll taxes are the main explanation, NLH workers should become more attractive as skill/pay rises:
Monthly earnings Workers with local hukou
Workers with non-local hukou
NLH rate/ LH rate
1500 .39 .17 .44 2000 .32 .13 .40 3000 .32 .08 .25 4000 .32 .06 .19 5000 .32 .05 .16

47
Table 4: Effects of Non-Local Hukou (NLH) on Contact Rate, by the Job’s Required Education Level:
(1) (2) (3) (4) (5) (6) (7) NLH*Primary .0358*** .0251*** .0240*** .0212*** .0214*** .0114* .0117** (6 years or less) (.0097) (.0077) (.0078) (.0079) (.0079) (.0058) (.0059) NLH*Junior Middle School .0465*** .0352*** .0339*** .0351*** .0365*** .0262** .0216** (9 years) (.0134) (.0118) (.0121) (.0123) (.0123) (.0109) (.0107) NLH*Senior Middle School .0184** .0234*** .0214*** .0164** .0143** .0225*** .0159*** (12 years) (.0077) (.0072) (.0072) (.0073) (.0072) (.0064) (.0058) NLH*Junior Technical School -.0115 -.0087 -.0083 -.0044 .0020 -.0194** -.0105 (15 years) (.0104) (.0104) (.0104) (.0106) (.0104) (.0082) (.0070) NLH*University Degree .0079 .0032 .0024 .0023 .0042 .0057* .0057** (16 years) (.0051) (.0040) (.0040) (.0038) (.0038) (.0029) (.0029) Basic Ad, CV and Match controls -.0032 .0059 .0053 .0035 .0050 .0002 .0025 Detailed CV controls (.0115) (.0093) (.0088) (.0088) (.0087) (.0050) (.0050) Occupation Fixed Effects Yes Yes Yes Yes Yes Firm Fixed Effects Yes Yes Yes Yes Ad Fixed Effects Yes No Observations Yes R-squared 237,128 237,128 232,600 232,600 232,600 232,600 232,600
Standard errors in parentheses, clustered by ad
*** p<0.01, ** p<0.05, * p<0.1 See Table 2 for Regression Specifications.
Note: 85% of the XMRC sample have education of Junior/Technical School and above.
48
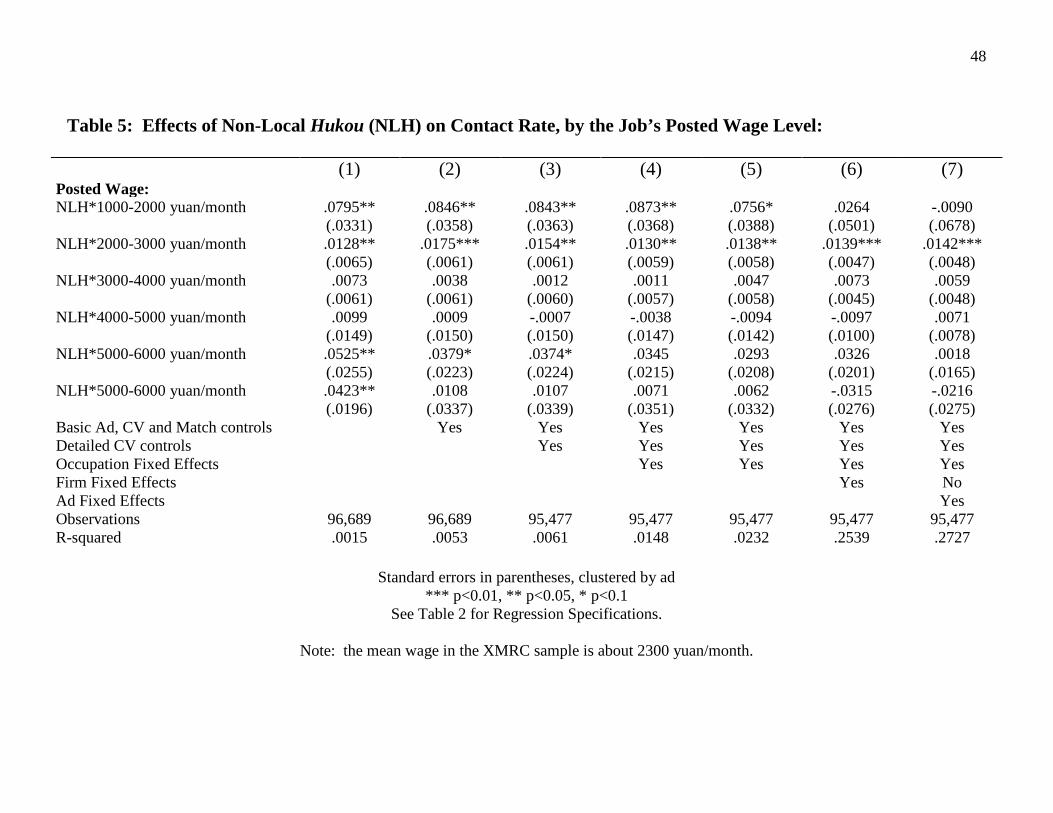
Table 5: Effects of Non-Local Hukou (NLH) on Contact Rate, by the Job’s Posted Wage Level:
(1) (2) (3) (4) (5) (6) (7) Posted Wage: NLH*1000-2000 yuan/month .0795** .0846** .0843** .0873** .0756* .0264 -.0090 (.0331) (.0358) (.0363) (.0368) (.0388) (.0501) (.0678) NLH*2000-3000 yuan/month .0128** .0175*** .0154** .0130** .0138** .0139*** .0142*** (.0065) (.0061) (.0061) (.0059) (.0058) (.0047) (.0048) NLH*3000-4000 yuan/month .0073 .0038 .0012 .0011 .0047 .0073 .0059 (.0061) (.0061) (.0060) (.0057) (.0058) (.0045) (.0048) NLH*4000-5000 yuan/month .0099 .0009 -.0007 -.0038 -.0094 -.0097 .0071 (.0149) (.0150) (.0150) (.0147) (.0142) (.0100) (.0078) NLH*5000-6000 yuan/month .0525** .0379* .0374* .0345 .0293 .0326 .0018 (.0255) (.0223) (.0224) (.0215) (.0208) (.0201) (.0165) NLH*5000-6000 yuan/month .0423** .0108 .0107 .0071 .0062 -.0315 -.0216 (.0196) (.0337) (.0339) (.0351) (.0332) (.0276) (.0275) Basic Ad, CV and Match controls Yes Yes Yes Yes Yes Yes Detailed CV controls Yes Yes Yes Yes Yes Occupation Fixed Effects Yes Yes Yes Yes Firm Fixed Effects Yes No Ad Fixed Effects Yes Observations 96,689 96,689 95,477 95,477 95,477 95,477 95,477 R-squared .0015 .0053 .0061 .0148 .0232 .2539 .2727
Standard errors in parentheses, clustered by ad
*** p<0.01, ** p<0.05, * p<0.1 See Table 2 for Regression Specifications.
Note: the mean wage in the XMRC sample is about 2300 yuan/month.

49
c) Wage differentials: Employers might prefer NLH workers if they can pay them a lower wage. Yes, but between-job wage discrimination (even within firms) is accounted for by the use of job ad fixed effects. Also, all the other estimates control for the level of the advertised wage. But what about within-job (ad) wage discrimination, i.e. paying lower wages to LH than NLH workers hired at the same job?
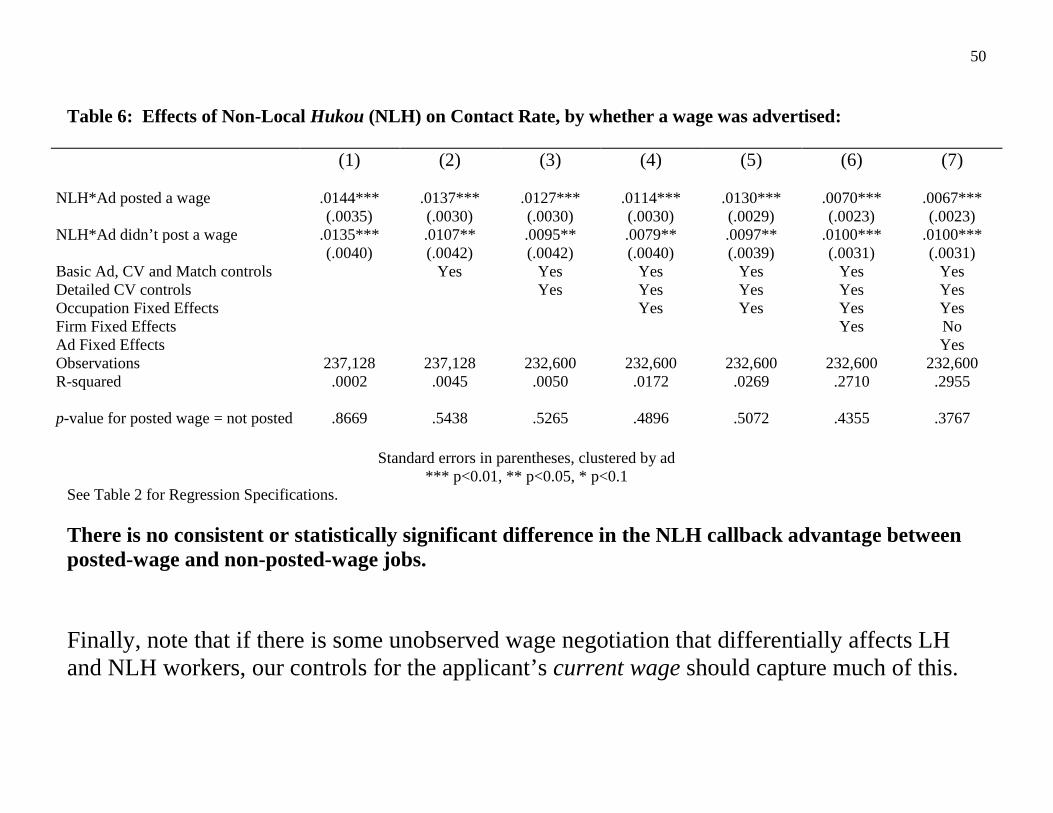
-this should be easier when wages are negotiated individually than when wages are administratively set. Thus it would predict a greater NLH advantage in skilled jobs. -if it’s harder to wage discriminate when wages are posted (btw, ads never post separate LH and NLH wages), we should also see a smaller NLH hiring advantage in jobs with posted wages. Table 6 estimates separate NLH effects for posted-wage and non-posted-wage jobs:
50
Table 6: Effects of Non-Local Hukou (NLH) on Contact Rate, by whether a wage was advertised:
(1) (2) (3) (4) (5) (6) (7) NLH*Ad posted a wage .0144*** .0137*** .0127*** .0114*** .0130*** .0070*** .0067*** (.0035) (.0030) (.0030) (.0030) (.0029) (.0023) (.0023) NLH*Ad didn’t post a wage .0135*** .0107** .0095** .0079** .0097** .0100*** .0100*** (.0040) (.0042) (.0042) (.0040) (.0039) (.0031) (.0031) Basic Ad, CV and Match controls Yes Yes Yes Yes Yes Yes Detailed CV controls Yes Yes Yes Yes Yes Occupation Fixed Effects Yes Yes Yes Yes Firm Fixed Effects Yes No Ad Fixed Effects Yes Observations 237,128 237,128 232,600 232,600 232,600 232,600 232,600 R-squared .0002 .0045 .0050 .0172 .0269 .2710 .2955 p-value for posted wage = not posted .8669 .5438 .5265 .4896 .5072 .4355 .3767
Standard errors in parentheses, clustered by ad
*** p<0.01, ** p<0.05, * p<0.1 See Table 2 for Regression Specifications. There is no consistent or statistically significant difference in the NLH callback advantage between posted-wage and non-posted-wage jobs. Finally, note that if there is some unobserved wage negotiation that differentially affects LH and NLH workers, our controls for the applicant’s current wage should capture much of this.
51
d) Selection on Unobservables: Bearing in mind that the scope for unobservables is limited for callback decisions, could there be: Positive selection of migrants?
While we might expect migrants to be positively selected relative to NLH workers who stay behind (Borjas 1987), there are some problems with a pure migrant selection story: To explain the estimated NLH advantage over LH applicants, positive migrant selection would need to be strong enough to outweigh non-natives’ likely deficits in education quality, connections (guanxi) and other location-specific skills.
Negative selection of LH?
Given that LH workers appear to have privileged access to state-sector jobs, some of it via informal connections, it is possible that those LH workers who engage in formal search for private-sector jobs are negatively selected.
52
While these are possible explanations, note that both selection stories would require:
-selection on unobservables to work in the opposite direction from selection on observables (migrants on XMRC have slightly worse observables). -selection on unobservables would need to be much stronger in jobs with low skill requirements than high requirements
53
e) Hours and Effort choices: Migrants might choose to work harder, due to intertemporal labor supply effects:
-at any given hourly wage, temporary migrants (whose wage is temporarily high relative to their lifetime wage) should choose longer hours (Dustmann 2000) -under incentive pay schemes, migrants should choose to work more intensively.
Firms will prefer workers who make the above choices as long as workers keep less than 100% of the marginal surplus generated.
54
Migrants might choose to work harder, due to efficiency wage effects:
-if migrants’ outside options are worse than natives’, firms can demand more effort. Possible sources of better outside options for LH workers include:
- protected government jobs - more access to the social safety net (Table 1) - self-employment opportunities (especially real estate) - higher wealth (including real estate).
- local networks and location-specific skills (While these may be important options, note however that our own results indicate that
migrants do have an easier time finding other urban private sector jobs…..)

55
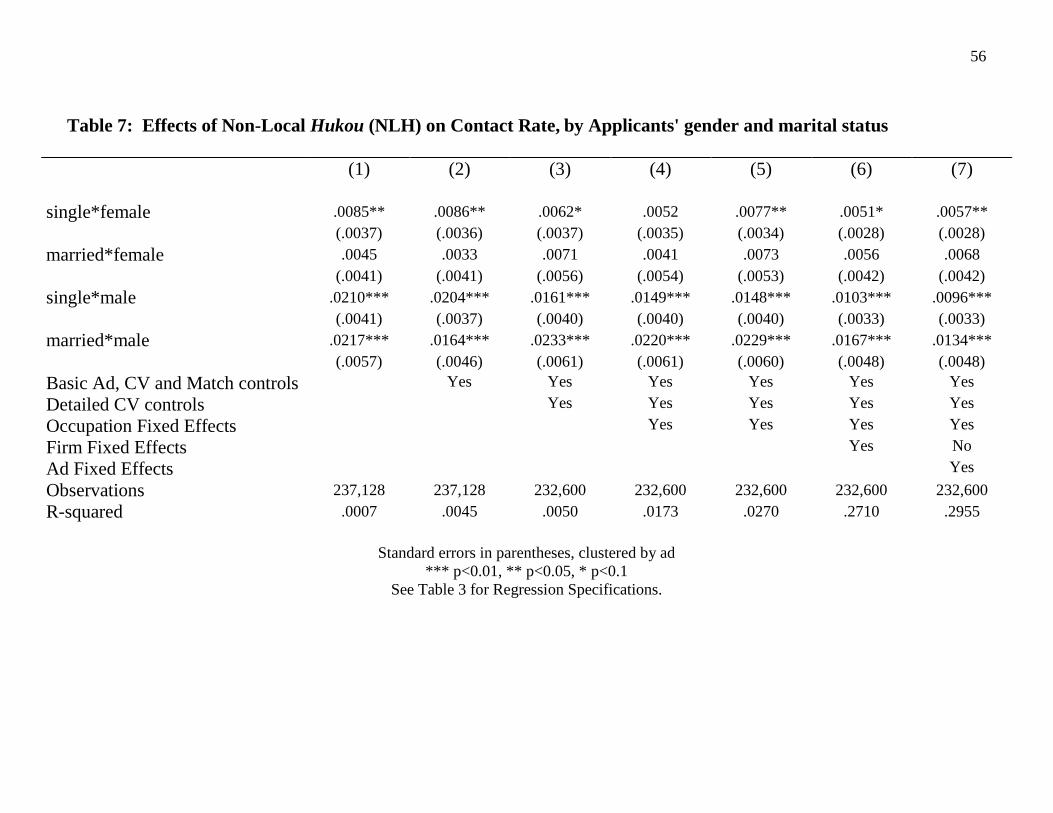
Evidence on hours and effort: 1. If the flexibility to work long, intense hours explains why firms prefer NLH workers, we might expect a smaller NLH advantage among married women than among other groups:
56
Table 7: Effects of Non-Local Hukou (NLH) on Contact Rate, by Applicants' gender and marital status
(1) (2) (3) (4) (5) (6) (7) single*female .0085** .0086** .0062* .0052 .0077** .0051* .0057**
(.0037) (.0036) (.0037) (.0035) (.0034) (.0028) (.0028) married*female .0045 .0033 .0071 .0041 .0073 .0056 .0068
(.0041) (.0041) (.0056) (.0054) (.0053) (.0042) (.0042) single*male .0210*** .0204*** .0161*** .0149*** .0148*** .0103*** .0096***
(.0041) (.0037) (.0040) (.0040) (.0040) (.0033) (.0033) married*male .0217*** .0164*** .0233*** .0220*** .0229*** .0167*** .0134***
(.0057) (.0046) (.0061) (.0061) (.0060) (.0048) (.0048) Basic Ad, CV and Match controls Yes Yes Yes Yes Yes Yes Detailed CV controls Yes Yes Yes Yes Yes Occupation Fixed Effects Yes Yes Yes Yes Firm Fixed Effects Yes No Ad Fixed Effects Yes Observations 237,128 237,128 232,600 232,600 232,600 232,600 232,600 R-squared .0007 .0045 .0050 .0173 .0270 .2710 .2955
Standard errors in parentheses, clustered by ad
*** p<0.01, ** p<0.05, * p<0.1 See Table 3 for Regression Specifications.
57
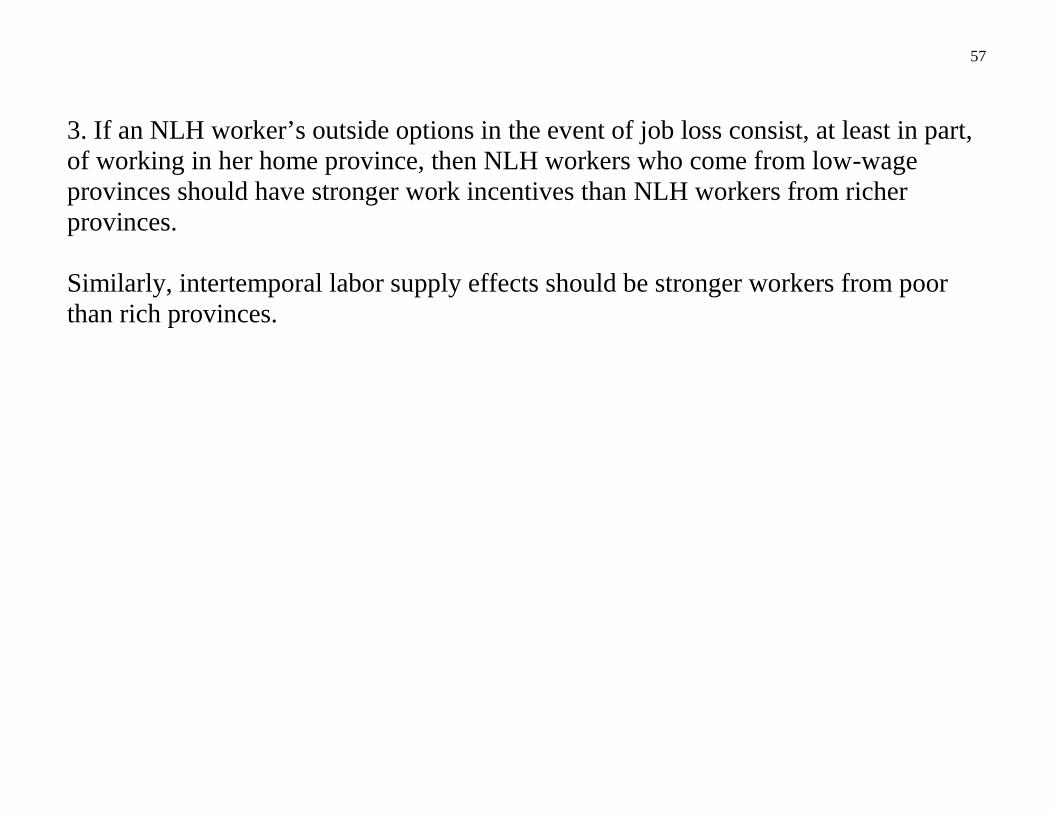
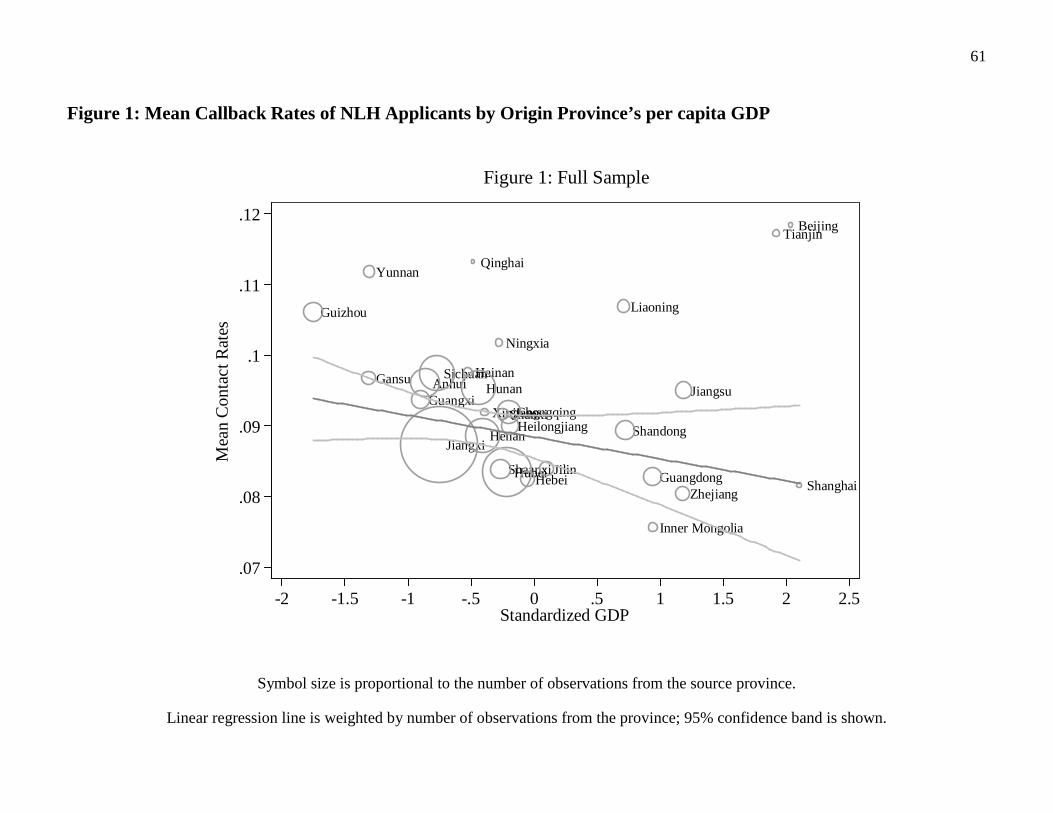
3. If an NLH worker’s outside options in the event of job loss consist, at least in part, of working in her home province, then NLH workers who come from low-wage provinces should have stronger work incentives than NLH workers from richer provinces. Similarly, intertemporal labor supply effects should be stronger workers from poor than rich provinces.
58
Table 8: Effects of Origin Provinces’ GDP on the Probability Employer Contact for Non-Local Hukou (NLH)
Panel A: Full Sample
*** p<0.01, ** p<0.05, * p<0.1. Standard errors in parentheses, clustered by ad.
See Table 3 for regression specifications. Per capita GDP refers to 2008-2010, measured in logs and standardized. Railroad distance is between the capital cities of the origin province and Fujian, taken from Bodvarsson, Hou and Shen (2014). This distance variable is also demeaned so that the mean of the normalized variable equals zero for the non-Fujian provinces.
(1) (2) (3) (4) (5) (6) (7) Non-Local Hukou (NLH) .0123*** .0114*** .0105*** .0094*** .0113*** .0083*** .0082***
(.0028) (.0026) (.0025) (.0024) (.0024) (.0019) (.0019) Other than Fujian Province (OH) .0077*** .0063*** .0049** .0029 .0016 -.0009 -.0014
(.0024) (.0023) (.0023) (.0022) (.0022) (.0018) (.0018) OH*Origin per capita GDP -.0044* -.0023 -.0026 -.0028 -.0030 -.0034* -.0031
(.0025) (.0023) (.0023) (.0023) (.0023) (.0020) (.0020) OH*Log(Railroad Distance) (km) .0051** .0052** .0047** .0031 .0029 .0017 .0014
(.0024) (.0023) (.0023) (.0023) (.0023) (.0019) (.0018) Observations R-squared
237,127 237,127 232,599 232,599 232,599 232,599 232,599 .0003 .0045 .0050 .0172 .0269 .2710 .2955
59
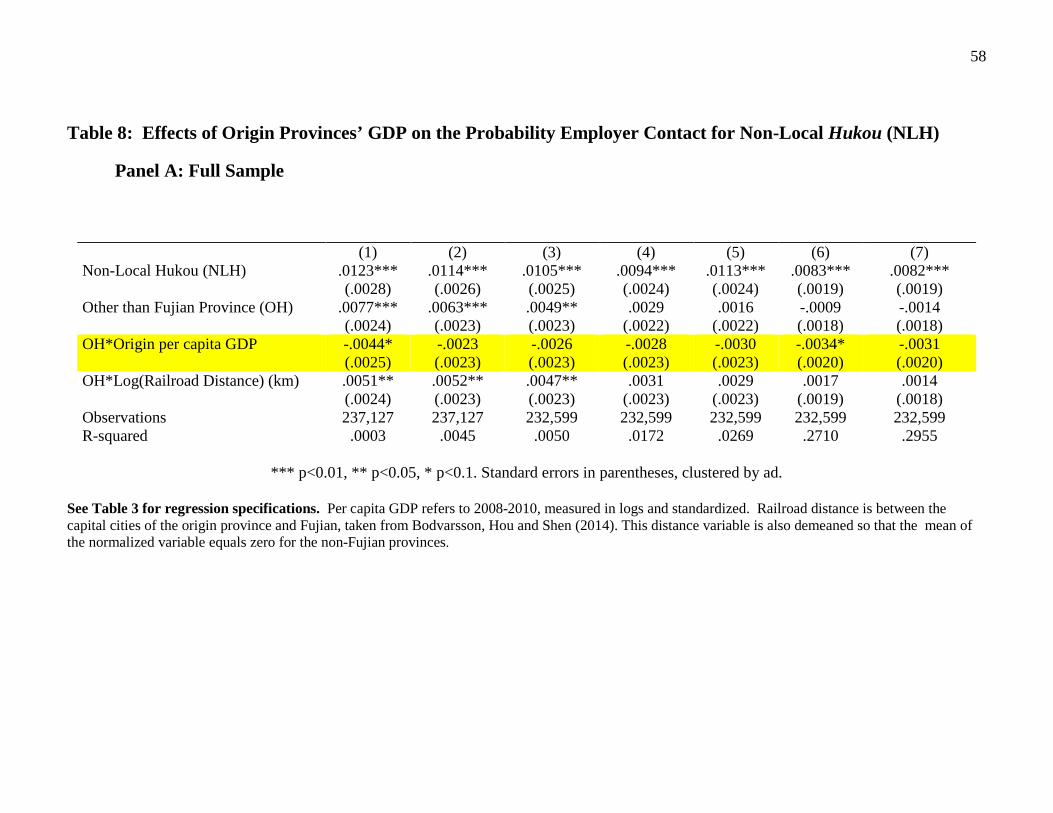
Table 8: Effects of Origin Provinces’ GDP on the Probability Employer Contact for Non-Local Hukou (NLH)
Panel B: Jobs Requiring High School Education or Less
*** p<0.01, ** p<0.05, * p<0.1. Standard errors in parentheses, clustered by ad. See Table 3 for regression specifications. Per capita GDP refers to 2008-2010, measured in logs and standardized. Railroad distance is between the capital cities of the origin province and Fujian, taken from Bodvarsson, Hou and Shen (2014). This distance variable is also demeaned so that the mean of the normalized variable equals zero for the non-Fujian provinces.
(1) (2) (3) (4) (5) (6) (7) Non-Local Hukou (NLH) .0229*** .0222*** .0218*** .0186*** .0192*** .0152*** .0147***
(.0052) (.0050) (.0050) (.0046) (.0045) (.0038) (.0038) Other than Fujian Province (OH) .0056 .0043 .0034 .0024 .0006 -.0007 -.0009 (.0047) (.0045) (.0044) (.0042) (.0043) (.0037) (.0036) OH*Origin per capita GDP -.0084* -.0074 -.0085* -.0080* -.0087** -.0052 -.0045
(.0047) (.0047) (.0046) (.0044) (.0043) (.0038) (.0038) OH*Log(Railroad Distance) (km) .0059 .0061 .0059 .0053 .0052 .0030 .0025
(.0039) (.0039) (.0040) (.0039) (.0039) (.0032) (.0032) Observations R-squared
74,429 74,429 73,344 73,344 73,344 73,344 73,344 .0006 .0073 .0079 .0278 .0374 .2664 .2902
60
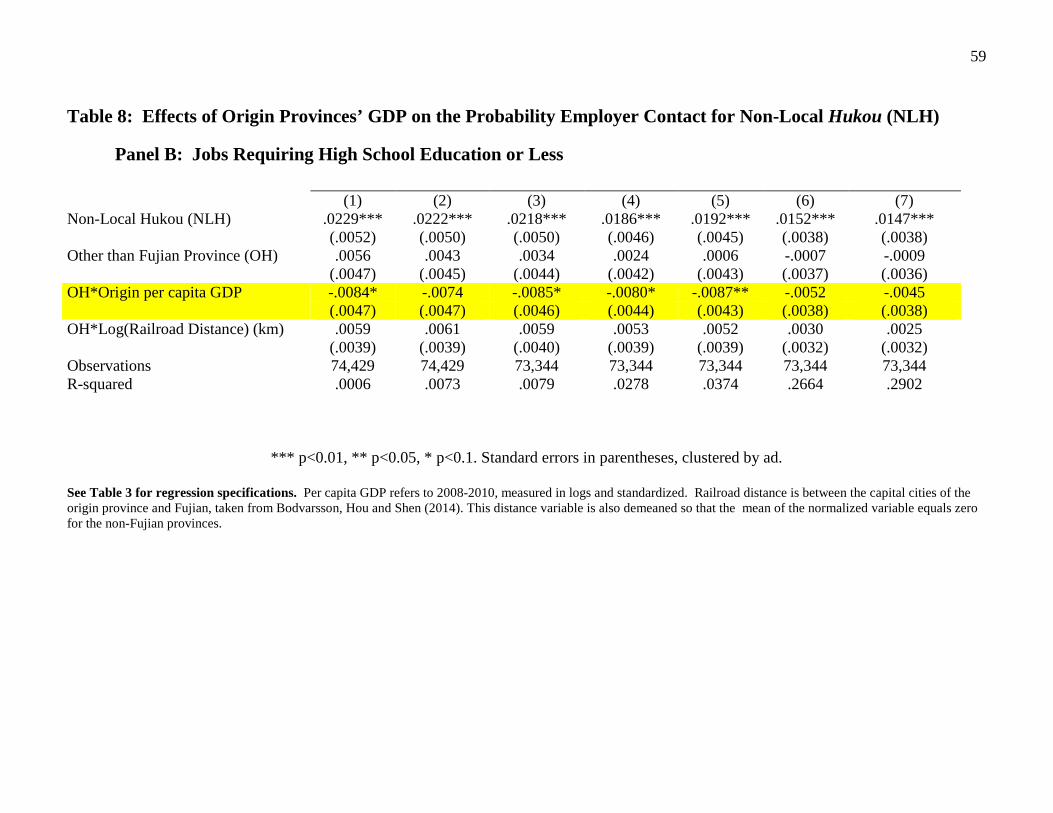
Table 8: Effects of Origin Provinces’ GDP on the Probability Employer Contact for Non-Local Hukou (NLH)
Panel C: Jobs Requiring Tech School Education or More
*** p<0.01, ** p<0.05, * p<0.1. Standard errors in parentheses, clustered by ad. See Table 3 for regression specifications. Per capita GDP refers to 2008-2010, measured in logs and standardized. Railroad distance is between the capital cities of the origin province and Fujian, taken from Bodvarsson, Hou and Shen (2014). This distance variable is also demeaned so that the mean of the normalized variable equals zero for the non-Fujian provinces.
(1) (2) (3) (4) (5) (6) (7) Non-Local Hukou (NLH) .0076** .0068** .0062** .0054* .0075*** .0054** .0057***
(.0033) (.0030) (.0029) (.0028) (.0028) (.0022) (.0022) Other than Fujian Province (OH) .0070** .0066** .0049* .0018 .0009 -.0014 -.0019 (.0028) (.0027) (.0026) (.0025) (.0024) (.0020) (.0020) OH*Origin per capita GDP -.0001 .0001 -.0003 -.0003 -.0004 -.0027 -.0023
(.0027) (.0026) (.0027) (.0026) (.0026) (.0023) (.0023) OH*Log(Railroad Distance) (km) .0041 .0044 .0035 .0008 .0007 .0008 .0006
(.0029) (.0029) (.0029) (.0028) (.0028) (.0023) (.0022) Observations R-squared
162,698 162,698 159,255 159,255 159,255 159,255 159,255 .0002 .0026 .0034 .0203 .0320 .2805 .2972
61
Figure 1: Mean Callback Rates of NLH Applicants by Origin Province’s per capita GDP
Symbol size is proportional to the number of observations from the source province.
Linear regression line is weighted by number of observations from the province; 95% confidence band is shown.
BeijingTianjin
Hebei
Shanxi
Inner Mongolia
Liaoning
Jilin
Heilongjiang
Shanghai
Jiangsu
Zhejiang
Anhui
JiangxiShandongHenan
Hubei
Hunan
Guangdong
Guangxi
Hainan
Chongqing
Sichuan
Guizhou
Yunnan
Shaanxi
Gansu
Qinghai
Ningxia
Xinjiang
.07
.08
.09
.1
.11
.12M
ean
Con
tact
Rat
es
-2 -1.5 -1 -.5 0 .5 1 1.5 2 2.5Standardized GDP
Figure 1: Full Sample

62
5. Discussion
63
We believe that this is the first paper to study employers’ hiring choices between equally-qualified workers with and without permanent residence permits in the region of employment. Despite evidence of taste-based discrimination against NLH persons in urban China (Dulleck, Fooken and He 2012), and Despite the likelihood that NLH workers lack some host-city-specific skills and connections, we find that employers are more likely to call back identically-matched NLH applicants to the same job. This preference is strongest at low skill levels.
64
We do not think this NLH hiring advantage is primarily caused by: -taste-based discrimination (because that should hurt NLH workers)
-migrant-native payroll tax differentials (because the hiring preference disappears at the top of the education and wage distribution, where migrants’ tax advantage is greatest)
-lower wages for migrants, because:
-between-job wage discrimination is ruled out by job fixed effects -within-job wage discrimination is hard to reconcile with the facts that:
- the NLH preference does not differ between posted- and non-posted wage ads - the NLH preference is greater in less-skilled jobs (where individual wage
bargaining is rare). -the NLH preference survives controls for the applicant’s current wage.
65
Selection (into migration among NLH; into private sector search among LH) may play some role, though a selection-based explanation faces some challenges:
-unobserved skills are limited to aspects of the resume that we haven’t been able to completely code.
-selection on unobservables would need to work in the opposite direction as selection on observables.
-selection on unobservables would need to be concentrated at low skill levels
-positive selection of rural out-migrants (relative to stayers in the home region) would need to outweigh migrants’ likely lack of destination-specific skills compared to urban residents, and the lower quality of education in the poorer source regions.

66
This leaves room for explanations in which migrants make labor supply and effort choices in the destination region that make them more desirable to employers. Such choices are predicted by:
-life-cycle labor supply models: work hard while temporarily in a high-wage, high cost-of-living environment
-efficiency-wage models: natives have a number of alternative options that are not available to migrants.
67
Consistent with these interpretations, The NLH callback advantage is, if anything, larger for workers from China’s poorest provinces. Since education quality is likely to be lower in poorer provinces, this seems like strong evidence in favor of an effort/hours hypothesis.
68
We conclude with some anecdotal evidence: From the Strait Daily, March 16, 2010: A rural woman, Lina Chen, worked for 10 years in a Xiamen clothing factory. Saving her money, she was finally able to buy an apartment in Xiamen, thereby qualifying for Xiamen hukou in order to send her daughter to a local school. Sadly, her newly-acquired local hukou made it difficult to find work: “…to Lina’s surprise, even in this era of migrant worker shortage, it is far from easy for workers with local hukou like herself to find a job: from last August till now, she has come across at least 30 factories which expressed a need to recruit workers, but all of them rejected her application once her local hukou status was revealed.” (Zeng 2010)

69
From CNNMoney, February 7, 2013. “I'd rather hire a foreigner - they push themselves more… The mentality is just different. Those who come from overseas have this huge drive to succeed. When you come here, your family expects you to succeed no matter what. You can't come here, the land of opportunity, and fail. They'll think you're crazy.” Ola Ayeni, founder of Eateria

70
References (not in the paper): Bertrand, Marianne, Dolly Chugh, and Sendhil Mullainathan. 2005. “Implicit Discrimination.” American Economic Review, 95(2): 94–98. Brencic, Vera. “Wage Posting: Evidence from Job Ads” Canadian Journal of Economics 45.4 (Nov 2012): 1529-1559. Chen, Zhao; Ming Lu, and Sato Hiroshi. “Who Entered High-Wage Industries? The Role of Social Network, Hukou and Labor
Productivities.” (In Chinese. With English summary.) Jingji Yanjiu/Economic Research Journal, vol. 44, no. 10, October 2009, pp. 121-32.
Fan, Chuncui Velma, Peter V Hall and Geoffrey Wall. “Migration, hukou status, and labor-market segmentation: the case of high-tech development in Dalian” Environment and Planning A 2009, volume 41, pages 1647-1666
Fu, Qiang, and Ren Qiang. “Educational inequality under China's rural-urban divide: the hukou system and return to education” Environment
and Planning A 2010, volume 42, pages 592-610 Gravemeyer, Stefan, Thomas Gries and Jinjun Xue. Income Determination and Income Discrimination in Shenzhen Urban Studies 48(7) 1457–
1475, May 2011 Kroft, Kory, Fabian Lange, and Matthew J. Notowidigdo “Duration Dependence and Labor Market Conditions: Evidence from a Field
Experiment” Quarterly Journal of Economics, 2013, 128(3): 1123-1167. Liu, Zhiqiang. “Institution and inequality: the hukou system in China” Journal of Comparative Economics 33 (2005) 133–157. Meng, Xin and Junsen Zhang. “The Two-Tier Labor Market in Urban China: Occupational Segregation and Wage Differentials between Urban
Residents and Rural Migrants in Shanghai” Journal of Comparative Economics, vol. 29, no. 3, September 2001, pp. 485-504 Neumark, D. (1996). Sex discrimination in restaurant hiring: An audit study. Quarterly Journal of Economics, 111(3), 915-941 Oreopoulos, Philip, “Why Do Skilled Immigrants Struggle in the Labor Market? A Field Experiment with Thirteen Thousand Résumés”
American Economic Journal: Public Policy, Volume 3, November 2011, pp. 148-171 Pagliery, Jose’ “I'd rather hire a foreigner - they 'push themselves more” CNN Money, February 7, 2013.
http://money.cnn.com/2013/02/07/smallbusiness/hire-foreigner/ visited April 16, 2015 Shen, Kailing and Peter Kuhn. "Do Chinese Employers Avoid Hiring Overqualified Workers? Evidence from an Internet Job Board" Research
in Labor Economics 37 (2013): 1-30.
71
Wei, Xiangdong and Ruosi Lu. “Labor Market Segregation and the Wage Differential between Resident and Migrant Workers in China”
Unpublished paper, Lingnan University, August 2007 Xing, Chunbing. “Migration, Self-selection, and Income Distributions: Evidence from Rural and Urban China” Unpublished paper, Beijing
Normal University, 2009 Zeng, Jingen. “It is more difficult to find a job with Xiamen hukou: after 8 years of working, migrant lady found local hukou became a
burden”. Strait Daily, March 16, 2010, p. A06. available at : http://epaper.taihainet .com/html/20100316/hxdb231537.html visited April 16, 2015

72
Notes: -number of ads and firms need to be updated -need to change all regression tables to two-way clustering -need to drop obs with missing height from all tables. -the fact that individual wage bargaining likely does occur at higher skill levels could explain why there’s no hiring disrcimination there. While employers may not always do callbacks via XMRC, I bet that recruiters generally contact all the callbacks for a given job the same way. If that is the case, we should see all the callbacks for the jobs in our sample, because we only include jobs that led to at least one contact via XMRC.