do high returns generated by indian ... - final step marketing
TRANSCRIPT

1 | P a g e
Do high returns generated by Indian Banks actually result in value creation
for stakeholders
A focus on Economic Value Added
2 | P a g e
Abstract
This study is based on Economic Value Added (EVA) and the linkage of shareholder value
enhancement. The research analysis indicates that the positive economic value improves the
shareholder value and negative value decreases it. The assessment of financial analysis and
market analysis improves the value of the company as well as business operation. The risk
analysis such as WACC, Beta, cost of equity (Kce) and cost of debt (Kcd) provides the financial
risk assessment to manage the invested capital of shareholder to decrease the risk level, cost of
capital using and to use the capital for more efficient project with the rationalization. On the
other hand, the market based analysis includes shareholder value, customer value, employee
value, supplier value and societal value explain the non-financial structure to analyse their
importance in the creation of product and services and during the decision making and
implementing of strategy. The value management approach also includes the stakeholder
analysis, value analysis, FAST analysis, risk cost benefit analysis, Pareto analysis and Process
Mapping to address and analyse the value creation management process for shareholders.
Therefore, all those analysis have been provided the quality of product and services that finally
ultimately increase the shareholder value.

3 | P a g e
Table of contents
Abstract ......................................................................................................................................................... 2
Chapter 1 ....................................................................................................................................................... 6
Overview: ...................................................................................................................................................... 6
1.1.1. Introduction to Economic Value Added (EVA) .............................................................. 6
1.1.2. Benefits of EVA System for Banks ................................................................................. 8
1.1.3. Performance Measurement .............................................................................................. 9
1.1.4. Objective of the study .................................................................................................... 11
1.1.5. Research Question ......................................................................................................... 11
1.1.6. Expected Outcome ......................................................................................................... 12
1.1.7. Overview of Banking ..................................................................................................... 12
State Bank of India .............................................................................................................................. 13
Indian Overseas Bank ......................................................................................................................... 14
Bank of Baroda ................................................................................................................................... 14
ICICI Bank .......................................................................................................................................... 14
AXIS Bank .......................................................................................................................................... 16
YES Bank............................................................................................................................................ 16
HDFC Bank ........................................................................................................................................ 17
1.1.8. Application of EVA on Indian Banks ............................................................................ 18
Net Operating Profit after Tax ............................................................................................................ 18
Incremental NOPAT ........................................................................................................................... 19
Invested Capital .................................................................................................................................. 20
Incremental Invested Capital .............................................................................................................. 21
Return on invested capital ................................................................................................................... 22
1.1.9. Risk Analysis of banks .................................................................................................. 23
Beta (β) ............................................................................................................................................... 23
Cost of Equity (Ke) ............................................................................................................................. 24
Cost of Debt (Kd) ................................................................................................................................ 24
Cost of Capital (WACC) ..................................................................................................................... 25
4 | P a g e
1.1.10. Economic Value Added and Indian banks ..................................................................... 26
EVA - as a measure of Value creation through Management of Profits ............................................. 26
EVA - As a measure of value creation through Management of Capital ............................................ 27
Chapter 2 ..................................................................................................................................................... 28
1.1.11. Literature Review .......................................................................................................... 28
Chapter 3 ..................................................................................................................................................... 30
1.1.12. Research Methodology .................................................................................................. 30
Chapter 4 ..................................................................................................................................................... 31
1.1.13. Discussion and Analysis ................................................................................................ 31
Economic Value Added with Marketing Value Management ............................................................ 31
1.1.14. 4.1 Different Types of Value for Business .................................................................... 32
4.1.1 Shareholder Value ...................................................................................................................... 32
4.1.2 Customer Value ......................................................................................................................... 33
4.1.3 Employee Value ......................................................................................................................... 34
4.1.4 Supplier Value ........................................................................................................................... 35
4.1.5 Societal Value ............................................................................................................................ 36
1.1.15. 4.2 Principle of Value Creation ..................................................................................... 37
Define metrics of long-term value creation ........................................................................................ 37
1.1.16. 4.3 Value Management Approach ................................................................................. 38
4.3.1 Stakeholder Analysis.................................................................................................................. 39
4.3.2 Value Analysis ........................................................................................................................... 40
4.3.3 Function Analysis System Technique (FAST) .......................................................................... 41
4.3.4 Risk Analysis ............................................................................................................................. 42
4.3.5 Cost Benefit Analysis................................................................................................................. 45
4.3.6 Pareto Analysis .......................................................................................................................... 46
4.3.7 Process Mapping ........................................................................................................................ 47
1.1.17. 4.4 Customer Value Assessment ................................................................................... 48
1.1.18. 4.6 Application of Value concepts................................................................................. 50
1.1.19. Conclusion and Findings ............................................................................................... 51

5 | P a g e
1.1.20. Key Findings ................................................................................................................. 53
Bibliography .................................................................................................. Error! Bookmark not defined.
6 | P a g e
Chapter 1
Overview:
Introduction to Economic Value Added (EVA)
EVA is the invention of Stern Stewart & Co., a global consulting firm, which launched EVA in
1989. EVA is Economic Value Added is a measure of economic profit. It is calculated as the
difference between the Net Operating Profit after Tax and the opportunity cost of invested
Capital. This opportunity cost is determined by the weighted average cost of Debt and Equity
Capital (“WACC”) and the amount of Capital employed (Worthington and West 2001).
What separates EVA from other performance metrics such as EPS, EBITDA, and ROIC is that it
measures all of the costs of running a business—operating and financing. This makes EVA the
soundest performance metric, and the one most closely aligned with the creation of shareholder
value. In fact, EVA and Net Present Value arithmetically tie, so companies can be assured that
increasing EVA is always a good thing for its investors—certainly not the case with EPS or Free
Cash Flow (Makelainen and Roztocki 1998).
Many researchers even argue that EVA is a better decision tool than NPV because it captures the
period-by-period value creation or When, EVA is greater than zero, value is created during the
period for the bank and if EVA is less than zero, value is destroyed during the period. In order to
create values, ROIC for a bank must be greater than weighted average cost of capital destruction
of a given firm or investment, and makes it easy to audit performance against management
projections. Given the usefulness of the measure, many companies have adopted it as part of a
comprehensive management and incentive system that drives their decision processes.
They strive to increase their EVA by:
Increasing the NOPAT generated by existing Capital
Reducing the WACC
Investing in new projects where the Return exceeds the WACC
Divesting Capital where the Return is below the WACC

7 | P a g e
Such focus on value creation has served the shareholders of these companies well. A bank’s
invested capital multiplied by WACC gives the minimum level of operating profits the bank
should generate to satisfy shareholders. EVA measures how much net operating profit (adjusted
for tax and also called NOPAT) exceeds the capital charge. Mathematically, EVA can be
estimated focusing both on Management of Capital as well as the Management of Profits.
A bank’s present value should equal its invested capital plus the present value of future EVA and
if the bank’s present value is lower, the stock is undervalued and vice versa. Value of a bank’s
share is also said to equal the market value of assets and the sum of EVAs of all future periods
discounted back to the present. A bank once it reaches a period when it no longer earns a return
on its incremental investments greater than its cost of capital, from this period onward no EVA is
added or destroyed from new investments. While competitive forces are likely to drive returns to
WACC for Indian banks, the emergence of indifference vary from bank to bank and is
determined by several factors such as industry structure, a bank’s position in the industry, capital
spending for strategic investments etc. A bank’s invested capital multiplied by WACC gives the
minimum level of operating profits the bank should generate to satisfy shareholders. EVA
measures how much net operating profit (adjusted for tax and also called NOPAT) exceeds the
capital charge.
Mathematically, EVA can be estimated focusing both on Management of Capital as well as the
Management of Profits.
1. EVA - As a measure of Value creation through Management of Profits
2. EVA - As a measure of value creation through Management of Capital
The use of this formula will produce either a positive or negative EVA number. A positive EVA
reflects that the company is increasing its value to its shareholders, whereas a negative EVA
reflects that it is diminishing its value to its shareholders. EVA is based on the principle that
since a company’s management employs equity capital to earn a profit; it must pay for the use of
this equity capital. Including a cost for the use of equity capital sets EVA apart from more
popular measures of bank performance, such as return on assets (ROA), return on equity (ROE)
and the efficiency ratio, which do not consider the cost of equity capital employed. As a result,
these measures may suggest a bank is performing well, when in fact it may be diminishing its
value to its shareholders.

8 | P a g e
Benefits of EVA System for Banks
As banks become ‘capital hungry’ to meet their growth expectations and simultaneously meeting
the regulatory requirements in the Basel-II era, they would have to remain responsive to the
expectations of the market on a risk adjusted basis to ensure continued supply of financial capital
from the shareholders and human capital from the ultimate stakeholders. One of the fundamental
limitations in the existing business growth strategies of Indian banks, especially public sector
banks, is its virtual, if not complete, disconnect with riskiness. ‘Profit rich but Risk poor’
strategies are doomed for failure in the long-run! Finalization of business targets should no
longer remain a mundane ‘volume-mix’ targeting exercise but should built-in inherent risk-return
dimensions. Business strategies that ensure ‘Risk & Return by Choice and not by Chance’ are
keys to ensure continuing success of banks in the emerging market. In order to align the
performance of individual zones/regions/branches to the overall corporate expectations in terms
of EVA, the vocabulary of risk management has to percolate down the hierarchy of banks to the
individual unit level. New performance benchmarks in the form of EVA should naturally form
the unifying cord/link in every bank.
EVA can be an important tool that bankers can use to measure and improve the financial
performance of their bank. Since EVA takes the interest of the bank’s shareholders into
consideration, the use of
EVA by bank management may lead to different decisions than if management relied solely on
other measures. As mentioned earlier an important difference between banks and others is the
role of debt. For other firms debt is a part of the financing operations and interest expenses are
excluded from Net Operating Profit after Taxes (NOPAT) so that returns are unlevered. A bank’s
debt funding is effectively the raw material which is intermediated into higher yielding assets.
Interest expense, on this view, is equivalent of the cost of goods sold. This has an important
consequence. In our analysis NOPAT for each year was therefore arrived at after adding interest
on RBI loans and other loans to Profit before Depreciation and Taxes less Cash Taxes. The
component of cash taxes represented as if banks were debt free. In order to calculate cash taxes,
tax shield on the interest paid on RBI loans and others were added back to Tax Provision and tax
paid on other incomes were deducted from tax provision of the year. A tax rate of 30% per year
was assumed for maintaining consistency over years in our analysis. The economic capital of a
9 | P a g e
bank is defined as the shareholders’ funds plus reserves excluded from equity, such as loan
losses or contingency reserve which in economic terms, function as capital. In this fund total
long term borrowings of the bank are added to arrive at the Invested Capital (IC). In our analysis
we have first attempted to critically evaluate bank’s performance in generating Return on
Invested Capital (ROIC) over years, we have taken two most critical indicators viz. Return on
Invested Capital (ROIC) and Incremental ROIC.
Performance Measurement
Investors measure overall performance of a bank as a whole to decide whether to invest in the
bank or to continue with the bank or to exit from it. In order to achieve goal congruence,
managers’ compensation is often linked with the performance of the responsibility centres and
also with bank-performance. Therefore selection of the right measure is critical to the success of
a bank. To measure performance of a bank we need a simple method for correctly measuring
value created / enhanced by it in a given time frame. In other words, each method takes into
consideration the degree of complexities in quantifying the underlying measure. The more
complex is the process, the more is the level of subjectivity and cost in measuring the
performance of the bank.
There is a continuous endeavour to develop a single measure that captures the overall
performance, yet it is easy to calculate. Each metric of performance claims its superiority over
others. Performance of a bank is usually measured with reference to its past record and the
performance of other banks with comparable risk profile. The various performance metrics
currently in use are based on the returns on investment generated by the business entity.
Therefore to reach a meaningful conclusion, returns generated by the bank in a particular year
should be compared with returns generated by assets with similar risk profile (cross sectional
analysis). Similarly return on investment for the current period should be compared with returns
generated in past (time series analysis). A bank creates value only if it is able to generate return
higher than its cost of capital. Cost of capital is the weighted average cost of equity and debt
(WACC).
The performance of a bank gets reflected on its valuation by the capital market. Market valuation
reflects investor’s perception about the current performance of the bank and also their
10 | P a g e
expectation on its future performance. They build their expectations on the estimated growth of
the bank in terms of return on capital. This results in incongruence between current performance
and the value of the bank. Even if the current performance is better in relative terms, poor growth
prospects adversely affects the value of the bank. Therefore any metric of performance, to be
effective, should be able to not only capture the current performance but also should be able to
incorporate the direction and magnitude of future growth. Therefore the robustness of a measure
is borne out by the degree of correlation the particular metric has with respect to the market
valuation.
Metrics of performance have a very important and critical role not only in evaluating the current
performance of a bank but also in achieving high performance and growth in the future. The
metrics of performance have a variety of users, which include all the stakeholders whose
wellbeing depends on the continued wellbeing of the bank. Principal stakeholders are the equity
holders, debt holders, management, and suppliers of material and services, employees and the
end-users of the products and services. Value creation and maximization depends on the
alignment of the various conflicting interests of these stakeholders towards a common goal. This
means maximization of the bank value without jeopardizing the interests of any of the
stakeholders. Any metric, which measures the bank value without being biased towards any of
the stakeholders or particular class of participants, can be hailed as the true metric of
performance.
However it is difficult to develop such a metric. Most of the conventional performance measures
directly relate to the current net income of a business entity with equity, total assets, net sales or
similar surrogates of inputs or outputs. Examples of such measures are return on equity (ROE),
return on assets (ROA) and operating profit margin. Each of these indices measure a different
aspect of performance, ROE measures the performance from the perspective of the equity
holders, ROA measures the asset productivity and operating profit margin reflects the margin
realized by the bank at the market place. The net income figure in itself is dependent on the
operational efficiency, financial leverage and the ability of the entity to formulate right strategy
to earn adequate margin in the market place.
It is important to note that none of these measures truly reflect the complete picture by
themselves but have to be seen in conjunction with other metrics. These measures are also

11 | P a g e
plagued by the bank level inconsistencies in the accounting figures as well as the inconsistencies
in the valuation methods used by accountants in measuring assets, liabilities and income of the
bank. Accounting valuation methods are in variance with the methods that are being used to
value individual projects and banks. The value of an asset or a bank, which is a collection of
assets, is computed by discounting future stream of cash flows. The net present value (NPV) is
the surplus that the investment is expected to generate over the cost of capital. Measures of
periodical performance of a bank, which is the collection of assets in place, should follow the
same underlying principles. Economic value added (EVA) is a measure that captures the
valuation principles.
Objective of the study
When the world was facing the Economic Crisis of 2008, when the giants of financial markets
like Lehman Brothers, Citibank, etc. were reeling on their knees, and demanding re-
capitalization from the federal government, amidst all this chaos, the Indian Banks were
unperturbed and faced the economic storm without much sweat.
Now, that the economic scenario is turning green again, and massive amounts of FDI are going
into BRICS countries. With a lot of this FDI from West ending up in the financial institutes of
India, it would be wise to wonder whether these banks are actually creating any stakeholder
value or all of this is just one big phony ride which the world capital is riding on.
Due to my profound interest in the Value management and banking industry, in particular,
maximizing value creation for the stakeholders of a company, I will focus on how the big Indian
Banks are performing on the parameter of value creation for stakeholders. Specifically, I am
going to put an emphasis on the bank’s Economic Value Added (EVA), interpreting it and using
it to understand how it can be improvised upon. Based on this, I came up with the following
research question:
Research Question
The research question of the given study is based on “how does value management in marketing
aid in increasing productivity, profitability and eventually value for all the stakeholders
associated with a business or organization?” It is vital to have information about to the way to

12 | P a g e
increase the value and wealth of the shareholder to remain in the industry. This study will
describe the marketing and finance methods to use in the banking sector and to build long term
relationship with customer in order to enhance the market share and profitability.
Expected Outcome
Though India along with China is portrayed as investment darlings of the world, still their
regulatory norms are still not regularly enforced. India is yet to implement Basel III norms into
their banking system, reason for delay, widely believed, is incompatibility of the banks to
enforce such strict capital and other requirements into their system.
This goes on to show that the Indian Banks and corresponding Indian economy are weak within.
Said that, the growth rates that the country is generating are stratospheric and the rapid
development path is also quite palpable.
With one of the highest deposit rates offered to the customers, mandatory Priority sector lending
(40% loans to depressed classes, minorities, and women) is also a big anchor on their balance
sheets, whose payback is often not guaranteed. As a result, I personally believe that though on
path of growth, the value created for the stakeholders will not be so great.
Overview of Banking
The major participants of the Indian financial system are the commercial banks, the financial
institutions (FIs), encompassing term-lending institutions, investment institutions, specialized
financial institutions and the state-level development banks, Non-Bank Financial Companies
(NBFCs) and other market intermediaries such as the stock brokers and money-lenders. The
commercial banks and certain variants of NBFCs are among the oldest of the market
participants. The FIs, on the other hand, are relatively new entities in the financial market place.
Bank of Hindustan, set up in 1870, was the earliest Indian Bank. Banking in India on modern
lines started with the establishment of three presidency banks under Presidency Bank's act 1876
i.e. Bank of Calcutta, Bank of Bombay and Bank of Madras. In 1921, all presidency banks were
amalgamated to form the Imperial Bank of India. Imperial bank carried out limited central
banking functions also prior to establishment of RBI. It engaged in all types of commercial
banking business except dealing in foreign exchange. Reserve Bank of India Act was passed in

13 | P a g e
1934 and Reserve Bank of India (RBI) was constituted as an apex bank without major
government ownership. Banking Regulations Act was passed in 1949. This regulation brought
Reserve Bank of India under government control. Under the act, RBI got wide ranging powers
for supervision & control of banks. The Act also vested licensing powers & the authority to
conduct inspections in RBI. In 1955, RBI acquired control of the Imperial Bank of India, which
was renamed as State Bank of India. In 1959, SBI took over control of eight private banks
floated in the erstwhile princely states, making them as its 100% subsidiaries.
RBI was empowered in 1960, to force compulsory merger of weak banks with the strong ones.
The total number of banks was thus reduced from 566 in 1951 to 85 in 1969. In July 1969,
government nationalized 14 banks having deposits of Rs.50 crores& above. In 1980, government
acquired 6 more banks with deposits of more than Rs.200 crores.
Nationalization of banks was to make them play the role of catalytic agents for economic growth.
The Narsimham Committee report suggested wide ranging reforms for the banking sector in
1992 to introduce internationally accepted banking practices.
State Bank of India
State Bank of India (SBI) is a multinational banking and financial services company based in
India. It is biggest bank in India in terms of assets. It is a government-owned corporation with its
headquarters in Mumbai, Maharashtra. As of December 2013, it had assets of US$388 billion
and 17,000 branches, including 190 foreign offices, making it the largest banking and financial
services company in India by assets. State Bank of India is one of the Big Four banks of India,
along with ICICI Bank, Punjab National Bank and HDFC Bank.
The bank traces its ancestry to British India, through the Imperial Bank of India, to the founding
in 1806 of the Bank of Calcutta, making it the oldest commercial bank in the Indian
Subcontinent. Bank of Madras merged into the other two presidency banks - Bank of Calcutta
and Bank of Bombay - to form the Imperial Bank of India, which in turn became the State Bank
of India. Government of India owned the Imperial Bank of India in 1955, with Reserve Bank of
India taking a 60% stake, and renamed it the State Bank of India. In 2008, the government took
over the stake held by the Reserve Bank of India.
14 | P a g e
Indian Overseas Bank
Indian Overseas Bank is a major bank based in Chennai, with about 3350 domestic branches, 3
extension counters and six branches overseas as of 31 March 2012. Indian Overseas Bank has an
ISO certified in-house Information Technology department, which has developed the software
that 3257 branches use to provide online banking to customers; the bank has achieved 100%
networking status as well as 100% CBS status for its 3350 branches. The bank's business more
than doubled in the last four years.
The net profit for the year ended 31 March 2012 stood at Rs 10501 million. Total income stood
at Rs 195781 million as against Rs 133265.6 million registered during the same period last
financial year. For the full year, the total business grew by 24 per cent to Rs 3,217 billion from
Rs 2,590 billion.IOB has planned to achieve total business of Rs 3.85 trillion to Rs 4 trillion this
fiscal.
Bank of Baroda
Bank of Baroda is an Indian state-owned banking and financial services company headquartered
in Vadodara (earlier known as Baroda) in Gujarat, India. It is the second-largest bank in India,
after State Bank of India, and offers a range of banking products and financial services to
corporate and retail customers through its branches and through its specialized subsidiaries and
affiliates. During FY 2012-13, its total business was INR 8,021 billion. In addition to its
headquarters in its home state of Gujarat, it has a corporate headquarters in the BandraKurla
Complex in Mumbai.
Based on 2012 data, it is ranked 715 on Forbes Global 2000 list. BoB has total assets in excess of
INR 3.58 trillion (short scale), INR 3,583 billion (long scale). The bank, along with 13 other
major commercial banks of India, was nationalized on 19 July 1969, by the Government of India
and has been designated as a profit-making public sector undertaking (PSU).Bank of Baroda is
one of the Big Four banks of India, along with State Bank of India, ICICI Bank and Punjab
National Bank.
ICICI Bank
ICICI Bank is an Indian multinational banking and financial services company headquartered in
Mumbai. It is the second largest bank in India by assets and by market capitalization, as of 2014.

15 | P a g e
It offers a wide range of banking products and financial services to corporate and retail
customers through a variety of delivery channels and through its specialized subsidiaries in the
areas of investment banking, life, non-life insurance, venture capital and asset management. The
Bank has a network of 3,539 branches in India, and has a presence in 19 countries.
ICICI Bank is one of the Big Four banks of India, along with State Bank of India, Punjab
National Bank and Bank of Baroda. The bank has subsidiaries in the United Kingdom, Russia,
and Canada; branches in United States, Singapore, Bahrain, Hong Kong, Sri Lanka, Qatar and
Dubai International Finance Centre; and representative offices in United Arab Emirates, China,
South Africa, Bangladesh, Thailand, Malaysia and Indonesia. The company's UK subsidiary has
also established branches in Belgium and Germany.
ICICI Bank was established by the Industrial Credit and Investment Corporation of India
(ICICI), an Indian financial institution, as a wholly owned subsidiary in 1955. The parent
company was formed in 1955 as a joint-venture of the World Bank, India's public-sector banks
and public-sector insurance companies to provide project financing to Indian industry. The bank
was initially known as the Industrial Credit and Investment Corporation of India Bank, before it
changed its name to the abbreviated ICICI Bank.
ICICI's shareholding in ICICI Bank was reduced to 46 percent, through a public offering of
shares in India in 1998, followed by an equity offering in the form of American Depositary
Receipts on the NYSE in 2000. ICICI Bank acquired the Bank of Madura Limited in an all-stock
deal in 2001 and sold additional stakes to institutional investors during 2001-02.
In the 1990s, ICICI transformed its business from a development financial institution offering
only project finance to a diversified financial services group, offering a wide variety of products
and services, both directly and through a number of subsidiaries and affiliates like ICICI Bank.
In 1999, ICICI become the first Indian company and the first bank or financial institution from
non-Japan Asia to be listed on the NYSE.
In 2000, ICICI Bank became the first Indian bank to list on the New York Stock Exchange with
its five million American depository shares issue generating a demand book 13 times the offer
size. In October 2001, the Boards of Directors of ICICI and ICICI Bank approved the merger of
ICICI and two of its wholly owned retail finance subsidiaries, ICICI Personal Financial Services
Limited and ICICI Capital Services Limited, with ICICI Bank. The merger was approved by

16 | P a g e
shareholders of ICICI and ICICI Bank in January 2002, by the High Court of Gujarat at
Ahmadabad in March 2002 and by the High Court of Judicature at Mumbai and the Reserve
Bank of India in April 2002.
AXIS Bank
Axis Bank is the third largest private sector bank in India. Axis Bank offers the entire spectrum
of financial services to customer segments covering Large and Mid-Corporate, MSME,
Agriculture and Retail Businesses.
The Bank has a large footprint of 2402 domestic branches (including extension counters) and
12,922 ATMs spread across the country as on 31st March 2014. The overseas operations of the
Bank are spread over its seven international offices with branches at Singapore, Hong Kong,
DIFC (Dubai International Financial Centre), Colombo and Shanghai and representative offices
at Dubai and Abu Dhabi. During the year, the Bank has upgraded its representative office in
Shanghai, China to a branch to become the first Indian private sector bank to set up a branch in
China. During the year, the Bank’s overseas subsidiary namely Axis Bank UK Ltd. commenced
banking operations.
Axis Bank is one of the first new generation private sector banks to have begun operations in
1994. The Bank was promoted in 1993, jointly by Specified Undertaking of Unit Trust of India
(SUUTI) (then known as Unit Trust of India),Life Insurance Corporation of India (LIC), General
Insurance Corporation of India (GIC), National Insurance Company Ltd., The New India
Assurance Company Ltd., The Oriental Insurance Company Ltd. and United India Insurance
Company Ltd. The shareholding of Unit Trust of India was subsequently transferred to SUUTI,
an entity established in 2003.
With a balance sheet size of Rs.383,245 crores as on 31st March 2014, Axis Bank has achieved
consistent growth and stable asset quality with a 5 year CAGR (2010-14) of 21% in Total Assets,
19% in Total Deposits, 23% in Total Advances and 28% in Net Profit.
YES Bank
YES BANK is a private bank in India with headquarters in Mumbai. It was founded in 2004 by
promoters Ashok Kapur and RanaKapoor, which had a collective shareholding of 29%. [5]
Ashok Kapoor was killed in a terrorist attack in 2008 in Mumbai.
17 | P a g e
In 2010, the bank announced the roll-out of a strategic blueprint, named Version 2.0 of the bank,
to further accelerate its business growth in the retail banking space, with the objective to achieve
by 2015, a balance sheet size of INR 1,500 billion, deposits of INR 1,250 billion, advances of
INR 1,000 billion, a pan India network of 900 branches and a human capital base of 12,750 by
2015. YES BANK is a major competitor in the business banking sector of the Indian economy,
especially amongst smaller- and medium-sized clients. Business banking is centered primarily on
Cash Handling, Payment, Direct Banking, Liabilities and Investment, and Trade services. Retail
Banking is the general branch of banking, targeted at private individuals. Customers are
currently being handled by a branch network, composed of over 550+ branches across the
country. YES Bank's equity shares are listed on Bombay Stock Exchange and the National Stock
Exchange of India.
HDFC Bank
The Housing Development Finance Corporation Limited (HDFC) was amongst the first to
receive an 'in principle' approval from the Reserve Bank of India (RBI) to set up a bank in the
private sector, as part of the RBI's liberalization of the Indian Banking Industry in 1994. The
bank was incorporated in August 1994 in the name of 'HDFC Bank Limited', with its registered
office in Mumbai, India. HDFC Bank commenced operations as a Scheduled Commercial Bank
in January 1995. HDFC Bank Ltd. is a commercial bank of India, incorporated in August 1994,
after the Reserve Bank of India allowed establishing private sector banks.
The Bank was promoted by the Housing Development Finance Corporation, a premier housing
finance company (set up in 1977) of India. HDFC Bank has 1,500 branches and over 2,890
ATMs, in 530 cities in India, and all branches of the bank are linked on an online real-time basis.
As of September 30, 2008 the bank had total assets of INR 1006.82 billion.
In 2008 HDFC Bank acquired Centurion Bank of Punjab taking its total branches to more than
1,000. Though, the official license was given to Centurion Bank of Punjab branches, to continue
working as HDFC Bank branches, on May 23, 2008 The financial performance during the fiscal
year 2007-08 remained healthy with total net revenues (net interest income plus other income)
increasing by 50.7% to Rs. 7,511.0 crores from Rs.4,984.7 crores in 2006- 07.
18 | P a g e
The revenue growth was driven principally by an increase in net interest income. Net interest
income grew by 50.7% primarily due to increase in the average Balance sheet size by 39.8% and
an increase in net interest margin from 4.0% to around 4.4%. The key driver in volumes was
growth in advances. Margin expansion was contributed by increase in yields across all products
partially offset by increase in time deposit costs.
Application of EVA on Indian Banks
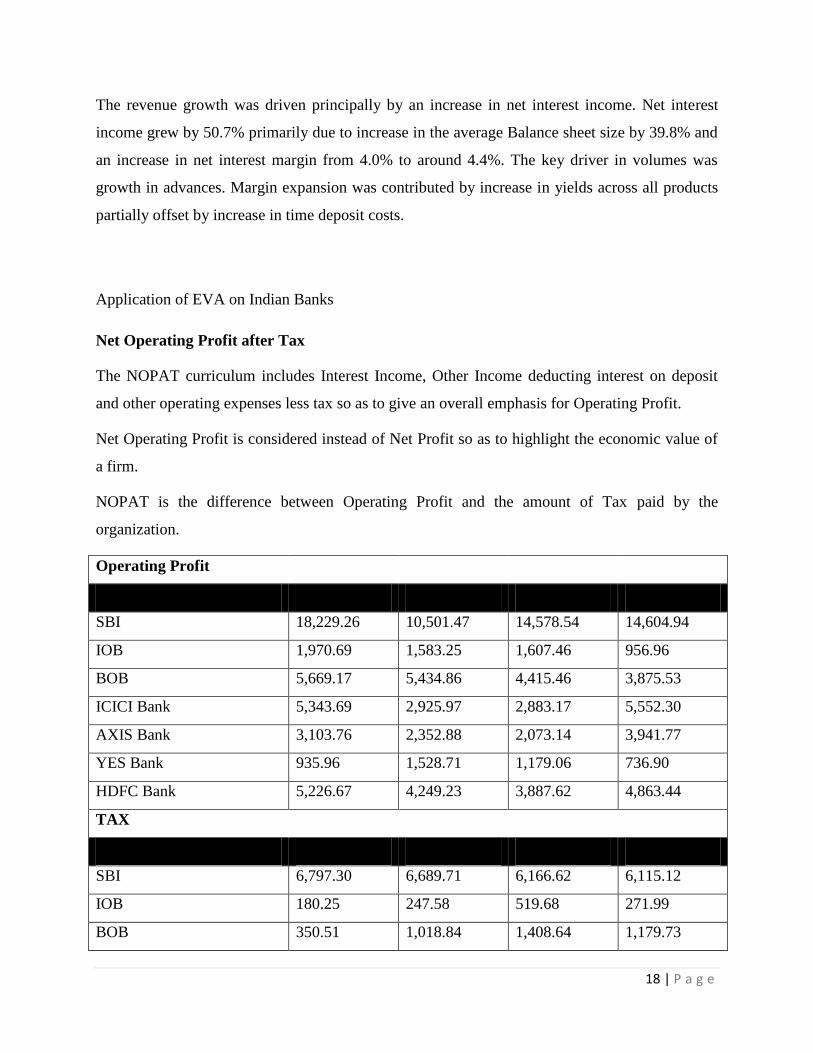
Net Operating Profit after Tax
The NOPAT curriculum includes Interest Income, Other Income deducting interest on deposit
and other operating expenses less tax so as to give an overall emphasis for Operating Profit.
Net Operating Profit is considered instead of Net Profit so as to highlight the economic value of
a firm.
NOPAT is the difference between Operating Profit and the amount of Tax paid by the
organization.
Operating Profit
Bank FY13 FY12 FY11 FY10
SBI 18,229.26 10,501.47 14,578.54 14,604.94
IOB 1,970.69 1,583.25 1,607.46 956.96
BOB 5,669.17 5,434.86 4,415.46 3,875.53
ICICI Bank 5,343.69 2,925.97 2,883.17 5,552.30
AXIS Bank 3,103.76 2,352.88 2,073.14 3,941.77
YES Bank 935.96 1,528.71 1,179.06 736.90
HDFC Bank 5,226.67 4,249.23 3,887.62 4,863.44
TAX
Bank FY13 FY12 FY11 FY10
SBI 6,797.30 6,689.71 6,166.62 6,115.12
IOB 180.25 247.58 519.68 271.99
BOB 350.51 1,018.84 1,408.64 1,179.73

19 | P a g e
ICICI Bank 3,071.22 2,338.17 1,609.33 1,600.78
AXIS Bank 2,373.64 2,045.99 1,747.63 1,492.37
YES Bank 625.05 473.02 365.04 248.75
HDFC Bank 3,024.94 2,346.62 1,892.86 1,340.99
NOPAT
Bank FY13 FY12 FY11 FY10
SBI 11,431.96 3,811.76 8,411.92 8,489.82
IOB 1,790.44 1,335.67 1,087.78 684.97
BOB 5,318.66 4,416.02 3,006.82 2,695.80
ICICI Bank 2,272.47 587.80 1,273.84 3,951.52
AXIS Bank 730.12 306.89 325.51 2,449.40
YES Bank 310.91 1,055.69 814.02 488.15
HDFC Bank 2,201.73 1,902.61 1,994.76 3,522.45
As per the above tables, the following interpretation can be made. Comparing all the seven
esteemed Banks for analysis, we can prelude that State Bank of India leads the race by holding
the highest Net Operating Profit after Tax of 11,431crores in the financial year 2013 for both
Public Sector and Private Sector Banks. ICICI stood third with 2,272crores in 2013 in the overall
competition but first when Private Sector Banks were concerned. HDFC stood fourth in the race
with an overall net operating profit after tax of 2,201 crores in 2013 keeping YES Bank at the
last stage with an overall net operating profit after tax of 310crores in FY2013. For the financial
years 2012 and 2011 same was the result with BOB in Public sector bank and HDFC in private
sector concerns.
Incremental NOPAT
The Incremental NOPAT shows the change in the overall NOPAT in the year 2013 to 2011 when
compared to previous years i.e. NOPAT (t) – NOPAT (t-1)

20 | P a g e
We can adjudicate that the NOPAT for SBI gave an increment of 7,620 crores in 2013 with the
comparison of its NOPAT of 2012 taking SBI at the prime stage of competition. But the case
was reverse in FY 2012 and 2011 when the NOPAT of SBI gave a decrement of -4,600 and -
78crores making it fell to the 7th
and 4th
slope in the race. But the remaining 2 Public sector
banks IOB and BoB have always shown constant growth in their performances. ICICI, AXIS and
HDFC have too shown an immense contribution in the incremental value for the firm in the
financial year 2013.
Invested Capital
The invested capital includes Total Equity and Reserves and borrowings excluding Total
Deposits because these are the prime essentials for undermining the operations of a business unit.
Total equity & Reserves + Total borrowings
Bank FY13 FY12 FY11 FY10
SBI 312,198 295,601 285,790 275,954
IOB 61,417 55,566 48,610 37,651
BOB 121,394 83,209 71,397 61,182
ICICI Bank 171,394 159,560 134,686 120,893
SBI IOB BOB ICICI Bank AXIS Bank YES Bank HDFC Bank
FY13 7620 455 903 1685 423 -745 299
FY12 -4600 248 1409 -686 -19 242 -92
FY11 -78 403 311 -2678 -2124 326 -1528
-50
-30
-10
10
30
50
70 H
un
dre
ds

21 | P a g e
AXIS Bank 113,738 93,192 71,992 55,975
YES Bank 42,976 27,757 18,829 10,210
HDFC Bank 111,614 97,483 70,929 58,608
From the above curriculum, we can proclaim that SBI Bank has made the highest Capital
Investment each time in comparison with other banks with an investment of 312,198 crores in
2013, 295,601 crores in 2012 and 285,790 crores in 2011. Whereas ICICI holds the second spot,
BOB in 3rd
and AXIS holds the fourth spot in 2013. In terms of Private sector ICICI holds the
first spot in all the financial years
Incremental Invested Capital
The incremental Invested capital determines the overall change in the invested capital as
compared to the previous year.
Invested capital (t) – Invested Capital (t-1)
Forecasting the above analysis, we can sort out that both the Public sector and the Private sector
bank holds the key position with an incremental capital in all the financial years.
SBI IOB BOB ICICI Bank AXIS Bank YES Bank HDFC Bank
FY13 16597 5851 38184 11834 20545 15219 14131
FY12 9811 6955 11813 24874 21200 8929 26554
FY11 9836 10960 10214 13793 16017 8619 12322
50
100
150
200
250
300
350
400
Hu
nd
red
s

22 | P a g e
Return on invested capital
The return on invested capital signifies the return that the firm earns on the capital invested for a
given period of time.
NOPAT / Invested capital
NOPAT
Bank FY13 FY12 FY11 FY10
SBI 11,432 3,812 8,412 8,490
IOB 1,790 1,336 1,088 685
BOB 5,319 4,416 3,007 2,696
ICICI Bank 2,272 588 1,274 3,952
AXIS Bank 730 307 326 2,449
YES Bank 311 1,056 814 488
HDFC Bank 2,202 1,903 1,995 3,522
Capital Invested
Bank FY13 FY12 FY11 FY10
SBI 312,198 295,601 285,790 275,954
IOB 61,417 55,566 48,610 37,651
BOB 121,394 83,209 71,397 61,182
ICICI Bank 171,394 159,560 134,686 120,893
AXIS Bank 113,738 93,192 71,992 55,975
YES Bank 42,976 27,757 18,829 10,210
HDFC Bank 111,614 97,483 70,929 58,608
ROIC
Bank FY13 FY12 FY11 FY10
SBI 0.037 0.013 0.029 0.031
IOB 0.029 0.024 0.022 0.018
BOB 0.044 0.053 0.042 0.044
ICICI Bank 0.013 0.004 0.009 0.033
AXIS Bank 0.006 0.003 0.005 0.044
23 | P a g e
YES Bank 0.007 0.038 0.043 0.048
HDFC Bank 0.020 0.020 0.028 0.060
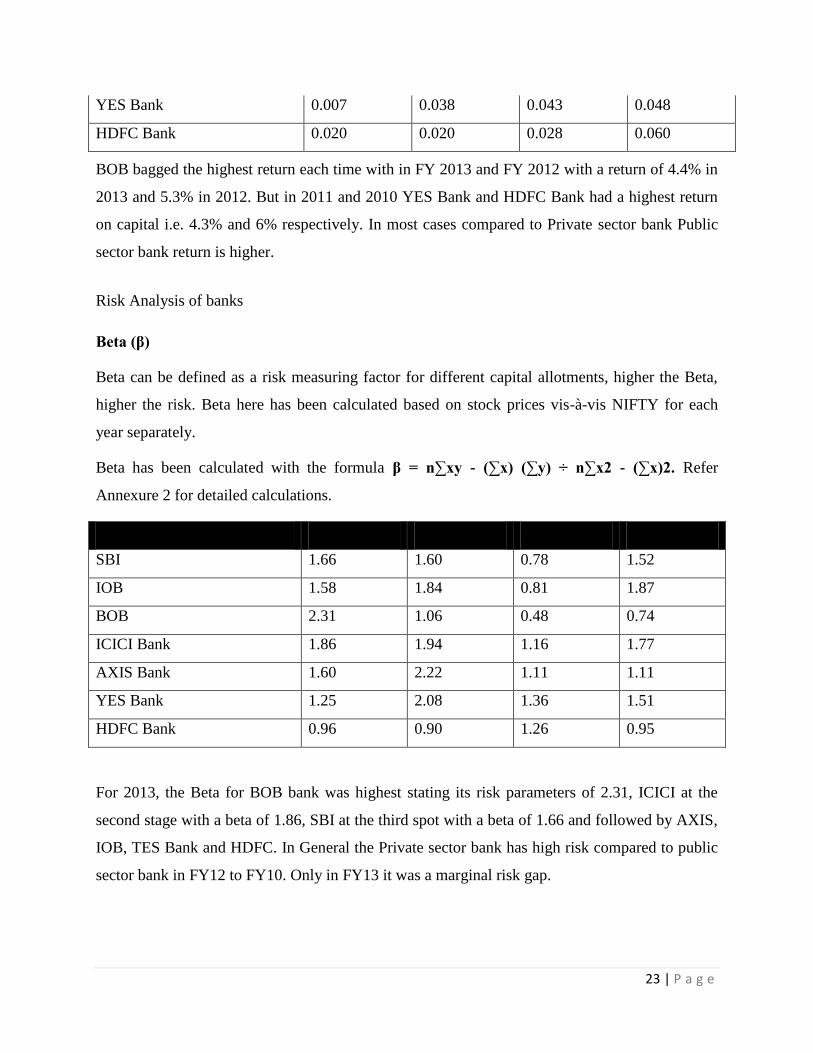
BOB bagged the highest return each time with in FY 2013 and FY 2012 with a return of 4.4% in
2013 and 5.3% in 2012. But in 2011 and 2010 YES Bank and HDFC Bank had a highest return
on capital i.e. 4.3% and 6% respectively. In most cases compared to Private sector bank Public
sector bank return is higher.
Risk Analysis of banks
Beta (β)
Beta can be defined as a risk measuring factor for different capital allotments, higher the Beta,
higher the risk. Beta here has been calculated based on stock prices vis-à-vis NIFTY for each
year separately.
Beta has been calculated with the formula β = n∑xy - (∑x) (∑y) ÷ n∑x2 - (∑x)2. Refer
Annexure 2 for detailed calculations.
Bank FY13 FY12 FY11 FY10
SBI 1.66 1.60 0.78 1.52
IOB 1.58 1.84 0.81 1.87
BOB 2.31 1.06 0.48 0.74
ICICI Bank 1.86 1.94 1.16 1.77
AXIS Bank 1.60 2.22 1.11 1.11
YES Bank 1.25 2.08 1.36 1.51
HDFC Bank 0.96 0.90 1.26 0.95
For 2013, the Beta for BOB bank was highest stating its risk parameters of 2.31, ICICI at the
second stage with a beta of 1.86, SBI at the third spot with a beta of 1.66 and followed by AXIS,
IOB, TES Bank and HDFC. In General the Private sector bank has high risk compared to public
sector bank in FY12 to FY10. Only in FY13 it was a marginal risk gap.

24 | P a g e
Cost of Equity (Ke)
It determines the expected rate of return for the investors. We have calculated the cost of equity
for the following banks using CAPM model and taking inputs such as Rf (365 days T-bills rate –
same for each year i.e. 4.55%), Rm (3 years market monthly return of NIFTY) and β.
So the Cost of Equity (Ke) has been calculated with the formula Ke = Rf + β (Rm - Rf).
Bank FY13 FY12 FY11 FY10
SBI 0.112 0.120 0.109 0.162
IOB 0.111 0.126 0.110 0.185
BOB 0.122 0.107 0.098 0.111
ICICI Bank 0.115 0.128 0.123 0.178
AXIS Bank 0.111 0.135 0.121 0.135
YES Bank 0.106 0.132 0.130 0.161
HDFC Bank 0.101 0.103 0.126 0.125
In 2013, BOB offered the highest cost of equity to its equity holders taking the utmost risk in the
firm and likewise gained a return of 12.2% leading ICICI offering 11.5% followed by others. In
Previous years all the private sector banks had a high return compared to the public sector banks.
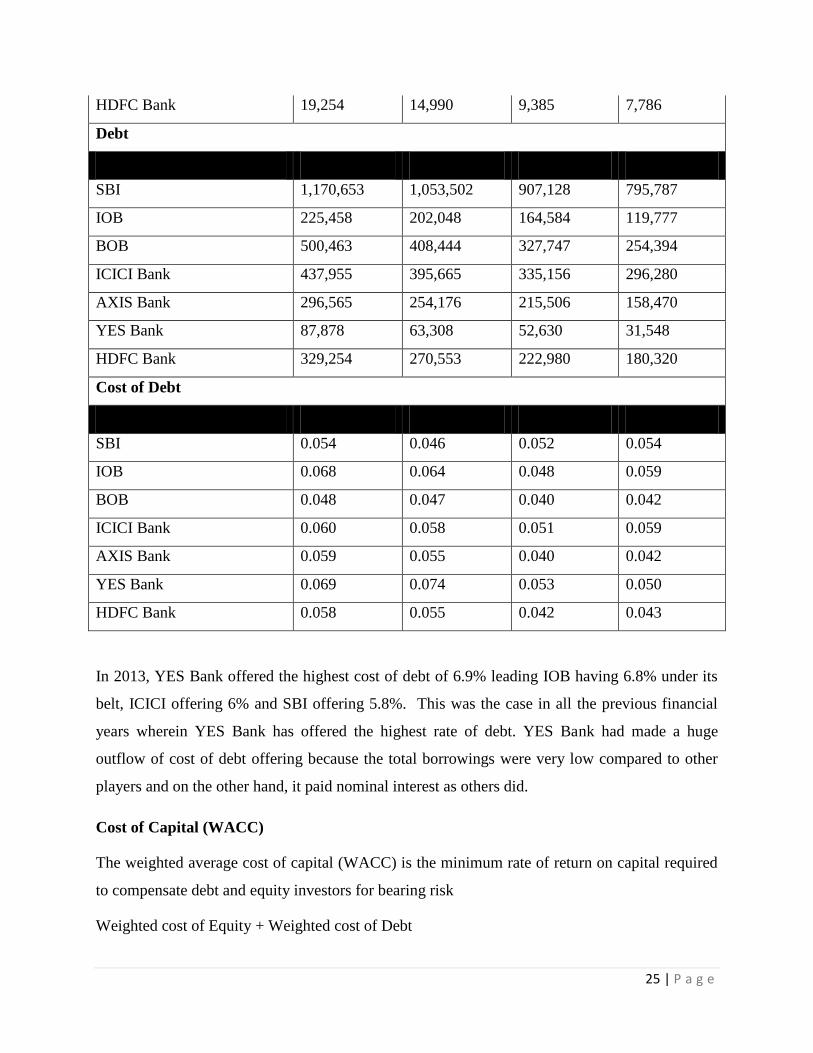
Cost of Debt (Kd)
It can be defined as the total interest paid divided by the total borrowings by a firm. Hence the
Interest expense details and the Debt details of all the banks have been collected to arrive upon
the cost of debt (Kd).
Interest Expense
Bank FY13 FY12 FY11 FY10
SBI 63,230 48,868 47,322 42,915
IOB 15,425 12,881 7,893 7,078
BOB 23,881 19,357 13,084 10,759
ICICI Bank 26,209 22,809 16,957 17,593
AXIS Bank 17,516 13,977 8,592 6,634
YES Bank 6,075 4,692 2,795 1,582
25 | P a g e
HDFC Bank 19,254 14,990 9,385 7,786
Debt
Bank FY13 FY12 FY11 FY10
SBI 1,170,653 1,053,502 907,128 795,787
IOB 225,458 202,048 164,584 119,777
BOB 500,463 408,444 327,747 254,394
ICICI Bank 437,955 395,665 335,156 296,280
AXIS Bank 296,565 254,176 215,506 158,470
YES Bank 87,878 63,308 52,630 31,548
HDFC Bank 329,254 270,553 222,980 180,320
Cost of Debt
Bank FY13 FY12 FY11 FY10
SBI 0.054 0.046 0.052 0.054
IOB 0.068 0.064 0.048 0.059
BOB 0.048 0.047 0.040 0.042
ICICI Bank 0.060 0.058 0.051 0.059
AXIS Bank 0.059 0.055 0.040 0.042
YES Bank 0.069 0.074 0.053 0.050
HDFC Bank 0.058 0.055 0.042 0.043
In 2013, YES Bank offered the highest cost of debt of 6.9% leading IOB having 6.8% under its
belt, ICICI offering 6% and SBI offering 5.8%. This was the case in all the previous financial
years wherein YES Bank has offered the highest rate of debt. YES Bank had made a huge
outflow of cost of debt offering because the total borrowings were very low compared to other
players and on the other hand, it paid nominal interest as others did.
Cost of Capital (WACC)
The weighted average cost of capital (WACC) is the minimum rate of return on capital required
to compensate debt and equity investors for bearing risk
Weighted cost of Equity + Weighted cost of Debt

26 | P a g e
Bank FY13 FY12 FY11 FY10
SBI 0.054 0.046 0.052 0.054
IOB 0.069 0.064 0.048 0.060
BOB 0.048 0.047 0.040 0.042
ICICI Bank 0.060 0.058 0.051 0.060
AXIS Bank 0.059 0.055 0.040 0.042
YES Bank 0.069 0.074 0.054 0.051
HDFC Bank 0.059 0.055 0.042 0.043
In 2013, the WACC for IOB & Yes Bank was highest of 6.9%each because the proportion of
equity for the firm was very high for the bank as against its proportion of borrowings. In 2012
also Yes Bank had a highest WACC of 7.4% and was leading in all the years followed by other
banks.
Economic Value Added and Indian banks
EVA - as a measure of Value creation through Management of Profits
This concern is used by the following sequence: ROIC which includes NOPAT divided by
capital employed minus WACC which pertains the addition of weighted cost of equity and
weighted cost of debt.
When the question arises so as to create the economic value, only BOB has created positive
value in past 4 years flowed by Axis Bank and HDFC Bank in financial year 2010. Rest all the
banks, instead of excellent capital investment, capital charge and cost of equity, it failed to give
better EVA.

27 | P a g e
EVA - As a measure of value creation through Management of Capital
This scenario is used by the following consequence: - NOPAT including net operating profit less
tax subtracting capital charge comprising of cost of capital multiplied by capital employed gives
the title at a substantial exposure.
I.e. NOPAT - (WACC x Invested Capital)
SBI IOB BOB ICICI
Bank
AXIS
Bank YES Bank
HDFC
Bank
FY13 -0.017 -0.039 -0.004 -0.047 -0.053 -0.062 -0.039
FY12 -0.034 -0.040 0.006 -0.054 -0.052 -0.036 -0.036
FY11 -0.023 -0.026 0.002 -0.041 -0.036 -0.010 -0.014
FY10 -0.023 -0.041 0.002 -0.027 0.002 -0.004 0.017
-0.070
-0.060
-0.050
-0.040
-0.030
-0.020
-0.010
0.000
0.010
0.020
0.030
SBI IOB BOB ICICI Bank AXIS Bank YES Bank HDFC Bank
FY13 -5441 -2422 -482 -8009 -5997 -2667 -4332
FY12 -9913 -2220 468 -8643 -4830 -1010 -3506
FY11 -6508 -1255 152 -5574 -2556 -195 -1003
FY10 -6416 -1561 102 -3281 93 -36 980
-12000
-10000
-8000
-6000
-4000
-2000
0
2000

28 | P a g e
Similarly here also only BOB has created positive value in past 4 years flowed by Axis Bank and
HDFC Bank in financial year 2010. Rest all the banks has a negative EVA for all the years.
Chapter 2
Literature Review
Specifically, it is argued that the purpose of marketing is to contribute to maximizing shareholder
value and that marketing strategies must be evaluated in terms of how much value they create for
investors. This concept, which is called value-based marketing, does not overthrow the existing
body of marketing knowledge. On the contrary, it makes it more relevant and practical by giving
it greater clarity and focus (Doyle, 2008). Market efficiency and cost efficiency, both are the
dimensions of efficient value creation process, are very important ((Wikström and Normann,
1994). In order to be successful on performance dimension, needs of customers should be
appropriately satisfied. Profitability and cost effectiveness improve financial position of the
organization are nitty-gritties of a strong corporate position of the organization (McKenna,
1991). Companies cannot merge differentiation and cost leadership strategy, if they do this
would call “stuck in the middle” and companies following this strategy will destined with recess
and stagnation (Porter, 1985). Traditionally, the main purpose of the marketing is to make
product a success in the market place, but corporate management views marketing as a key
contributor to increase the shareholder’s returns (Day and Fahey, 1988). This shift of approach
has been resulted into realization that relationship between finance and market should be
managed carefully. Depending upon the assumptions that positive product market results will be
transformed automatically into best financial results (Hunt and Morgan, 1995).
So, customers and channels are viewed by marketing department as the assets of the company
that should properly managed and leveraged. There is another change in the mind set of
marketers, is expanding set of measures the failure or success of marketing efforts. They are
moving beyond traditional financial measures, such as gross margin, sales volume and market
share; they are using net present value and shareholder’s value to measure the success of failure
or activities performed by the marketing department (Narver, 199o). It is interesting to know
29 | P a g e
that marketers are trying to add more financial measures to gauge marketing activities, while on
the other hand financial officers are also expanding their thinking to include non-financial
measures of company in order to develop a more balanced scorecard (Webster, 1992).
During the past two decades the concept of shareholder value has become an integral part of
corporate strategies of organizations. In 1980s, a small numbers of behemoth companies
dominated the American economy. These companies apportioned their revenues in accordance
with principle of “retain and invest”. These multinational behemoths inclined to preserve both
money and people, employed in these companies (Hall, 1994).
One of the important things in every organization is to increase the value of shareholder through
the creation of verity of corporate valuation and to introduction of different marketing and
financial management skills (Koller, Goedhart and Weseels 2010). The value of the shareholder
is the ultimately the goal of organization and to increase the growth of the company as well. It is
important to understand the shareholder value and to focus more on core concepts of shareholder
value through the development of capital flow, control mechanism, enhancement of capital
market, expansion of goals and target, liquidity, risk management, information technology
advancement, globalization and improvement in internal control. With the understanding of
shareholder value and to build up of management team will create the profitability (Young and
O'Byrne 2001). The economic value added (EVA) is based on the financial measurement
performance tool that investigate the shareholder value. It is calculated through the excess
investment return on investment made by shareholder. It is a NOP (net operating profit) less
opportunity cost. It is the rate of return that minimum amount of value required by shareholder to
compete the risk (M. Stewart 1990). It is one of the benchmark values that are calculated to
understand the residual income and interest of the shareholder in the company (Pinto 2001).
EVA is the most demanded tool for the owners in every situation. It has been implemented in
numerous large companies to motivate managers to create shareholder value (Dodd and Chen,
1996). The decision role is very simple; if the EVA is positive, the company creates shareholder
wealth. Negative EVA indicates that shareholder wealth is destroyed (Stewart, 1991). The
mortgage crisis in 2007, which saw some of the most recognized names in the banking sector fall
from grace into the ignominy of bankruptcy, has only heightened the need for capital quality and
for standards of liquidity to be increased by substantial proportions. It was impossible for the
pre-existing banking system to sustain the consequential losses as well as the transference of off

30 | P a g e
balance sheet items of some banks at that time (Bank for International Settlements, 2011).
Shares of Indain banking industry has been showin quite interesting results form prevous five
years. Market share of asset has been mobalized from 2001 to 2007 between new private banks,
PSU banksold private banks, foreign banks and other financial institutions. On the other hand,
public sector shares keeps on dominatikng, so there is considerable shift in market share to new
private sectors banks.
Chapter 3
Research Methodology
To obtain an overview of EVA and its rationale, I will use publications indicating its reasons as
well as its impact on the determining stakeholder value creation. Additionally, I will work with
online documents provided by both leading consulting companies and international
organizations. In order to form an in-depth picture of Indian Banks and to answer my research
question, I will rely on research reports and press releases collected through the respective banks
annual financial reports, as well as other public data accessible via renowned website.
Finally all this information will be computed using Stern Stewart’s EVA model, using variables
like Cost of Equity, Beta risk factor, Weighted Average Cost of capital (WACC), etc. and look at
results generated, trying to interpret the logic behind western flow of capital to India.

31 | P a g e
Chapter 4
Discussion and Analysis
Economic Value Added with Marketing Value Management
Marketing has been taking a new shape of relationship marketing (Grönroos, 1994). Marketers
are shifting their attention from toward retaining their existing customers, rather than investing
hefty budget on attracting new customers. The basic theme of relationship marketing is to build
long lasting relations with customers, suppliers, intermediary partners and society. The chief idea
is to create loyalty in order to make stable and mutually profitable relationships, to garb
customer’s life time value (Heskett, 1994). Value is an important element of relationship market
and defined as providing customers with superior offerings and solutions to its problems to
create sustainable competitive advantage over competitors (McKenna, 1991). Product is
developed in production department, where features and functions are added to it. Finance
department has to provide funds for product development (Moritsin 2001). R&D seeks viability
and functionality of the product in the actual marketplace. Marketing department has always
been shouldering the responsibility to create value through its product specific activities and
plans and then communicate this value to customer. Customers will remain ignorant about the
features and qualities of the product, no matter how much premium quality is carried by the
product. Indeed, more and real value is added into product by marketing department. After the
advertisement, sales and promotional activities of the marketing department customer will know
about the value that a specific product carries for them.
The analysis through the market based valuation approach belongs to analysis of market data of
the company. The market based approaches are includes EV / EBITDA or EV / EBIT is the one
of most essential calculation. However there is difficult to calculate the value of bank through
such multiple due to challenges of true debt and equity market value of the bank. In this regards
the two other important methods to calculate the banking sector / bank value through
Price/Earning (P/E) and Price/Book value (P/B) (Gross 2006). The Marketing Value
Management provides a set of processes and methodologies for the development of a company’s
capacity to coordinate and optimize the use of marketing resources. In particular, it consists of
the integration of various components that can:
32 | P a g e
Monitor the internal and external performance of marketing
Optimize the marketing mix to improve the ROI of marketing programs and campaigns
Concentrate resources to improve the efficiency of Lead Management and Retention
Management
Ensure the sharing of knowledge and expertise. As these issues are closely related, it is
necessary to apply a top-down approach that takes into account the reciprocal impacts of
processes and performance.
Since the primary objective is to increase efficiency and allocate the proper budget, Marketing
Value Management involves the construction of a management control system based on
monitoring marketing areas such as ROI for programs and campaigns, providing an internal
efficiency dashboard (financial, allocation of resources, ROI for campaigns and programs, etc.).
In order to reach this objective, it is essential for marketing to have access to a set of
methodologies and models that can continually monitor the company's position and performance
in the market. This means the availability of a market performance dashboard, structured
competitive/market analysis, data mining models, simulations and scenario analysis. This
complex mix of processes and methodologies forms the management cockpit that enables proper
resource planning and the ability to react to adverse market developments.
4.1 Different Types of Value for Business
4.1.1 Shareholder Value
For a publicly traded company, shareholder value is the part of its capitalization that is equity as
opposed to long-term debt. In the case of only one type of stock, this would roughly be the
number of outstanding shares times current share price. Things like dividends augment
shareholder value while issuing of shares (stock options) lower it. This shareholder value added
should be compared to average / required increase in value, also known as cost of capital. For a
privately held company, the value of the firm after debt must be estimated using one of several
valuation methods, such as discounted cash flow or others. The meaning of the shareholder
values in the terms of business, which indicate that, the performance measurement of success of
the company and to ultimately the benefits of shareholder. Investigating and understanding of the
value of shareholder have different perspective which relates with total benefits to the owners of

33 | P a g e
the company (Tettey 2008). The calculation of shareholder value has several accounting methods
such as ROE (return on equity), cost of equity and other market equity calculated value
adjustments. The equity value is the residual interest of shareholder in the company after
adjustment between the assets and liabilities. The management must take steps towards
increasing of value for shareholder through achieve the minimum level of cost structure,
advantage of positive externalities, access to get more cheap new debt and equity from the
market and design the capital structure with more efficient and effectively than competitors and
avoid the unnecessary action of destruction (S. Stewart 1991). The value of the shareholder is
trying to discuss and monitor the efficiency of management. The efficiency of higher valuation,
target the objective in time and synergies to redistribution of shareholder are the main focus of
the company’s top management (Pakalen 2009).
4.1.2 Customer Value
Customer value is defined as the difference between benefits and satisfaction gained customer
and the cost, which has paid to gain these benefits (Zeithaml, 1988). Through addition of more
value to the basic product (increased product quality, better supporting services) firm tries to
enhance customer’s satisfaction level in order to strengthen the bond and to achieve loyalty. All
other values revolve around the customer value. Because, when customers are offered with
appropriate solutions for their problems, they will not purchase the product/service of the
company in future. In this way sales and revenues of the company will be affected and company
with poor sales and revenues cannot deliver value to other stakeholders.
After going through myriad types of researches on consumer behaviour, we come to the findings
that value is regularly used in the sense of value of customers ((Engel and Blackwell, 1982). But
according to Peter and Olson (1993), the utilities or value that customers obtain when they buy a
product/service. The notion of value appears very frequently in service marketing. But there is
scarcity of a clear and unequivocal definition of value. According to Monroe (1991), customer’s
perceived value is the ratio between perceived benefits of the customer and perceived sacrifices
by the customer. The perceived sacrifice includes purchase price, transportation, acquisition
costs, installation expense, maintenance and repair, order handling and risk of failure or bad
performance.

34 | P a g e
Customer value is the value received by the end-customer of a product or service. End-customer
can include a single individual (consumer) or an organization with various individuals playing
different roles in the buying/consumption processes. Customer value is conceived variously as
utility, quality, benefits, and customer satisfaction. The customer relationship management
(CRM) has the core value for any business especially for banking and insurance companies. The
banking sector involves with the service to the customers and helps them to obtain valuable
existing products and services that they provide. The long run relationship between the banks
and customer should be the main focus of the management. The marketing department are
closely related with customer management to provide them more satisfaction and reliable
services that they want. The top management must ensure to create CRM standards and must
focus on multi-criteria of preference (Onut and Erdem 2002). The importance for bank
management has to concentrate on the long term relationship with customers on the basis of
multiple core business strategy. They should taking steps towards provide them short and long
term loans on lower cost of interest rates, provides them counselling about different new types of
products for farmers, builders and other related parties and advise them how to save their money
for future needs through several packages of saving schemes (EuropeanCentralBank 2001).
Discussion related to value-addition tactics zero in on how to couple more value with basic
solution or core product. The manifestation “add value” indicates that an extra feature or better
after sale service should be added.
4.1.3 Employee Value
This is often an undervalued asset in companies and also the area where there is the most discord
in reporting. Employees are the most valuable asset companies possess and the one we expect the
most from, but often the one that receives the short end of the stick when it comes to values
applied to them. Human capital is considered as the most valuable asset of a company. Skilled,
educated and professional workforce is a prerequisite for good performance in order to survive
and sustain in today’s competitive environment. Dissatisfied employees cannot deliver value and
best services to other stakeholders of the company. So, in order to deliver value to customers and
shareholders, value should also be provided to employees in order to get satisfied workforce that
can achieve envisaged objectives and results (Hall and Liebman, 1997).

35 | P a g e
The concentration on shareholder is very important as well as the understanding of employee
value to remain maintain the momentum of developing structure sustainable. The development
of human resource is the fundamental role of the organization to provides them resource and
motivates them according to the objectives. The development of the human resource is one of the
powerful tools towards the attainment of goals and tasks in time. The management should
critically analyse the employee value and design the relationship management with corporate
ideas, belief and values. The proper training and enhancement of employee skills as per market
demand increase the motivation level of them and capabilities towards the generation of new
opportunities (Quay 2009). Most of the organization globally focuses on the opportunities to
develop in the system with more innovative approaches. The value of employee is the most
essential tool that builds such kind of effective performance with efficient management. The
value of the employee is the framework to address the issues of human resource and highlight the
high level of performing workforce retention. The attracting of new talented employee strategy
can help the organization to enhance the level of satisfaction and team building during the
execution of strategy. The leadership must critically understand the impact of employee in the
company through yearly evaluation system and HR department must need to understand the
problems of the human resource and motivate them with the overcome of such kind of matter
resolving system (Gacheru 2012).
4.1.4 Supplier Value
Current era is an era of collaboration and coordination. Neither individual nor an organization
can survive without exchanging goods and services with one another. Everyone plays two roles
simultaneously, one as buyer other as seller. Resultantly, cordial mutual relationship, based on
value for both buyer and supplier, should be established in order to deliver value to customers,
shareholder, society and employees. Supplier relationship management is of strategically
planning for, and managing, all interactions with third party organizations that supply goods
and/or services to an organization in order to maximize the value of those interactions. In
practice, SRM entails creating closer, more collaborative relationships with key suppliers in
order to uncover and realize new value and reduce risk. The important purpose of the supplier
value is to address the relationship of working process with the creation of value for both parties
involves. The supplier provides the resource that will use in the production of the company. The
suppliers are mostly concerns with the company risk and revenue analysis. They mostly focus on
36 | P a g e
financial reports to understand the company ability to return their cash against the resource they
provide. The break-even operating analysis represents the volume where cost and revenue are
zero. They also focus on company several financial statement analyses to guard their investment
(Walter, Ritter and Gemunden 2001). The value of supplier is vital to survive in the market
because they provide the resource to the company and the relationship has mostly build on trust,
extent to reputation and trustworthiness, goodwill and long terms positive relationship (Dyer and
Chu 1997). Supplier relationship management is an essential as the customers. It is not the new
segment of the business society. The important thing is to understand the value of supplier and
how it becomes essential to focused on such relationship. It is another partnership between buyer
and supplier where companies locate the key supplier to provide them quality of resources. The
key supplier have been involved with the maximizing of value of the shareholder through
providing them time, investment, resources, sharing of risk and collaboration in several other
working operation (Brimacombe, Cotter and Timmermans 2011).
4.1.5 Societal Value
One of the main obligations of an organization is corporate social responsibility (CSR). It
involves what is delivered to the society in return of sumptuous revenues generated from the
same society (Waddock, 2000). Large multinational companies are operating across the globe
and contributing value towards the society in different forms.
The social environment also wants that the firm follows or adopts several values towards the
society. These social values relate to the provision of hospitals, charity, schools, parks, wildlife
protection. The private and public sector of any organization are mostly involves and plays vital
role to create healthy and social sustainable working environment. The share a common values to
setup the co-responsible mechanism and future values. The financial institutions are committed
to remain in the system through sustainability, accountability, rules and regulations, standards of
working environment and to reduce the risk level to provide more satisfaction to the final
beneficial (Clerck 2003). The financial institutions have verity of contents of human rights and
take the responsibility to ensure the proper integration within the rights of the society. The
several analysis indicate that the development and sharing of knowledge with relevance
information took forward the shareholder value enhancement and manage the risk level easily.
The leadership must identify the social risk and problems to particularly resolve the human

37 | P a g e
resource matters and endorse the social issues in their respective field of business operation
(Roca and Manta 2010).
4.2 Principle of Value Creation
Principles address three equally important factors in sustainable long-term value creation:
metrics, communications, and compensation.
Define metrics of long-term value creation
Companies and stakeholders are oriented for the long-term use forward-looking incentives and
measures of performance that are linked to a strong and credible business strategy.
Long-term oriented firms are ‘built to last,’ and expect to create value over five years and
beyond, although individual metrics may be for short time horizons. The aim of such metrics is
to maximize future value (even at the expense of lower near-term earnings) and to provide the
investment community and other key investors the information they requisite to make better
decisions about long-term value.
In pursuit of long-term value creation, companies and investors should:
Understand the firm-specific issues that drive long term value creation.
Recognize that firms have multiple constituencies and many types of investors, and seek
to balance these interests for long-term success.
Use industry best practices to develop forward-looking strategic metrics of corporate
health, with a focus on:
o Enhancing and sustaining the value of corporate assets,
o Recruiting, motivating, and retaining high-performing employees,
o Developing innovative products, managing relationships with customers,
regulators, employees, suppliers, and other constituents, and
o Maintaining the highest standards of ethics and legal compliance.
De-emphasize short-term financial metrics such as quarterly EPS and emphasize specific
forward-looking metrics that the board of directors determines are appropriate to the
long-term, strategic goals of the firm and that are consistent with the core principles of
long-term sustainable growth, and long-term value creation for investors.

38 | P a g e
Focus corporate-investor communication around long-term metrics
Long-term oriented companies and investors are vigilant about aligning communications with
long-term performance metrics. They find appropriate ways to support an amplified voice for
long-term investors and make explicit efforts to communicate with long-term investors.
In pursuit of long-term value creation, companies and investors should:
1. Communicate on a frequent and regular basis about business strategy, the outlook for
sustainable growth and performance against metrics of long-term success.
2. Avoid both the provision of, and response to, estimates of quarterly earnings and other
overly short term financial targets.
3. Neither support nor collaborate with consensus earnings programs that encourage an
overly short-term outlook.
Align company and investor compensation policies with long-term metrics
Compensation at long-term oriented firms is based on long-term performance, is principled, and
is understandable. Operating companies align senior executives’ compensation and incentives
with business strategy and long-term metrics. Institutional investors assure that performance
measures and compensation policies for their executives and investment managers emphasize
long-term value creation.
In pursuit of long-term value creation, companies and investors should implement compensation
policies and plans, including all performance-based elements of compensation such as annual
bonuses, long-term incentives, and retirement plans, in accordance with the following principles.
4.3 Value Management Approach
Value Management is a structured team based approach for a business to achieve Optimum
Function for Minimum Cost. It is a management approach to create value business uses a unique
combination of concepts and methods to create sustainable value for both organizations and their
stakeholders though Value Management. Some tools and techniques are specific to Value
Management that many organizations and individuals use. Detailed below is a summary of some
of the main tools and techniques. The sustainable and establishing the value for shareholder than
39 | P a g e
it is immense to implement and investigate the economic resources, knowledge of operation,
performance and to overcome the barriers with the understanding of value management process
(Al-Yami 2008). The meaning of value management is to build relationship with client. It is
design according to the client objectives in a particular context (Wandahl 2005). It is a broad
meaning of value management which relates with maximizing the development process,
investigation of tasks through the satisfaction of client perspective. The clients are the final and
main key stage towards the completion of objective. It is involved with building of long term
relationship and to enhance the resources optimal value of the shareholder (Coetzee 2009).
4.3.1 Stakeholder Analysis
Stakeholder Analysis is an approach used to facilitate policy reform procedures by accounting
for and often incorporating the needs of business and customer satisfaction. A stakeholder is any
individual/groups of individual with a declared or credible interest or stake in a policy concern.
The stakeholder analysis are based on the persons that have residual interest and whom they
facilitate the policy making, methodology to incorporating the capacity to reform the sustainable
and realistic business approach. The analysis of stakeholder means to understand and investigate
the persons of whom investment and time are linked with outcome of the project. We can also
define it as the gain and lose can be expected during the project process. It includes the
individuals that have main interest and affect the business operation through decision making,
investment, resources, experience and implementation of several strategies. The primary purpose
of the stakeholder is to critically achieve the goals and objectives related with project. They are
also interest with low cost of funding to gather, high quality of products and services, highly
qualified human resource to satisfy the customer needs and wants as the demand (FAO 2006). It
is a systematic method to analyse and determine the interest of shareholder through decision
making, impact on policy and strategy, action plans and support the standard of resource
(Schmeer 1999).
Stakeholder analysis was conducted by IPC team in Honduras, in1992, to examine the
environment of increased financial outcomes and value, both for customers and stakeholders of
the Central Bank. The objective behind this manoeuvre was to assess the opposition or support
for the suggested restructuring in financial structure. The autonomy and independence of the
Central Bank was considered significant as it has the capacity to influence and bring a shift to the

40 | P a g e
economic policymaking. There were some other actors, apart from private banks; those have
positive tendencies to see BCH more independent bank. Stakeholder analysis cannot be
performed as “one shot” tool to be applied. There are many things, factors and legal issues that
should be kept in mind while conducting stakeholder’s analysis. Inputs should be taken and
concerns should be addressed to move in single direction coherently and cohesively. After a
thorough analysis value of both stakeholder’s and customers could be preserved and delivered. In
the situation, where stakeholders are at logger heads then value to customer will remain a dream
unfulfilled.
Another lens to evaluate the value creation process is to refer towards total shareholder’s return
engendered by myriad types of players in previous five years. Total shareholder’s return for old
and new banks witnessed an increment in past five years. TSR is broken into four
elements/components. These components are listed below:
Profitability change (also referred as RoA change)
Growth
Change in P/E multiple
Cash flow variables, which includes new equity induction, share buyback and dividends
(free cash flow yield- FCFY)
First two elements, growth and profitability change signifies value manufacturing variables.
Change in P/E multiple, the third component, indicates re-rating of the market and the company.
FCFY indicates different aspects of the company’s financial policy.
4.3.2 Value Analysis
Structured team based approach to identifying functional requirements of projects, products,
processes or services. It identifying unnecessary costs, obvious and hidden that has affecting on
quality, productivity, safety and customer happiness. The value analysis is a process of team
mechanism to understand and resolve the matters and to identify the structure improvements. It
involves with sustainable performance of project, services, products and cost benefits. It is a tool
to increase and improve the customer relationship through understanding of cost, revenue, profit
and the project delivering process (www.dot.ca.gov 2013). The value management is to
investigate the performance of the project and function through cost and different characters of

41 | P a g e
the function related with products and services and to provide the reliable and efficient
performance as per the customers’ needs. It includes the cost reduction, enhancement of function
approach and to expand growth (Rabbi 2012).
Analysis offers and external stakeholders, value, for customers, internal stakeholders, are
essential in order to deliver value to aforementioned associated peoples. In banking sector, first
of it should be clearly defined that what are the meanings taken from value by different
stakeholders. It is impossible to deliver value successfully when you are ignorant of expected
value of different stakeholders. Value of customers of a bank, employees, government agencies
and other relevant authorities and agents are interlinked and correlated to each other (Cornin
2000). For instance, when the customer’s perceived value is not prognosticated and realized by
the bank, it will be difficult to satisfy the needs of customers. And when needs will be unsatisfied
customer will not do business with same bank in future. In this way profitability of bank will be
affected and ultimately it will deteriorate the value of bank and its employees. Bank will earn
small amount of money and will pay fewer taxes, so value of government will be impacted. We
can say that the exchange of value is long and chained process and whole chain is dependent
upon the value of end consumer. Hence, the analysis should be thoughtfully conducted to get the
real insight of the customer’s perceived value in order to fulfil it appropriately. Otherwise,
unsatisfied customer will disrupt the whole value creation and value delivery chain.
4.3.3 Function Analysis System Technique (FAST)
The function Analysis System Technique (FAST) was first invented in 1960s to understand the
value analysis. It is a tool to describe the complex system through converting the different
activities in a systematic function and to perform the operation as per the consumer demand. The
performance is important as other job to done. The FAST function is used during the complex
structure of organization. In the analysis of Value management it solve the problems of teams,
provide new solutions and it creates the innovative programs. It is also describe the customer
satisfaction to describe the product and services oriented program. The main objective of the
FAST is to explain the team members to learn new high level of function, solving the problems
with value analysis (Bartolomei and Miller 2001). It is a function of the heart of Value
Management to investigate the products, processes, projects or services which focused on client
needs and wants. It is a method to understand the relationship of function and project process and

42 | P a g e
to identify the questions answers of “why and how” it aligning the functions (www.dot.ca.gov
2013). The important contribution of FAST is to develop, understand and decaying of the
product and service. Within the function of FAST the performance of the team will be
maximized and efficiently employing the skills of individuals. It enables the human resource to
solve the problems and divergent the best innovative and thinking techniques towards more
effectively manage the resources (Wixson 1999).
4.3.4 Risk Analysis
It is a structure approach to identifying risks that could affect project, product, process or service
success. Risks are identified, evaluated (in terms of cost, time, and other impact) and robust
action planning applied. The analysis of risk is the assessment to determine and evaluate the
vulnerabilities and manage the risk level of all parties involves. The risk analysis provides the aid
to the company to manage the risk level, mechanism to control the risk and address the level of
risk to management regarding to control and communicate the result. It is evaluate the
information about assessment of risk assets, threats of new project risk priorities, examine the
available resource to manage the risk level effectively and efficiently (McNamara 2007). The
important objective of the company is to address the risk level and to minimize it with the
utilization of professionals and focus on possibilities to scrutinize the business control on risk.
There are two types of risk levels are includes financial risk and market product and service risk.
The assessment of risk provides the shareholder to identify and evaluate the risk management
(Atkinson and Jourdan 2008).
4.3.4.1 Current Risk Status of Banks in India
In 2011-12, The World Bank and IMF conducted a study “financial Stability Assessment
Programme (FSAP). It was found, in this study, that India was not acquiescent with Basel Core
Principals 10 associated with large exposure limits. According to this report that the limit of 40%
(that might be stretched to 50% for infrastructure exposure) however, for a group debtor is
considerably higher than the large exposure limit of 25%, which is regarded as acceptable/good
international practice. Presently, Indian banks have ability to provide loan up to 25% of the total
capital, to a single borrower and 55% to a group borrower. Debacle of a key/major corporate
group can initiate an infection in the banking system of India. The report further states that
debacle of a large group can lead into a total loss of 60% of the capital of banking system in the

43 | P a g e
case where loss given default is 100%. And total loss might be 50% of the capital of banking
system if the loss given by default is 60%.
Loss to the Banking System under Stress Scenario – September 2013 (% of total capital)
Credit Shock Initial Loss Additional Loss due to
Initial Loss Additional Loss due to
Initial Loss Additional Loss due to
NPAs increase by 100% 14.3 26.8 40.1
30% of restructured standard
advances become NPAs
2.9 0.0 2.9
30% of restructured standard
advances are written off
10.7 24.1 34.8
Source: (1) Trends and Progress of Banking, 2013 (2) Profile of Banks – 2012-13 [Reports of RBI]
Credit Risk-Risk Weighted Assets
Bank Name 2013 2012 Year by year change
IOB 12412.54 10588.56 1823.98
BOB 3382.84 2798.72 584.12
ICICI Bank 37718.00 33919.00 3799.00
AXIS Bank 19785.25 17815.22 1970.03
YES Bank 5534.70 4414.25 1120.45
HDFC Bank 24681.82 19760.36 4921.46
SOB 21325.59 18532.292 2793.30
Source: Ace Equity
The details in the table show that ICICI bank faces highest credit risk, followed by HDFC and
SOB. Data in the table indicates that these banks have very strong asset base but failure of a key
corporate group can initiate problems for more than one bank as they will be associated with
same group.
Market Risk-RWA (standardized duration approach)
Bank Name 2013 2012 Year by year change
The Federal Bank 233.73 166.34 67.39
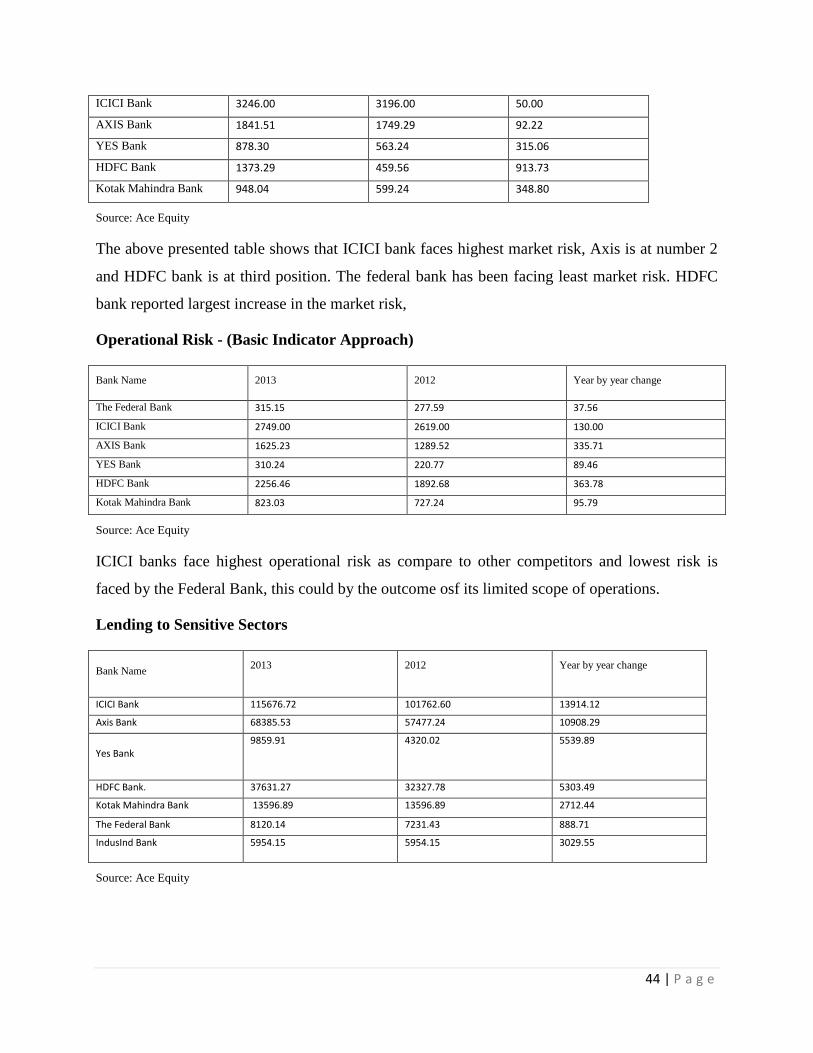
44 | P a g e
ICICI Bank 3246.00 3196.00 50.00
AXIS Bank 1841.51 1749.29 92.22
YES Bank 878.30 563.24 315.06
HDFC Bank 1373.29 459.56 913.73
Kotak Mahindra Bank 948.04 599.24 348.80
Source: Ace Equity
The above presented table shows that ICICI bank faces highest market risk, Axis is at number 2
and HDFC bank is at third position. The federal bank has been facing least market risk. HDFC
bank reported largest increase in the market risk,
Operational Risk - (Basic Indicator Approach)
Bank Name 2013 2012 Year by year change
The Federal Bank 315.15 277.59 37.56
ICICI Bank 2749.00 2619.00 130.00
AXIS Bank 1625.23 1289.52 335.71
YES Bank 310.24 220.77 89.46
HDFC Bank 2256.46 1892.68 363.78
Kotak Mahindra Bank 823.03 727.24 95.79
Source: Ace Equity
ICICI banks face highest operational risk as compare to other competitors and lowest risk is
faced by the Federal Bank, this could by the outcome osf its limited scope of operations.
Lending to Sensitive Sectors
Bank Name 2013 2012 Year by year change
ICICI Bank 115676.72 101762.60 13914.12
Axis Bank 68385.53 57477.24 10908.29
Yes Bank
9859.91 4320.02 5539.89
HDFC Bank. 37631.27 32327.78 5303.49
Kotak Mahindra Bank 13596.89 13596.89 2712.44
The Federal Bank 8120.14 7231.43 888.71
IndusInd Bank 5954.15 5954.15 3029.55
Source: Ace Equity

45 | P a g e
ICICI Bank is largest lender to sensitive borrowers as depicted by the data in the above presented table.
ICICI does also lead Change, in term of increment in the lending form 2012 to 2013. Yes Bank is lowest
loan provider to sensitive borrowers.
4.3.5 Cost Benefit Analysis
The using of cost benefit analysis used to analyse the costs of implementing something compared
to the benefits to be achieved and assists business case submissions. It also helps in evaluating
value approach by determining the net value it will be for business. The cost benefit analysis is
simple to describe the financial analysis of the company but it is as difficult to describe through
financial report. The cost benefit analysis can be describe through return on investment, return on
equity, cash flow, revenue, liability, and other related factor of financial assessment such as
productivity growth, reduction of cost, more supplier and customer satisfaction (Levitan 2010).
The cost benefit analysis analyze the basic concepts of business operation such as opportunity
cost of product, new innovation in the market, externalities, valuing the cost of project benefits
and the cost of input and output resources (DepartmentF&AAustralia 2006).
Cost-Benefit-Analysis is another source through which value toward different stakeholders of
banking industry can be assessed. The difference between cost and the benefit arises from that
cost is called value. After the comparison between cost and the benefit, management of the bank
will be in better situation to decide about to which extent they can deliver value to its customer
and stakeholders of the company. When cost is minimized and feature and benefits are kept at
same level, customers will perceive that bank is offering them more value. In this way they will
be satisfied and remain loyal to the bank and will do business and transactions through the same
bank. Ultimately, this will result into better business and revenues for the bank and the bank will
be able to transfer these benefits to its employees and shareholders in the form of increased
salary package and dividend (Ruyter 1998). On the other hand if customer finds too small no
difference between cost and benefits, he will be disappointed about the value and ultimately
switch to alternatives. This phenomenon will diminish the value for bank and its stakeholders.
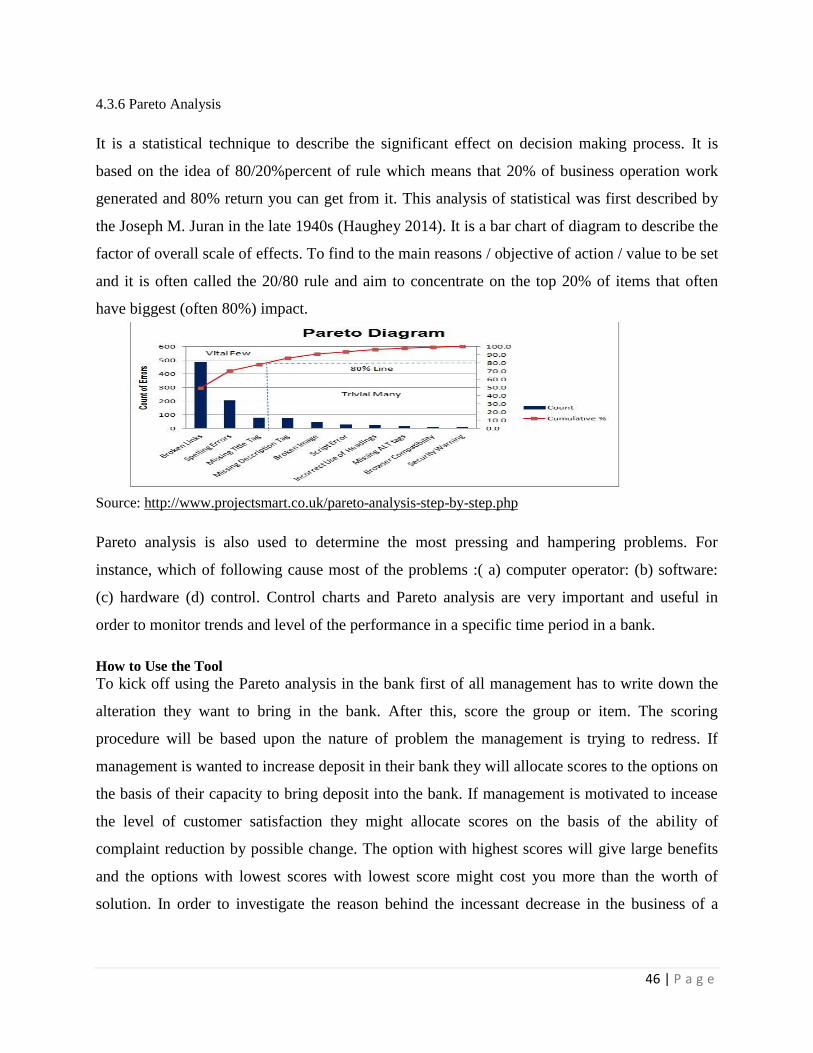
46 | P a g e
4.3.6 Pareto Analysis
It is a statistical technique to describe the significant effect on decision making process. It is
based on the idea of 80/20%percent of rule which means that 20% of business operation work
generated and 80% return you can get from it. This analysis of statistical was first described by
the Joseph M. Juran in the late 1940s (Haughey 2014). It is a bar chart of diagram to describe the
factor of overall scale of effects. To find to the main reasons / objective of action / value to be set
and it is often called the 20/80 rule and aim to concentrate on the top 20% of items that often
have biggest (often 80%) impact.
Source: http://www.projectsmart.co.uk/pareto-analysis-step-by-step.php
Pareto analysis is also used to determine the most pressing and hampering problems. For
instance, which of following cause most of the problems :( a) computer operator: (b) software:
(c) hardware (d) control. Control charts and Pareto analysis are very important and useful in
order to monitor trends and level of the performance in a specific time period in a bank.
How to Use the Tool To kick off using the Pareto analysis in the bank first of all management has to write down the
alteration they want to bring in the bank. After this, score the group or item. The scoring
procedure will be based upon the nature of problem the management is trying to redress. If
management is wanted to increase deposit in their bank they will allocate scores to the options on
the basis of their capacity to bring deposit into the bank. If management is motivated to incease
the level of customer satisfaction they might allocate scores on the basis of the ability of
complaint reduction by possible change. The option with highest scores will give large benefits
and the options with lowest scores with lowest score might cost you more than the worth of
solution. In order to investigate the reason behind the incessant decrease in the business of a

47 | P a g e
bank, management decided to take the input from customers. Customers indicated following
issues;
Online errors are occurred too frequently
Staff lacks politeness and courtesy
Poor service delivery
Then manager group these problems and tally complaints against each problem in following
way;
Poor service delivery ( 8 complaints)
Discourteous staff (2 complaints)
Online errors (1 complaints)
After performing above mentioned Pareto analysis, manager can easily understand that 72% of
the problems can be resolved by only bringing improvements in the service delivery system. In
this way bank can get its customers back by altering its services deliver by making it more
convenient and customer friendly. Pareto analysis is simple approach that assists the
management to deliver value to customers after removing crucial problems. Pareto analysis has
association with total quality management as it through aiding and abetting the problem
diagnosis and delivering value to customer. The concept of total quality management involves
incessant improvement in the quality of product/service, delivering superior value to customer
and converting him into loyal customers.
4.3.7 Process Mapping
The process Mapping is a model to describe the activities of team and communication
mechanism within a system to help and to improve the opportunities in the given available
resources. The process mapping analyses the methodology of resources, input, output and control
(ICOR) process mapping. It has been provided the basic framework to systematic control the
working environment. It is business processes of graphical technique of flowcharts are also
called the flow-charting (Howard 2003).

48 | P a g e
Source: http://www.businessballs.com/dtiresources/TQM_process_improvement_tools
4.4 Models for Customer Value Assessment
4.4.1 Field Value Assessment
One of the most common ways to assess the customer value is field value assessment. While
using this approach first hand data is collected to build customer value assessment model, but
this cannot be performed in all situations. In fact, in many situations customer’s perception is
utilized to obtain information about the value for customer. The results of these types of
assessment may not be as accurate as the results of field assessment model, but these results are
still valid and effective. Consider an example of a bank, which is aiming to get better
understanding of value of its new service through which customers can recharge their mobile
balance. To get an insight of consumer’s perception about the service, researchers of the
company developed four focused groups. At the start of each focus group, moderator/researcher
performs the demonstration of the service by using specially arranged prototypes. After this
activity, the researcher asks participants to speak about their first impression about the service
and how much they will pay for the activation of this service. After this, participants were

49 | P a g e
engaged in discourse about the service. After the discussion, the researcher asked participants to
write about their interest to use this service on a five-point scale and again what will be,
according to participants, appropriate charges for this service. Although, bank was interested to
know about the actual amount suggested by participants, but company was more interested I any
variation in both amounts. Comparison of both amounts explored that there was a steep decrease
in second amount. It indicates that participants were fascinated initially, but after discussion they
come to know that service do not offer much value for them. If the second amount increased
significantly, it is indicating that after the discussion and brain storming, members of focus group
come to know that service offers much value for them. The bank can use this information to
bring any alteration in the model of service and to set the price of service that is affordable and
competitive, in the light of information obtained from the focus group results.
4.4.2 Internal Engineering Assessment
Laboratory tests are conducted in order to assess the value for a product, by scientists/engineers
of producing firm. Adoption of this method depends upon comprehensive awareness of the
supplier company’s product in the customer company’s product along with production process of
the customers. After this assumptions are developed to generalize, the test in lab, into actual use
of the customer.
4.4.3 Conjoint or Trade-Off Assessment
Respondents are asked to, in a field survey; appraise different offerings in term of the purchase
preferences of their companies for each product. Each offering consists of an array of attributes
or features, and the levels of these attributes are systematically varied within the set of offerings.
Each offering consists of an array of attributes or features, and the levels of these attributes are
systematically varied within the set of offerings. Respondents provide a purchase preference
rating (or ranking) for the offerings. The range of these values for the levels of each attribute
determines the relative value of attributes themselves.
4.5 Brand Value Assessment
A brand might be a most valuable asset of a company, but the value of brand is not expressed in
financial statements, it is expressed in balance sheet only when a company acquires or sells a

50 | P a g e
brand to another company (Horsky, 2006). There are basically three approaches to measure
brand value:
The Cost Approach
The Market Approach
The Income Approach
The cost approach is, generally based on accumulation of all cost incurred to create and build the
brand since its conception. It is least applicable approach, because costs incurred do not trigger
the revenue generating potential of the brand, and investors are interested in the revenue
generating capability of the brand in the future.
Based on NPT, income approach of brand value assessment gauges the financial/economic
benefits arising from brand through the stream cash flows and future earnings. Incremental
income is one of applications of income approach, according to it a branded product can be sold
on premium price than that of a similar less familiar product. Brand can also bring economies of
the scale to the operations of a company because brand’s sale has always been quite high due to
high demand for it. Through earnings and sales of the brand the value of brand, both for
company and customers, can be gauged (Kartono, 2005).
Market approach estimates the value of a brand in the context of transactions in the market
involving similar brands. The most frequently used method is “relief from royalty” , which
means that the user of a brand will have to get a license issued for using that brand, in the case
where user is not the owner of the brand. The higher royalty rates would suggest the higher value
of the brand, while the lower royalty rates would indicates the low value of the brand in the
market (Srinivasan, 2005).
4.6 Application of Value concepts
Values should be at the fundamental of every business. They are what a business stands for, its
philosophy and reason for being. Organizational business's values will help to steer its business,
management and employees in the right direction.
The significance of values for an organization is even stronger now in the time of economic
uncertainty then even before. Business uses its values to inspire their Stakeholders, employees as
51 | P a g e
well as their customers. Value Concepts are often discussed to be an influential marketing tool,
since perfect organizational values are positively noted and boost potential buyers to buy or use
company’s product.
Value is something intangible type of thing; hence it is more strongly associated with service
industry. Financial institutions and banks are offer services to their clients/customers, so need for
value creation is being felt in banking sector with more intensity as compare to other industries
(Cronin 2000). Value creation and delivering process becomes more important of banks to
survive and in order remain competitive in the marketplace.
It is importance to know the philosophy of values for the businesses. And as it is of importance
that business should be sensible in advance of the desires of the future which means the wants
and needs of customers and stakeholder. Anxiety about future needs should be as powerful as the
passion with which the companies give away before the urgent feelings of the moment. The
future wants, wherever it comes into the domain of the present-day or proceeded by a psychical
reflection, or the reflection is of a totally different nature from the want itself. The hunger of a
future day is required of sustainability of business
In every society there are many different values. In international arena values affect marketing
strategies much more than expected. Values are learned with imitation or by observing the
process of reward.
Conclusion and Findings
EVA (Economic Value Added) is a concept to describe whether the business in a positive
direction or negative. It is a value which NOP after the capital cost. The cost assigned to capital
which is also known as cost of capital that has been minimum required by the owners
(shareholder) to start their business operation (Durant 1999). Economic Value Added (EVA) is
the main value measurement function developed by Stern Stewert & Co. And is widely used to
indicate and measure the shareholder value. It has been described the benefits that can be
calculated through financial reports and several other market based oriented structures. The
shareholder value is one of the main focuses of the topic and research analysis is that how EVA
has linked with shareholder value. EVA is the economic value in accounting term that has the
rate of return on invested capital. It is a value generated through the fund invested by the
52 | P a g e
shareholders in a project / business operation. If the value of EVA is negative which indicate the
negative outcome of business operation and management needs to understand all those matter of
negative impact on business. It has been described the measurement of benefits of marketing
value impact on it to calculate the actual return on capital and the cost assigned to capital. A
positive economic value provides the more resource and it is also the indication of long term
goals achievement. Value based management has been created the significant values to address
the whole institution / organization.
The banking sector in India can grow their services and products through understanding of both
financial and market based resources and risk factors. The consumer are also the main factors
that has been described by the value management and marketing management in order to address
all those issues related with such matter. The EVA (Economic Value Added) explain the
financial terms with regards to shareholder value to describe the basic or minimum return on
capital required by company owners in business operation / invested amount in the business. The
minimum amount of capital can be calculated through risk management such as WACC, Beta,
cost of equity (Kce), cost of debt after tax (Kd(1-t)). The value management approach also
includes the stakeholder analysis, value analysis, FAST analysis, risk cost benefit analysis,
Pareto analysis and Process Mapping to address and analyze the value creation management
process for shareholders. The other is the market based analysis such as shareholder value,
customer value, employee value, supplier value and societal value. All of the above mentioned
financial and market based analysis provides the banking sector or any other organization to
understand the risk factor and opportunities in the given market. These analysis provides them
assessment to control the structure in time and to manage the resources with full of command in
order to complete the project operation and to increase the ultimately value of shareholder.
Banking industry in India is undergoing a rapid metamorphosis. Their role of a traditional banker
has been replaced with financial services provider for the clients. Most of the PSU and private
sector banks in India have already started looking at their portfolio of services offered and what
they should do in the future for remaining competitive in the industry. As public sector banks are
likely to undergo major consolidation, suddenly for many Indian banks things have changed. The
following factors of interpretation serve the purpose of analysing the overall concern of proving
the study. The public sector banks lead the private banks when NOPAT is emphasized in terms
of the analysis where SBI was in the front spot for each year respectively as it is the leading bank

53 | P a g e
of India. Considerable Capital investment has been made by both public and private sector
banks. ROIC gave a marginal importance to public sector bank compared to private sector in all
the years. WACC gave equal importance to both the public sector and private sector banks.
Only BOB has created a positive value in EVA in percentage terms as well as in rupees terms.
Public sector banks had a bit more effectiveness compared to private banks due to higher
NOPAT compared to private sector banks.
Key Findings
After the detailed analysis of financial data and qualitative information of the selected banks, we
have derived the following findings,
After bearing all the expenditures including firms’ return to all stakeholders, the
remaining wealth i.e. EVA is accumulated by the shareholders after being reinvested so
as to create an increment in its wealth resources.
Only BOB has created EVA consistently and value addition for its shareholders for 3
years.
All banks are creating shareholders’ value in terms of reinvestment of the remaining
profit into the business which will surely influence the stock prices in future.
The reinvestment criteria and its impact will be a great deal for the firm’s expected
success and value creations for the firm in the mere future.
54 | P a g e
Bibliography
Al-Yami, A. (2008) An integrated approach to value management and sustainable construction
during strategic briefing, Saudi Arabia: Loughborough University Institutional.
Atkinson, J. and Jourdan, C. (2008) A practical guide to risk assessment, United States:
Pricewaterhouse Coopers.
Bartolomei, J.E. and Miller, T. (2001) Function Analysis System Technique (FAST) Function
Analysis System Technique (FAST), United States: United States Air Force.
Brimacombe, A., Cotter, B.C. and Timmermans, K. (2011) Supplier Relationships: Cracking the
value code, USA: Accenture.
Clerck, F.D. (2003) Ethical banking, Belgium: Social Banking Organization.
Coetzee, L. (2009) VALUE MANAGEMENT IN THE CONSTRUCTION INDUSTRYWHAT
DOES IT ENTAIL AND IS IT A WORTHWHILE PRACTICE?, South Africa: University of
Pretoria.
Day, George and Liam Fahey (1988), "Valuing Market Strategies," Journal of Marketing, 52
(July), 45-57.
DepartmentF&AAustralia (2006) Handbook of Cost-Benefit Analysis, Australia: Department of
Finance and Administration.
Durant, M. (1999) Economic Value Added: The Invisible Hand at Work, United States of
America: Credit Research Foundation.
Dyer, J.H. and Chu, W. (1997) The economic value of trust in supplier-buyer relations,
Pennsylvania: University of Pennsylvania.
Engel, J.F., Blackwell, R.D. and Miniard, P. W. (1990), Consumer Behavior, 6th ed., Dryden,
Chicago, IL
EuropeanCentralBank (2001) Fair value accounting in the banking sector, Germany: ECB.
FAO (2006) Stakeholders Analysis, European Union.
Gacheru, D. (2012) Employee Value Proposition, Africa: KPMG.
Gross, S. (2006) Banks and shareholder value - An overview of banks valuation and empirical
evidance on shareholder value for banks., Dt. University Verlag.
Grönroos, C. (1992), “Facing the challenge of service competition: the economies of service”, in
Kunst, P. and Lemmink, J. (Eds), Quality Management in Services, Van Gorcum, Assen/
Maastricht, pp. 129-40

55 | P a g e
Hall, B. (1994) ‘Corporate restructuring and investment horizons in the United States, 1976–
1987’, Business History Review 68(1): 110–43.
Hall, Bnd Liebman, J. (1997) ‘Are CEOs really paid like bureaucrats?’, NBER Working Paper
Series no. 6213.
Haughey, D. (2014) Pareto Analysis Step by Step, [Online], Available:
http://www.projectsmart.co.uk/pareto-analysis-step-by-step.php [4 July 2014].
Heskett, J.L., Jones, T.O., Loveman, G.W., Sasser, W.E. and Schlesinger, L.A. (1994), “Putting
the service-profit chain to work”, Harvard Business Review, March-April, pp. 164-74
Horsky, D., S. Misra, P. Nelson. 2006. Observed and unobserved preference heterogeneity in
brand-choice models. Marketing Sci. 25(4) 322–335,
Howard, D. (2003) The Basics of deployment flowcharting & process mapping, United
Kingdom: Management-NewStyle.
Hunt, Shelby D. (1983), Marketing Theory: The Philosophy of Marketing Science. Homewood,
IL: Richard D. Irwin.
Kartono, B., V. R. Rao. 2005. Linking consumer-based brand equity to market performance: An
integrated approach to brand equity management.Working paper, Cornell University, Ithaca, NY.
Koller, T., Goedhart, M. and Weseels, D. (2010) Valuation - Measuring and managing the value
of companies, University edition edn.
Levitan, B. (2010) Cost Benefits analysis, United Kingdom: MMU.
Makelainen, E. and Roztocki, N. (1998) Economic Value Added (EVA) for Small Business,
Europe: EVA Nomics.
McKenna, R. (1991), Relationship Marketing – Successful Strategies for the Age of the
Customer, Addison-Wesley, Reading, MA
McNamara, J. (2007) Risk Analysis, United States.
McKenna, R. (1991), Relationship Marketing – Successful Strategies for the Age of the
Customer, Addison-Wesley, Reading, MA
Monroe, K.B. (1991), Pricing – Making Profitable Decisions, McGraw-Hill, New York, NY
Narver, John C. and Stanley F. Slater (1990), "The Effect of a Mar- keting Orientation on
Business Performance," JourLnal of Mar- keting, 54 (October), 20-35.

56 | P a g e
Onut, S. and Erdem, I. (2002) Management in Banking sector and a model design for banking
performance enhancement, Yildiz Technical University.
Peter, J.P. and Olson, J.C.(1993), Consumer Behavior and Marketing Strategy, 3rd ed., Irwin,
Homewood, IL.
Pakalen, N. (2009) MAXIMIZING SHAREHOLDER VALUE OR MANAGEMENT'S
PRESTIGE?, Finland: Helsinki School of Economics.
Pinto, F. (2001) Economic Value Added, [Online], Available: http//:www.evanomics.com [3 July
2014].
Porter, M. (1985), Competitive Advantage – Creating and Sustaining Superior Performance, Free
Press, New York, NY
Quay, B. (2009) Employee value propositions: A key marketing tool for talent management,
Kingston: Brand Learning.
Rabbi, M. (2012) Value Analysis (VA) for Excellence in Managing Projects, Canada: APEGA.
Roca, R. and Manta, F. (2010) Values Added: The challenge of integrating Human Rights into
the Financial Sector, Denmark: The Danish Institute for Human Rights.
Schmeer, K. (1999) Guidelines for conducting a stakeholder analysis, United States of America:
Abt Associates Inc.
Srinivasan, V., C. S. Park, D. R. Chang, 2005, An approach to the measurement, analysis and
prediction of brand equity and its sources. Management Sci. 51(9) 1433–1448.
Stewart, M. (1990) The quest for value, New York: Harper.
Stewart, S. (1991) The quest for value: the EVA management guide, New York: Harperbusiness.
Tettey, I. (2008) INVESTIGATING SHAREHOLDERS’ ECONOMIC VALUE CREATION IN
THE BANKING INDUSTRY, UK: Bleking Institute of Technology.
Waddock, S.: 2000, ‘The Multiple Bottom Lines of Corporate Citizenship: Social Investing,
Reputation, and Responsibility Audits’, Business & Society Review 105(3), 323–346
Walter, A., Ritter, T. and Gemunden, H.G. (2001) 'Value Creation in Byuer-Seller
Relationships', Industrial Marketing Management, vol. 30, pp. 365-377.
Wandahl, S. (2005) Value in Building, Denmark: Alborg University.
Webster (1992), "The Changing Role of Marketing in the Corpora- tion," Journal of Marketing,
56 (October), 1-17.

57 | P a g e
Wikström, S. and Normann, R. (1994), Knowledge and Value – a New Perspective on Corporate
Transformation, Routledge, London
Wixson, J.R. (1999) Function Analysis and Decomposistion using Function Analysis Systems
Technique, United States: Lockheed-Martin Idaho Technologies Company, Inc.
Worthington, A.C. and West, T. (2001) Economic Value-Added: A Review of the Theoretical and
Empirical Literature, Australia: Queensland University of Technology.
www.dot.ca.gov (2013) Value Analysis, [Online], Available:
http://www.dot.ca.gov/hq/oppd/pdpm/chap_pdf/chapt19.pdf [4 July 2014]
Young, D.S. and O'Byrne, S.F. (2001) EVA and valuebased management, McGraw-Hill.
Zeithaml, V.A. (1988), “Consumer perceptions of price, quality and value: a means-end model
and synthesis of evidence”, Journal of Marketing, Vol. 52, July, pp. 2-22.