do investors benefit from selective access to management?
TRANSCRIPT

Do Investors Benefit from Selective Access to Management?
Brian J. Bushee The Wharton School
University of Pennsylvania 1300 Steinberg-Dietrich Hall Philadelphia, PA 19104-6365 [email protected]
Michael J. Jung Leonard N. Stern School of Business
New York University 44 West 4th St.
New York, NY 10012-1126 [email protected]
Gregory S. Miller Stephen M. Ross School of Business
University of Michigan 701 Tappan St.
Ann Arbor, MI 48109-1234 [email protected]
July 2011
We thank Sanjeev Bhojaj, Christian Leuz, Brian Miller, Michael Minnis, James Myers, Jonathan Rogers, Shyam Sunder, and workshop participants at Cornell University, Emory University, Indiana University, University of Arkansas, University of Chicago, University of Florida, University of Pennsylvania Law School, University of Southern California, and Yale University. We also thank Maria Aguilar Paredes, Lyndsey Bunting, Jack Chen, Jillian Cohn, Ashley Hamilton, Sammi Liu, and Crystal Lu for research assistance. We are grateful for the funding of this research by the Wharton School.

Do Investors Benefit from Selective Access to Management?
Abstract
We examine whether investors benefit from “selective access” to corporate managers, which we define as the opportunity for investors to meet privately with management in individual or small-group settings. We focus on two potential opportunities for selective access advantages at invitation-only investor conferences: formal “off-line” meetings outside of the webcast presentation and CEO attendance at the conference. We find significant increases in trade sizes during the hours when firms provide off-line access to investors and after the presentation when the CEO is present, consistent with selective access providing investors with information that they perceive to be valuable enough to trade upon. We also find significant potential trading gains over three- to 30-day horizons after the conference for firms providing formal off-line access, suggesting that selective access can lead to profitable trading opportunities. While we cannot conclusively determine that managers are providing selective disclosure in these off-line settings, our evidence does suggest that selective access to management conveys more benefits to investors than public access even in the post-Reg FD period.
1
1. Introduction
Regulation Fair Disclosure (Reg FD) was enacted in October 2000 to stop the practice of
selective disclosure of information by managers to investors and analysts. Numerous studies
document a significant impact of Reg FD on firms’ disclosure practices and information
environment.1 However, Reg FD does not prohibit “selective access,” which we define as the
opportunity for investors to meet privately with management in individual or small-group
settings. Since 2000, there has been substantial growth in invitation-only investor conferences.
While managerial presentations at such conferences are generally webcast to allow access to
those not attending the conference (and thus comply with Reg FD), the invited investors are
often able to meet with managers outside of the presentation. This selective access potentially
conveys an information advantage by allowing attendees to ask specific questions to elicit
“mosaic” information that is valuable only in combination with their private information, to
assess nonverbal cues in a less-rehearsed setting, and to possibly benefit from intentional or
inadvertent material disclosures by managers. While we cannot identify the specific source of
selective access advantages, we can test whether investors exploit private access to execute
larger and more profitable trades. We examine whether two potential opportunities for selective
access advantages at conferences—formal “off-line” meetings and CEO attendance—are
associated with larger trade sizes and more profitable trades during the selective access periods.
Investor conferences are a common setting for corporate managers to communicate with
market participants. These conferences are generally multi-firm events that are sponsored by
outside entities, such as brokerage firms. Unlike other forms of voluntary disclosure, conference
presentations are not tied to a specific information event, such as earnings announcements.
1 A partial list of these studies includes: Heflin, Subramanyam and Zhang [2003], Bailey, Li, Mao and Zhong [2003], Bushee, Matsumoto and Miller [2004], Eleswarapu, Thompson and Venkataraman [2004], Francis, Nanda and Wang [2006], Wang [2007], and Duarte, Han, Harford and Young [2008].

2
Rather, the presentation’s goal is to provide a broader, more qualitative picture of the company
in order to build visibility and maintain transparency. Despite this goal, prior work suggests that
conference presentations produce significant market reactions (Francis, Hannah, and Philbrick
[1997], Bushee, Jung, and Miller [2011]).
We examine a sample of 7,668 conference presentations between 2003 and 2008 with
available transcripts. From the transcripts, we identify that about half of the conferences
schedule formal off-line meetings outside of the webcast presentation. Some conferences
schedule “one-on-one meetings” between select investors and managers throughout the
conference day and others provide “breakout sessions” in another room immediately after the
presentation ends. During these off-line sessions, investors can ask specific questions to
supplement their private information without revealing that information to other investors in a
public setting. Investors can also assess nonverbal cues in managers’ responses (or
nonresponses) to questions in a less-rehearsed setting. While managers are advised to take
particular care not to release material information during these meetings (Cooley Godward
[2000]), managers could intentionally or inadvertently selectively disclose information in these
settings. Thus, relative to conference presentations without formal off-line access, we expect
that one-on-one meetings (breakout sessions) confer selective access advantages to investors
throughout the day (after the presentation).
We also use the transcripts to identify the highest-ranking officer representing the
company at the conference. The CEO has the broadest knowledge of the company and, hence,
the greatest amount of private information about future strategic actions and performance. The
CFO has more detailed knowledge about earnings and other financial metrics. However,
financial information is discussed extensively during conference calls after earnings
3
announcements, so other than updates to guidance, there is less potential new information that
the CFO could provide at a conference. Occasionally, companies only send functional managers
(e.g., VP of Marketing), which are likely to have the least beneficial impact on investors due to
their narrow range of knowledge about the firm. We expect that the ability to meet with the
CEO, either in formal meetings or casually “in the hallway” after the presentation, confers
greater selective access advantages to investors than when the CFO or a lower-level officer is
representing the company.
We first test for selective access advantages using changes in trade sizes. Given that
larger trade sizes reflect both greater institutional investor trading and more information-based
trading, we expect that average trade sizes and the percent of large trades will increase when
investors believe that selective access has given them an information advantage.2 We use a
differences-in-differences research design with the inclusion of a large number of control
variables. We first use the firm as its own control by computing changes in trade sizes between
the period around the presentation and the same time and day one week prior. Then, we compare
these changes for firms providing selective access advantages (i.e., one-on-one meetings,
breakout sessions, or CEO attendance) to firms providing only presentation access or only
sending a lower-level officer. We estimate these comparisons in a regression that includes 20
control variables for the information content of the presentation and for firm characteristics that
could be correlated with the provision of selective access.
We find significantly greater increases in trade sizes in the hours before and after the
presentation for firms providing one-on-one access and in the hours after the presentation for
firms providing breakout sessions. We also find significantly greater increases in trade sizes in
2 Consistent with this notion, Frankel, Johnson and Skinner [1999] find increases in trade size for restricted-access conference calls prior to Reg FD.

4
the hours after the presentation when the CEO is present. This evidence is consistent with
selective access through formal off-line meetings and CEO attendance providing investors with
information during those meetings that they perceive to be valuable enough to trade upon.
To provide evidence on whether selective access leads to profitable trading opportunities,
we examine potential trading gains for horizons starting two hours after the presentation through
three days to one year after the presentation. We measure potential trading gains by interacting
future size-adjusted returns with an indicator for abnormal net buys during the selective access
period. We classify each trade as a buy or sell using the Lee and Ready [2001] algorithm with a
zero-second delay between trades and quotes (Rogers [2008]). We compute abnormal net buys
as the difference between net buys in the two hours after the presentation and the same period
one week earlier. Potential trading gains are positive when abnormal net buys (sells) precede
positive (negative) future returns. If selective access provides profitable trading opportunities,
we expect that potential trading gains for presentations with off-line access or CEO attendance
will be greater than for other presentations.
We find that firms providing off-line access experience significantly greater potential
trading gains over three- to 30-day horizons after the presentation than firms only providing
presentations. This evidence is consistent with investors trading based on information gained in
the off-line meetings that becomes impounded in price in the short-term, likely via the next
earnings announcement or a subsequent presentation. There is no evidence of significant
potential trading gains based on CEO attendance. Thus, in the case of off-line access, investors
are not only changing their beliefs based on their private access to management, but their trades
appear to be profitable over a short horizon.

5
This paper contributes to the literature by documenting the existence of potential
selective access advantages stemming from private meetings between managers and investors
and from private interactions with the CEO. We find that investors exploit their selective access
to management to execute larger and more profitable trades. While we cannot determine
conclusively that managers are violating Reg FD by providing selective disclosure in these
settings, our evidence does suggest that selective access to management conveys more benefits to
investors than public access to management even in the post-Reg FD period.
The remainder of the paper is structured as follows. In section 2, we provide institutional
background on conferences, review prior literature, and develop our hypotheses. Section 3
describes the sample and descriptive statistics. Section 4 presents our empirical results and
Section 5 concludes.
2. Literature Review and Hypotheses
2.1 Overview of conferences
Conferences typically bring together a large number of companies to the same location
for a series of management presentations to an audience invited by the conference sponsor. Reg
FD does not preclude limited-access conferences; however, managers are still subject to
restrictions on selective disclosure of material information.3 To reduce concerns about violations
of Reg FD, companies announce their scheduled conference presentations weeks in advance and
3 The SEC does not define “material information” and firms have some latitude to discuss details of the business and fill in the “mosaic” of information without violating Reg FD (Cooley Godward [2000]). In 2005, a district court judge dismissed an SEC claim that Siebel Systems violated Reg FD during a conference presentation, saying (in part) “Regulation FD does not require that corporate officials only utter verbatim statements that were previously publicly made.” Further, the judge argued that “Although stock movement is a relevant factor to be considered in making the determination as to materiality, it is not, however, a sufficient factor alone to establish materiality” and that “the actions taken by those in attendance at the speaking engagement, although a relevant consideration, do not change the nature or content of statements” (SEC v. Siebel Systems, et al. [2005]). As this court ruling shows, it is difficult for the SEC, companies, and researchers to determine whether Reg FD has been violated.

6
often provide webcasts and/or subsequent transcripts. The presentations typically last 30-45
minutes and their format and topic are flexible depending on the interests of management and
investors. Generally, a CEO or CFO makes prepared remarks and then takes questions from the
audience; although some managers use the full time for Q&A. After the scheduled presentation,
participants can often continue conversations with management in the halls and during meals.
The majority of conferences are sponsored by brokerage firms and organized by their
sell-side analysts.4 Brokerage firms host a variety of conferences each year to bring together
their buy-side clients with their corporate clients.5 The key motivation for hosting conferences is
to generate revenue for the brokerage firm. Conferences encourage information flow, which
generates trading volume and commissions for the trading desk. Moreover, invitations to a
conference are often extended only to the brokerage firm’s most important buy-side clients. This
type of “value-added” service is particularly important for sell-side analysts because they can no
longer provide private information (gained through selective disclosure) to clients in a post-Reg
FD world. Consequently, conferences hosted by analyst societies, which were prevalent in the
pre-Reg FD era (Francis, et al. [1997]), have waned in popularity as most analysts now choose to
host conferences sponsored by their brokerage firms, to the exclusion of other analysts.
Thousands of buy-side analysts and portfolio managers attend conferences each year
because they provide a low-cost forum to meet face-to-face with a large number of corporate
4 Bushee, et al. [2011] classifies sponsors into two broad categories. “Capital market” conferences are organized to provide access to management for select investors and analysts and comprise about 90% of all conferences (with 85% hosted by brokerage firms and 5% hosted by analyst societies, investor relations firms, and stock exchanges). “Product market” conferences are organized to facilitate management communications with business partners; they comprise the remaining 10% of conferences. We do not examine product market conferences in this paper because they are not geared toward the demands of investors and generally do not provide formal off-line access. 5 For example, Bear, Stearns & Co. hosted nineteen investor conferences in 2007 alone, which were organized based on industries (e.g., healthcare, energy), sectors (e.g., small cap, high yield), and regions (e.g., India).

7
managers (Jackson [2007]).6 Such meetings allow institutional investors to evaluate a
company’s prospects, assess management’s credibility, and gather new private information about
the companies they follow. While investors could save the time and cost of attending a
conference by listening to the webcast, attendance at the conference allows investors to interact
with management outside of the presentation and to observe other sophisticated investors’
reactions to the discussions. In doing so, investors can supplement their own private information
with higher-order beliefs or nonverbal cues obtained from observing all of the interactions
among management and the audience members (Bushee, et al. [2011]).7
Companies devote significant time and effort to present at conferences; they do not get
paid to present. By frequently presenting at conferences, managers commit to greater
transparency, which should decrease information asymmetry and uncertainty regarding the
firm’s expected future cash flows (Diamond and Verrecchia [1991], Easley and O’Hara [2004],
Lambert, Leuz, and Verrecchia [2007]). Large firms are particularly active conference
presenters, suggesting they are trying to meet investor demand for accessibility and transparency
(Jackson [2007]). Consistent with this notion, Graham, Harvey, and Rajgopal [2005] provide
survey data showing that managers want to cultivate relationships and develop reputations with
institutional investors. Bushee, et al. [2011] document that firms presenting at conferences tend
to be large firms with above-average growth, high institutional investor and analyst following,
positive prior stock returns, and high share turnover. Markov, Muslu, and Subasi [2010] find
that smaller companies are added to conferences when analysts intend to initiate coverage.
6 From 2003 to 2008, institutional investors consistently ranked “management access” as one of the top attributes when voting for sell-side analysts and brokerage firms in Institutional Investor’s annual survey of All-Star Analysts. Moreover, a recent survey indicated that one-third of the portion of commission payments used to compensate brokerage firms is to reward brokers for corporate access, including the facilitation of meetings between the buy-side and company management and invitations to conferences (Greenwich Associates [2010]). 7 For example, when a Juniper Networks conference presentation was followed by a 9% price drop, one commentator concluded that the verbal statements seemed “a tad innocuous” and speculated that “Mr. Johnson’s body language spoke louder than his words” (Kansas [2011]).

8
2.2 Prior literature
Prior research finds significant short-term stock return and trading volume reactions to
conference presentations. Francis, et al. [1997] study a sample of 1,199 presentations to the New
York Society of Security Analysts during a pre-Reg FD period (1986-1992) and find significant
positive abnormal returns on the presentation date. Bushee, et al. [2011] examine a sample of
95,105 presentations made at conferences sponsored by 849 different organizations from 1999 to
2007. They find significant cross-sectional variation in the abnormal absolute returns and share
turnover to the presentation based on conference characteristics, suggesting that the amount of
information impounded into stock price is a function of the conference sponsor, location, size,
and industry-focus. Markov, et al. [2010] find evidence that analysts use conferences to
facilitate a price run-up in the stocks of companies for which they intend to initiate coverage.
Finally, Solomon and Soltes (2011) examine a sample of all investor meetings held by a single
firm over a six-year period, which includes conference presentations. They find larger
correlations in the trades across investors who met with managers during the same quarter than
in quarters when meetings did not take place, suggesting that investor meetings facilitate
informed trading.
The form of voluntary disclosure most similar to conference presentations is conference
calls. Prior work finds that conference calls provide information incremental to the news in the
corresponding earnings release (Frankel et al. [1999], Bowen, Davis, and Matsumoto [2002]). In
the period prior to Reg FD, when conference calls were generally invitation-only, Frankel et al.
[1999] provide evidence that large investors benefited by trading in real-time on the information
released during conference calls. Bushee, et al. [2003, 2004] find that conference calls providing
open access, both pre- and post-Reg FD, are associated with a greater percentage increase in

9
small trades and higher price volatility, suggesting that open access stimulates a broader set of
investors to trade on the information.
Although conference presentations are similar to conference calls in some aspects, there
are key differences, making it difficult to generalize findings from the conference call literature.
First, presentations are not usually tied to a specific earnings announcement.8 Rather, the goal of
conference presentations is often to maintain or increase visibility for the firm using public data,
rather than to provide any new information to the market (Bushee, et al. [2011]). Second,
managers have less control over the questions during the presentation than during a conference
call, for which there is evidence that managers discriminate based on the favorableness of the
analyst (Mayew [2008]). Third, conferences attract many institutional investors to the same
location, enabling higher order beliefs to be observed (see, e.g., Morris and Shin [2003]). This
environment could trigger a larger market reaction if some investors buy or sell based on
observing the reactions of other conference participants. Finally, the scheduled portion of a
presentation can be heard by all investors, but any discussions before or after the presentation are
only available to the subset of attending institutional investors. We focus on this selective access
aspect in our empirical tests.
2.3 Formal off-line access
While all conferences provide the possibility for attendees to have private discussions
with managers outside of the presentation, some conferences have scheduled meetings between
management and attendees after the end of the presentation in “breakout” sessions or throughout
the day in “one-on-one meetings” (see Appendix for examples). The decision to provide these
formal meetings outside of the presentation is generally made by the conference sponsor, who
must reserve the meeting space to facilitate these meetings. In fact, off-line meetings are 8 In contrast, Frankel, et al. [1999] found that 85% of their sample calls were related to earnings announcements.

10
sometimes marketed in the name of the conference itself (e.g., “J.P. Morgan West Coast
International 1-on-1 Equities Conference”).9 These formal off-line sessions allow us to cleanly
identify periods when certain investors have selective access to management, and thus test for
any advantages conferred by selective access.10
There are a number of potential sources for selective access advantages during off-line
meetings. First, managers could explicitly disclose material information in violation of Reg FD.
Managers may intentionally decide to disclose material information during off-line sessions to
reward favored investors or to "guide" investors toward the proper valuation of the company
without incurring the proprietary costs of public disclosure. Alternatively, managers may
inadvertently reveal more information than they intended if they "let their guard down" in the
off-line sessions. Second, off-line access could facilitate information gathering efforts of
sophisticated investors. Investors may feel more comfortable asking questions that fill in the
“mosaic” around their private information in off-line settings that do not reveal their private
information to other traders. Thus, while the information the manager provides would not be
material on its own, it would allow the investors to update their private information and trigger
trades. Third, investors could update their private information based on inferences from
nonverbal cues, such as managers avoiding answering a certain question or exhibiting body
language or verbal tone suggesting they are hiding information. These cues are likely more
pronounced in the off-line meetings than in the more-rehearsed presentation. Several of these
9 While the conference sponsor decides to provide this format, companies can opt out of the meetings. The most common reason for opting out is that the company is in a “quiet period” just before an earnings announcement and does not want to risk providing material information in one of these off-line settings. Thus, when classifying presentations based on the opportunities for off-line access, we will assume that off-line meetings are determined at the conference level, but we will remove companies that we believe are in a quiet period. 10 It is important to note that formal off-line access during a conference is not the only possible venue for selective access. Managers could also be directly and privately communicating with investors at various points throughout the conference or through other venues like road shows, plant tours, and phone calls (Solomon and Soltes [2011]). The advantage of the formal off-line access setting is that we can identify when selective access is occurring, but any advantages we document likely represent a lower bound for the potential benefits to selective access.

11
sources indicate that selective access advantages could occur even when managers do not
disclose new material information. Thus, any apparent selective access advantages do not
necessarily represent selective disclosure in violation of Reg FD; rather, they indicate that private
access to managers is more valuable to investors than public access.
We expect that one-on-one meetings provide certain investors a selective access
advantage throughout the trading day, whereas breakout sessions concentrate that access
advantage in the period immediately after the presentation. Thus, compared to presentations
with no formal off-line meetings, we predict greater selective access advantages before and after
the presentation for conferences with one-on-one meetings and greater advantages immediately
after the presentation for conferences with break-out sessions:
H1: Investors attending the conference have greater selective access advantages during the periods before and after the presentation for companies providing one-on-one meetings relative to companies with no formal off-line meetings.
H2: Investors attending the conference have greater selective access advantages
during the period after the presentation for companies providing break-out sessions relative to companies with no formal off-line meetings.
2.4 Top-ranking corporate officer
Selective access advantages could also be related to which officer represents the
company. The CEO has the broadest knowledge of all facets of the company. Given the
common focus on qualitative strategic or forward-looking information at conferences, the CEO
is likely to be the most desired officer for investors to meet. The CFO has the most detailed
knowledge of the financial reporting aspects of the company’s information set. However, such
information is discussed extensively during conference calls after earnings announcements, so
other than updates to guidance, there is less potential new “hard” information that the CFO could
provide at a conference. Finally, the company could send a functional officer, such as a VP of

12
Technology or VP of Marketing. While these officers have detailed knowledge of their
functional areas, their lack of broader knowledge of the company should make them less in
demand for investors trying to supplement their private information.
Unless formal one-on-one meetings are arranged with managers prior to the presentation,
we expect that managers are generally unavailable prior to the presentation as they prepare for
the talk or are still in transit. After the presentation, participants have more opportunity to catch
managers in the hall, at the lavatory, or during meals to ask follow-up questions. Thus, we
expect that the identity of the officer has a bigger impact on the selective access advantages of
attendees in interactions immediately after the presentations. Given that CEOs have the greatest
amount of private information about the firms, especially with regards to future strategic actions,
we expect that the selective access advantages for participants are larger when the CEO is
present than when the CFO or some other officer is the top-ranked company representative.
H3: Investors attending the conference have greater selective access advantages during the period after the presentation for companies sending the CEO to the conference relative to companies sending a lower-ranked officer.
2.5 Measures of selective access advantages
We use two measures to test for the selective access advantages predicted in Hypotheses
1-3. First, we examine changes in trade sizes to provide evidence on whether the participants
believe they are getting valuable information during selective access periods, regardless of
whether the information is ultimately profitable. Prior empirical and theoretical work indicates
that trade size is a proxy for investors’ wealth and level of informedness (Cready [1988], Lee
[2002], Lee and Radhakrishna [2000], Easley and O'Hara [1987]). This evidence suggests that
institutional investors execute larger trades, on average, than individual investors; thus, trade
sizes should increase when only institutional investors have access to management. It also
13
suggests that investors increase their trade sizes when they experience significant revisions to
their beliefs, which again is more likely to happen when investors have access to management.
Consistent with this selective access, the prior literature on conference calls shows that when
access was restricted to sell-side analysts and institutional investors, trades sizes increased during
the call, suggesting that large investors with access to the calls were trading on the information
released during the calls (Frankel, et al. [1999]). We examine trade sizes before, during, and
after a presentation in a differences-in-differences research design. We expect that trade sizes
increase during periods that participants have selective access to management.11
Second, we examine potential trading gains to provide evidence on whether selective
access allows participants to execute profitable trades. Direct evidence on whether investors are
able to profitably exploit their access to managers is difficult to obtain because we can neither
identify the investors who receive selective access nor when they unwind their trades in the
future. We also do not know the horizon over which the investors’ trades would be profitable;
i.e., whether the private information will be revealed in the short-term or over the long-term. We
follow the approach of Asthana, Balsam, and Sankaraguruswamy [2004], who measure trading
gains by interacting future returns with the net buys during a trading period. We use the Lee and
Ready [2001] algorithm with a zero-second delay between trades and quotes (Rogers [2008]) to
identify whether each trade is a buy or sell and compute abnormal net buys as the difference
between net buys in the selective access period and in a control period. We then interact
abnormal net buys with future size-adjusted returns over various horizons to compute the
potential trading gain. If selective access allows investors to buy (sell) prior to positive
11 Using an algorithm to compare Spectrum and TAQ data, Campbell, Ramadorai, and Schwartz [2009] conclude that trades that are either under $2,000 or over $30,000 in size reveal institutional activity, whereas intermediate size trades reveal individual activity. If conference attendees are splitting their trades into small sizes, it reduces our power to find significant results using trade sizes.
14
(negative) information being revealed in price, we expect to find significant trading gains
following presentations that allow selective access.
3. Sample and Descriptive Statistics
3.1 Sample
We obtain data on conference presentations from the Thomson Financial Street Events
database. The data includes the firm name, ticker, conference name, date, time, and location of
each presentation. In the majority of cases, Thomson receives this data from the sponsor of the
conference; they supplement this data with their own collection efforts and with company
announcements of conference presentations. Thomson provides this data both to alert its
customers of upcoming conferences and to provide webcasts or transcripts of the presentation.
Our sample period is from 2003 to 2008 because Thomson did not collect time stamps for
the presentations prior to 2003 (see Panel A of Table 1). We only include presentations at US
conferences for which we have the requisite financial data from CRSP and COMPUSTAT. We
exclude presentations at product market conferences and those with missing time stamps.
Further, we require that the presentation start during trading hours and have at least 30 minutes
of trading; i.e., the start time is between 9:30AM and 3:30PM Eastern Time, inclusive. This
restriction ensures our results are not driven by differences between regular and after-hours
trading. To analyze intraday market behavior, we require data from the Trade and Quote (TAQ)
database. There are 37,408 presentations meeting these sample selection criteria.
To identify the presenting officers and off-line meetings, we collect transcripts for
presentations from Thomson Reuters. The company and conference jointly decide whether, and
how long, to archive transcripts on the Street Events site. Due to this limitation, most of our

15
transcripts are from the 2005-2008 period (see Panel B of Table 1). After requiring an available
transcript, our final sample consists of 7,668 presentations given by 1,552 unique firms.
Each transcript provides the names and titles of all of the company representatives at the
presentation. We use the title to classify the presentation based on the top ranking officer in
attendance. If any of the presenters’ titles are “Chief Executive Officer,” “Chairman of the
Board,” or “President,” we set the variable DCEO equal to one and zero otherwise. If DCEO
equals zero and any of the titles are “Chief Financial Officer” or “Vice President – Finance”, we
set the variable DCFO equal to one and zero otherwise. Finally, if DCEO and DCFO are both
equal to zero, then a lower-level officer was the top ranking officer at the conference. Panel C of
Table 1 shows that the CEO is the top ranking officer for 46.7% of the sample presentations and
the CFO is top ranking at 32.1%. While these statistics suggests that the CEO generally attends
conferences, it is also possible that transcripts are more likely to be archived when the CEO was
in attendance.
We also use the transcript to identify the presence of formal off-line meetings. First, we
search the transcripts for any mention of “one-on-one” or “breakout” (and all common variants).
We read these sections of the transcripts to see if these words actually refer to a one-on-one or
breakout session. Second, we look at the last few lines of the transcript to see whether it
mentions “moving to another room” or any other wording that would indicate a formal breakout
session. Next, for any presentation we code as having one-on-one meetings or a breakout
session, we also treat all other presentations at that conference as having had one-on-one
meetings or breakout sessions.12 This assumption reflects the fact that conferences often reserve
space at the meeting location for these sessions, making it likely that all firms could have
12 If we misclassify the presentations at the conference in which they do not mention one-on-one meetings or breakout sessions, it should work against us finding that off-line access has a significant impact on selective access advantages.
16
provided off-line access regardless of whether it is mentioned in transcript.13 Finally, once this
conference-level classification has been made, we exclude presentations from the classification if
(1) the transcript explicitly mentions that the firm is in a “quiet period”, (2) the transcript
explicitly mentions that there will be no breakout or one-on-one meetings, or (3) the presentation
date is within ten days of the firm’s earnings announcement date. Panel C of Table 1 shows that
44% of presentations do not have a formal off-line component, whereas 41% offer breakout
sessions (for which we define DBREAKOUT equal to one) and 15% offer one-on-one meetings
(for which we set D1ON1 equal to one). Panel C also shows that the roughly similar percentages
of top officers are represented for each type of off-line access.
3.2 Controls for Firm Characteristics and Information Content of Presentation
We supplement our differences-in-differences research design with the inclusion of a
number of control variables for firm characteristics and the information content of the actual
presentation. The firm characteristics control for any possible correlation between economic
characteristics of the firm and the decision to provide off-line access or send a CEO to the
presentation. By including proxies for the information content, we control for any possible
delayed response to the information content of the presentation, making it more likely that post-
presentation trade sizes or trading gains are related to selective access.
Table 2 shows descriptive statistics for the information content proxies and the firm
characteristics. First, Panel A provides descriptive statistics for the off-line access and top
officer indicator variables discussed in the prior section. Next, we include two proxies for the
information content of the presentation. We define the number of questions, LNQUEST, as the
log of the number of questions and answers during the presentation. The transcript identifies
13 If a conference offers both one-on-one sessions and a breakout session, we classify the conference as providing one-on-one sessions because our prediction is that one-on-one sessions will be associated with access advantages both before and after the presentation.

17
every time the speaker changes and we count the number of changes as a proxy for the number
of questions and answers. A greater number of questions during the presentation would suggest
a greater demand for specific pieces of information by conference participants and, hence, a
greater likelihood of more information being released during the formal presentation. We define
the abnormal absolute returns during the presentation hour, ABRET0, as the absolute value of
stock returns during the presentation less the same variable for the firm at the same time one
week prior, measured in percentage points. This variable captures the market’s assessment of the
information content of the presentation, and reflects not just the trading of investors at the
conference, but any investor that is listening to the webcast. Finally, to control for the possibility
that the trading is driven by a concurrent public information release, we collect earnings
announcement dates, management forecasts, and Form 8-K filings (including Form 6-K filings
for foreign registrants) for our sample firms. We create an indicator variable (DINFO_EVENT)
that equals one if any of these three events occur during the day of the presentation and zero
otherwise.
Panel A shows that the average number of questions and answers is around 16
(LNQUEST = 2.8) and the interquartile range is between 9 and 32 interchanges. Thus, the
presentations generally provide participants the opportunity to ask questions during the
presentation. The mean and median abnormal absolute returns are 0.06% (0.05%), indicating
that the abnormal return reaction is generally positive. Only 17% of presentations are
accompanied by another public information event (e.g., earnings announcement, management
forecast, or Form 8-K filing).
We also control for a large number of firm characteristics that Bushee, et al. [2011] find
are associated with invitations to present at conferences. We include firm size, defined as the log

18
of market value of equity (LMV) 30 days before the conference presentation. We measure
institutional investor following as the percentage ownership by institutional investors (PIH),
defined as total shares owned by institutions divided by the total shares outstanding at the most
recent calendar quarter end prior to the conference presentation. We measure analyst following
as the log of one plus the number of analysts issuing earnings forecasts (LNANL) for any horizon
during the calendar quarter prior to the conference presentation.14 We proxy for recent stock
market activity with the buy-and-hold market-adjusted stock return (ANNMAR) and the average
monthly share turnover (ANNTURN) for the year prior to 30 days before the presentation. We
include an indicator variable for companies headquartered outside the US (DFORFIRM).
We include a number of proxies for profitability and growth, including the earnings-price
ratio (EP), dividend yield (DP), the book-to-price ratio (BP), the most recent change in net
income (CNI), and the most recent annual sales growth (SGR). As a visibility proxy, we add an
indicator variable for whether the firm is listed on a Standard & Poor’s index (SPINDX). To
proxy for the complexity of a firm’s business, we include the ratio of intangible assets to total
assets (INTAN). We proxy for firm risk with a debt-to-assets leverage ratio (LEV), the standard
deviation of stock returns (STD), and beta (BETA). We proxy for firm age with the log of the
number of years the firm has been listed (LTIME).
Panel A of Table 2 shows that the sample firms tend to be large with high institutional
ownership (mean = 76%), high analyst following (mean = 15 analysts), and positive market-
adjusted returns in the prior year (median = 1.4%). Sample firms also tend to have positive
earnings and sales growth and a high level of intangibles (median = 20% of assets).
14 For both PIH and LNANL, we set the variable equal to zero for any period when the company is listed on an exchange but there is no data available.
19
In Panel B, we provide descriptive evidence of whether these controls for information
content or firm characteristics are associated with off-line access or the presenting officer. For
the sake of parsimony, we present two models in Panel B. In the first model, the dependent
variable is DOFFLINE, which equals one if the company provides formal off-line access (i.e.,
D1ON1 or DBREAKOUT equals one) and zero otherwise.15 In the second model, the dependent
variable is DCEO. We include year and industry fixed effects in the regressions but do not
report their coefficients.
Panel B of Table 2 shows that the company is more likely to send the CEO or CFO than a
lower-level officer when there is formal off-line access. Interestingly, the number of questions
during the presentation is lower when the company provides off-line access, suggesting that
investors hold their questions for the off-line meetings. Formal off-line access is also positively
associated with public information releases, suggesting that managers are more likely to issue
public releases during off-line access days to mitigate the risk of Reg FD violations. Larger
firms with greater institutional ownership are more likely to agree to provide off-line meetings,
as are firms that are less visible (not on the S&P 500) and have been listed for longer.
For CEO attendance, the number of questions is higher, consistent with a greater number
of investors seeking to ask questions of the CEO than other officers. CEO attendance is also
positively associated with public information releases, indicating that the CEO is more likely to
attend when the firm has material information to disclose. Smaller firms with less analyst
following, higher earnings growth, and greater intangibles are more likely to send the CEO (or
are more likely to retain the transcript when the CEO is in attendance). Overall, these results
suggest that a number of firm characteristics are associated with off-line access and the presence
15 We estimated models using D1ON1 and DBREAKOUT as separate dependent variables and found similar results.

20
of the CEO, but that generally different firm characteristics, on the margin, explain the access
and officer decisions. We will control for all of the variables in our regression analyses.
4. Empirical Results
4.1 Changes in Trade Sizes
4.1.1 Univariate evidence
First, we examine changes in trade sizes to provide evidence of selective access
advantages. We compute each of the trade size variables during the seven one-hour test intervals
around the presentation: three in advance of the presentation, one beginning at the start time of
the presentation, and three following the presentation.16 For each interval, we subtract the level
of the variable in a control period exactly one week before (i.e., the same day of the week and
time of day), resulting in a change variable for each of the seven intervals. This design controls
for time-of-day and day-of-week effects and also allows the firm to act as its own control.
Figure 1 illustrates the timeline of each measurement interval.
We define the change in average trade size (CLAVGSIZE) as the log of the average trade
size during the test interval minus the log of the average trade size in the control interval. Trade
sizes are measured in number of shares. We compute the change in the percent of large trades
(CLGTRADE) as the percent of large trades in the test interval minus the percent in the control
interval. We measure the percent of large trades as the number of large trades divided by total
trades and express the variable in percentage points. We classify large trades to be those greater
than $50,000, using the stock price at the beginning of the time interval to determine total trade
16 The hour window was chosen to be long enough to span the entire time of the presentation or off-line access session (most presentations last 30-45 minutes) and allow for some post-session trading within the window. Thus, an investor would not have to execute trades during the meeting with management to show up in the hour window; any trading immediately after the session would still likely show up in the appropriate one-hour window.

21
value (Lee [1992], Bushee, et al. [2003]). We winsorize outliers at 1% of each tail for these
variables.
Table 3 presents descriptive statistics for the change in trade size variables for all sample
presentations in the seven intervals surrounding the presentation. We only use test intervals that
occur on the same day as the presentation. Thus, the number of observations varies across test
intervals, ranging from around 4,600 in periods three hours from the presentation to around
7,000 in the hours immediately before and after the presentation.
Panel A of Table 3 shows that average trade sizes increase slightly in the two hours
before the presentation. Then, the changes in trade sizes become larger and more highly
significant during the presentation and the three hours afterward. Notably, the mean change in
average trade size is larger in magnitude in the two hours after the presentation (t1 and t2) than in
the hour of the presentation (t0). This result suggests that either a greater number of small traders
are trading during the presentation, but not after, or that the participants at the conference are
revising their beliefs about the firm to a greater degree after the presentation.
Panel A also shows that changes in the percent of large trades are significantly positive
during the hour of the presentation and the hour immediately after. The fact that the percent of
large trades increases during the presentation suggests that individual investors are not trading
heavily during the presentations, as their trades would significantly reduce the percent of large
trades. Similar to the evidence for trade sizes, the magnitude of the change in percent of large
trades is larger after the presentation than during, suggesting more belief revision after the
presentation. However, alternative explanations are that the larger trades are ordered during the
presentation but not executed until later or that investors making large trades take their time to
perform additional analysis after the presentation before execution. Our analysis looking at off-

22
line access will help address these alternative explanations as such delays should not be
systematically associated with off-line access.17
Panel B of Table 3 reports mean changes in trade sizes around the presentation
conditioned on off-line access. These means are also displayed graphically in Figure 2. For
companies providing one-on-one access to management, changes in average trade size are
significantly positive in all periods from two hours before the presentation to two hours after the
presentation, consistent with selective access to management throughout the day. For firms
providing breakout sessions, changes in average trade sizes are positive and significant at the
0.05 level only in the two hours after the presentation. Moreover, the change in average trade
size is more than double in magnitude in the hour after the presentation compared to the
presentation hour, indicating significant trading in response to the selective access provided by
the breakout session. As a benchmark, firms not providing formal off-line access only
experience positive increases in trade sizes that are significant at the 0.05 level in the hour after
the presentation. This result could be due to the fact that some managers “stick around to answer
questions in the hallway” (as they sometimes mention on the transcripts), but we code these
observations as providing no formal off-line access. The results for percent of large trades are
similar, with significantly more large trades before and after the presentation when one-on-one
sessions are provided, but only a greater percent after the presentation for breakout sessions.
Overall, these results provide univariate support for H1 and H2 that formal off-line access is
associated with selective access advantages.
17 Prior work suggests that these delays in trades are not prevalent around information events. Cready [1988] shows that the speed by which market participants process new information releases is increasing in investor’s wealth. In addition, the prior literature on conference calls suggests that traders, small and large, execute trades in real-time during the call period (Frankel, et al. [1999], Bushee, et al. [2003, 2004]).

23
Panel C of Table 3 reports mean changes in trade sizes around the presentation
conditioned on the top officer in attendance at the presentation. When the CEO is present,
changes in average trade size and percent of large trades are significantly positive during and
after the presentation. In contrast, there is little evidence of abnormal trade sizes when the CFO
or a lower-level officer is the top officer present, other than a significant increase in trade size in
the first hour after the presentation when the CFO is present. These results support H3 in
indicating that the presence of the CEO is associated with selective access advantages.
4.1.2 Regression Results
We adopt a differences-in-differences research design with additional control variables to
test the effect of selective access on trade sizes. Table 4 presents regressions of the changes in
trade sizes during various periods on indicator variables for off-line access and for the top
officer, as well as 20 control variables for the information content of the presentation and for
firm characteristics. We also include year and industry fixed effects in the regressions but do not
report their coefficients. All significance tests are based on clustered standard errors (Rogers
[1993]) and are one-tailed for our hypothesized relations; two-tailed otherwise. For parsimony,
we only report regressions for periods from two hours before the presentation (t-2) to two hours
after the presentation (t2).18
Panel A of Table 4 presents results for changes in average trade size (CLAVGSIZE).
First, among the control variables, presentations with a greater number of questions and with
larger absolute stock returns during the hour of the presentation exhibit significant increases in
trade sizes after the presentation. This finding suggests that presentations with greater
information content could result in delayed trading responses to the information or greater
18 The univariate evidence in Table 3 showed little evidence of significant changes in trade sizes, and much smaller sample sizes, in the periods three hours before and after the presentation. The regression results are similarly insignificant in these periods.

24
incentives to gather information after the presentation. Firms with concurrent public information
releases experience significant increases in trade sizes before and during the presentation, but not
after. Smaller, less visible firms with worse stock return performance in the prior year also have
significantly higher trade sizes after the presentation, which again could reflect greater
uncertainty about the presentation or incentives to gather information. This result also could
reflect the Markov, et al. [2010] finding that analysts place smaller firms in the conference to
hype them in advance of initiating coverage.
Turning to the main results, the coefficient on the indicator for one-on-one meetings
(D1ON1) is significant and positive in all periods before and after the presentation. Thus,
consistent with H1, selective access through one-on-one meetings results in larger trades
throughout the day compared to presentations without formal off-line access. Interestingly, the
coefficient on D1ON1 is also significantly positive during the presentation hour, suggesting that
investors with prior one-on-one access are updating their beliefs based on what they hear during
the presentation. The coefficient on the indicator for breakout sessions (DBREAKOUT) is
significantly positive only in the hour after the presentation when the breakout session occurs,
consistent with H2. For the top officer variables, the coefficient on the indicator for the presence
of the CEO is positive and significant in the two hours after the presentation, whereas the
indicator for CFO is never significant, consistent with the CEO providing the biggest selective
access advantage due to the CEO possessing the broadest information set about the firm’s future
direction (H3).
Panel B of Table 4 presents results for changes in the percent of large trades
(CLGTRADE). Similar to the results for average trade sizes, the absolute stock return reaction
during the presentation has a significantly positive impact on large trades after the presentation,

25
whereas the number of questions does not. Few of the firm characteristics significantly explain
changes in large trades around the presentation; the most significant and consistent result is that
firms with lower return volatility experience greater changes in large trades, which could reflect
a liquidity effect. The coefficient on D1ON1 is significant and positive in the two periods before
and after the presentation, consistent with H1. Consistent with H2 and H3, the coefficients on
DBREAKOUT and DCEO are positive and significant in the hour immediately after the
presentation. Although the significance levels are not as high for large trades as they are for
average trade size, they are still consistent with off-line access and the presenting officer creating
selective access advantages for conference participants.19
4.2 Potential trading gains
4.2.1 Univariate evidence
Next, we examine the potential gains that traders could have earned from selective access
by interacting future size-adjusted returns with an indicator for whether there are abnormal net
buys during the selective access period. We use the Lee and Ready [1991] algorithm to classify
each trade as a buy (sell) order when the trade price is above (below) the midpoint of the quoted
spread. When the trade price is at the midpoint, the trade is classified as a buy (sell) if the price
change immediately before the trade is positive (negative). Based on the evidence in Rogers
[2008], we use a zero-second lag to match trades to quotes. We compute net buys for each
interval as the difference between total buys and total sells. To measure selective access
advantages, we take the difference between net buys in the two hours after the presentation and
19 As a sensitivity analysis, we also included the conference characteristics examined in Bushee, et al. [2011]; specifically, the number of firms presenting at the conference and the indicators for top brokerage conferences, money centers conferences, “destination” conferences, and industry-focused conferences. None of these conference characteristics significantly explain changes in trade sizes in the hours around the presentation while the coefficients on D1ON1, DBREAKOUT, and DCEO retain their signs and significance levels. Thus, the offline access and top officer variables do not proxy for the conference characteristics studied by Bushee, et al. [2011].

26
the corresponding control periods to calculate abnormal net buys (see Figure 1).20 We set the
indicator variable NETBUYS equal to 1 if abnormal net buys are positive during the event period
and -1 otherwise.
To compute the potential trading gain (GAIN), we multiply the NETBUYS indicator times
the buy-and-hold size-adjusted returns (SAR) over various windows subsequent to the selective
access period.21 We compute size-adjusted returns by compounding the firm’s raw return
starting with the stock price two hours after the presentation (or at the end of the day if it comes
first) and ending at horizons three, 10, 15, 30, 60, and 252 trading days after the presentation.
We subtract the returns for the firm’s size decile from these returns, where we start the
compounding for the size portfolio at the start of the presentation date. A positive value of GAIN
indicates that investors are buying (selling) during the selective access period and subsequent
abnormal returns for the firm are positive (negative). Thus, we expect that presentations with
formal off-line access and CEO attendance are associated with a significantly larger GAIN than
presentations with no off-line access and lower-level officers.
Table 5 presents univariate evidence on the profitability of post-presentation trading.
Panel A shows the mean and median GAIN for horizons between three and 252 trading days after
the presentation for all sample presentations. None of the values of GAIN are significantly
different from zero, indicating that post-presentation trading, in general, is not profitable at any
20 If there is only one hour remaining in the trading day, we compute abnormal net buys based on one hour. By only using the period after the presentation to measure selective access advantages, we reduce our power to find results for one-on-one meetings, which also lead to trading prior to the presentation. When we compute net buys based on the hours both before and after the presentation, our results are similar, with the significance levels higher for one-on-one meetings and lower for breakout sessions (through still significant at the 0.10 level). 21 Asthana, et al. [2004] compute the GAIN variable using net buys as a percent of total trades, rather than with an indicator variable. The GAIN measure using the indicator variable represents the abnormal size-adjusted returns to any investor that bought or sold in the correct direction after the presentation, whereas the Asthana, et al. [2004] measure weights the future gain by the number of trades that were in the correct direction. We report the measure using the indicator because the coefficient is easier to interpret and because not every investor trading during the period has selective access, making the Asthana et al. [2004] measure not appropriate for our setting. Nevertheless, our results using their approach are similar in sign and significance for the off-line access and top officer variables.

27
point over the subsequent year. This evidence suggests that any information disclosed during the
presentation is impounded in price, on average, during the presentation period.
Panel B of Table 5 shows mean values of GAIN conditioned on formal off-line access.
Presentations with no formal off-line access have significantly negative values of GAIN for
horizons up to 30 days in the future. This result suggests that post-presentation trading tends to
lead to price pressure during the post-presentation period followed by subsequent price reversals.
For presentations with one-on-one meetings, there is a positive and significant GAIN of 0.3% in
the 3-10 days after the presentation that is also significantly different from the presentations with
no off-line access. This evidence is consistent with H1 in showing that selective access through
one-on-one meetings not only leads investors to make larger trades, but that the trades tend to be
profitable. For presentations with breakout sessions, there is a positive GAIN for horizons up to
60 days that is only significantly different from zero in the thirty-day horizon, but is significantly
greater than the GAIN for presentations without off-line access over the entire 60 days. This
result is consistent with H2 in showing that selective access advantages are also present in
breakout sessions. Notably, the GAIN values are not significantly different from zero for the
one-year horizon, and are also insignificant in 90 and 120 day horizons (not reported). This
evidence indicates that any information advantage obtained through selective access tends to be
short-term, with the information likely impounded into price during a subsequent earnings
announcement or conference presentation.
Panel C of Table 5 shows mean values of GAIN conditioned on the top officer in
attendance. Other than a positive ten-day GAIN that is marginally significantly different from
zero, there is no evidence of potential trading gains based on CEO attendance, contrary to H3.
Thus, while CEO attendance leads to significantly larger trades after the presentation, consistent

28
with selective access leading to significant belief revision among participants, these trades are
not profitable in the future. This evidence suggests either that participants incorrectly believe
they are getting valuable information from the CEO or that their trading during the selective
access period fully impounds their information into price, precluding any future abnormal returns
to the information.
4.2.2 Regression results
Table 6 presents results of regressions of GAIN over the various post-presentation
horizons on the indicators for off-line access, top officer, and all of the control variables from the
prior analyses. All significance tests are based on clustered standard errors (Rogers [1993]) and
are one-tailed for our hypothesized relations; two-tailed otherwise.
Panel A shows that few of the control variables significantly explain GAIN, which is
consistent with investors not being able to earn significant trading profits based on public
information. The indicator for one-on-one meetings (D1ON1) is positive and significant for
horizons up to 10 days, consistent with the univariate evidence and with H1. The three-day
GAIN represents a 0.6% abnormal size-adjusted return based on correctly trading during the
selective access period. Thus, an investor provided selective access to a series of ten one-one-
one meetings during a year would earn an abnormal return of 6%. The indicator for breakout
sessions (DBREAKOUT) is positive and significant for horizons up to 30 days, consistent with
the univariate evidence and with H2. The GAIN is 0.6% after 15 days and 0.8% after 30 days,
again showing that investors provided access to multiple breakout sessions during a year could
earn significant trading profits. Also consistent with the univariate evidence is the lack of
significance for the CEO variable over any horizon, which does not support H3 for this measure
of selective access advantages. Overall, the evidence is consistent with formal off-line access

29
providing a selective access advantage that manifests not only in larger trades during the
selective access period, but in potential future trading profits.
Another possible explanation for the results in Panel A is that off-line access is proxying
for firm volatility or some other omitted firm characteristic, rather than for information
advantages. In Panel B of Table 6, we estimate the same regressions using horizons prior to the
presentation. We compute GAIN by interacting post-presentation NETBUYS with absolute size-
adjusted returns for horizons starting 252, 120, 90, 60, 30, 15, and three days prior to the day
before the presentation and ending the day before the presentation. If the off-line access
indicators are proxying for more volatile firms or some other omitted variable, then they should
be significant in explaining prior absolute size-adjusted returns as well future returns. The
results in Panel B show that the coefficients on D1ON1 and DBREAKOUT are insignificant.
Thus, the significance of the off-line access variables in explaining future trading gains is likely
to be related to the selective access after the presentation, rather than to a volatility effect.
5. Conclusion
We investigate whether investors benefit from receiving selective access to management
at investor conferences. Presentations at investor conferences have become a prevalent venue for
managers to communicate with market participants in a face-to-face and interactive setting.
While conference presentations are generally available via real-time webcasts, attendance at the
conference is by invitation-only. Because some conferences provide opportunities for a select
group of participants to have direct interactions with management before and after the
presentation, they provide a powerful setting for examining whether investors benefit from

30
selective access to management. We examine whether formal “off-line” meetings and CEO
attendance confer selective access advantages to investors.
We find significant increases in trade sizes during the hours when firms provide off-line
access to investors, consistent with off-line access providing selective access advantages. We
also find significant increases in trade sizes after the presentation when the CEO is present,
consistent with CEO meetings providing selective access advantages. Finally, we find
significant potential trading gains for firms providing off-line access, suggesting such access is
profitable for investors. While we cannot conclusively state that managers are selectively
disclosing new information outside of the presentation, our evidence does suggest that investor
conferences confer a selective access advantage on the buy-side investors that have been invited
to attend. This evidence raises questions about whether conference presentations meet the spirit
of Reg FD in encouraging equal access to information across all investors.

31
Appendix Transcript Examples of Selective Access
Panel A: Examples of references to one-on-one meetings Beazer Homes USA Inc. at Goldman Sachs Housing Conference Feb. 12. 2007 / 2:00PM ET -------------------------------------------------------------------------------- Unidentified Audience Member [94] -------------------------------------------------------------------------------- Going back to production rates, can you talk about what you are seeing in terms of the private home builders? We spoke a few months ago and you all mentioned that there would continue to build to save the year. Wondering what you are seeing in the market now and what you expect if the spring selling season isn't as hot as you expect, do you still try to build with the hope that things pick up later in the year? -------------------------------------------------------------------------------- Ian McCarthy, Beazer Homes - CEO [95] -------------------------------------------------------------------------------- I think generally that is true, but I think there is a lot of private builders that don't have the discipline that is imposed on us by reporting to the public markets and so they can get out of whack. I told in the one-on-ones today a private builder in Atlanta who hasn't spoken to me for three years, he has been having a great time asked to meet me this week, so I am going to meet him on Wednesday and just what is up and try and get a view directly from a private builder. I think there will be a number of them out there who've built for wages; they get paid on the drawdown from their loans and that is how they really fund their business.
CSX at Deutsche Bank Securities Inc. Conference Feb. 17. 2005 / 2:30PM ET -------------------------------------------------------------------------------- Oscar Munoz, CSX Corp - EVP & CFO [2] -------------------------------------------------------------------------------- Thanks. Good afternoon. It's always nice to talk after four hours of one-on-one. … -------------------------------------------------------------------------------- Unidentified Audience Member [7] -------------------------------------------------------------------------------- Oscar, what are the three keys, as you see it, for tackling that operating issue -- operating ratio issue as we go through '05 and '06? -------------------------------------------------------------------------------- Oscar Munoz, CSX Corp - EVP & CFO [8] -------------------------------------------------------------------------------- I think first and foremost, it's really -- and for those of you that have been in the one-on-ones today, I apologize for the redundancy. But if you think of the thing we call the "one plan," if you think of a team that just got a new playbook, the one plan is the playbook. It's the diagram. It's the X's and O's of what you're supposed to do. That's in place. And we got a new coach and we got the new players, and so now we've got to practice. So we got a chance to practice it in the last half of last year and we had some success with it. And we had success in the kind of early and late fall and early winter. So the first quarter if you will. Now it's the second quarter and it's cold and not all aspects of that playbook work. I mean the long bomb doesn't work in icy fields, so we've got to learn to run shorter or whatever analogy I could use around that. And so I think sticking to that plan is critical for us in keeping true to the plan and the playbook that we've situated, first and foremost.

32
Appendix (Continued) Transcript Examples of Selective Access
Panel B: Examples of references to subsequent breakout sessions Freddie Mac at Bank of America Securities 37th Annual Investor Conference Sep. 17. 2007 / 11:30AM ET -------------------------------------------------------------------------------- Buddy Piszel, Freddie Mac - CFO [16] -------------------------------------------------------------------------------- Well, we look of our credit posturing by decile. At the bottom decile is where the bulk of delinquencies, the bulk of the losses are. I don't have the rates with us. Maybe we can go to the breakout I can give that to you. But there is concentration at the very low end of the book. The good news is a lot of that was purchased through the Alt A channel, a lot of it is on the Alt A side, and there we were able to price for it a lot better than we did in the overall book. I think we got to wrap, so we'll go to the breakout and I can take further questions there. -------------------------------------------------------------------------------- Robert Lacoursiere, Banc of America - Analyst [17] -------------------------------------------------------------------------------- Salon 4.
Gilead Sciences at BioCentury's: NewsMakers in the Biotech Industry Conference Sep. 06. 2007 / 11:30AM ET -------------------------------------------------------------------------------- Unidentified Speaker [1] -------------------------------------------------------------------------------- Our next presenting company is Gilead Sciences, whose second quarter 2007 revenues increased 53%, over $1 billion, driven largely by the growth of their HIV franchise, and they have two NDAs they're going to submit before the end of the year. Presenting for Gilead is the Executive Vice President of Commercial Operations, Kevin Young. And immediately following, there will be a breakout session in room 301. -------------------------------------------------------------------------------- Kevin Young, Gilead Sciences, Inc. - EVP of Commercial Operations [2] -------------------------------------------------------------------------------- … Finally, in terms of HIV, this is data you know from our Phase II Elvitegravir study. We showed equivalence at our 50 and 125 mg dose. And in fact, the 125 mg dose showed very rapid antiviral effect and sustained antiviral effect when it was on the back -- when an optimized antiviral background therapy. The question I'm sure that you will go into more detail in the breakout is, so, what are we doing in terms of moving to Phase III? …. Most of these milestones, I think, I have dealt with. The one, I think, we'll talk a little bit more about in the breakout is, obviously, our European approval of Atripla. We are still holding to our timeline of approval by the end of the year. We can discuss that in more detail.

33
References
Asthana, S., S. Balsam, and S. Sankaraguruswamy. “Differential Response of Small versus Large Investors to 10-K Filings on EDGAR” The Accounting Review 79 (2004): 571-589.
Bailey, W., H. Li, C. X. Mao, and R. Zhong, “Regulation Fair Disclosure and Earnings
Information: Market, Analyst, and Corporate Responses” The Journal of Finance 58 (2003): 2487-2515.
Bowen, R., A. Davis, and D. Matsumoto “Do Conference Calls Affect Analysts’ Forecasts?” The
Accounting Review 77 (2002): 285-316. Bushee, B., M. Jung, and G. Miller. “Capital Market Consequences of Conference
Presentations.” Working paper, The Wharton School. (2011) Bushee, B., D. Matsumoto, and G. Miller. “Open versus Closed Conference Calls: The
Determinants and Effects of Broadening Access to Disclosure.” Journal of Accounting and Economics 34 (2003): 149-180.
Bushee, B., D. Matsumoto, and G. Miller. “Managerial and Investor Responses to Disclosure
Regulation: The Case of Reg FD and Conference Calls.” The Accounting Review 79 (2004): 617-643.
Campbell, J., T. Ramadorai, and A. Schwartz. “Institutional Trading, Stock Returns, and
Earnings Announcements” Journal of Financial Economics 92 (2009): 66-91. Cooley Godward. “SEC Regulation FD: New Rules for Communicating with Analysts and
Investors” News from the Public Companies practice group. (2000). Cready, W. M. “Information value and investor wealth: The case of earnings announcements.”
Journal of Accounting Research 26 (1988): 1-27. Diamond, D., and R. Verrecchia. “Disclosure, Liquidity, and the Cost of Capital.” The Journal of
Finance 46 (4), (1991): 1325-1359. Duarte, J., X. Han, J. Harford, and L. Young. “Information Asymmetry, Information
Dissemination and the Effect of Regulation FD on the Cost of Capital” Journal of Financial Economics 87 (2008): 24-44.
Easley, D., and M. O'Hara. “Price, trade size, and information in securities markets.” Journal of
Financial Economics 19 (1987): 69-90. Easley, D., and M. O'Hara. “Information and the Cost of Capital.” Journal of Finance, (2004):
1553-1582.

34
Eleswarapu, V., R. Thompson, and K. Venkataraman, “The Impact of Regulation Fair Disclosure: Trading Costs and Information Asymmetry” Journal of Financial and Quantitative Analysis 39 (2004): 209-225.
Francis, J., J. Hanna, and D. Philbrick. “Management Communications with Securities
Analysts.” Journal of Accounting and Economics 24 (1997): 363-94. Francis, J., D. Nanda, and X. Wang, “Re-examining the Effects of Regulation Fair Disclosure
using Foreign Listed Firms to Control for Concurrent Shocks” Journal of Accounting and Economics 41 (2006): 271-292.
Frankel, R., M. Johnson, and D. Skinner. “An Empirical Examination of Conference Calls as a
Voluntary Disclosure Medium.” Journal of Accounting Research 37 (1999): 133-50. Graham, J., C. Harvey, and S. Rajgopal. “The Economic Implications of Corporate Financial
Reporting.” Journal of Accounting and Economics 40 (2005): 3-73. Greenwich Associates. “U.S. Equity Research: Bulge Bracket Down, But Not Out.” Greenwich
Report (June 2010). Heflin, F., K. R. Subramanyam, and Y. Zhang, “Regulation FD and the Financial Information
Environment: Early Evidence” The Accounting Review 78 (2003): 1-37 Jackson, H., “America’s Most Shareholder Friendly Companies.” Institutional Investor
Magazine. (March 2007) Kansas, D., “Juniper Networks Skids 9% After CEO’s Cautious Words.” Wall Street Journal
Blogs (June 1, 2011). Accessed at http://blogs.wsj.com/marketbeat/2011/06/01/juniper-networks-skids-9-after-ceos-cautious-words/
Lambert, R., C. Leuz, and R. Verrecchia. “Accounting Information, Disclosure, and the Cost of
Capital.” Journal of Accounting Research 45 (2007): 385-420. Lee, C. “Earnings news and small traders: An intraday analysis.” Journal of Accounting and
Economics 15 (1992): 265-302. Lee, C., and B. Radhakrishna. “Inferring investor behavior: Evidence from TORQ data.” Journal
of Financial Markets 3 (2000): 83-111. Lee, C. M. C., and M. J. Ready. “Inferring Trade Direction from Intraday Data.” The Journal of
Finance, 46 (1991): 733-746. Markov, S., V. Muslu, and M. Subasi. “Analyst Tipping: Additional Evidence.” Working Paper,
University of Texas at Dallas (2010).

35
Mayew, W. “Evidence of Management Discrimination among Analysts During Earnings Conference Calls.” Journal of Accounting Research 46, (2008): 627-659.
Morris, S. and H.S. Shin. “Global Games: Theory and Applications.” Economics and
Econometrics, the Eighth World Congress, Cambridge University Press, (2003). Rogers, J.L. “Disclosure Quality and Management.” Journal of Accounting Research, 46
(2008): 1265-1296. Rogers, W.H. “Regression Standard Errors in Clustered Samples.” Stata Technical Bulletin 13
(1993): 19-23. SEC v. Siebel Systems, et al., United States District Court for the Southern District of New
York, Memorandum Decision and Order, August 31, 2005. Solomon, D. and E. Soltes. “What are We Meeting For? The Consequences of Private Meetings
with Investors.” Working Paper, USC and Harvard Business School, (2011) Wang, I. Y., “Private Earnings Guidance and Its Implications for Disclosure Regulation” The
Accounting Review 82 (2007): 1299-1333.

36
FIGURE 1 Timeline Depiction of the Measurement Periods around the Conference Presentation
and the Control Periods from the Prior Week
Figure 1 illustrates the measurement periods used for empirical tests. The time period t0 represents the time from the start of the conference presentation to 59 minutes and 59 seconds later. The corresponding control period is exactly one week before; if the control period lands on a holiday, then the trading day immediately before the holiday is used. The process is the same for 3 one-hour trading intervals after the presentation and 3 trading intervals before the presentation. All variables are presented as change variables—the value during the test interval minus the value during the control interval.
… c-3 c-2 c-1 c0 c1 c2 …
Scheduled start of
presentation
Presentations last 30-45 minutes
One week prior to
presentation
60 min. intervals
Control Periods Presentation and
Surrounding Periods
… t-3 t-2 t-1 t0 t1 t2 t3 …
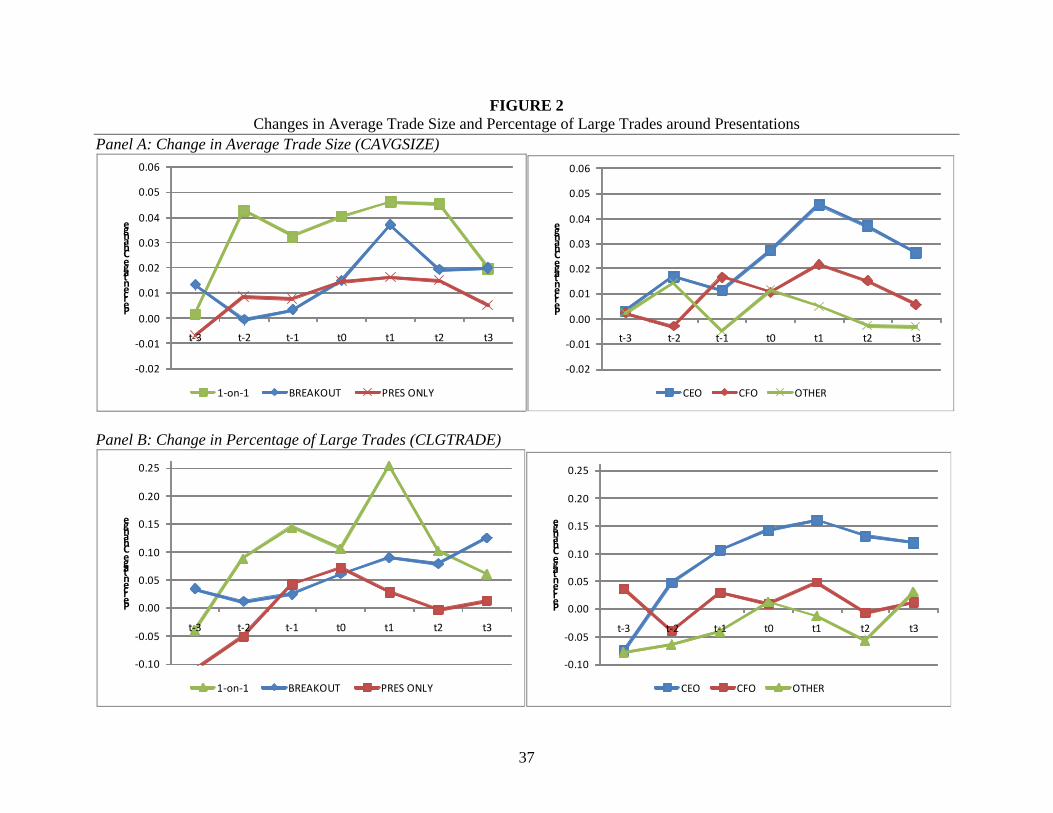
37
FIGURE 2 Changes in Average Trade Size and Percentage of Large Trades around Presentations
Panel A: Change in Average Trade Size (CAVGSIZE)
‐0.02
‐0.01
0.00
0.01
0.02
0.03
0.04
0.05
0.06
t‐3 t‐2 t‐1 t0 t1 t2 t3
Percentage Change
1‐on‐1 BREAKOUT PRES ONLY
‐0.02
‐0.01
0.00
0.01
0.02
0.03
0.04
0.05
0.06
t‐3 t‐2 t‐1 t0 t1 t2 t3
Percentage Change
CEO CFO OTHER
Panel B: Change in Percentage of Large Trades (CLGTRADE)
‐0.10
‐0.05
0.00
0.05
0.10
0.15
0.20
0.25
t‐3 t‐2 t‐1 t0 t1 t2 t3
Percentage Change
1‐on‐1 BREAKOUT PRES ONLY
‐0.10
‐0.05
0.00
0.05
0.10
0.15
0.20
0.25
t‐3 t‐2 t‐1 t0 t1 t2 t3
Percentage Change
CEO CFO OTHER

38
FIGURE 2 (continued) Changes in Average Trade Size and Percentage of Large Trades around Presentations
Figure 2 presents the mean values of changes in trade sizes around the conference presentations. Time periods t-3 to t3 are the seven one-hour periods surrounding the presentation (t0). Change in average trade size (CLAVGSIZE) is defined as the log of the average trade size during the test interval minus the log of the average trade size in the control interval. Trade sizes are measured in number of shares. Change in the percent of large trades (CLGTRADE) is defined as the percent of large trades in the test interval minus the percent in the control interval. We measure the percent of large trades as the number of large trades divided by total trades and express the variable in percentage points. We classify large trades to be those greater than $50,000, using the stock price at the beginning of the time interval to determine total trade value. We winsorize outliers at 1% of each tail for these variables. The categories of 1-on-1, breakout, and presentation only are those presentations at conferences that provided one-on-one sessions, breakout sessions, or no formal off-line access, respectively. The categories of CEO, CFO, and Other are those in which the top officer presenting at the conference is the CEO, CFO, or someone other than the CEO and CFO, respectively.

39
TABLE 1
Sample Selection and Breakdown of Conference Presentations Panel A: Sample Selection Criteria
Presentations
Presentations between 2003 and 2008 with CRSP/Compustat 89,972
- Product market conferences (12,029)
Capital market presentations 77,943
- Missing time stamp (15,997)
- Outside of trading hours (22,663)
Trading hours presentations 39,283
- Missing TAQ data (1,875)
Presentations with TAQ data 37,408
- Missing transcript (29,740)
Final sample 7,668 Panel B: Presentations by Year Presentations Percent
2003 101 1.3%
2004 695 9.1%
2005 1,080 14.1%
2006 1,467 19.1%
2007 2,145 28.0%
2008 2,180 28.4%
Total 7,668 100.0% Panel C: Presentations by Top Officer and by Access Type Top Officer
Access Type CEO CFO Other Total
1-on-1 504 396 219 1,119 (14.7%)
Breakout 1,507 1,003 642 3,152 (41.1%)
Presentation only 1,569 1,061 767 3,397 (44.2%)
Total 3,580 2,460 1,628 7,668
(46.7%) (32.1%) (21.2%) Table 1 presents the sample selection procedure (Panel A) and a breakdown of the sample. Panel B provides the breakdown by year. Panel C provides the breakdown by access type and by the top officer presenting at the conference. The categories of 1-on-1, breakout, and presentation only are those presentations at conferences that provided one-on-one sessions, breakout sessions, or no formal off-line access, respectively. The categories of CEO, CFO, and Other are those in which the top officer presenting at the conference is the CEO, CFO, or someone other than the CEO and CFO, respectively.

40
TABLE 2 Descriptive Statistics for Conference Presentation and Firm Characteristics
Panel A: Descriptive Statistics Variable Mean Std. Dev. 1st Quartile Median 3rd Quartile
D1ON1 0.147 0.353 0.000 0.000 0.000
DBREAKOUT 0.411 0.492 0.000 0.000 1.000
DCEO 0.467 0.499 0.000 0.000 1.000
DCFO 0.321 0.467 0.000 0.000 1.000
LNQUEST 2.796 0.944 2.197 2.944 3.497
ABRET0 0.062 1.020 -0.634 0.053 0.762
DINFO_EVENT 0.173 0.378 0.000 0.000 0.000
LMV 8.747 1.541 7.808 8.687 9.779
PIH 0.761 0.189 0.661 0.794 0.897
LNANL 2.729 0.533 2.398 2.773 3.091
ANNMAR 0.014 0.372 -0.205 -0.030 0.164
ANNTURN 0.235 0.169 0.115 0.185 0.301
DFORFIRM 0.032 0.176 0.000 0.000 0.000
EP 0.034 0.062 0.025 0.045 0.063
DP 0.010 0.015 0.000 0.001 0.015
BP 0.392 0.260 0.217 0.338 0.532
CNI 0.013 0.089 -0.005 0.007 0.022
SGR 0.186 0.389 0.048 0.116 0.227
SPINDX 0.805 0.396 1.000 1.000 1.000
INTAN 0.199 0.199 0.025 0.135 0.325
LEV 0.219 0.192 0.058 0.192 0.316
STD 0.020 0.009 0.014 0.018 0.025
BETA 1.115 0.524 0.741 1.030 1.418
LTIME 2.872 0.874 2.303 2.858 3.555

41
TABLE 2 (Continued) Descriptive Statistics for Conference Presentation and Firm Characteristics
Panel B: Logistic Regressions DOFFLINE =1 DCEO =1 DCEO 0.412 *** DCFO 0.306 *** D1ON1 0.078 DBREAKOUT 0.221 *** LNQUEST -0.872 *** 0.227 *** ABRET0 -0.034 0.020 DINFO_EVENT 0.241 *** 0.160 ** LMV 0.144 *** -0.233 *** PIH 0.557 *** 0.300 * LNANL 0.051 -0.400 *** ANNMAR -0.035 0.044 ANNTURN 0.065 -0.258 DFORFIRM -0.235 0.072 EP 0.660 -0.714 DP -1.118 3.425 * BP -0.046 0.104 CNI 0.104 0.583 * SGR -0.008 0.046 SPINDX -0.298 *** -0.005 INTAN 0.102 0.613 *** LEV 0.057 -0.154 STD 8.019 * 2.553 BETA 0.043 -0.064 LTIME 0.116 *** -0.056
Year Effects Included Included
Industry Effects Included Included N 7,668 7,668 Pseudo-R2 0.14 0.07
*, **, *** Significantly different from zero at the 0.10, 0.05, and 0.01 level, respectively, using a two-tailed test.

42
TABLE 2 (Continued) Descriptive Statistics for Conference Presentation and Firm Characteristics
Panel A of Table 2 presents descriptive statistics for the conference presentation and firm characteristics. The sample size for all variables is 7,668. D1ON1 equals 1 if the presentation occurred at conference that provided one-on-one sessions, 0 otherwise. DBREAKOUT equals 1 if the presentation occurred at conference that provided breakout sessions, 0 otherwise. DCEO (DCFO) equals 1 if a firm’s presentation is made by the CEO (CFO), 0 otherwise. LNQUEST is the log of the number of questions asked during the Q&A portion of the presentation. ABRET0 is the abnormal absolute return during the presentation period (t0), computed as the absolute return in the presentation period less the absolute return in the same period one week prior. DINFO_EVENT equals one if an earnings announcement, management forecast, or Form 8-K/6-K filing occurs during the day of the presentation and zero otherwise. LMV is the log of the market value of equity. PIH is the percentage ownership by institutional investors, defined as total shares owned by institutions divided by the total shares outstanding, for the most recent calendar quarter end prior to the presentation. LNANL is the log of one plus number of analysts issuing earnings forecasts in the most recent calendar quarter prior to the presentation. ANNMAR is the buy-and-hold market-adjusted stock return over the year prior to 30 days before the presentation. ANNTURN is the average monthly share turnover, computed as volume divided by shares outstanding, for the year prior to 30 days before the presentation. DFORFIRM is an indicator variable set to 1 if the company is headquartered outside the U.S., 0 otherwise. EP is the earnings-to-price ratio at FYE prior to presentation. DP is the dividend-to-price ratio at FYE prior to presentation. BP is the book-to-price ratio at FYE prior to presentation. CNI is the change in net income, deflated by market value at FYE prior to presentation. SGR is the sales growth at FYE prior to presentation. SPINDX is the indicator for listing on any S&P index at FYE prior to presentation. INTAN is the intangible assets/total assets at FYE prior to presentation. LEV is the leverage at FYE prior to presentation. STD is the standard deviation of stock returns (from CRSP) for year prior to presentation. BETA is the beta (from CRSP) of the stock for year prior to presentation. LTIME is the log of the number of years the company has been listed. Panel B of Table 2 presents logistic regressions of indicators for off-line access and CEO presenters on the conference presentation and firm characteristics. DOFFLINE equals 1 if D1ON1 or DBREAKOUT equals 1, 0 otherwise. Year and industry effects are included, but not reported.

43
TABLE 3 Univariate Evidence of Changes in Trade Sizes around Presentations
Panel A: Mean and Median Changes in Average Trade Size (CLAVGSIZE) and Percentage of Large Trades (CLGTRADE) for all presentations
CLAVGSIZE CLGTRADE
Period Mean Median Mean Median N
t-3 0.003 0.005 -0.041 0.000 4,628
t-2 0.010 * 0.008 * -0.005 0.000 6,249
t-1 0.010 * 0.006 * 0.050 0.000 6,968
t0 0.018 *** 0.019 *** 0.072 ** 0.000 *** 7,668
t1 0.029 *** 0.011 *** 0.087 *** 0.000 ** 7,052
t2 0.021 *** 0.013 *** 0.046 0.000 ** 5,792
t3 0.013 ** 0.005 * 0.066 * 0.000 ** 4,633 Panel B: Mean Changes in CLAVGSIZE and CLGTRADE by off-line access
CLAVGSIZE CLGTRADE
Period 1-on-1 Breakout No Offline 1-on-1 Breakout No Offline
t-3 0.001 0.013 -0.007 -0.041 0.034 -0.110 *
t-2 0.043*** †† -0.001 0.009 0.089 † 0.011 -0.051
t-1 0.032** † 0.003 0.008 0.144 ** † 0.025 0.043
t0 0.040*** † 0.015 * 0.015 * 0.108 * 0.061 0.071 *
t1 0.046*** †† 0.037 *** †† 0.016 ** 0.255 *** ††† 0.090 * 0.028
t2 0.045*** †† 0.019 ** 0.015 * 0.102 0.079 -0.003
t3 0.020 0.020 * 0.005 0.060 0.125 ** 0.013
Panel C: Mean Changes in CLAVGSIZE and CLGTRADE by top officer
CLAVGSIZE CLGTRADE
Period CEO CFO Other CEO CFO Other
t-3 0.003 0.002 0.002 -0.076 0.036 -0.079
t-2 0.017 * -0.003 0.014 0.047 -0.040 -0.065
t-1 0.011 0.017 * -0.005 0.106 ** † 0.030 -0.041
t0 0.027 *** 0.010 0.011 0.142 *** † 0.010 0.012
t1 0.046 *** ††† 0.022 ** 0.005 0.160 *** †† 0.048 -0.014
t2 0.037 *** ††† 0.015 -0.003 0.132 *** †† -0.007 -0.057
t3 0.026 *** † 0.006 -0.003 0.120 ** 0.013 0.030 *, **, *** Significantly different from zero at the 0.10, 0.05, and 0.01 level, respectively, using a two-tailed t-test (means) and a Wilcoxon signed rank test (medians). †, ††, ††† Significantly greater than no off-line or other officer sample at the 0.10, 0.05, and 0.01 level, respectively, using a one-tailed test

44
TABLE 3 (Continued) Univariate Evidence of Changes in Trade Sizes around Presentations
Table 3 presents changes in average trade size and changes in the percentage of large trades for seven one-hour test intervals around the presentation. Change in average trade size (CLAVGSIZE) is defined as the log of the average trade size during the test interval minus the log of the average trade size in the control interval. Trade sizes are measured in number of shares. Change in the percent of large trades (CLGTRADE) is defined as the percent of large trades in the test interval minus the percent in the control interval. We measure the percent of large trades as the number of large trades divided by total trades and express the variable in percentage points. We classify large trades to be those greater than $50,000, using the stock price at the beginning of the time interval to determine total trade value. We winsorize outliers at 1% of each tail for these variables. Panel A shows the mean and median changes by test period (t-3 to t3). Panel B shows the mean changes conditioned on off-line access. Panel C shows the mean changes conditioned on the top office in attendance at the presentation.

45
TABLE 4 Regression of Changes in Trade Sizes on Presentation and Firm Characteristics by Period
Panel A: Dependent Variable is Change in Average Trade Size (CLAVGSIZE)
Time Period Relative to Presentation Hour (t0)
Pred. Sign t-2 t-1 t0 t1 t2
D1ON1 + pre/post t0 0.040 ** 0.034 ** 0.049 *** 0.035 ** 0.040 **
DBREAKOUT + post t0 -0.008 0.004 0.018 0.025 ** 0.015
DCEO + post t0 -0.002 0.010 0.001 0.024 ** 0.033 **
DCFO -0.021 0.013 -0.012 0.007 0.012
LNQUEST 0.002 0.012 * 0.025 *** 0.011 * 0.012 *
ABRET0 0.002 0.003 0.026 *** 0.013 ** 0.006
DINFO_EVENT 0.009 0.024 * 0.028 ** 0.012 0.012
LMV -0.002 -0.003 0.001 -0.013 ** 0.004
PIH -0.039 0.004 0.048 -0.003 0.013
LNANL -0.009 -0.012 -0.040 ** 0.001 -0.014
ANNMAR -0.048 *** -0.031 ** -0.060 *** -0.044 ** -0.011
ANNTURN 0.042 0.095 ** 0.089 ** -0.054 -0.008
DFORFIRM 0.035 0.043 0.046 -0.059 * 0.030
EP -0.020 0.002 -0.057 -0.088 0.027
DP 0.345 0.060 -0.026 -0.509 -0.107
BP -0.011 -0.043 * -0.027 0.042 -0.027
CNI 0.114 0.081 0.009 -0.014 0.076
SGR 0.039 ** -0.005 0.023 -0.009 -0.002
SPINDX -0.009 -0.013 -0.012 -0.043 ** -0.002
INTAN 0.038 0.056 -0.010 0.018 -0.015
LEV 0.003 -0.003 -0.068 ** -0.027 0.033
STD -0.933 -0.596 -2.687 *** -2.079 * 0.641
BETA -0.002 -0.011 0.000 0.017 -0.007
LTIME 0.009 0.001 0.000 0.003 -0.012
Year Effects Included Included Included Included Included
Industry Effects Included Included Included Included Included
N 6,249 6,968 7,668 7,052 5,792Adjusted R2 0.01 0.01 0.02 0.02 0.01
*, **, *** Significantly different from zero at the 0.10, 0.05, and 0.01 level, respectively, using a one-tailed test for predicted changes; two-tailed otherwise.

46
TABLE 4 (Continued) Regression of Changes in Trade Sizes on Presentation and Firm Characteristics by Period
Panel B: Dependent Variable is Change in Percentage of Large Trades (CLGTRADE)
Time Period Relative to Presentation Hour (t0)
Pred. Sign t-2 t-1 t0 t1 t2
D1ON1 + pre/post t0 0.164 * 0.168 ** 0.155 ** 0.345 *** 0.154 *
DBREAKOUT + post t0 0.098 0.045 0.074 0.137 * 0.165 *
DCEO + post t0 0.079 0.071 0.074 0.155 ** 0.171 *
DCFO -0.031 -0.016 -0.066 0.011 0.013
LNQUEST 0.007 0.072 * 0.098 *** 0.058 0.026
ABRET0 0.012 0.040 0.196 *** 0.165 *** 0.076 **
DINFO_EVENT 0.103 0.127 0.143 * 0.052 0.029
LMV 0.053 0.000 -0.031 -0.030 -0.036
PIH 0.253 -0.056 0.040 0.163 -0.006
LNANL -0.288 ** -0.166 -0.096 -0.053 0.003
ANNMAR -0.178 * -0.057 -0.069 -0.047 -0.042
ANNTURN 0.235 0.412 0.228 0.077 -0.255
DFORFIRM 0.112 0.051 -0.062 0.137 -0.016
EP 0.437 0.794 0.530 0.100 -1.546 *
DP -1.445 -1.808 -0.952 -5.263 ** -0.564
BP 0.292 0.287 * 0.006 0.185 0.193
CNI 0.560 -0.014 0.095 -0.542 0.793
SGR 0.022 0.092 0.000 -0.026 -0.079
SPINDX -0.260 * -0.070 -0.071 -0.066 -0.058
INTAN 0.272 -0.103 0.111 -0.125 -0.061
LEV 0.032 0.159 -0.305 ** -0.092 -0.175
STD -13.314 ** -12.970 ** -13.206 ** -15.691 *** -11.431
BETA 0.146 0.022 -0.012 0.095 0.063
LTIME 0.024 0.000 -0.014 0.021 -0.006
Year Effects Included Included Included Included Included
Industry Effects Included Included Included Included Included
N 6,249 6,968 7,668 7,052 5,792Adjusted R2 0.01 0.01 0.02 0.02 0.01
*, **, *** Significantly different from zero at the 0.10, 0.05, and 0.01 level, respectively, using a one-tailed test for predicted changes; two-tailed otherwise.

47
TABLE 4 (Continued) Regression of Changes in Trade Sizes on Presentation and Firm Characteristics by Period
Table 4 presents results of regressions of changes in trade sizes on the presentation and firm characteristics by period. Time periods t-2 to t2 are the five one-hour periods surrounding the presentation (t0). Change in average trade size (CLAVGSIZE) is defined as the log of the average trade size during the test interval minus the log of the average trade size in the control interval. Trade sizes are measured in number of shares. Change in the percent of large trades (CLGTRADE) is defined as the percent of large trades in the test interval minus the percent in the control interval. We measure the percent of large trades as the number of large trades divided by total trades and express the variable in percentage points. We classify large trades to be those greater than $50,000, using the stock price at the beginning of the time interval to determine total trade value. We winsorize outliers at 1% of each tail for these variables. D1ON1 equals 1 if the presentation occurred at conference that provided one-on-one sessions, 0 otherwise. DBREAKOUT equals 1 if the presentation occurred at conference that provided breakout sessions, 0 otherwise. DCEO (DCFO) equals 1 if a firm’s presentation is made by the CEO (CFO), 0 otherwise. LNQUEST is the log of the number of questions asked during the Q&A portion of the presentation. ABRET0 is the abnormal absolute return during the presentation (time period 0). DINFO_EVENT equals one if an earnings announcement, management forecast, or Form 8-K/6-K filing occurs during the day of the presentation and zero otherwise. LMV is the log of the market value of equity. PIH is the percentage ownership by institutional investors, defined as total shares owned by institutions divided by the total shares outstanding, for the most recent calendar quarter end prior to the conference presentation. LNANL is the log of one plus number of analysts issuing earnings forecasts. ANNMAR is the buy-and-hold market-adjusted stock return over the year prior to 30 days before the presentation. ANNTURN is the average monthly share turnover, computed as volume divided by shares outstanding, for the year prior to 30 days before the presentation. DFORFIRM is an indicator variable set to 1 if the company is headquartered outside the U.S., 0 otherwise. EP is the earnings-to-price ratio at FYE prior to presentation. DP is the dividend-to-price ratio at FYE prior to presentation. BP is the book-to-price ratio at FYE prior to presentation. CNI is the change in net income, deflated by market value at FYE prior to presentation. SGR is the sales growth at FYE prior to presentation. SPINDX is the indicator for listing on any S&P index at FYE prior to presentation. INTAN is the intangible assets/total assets at FYE prior to presentation. LEV is the leverage at FYE prior to presentation. STD is the standard deviation of stock returns (from CRSP) for year prior to presentation. BETA is the beta (from CRSP) of the stock for year prior to presentation. LTIME is the log of the number of years the company has been listed.

48
TABLE 5 Univariate Evidence on Post-Presentation Trading Gains
Panel A: Mean and Median GAIN for horizons between three and 252 trading days after the presentation
Horizon Mean Median N
(+1,+3) -0.0003 0.0003 7,052
(+1,+10) 0.0006 0.0003 7,052
(+1,+15) -0.0006 -0.0007 7,052
(+1,+30) -0.0005 -0.0003 7,052
(+1,+60) -0.0007 0.0000 7,052
(+1,+252) -0.0042 -0.0007 7,052 Panel B: Mean and Median GAIN conditioned on formal off-line access
Horizon 1-on-1 Breakout No Offline
(+1,+3) 0.0030 ** ††† 0.0003 † -0.0019 **
(+1,+10) 0.0030 * † 0.0012 † -0.0009
(+1,+15) -0.0015 0.0017 †† -0.0025 *
(+1,+30) -0.0008 0.0038 * ††† -0.0044 **
(+1,+60) -0.0036 0.0032 † -0.0034
(+1,+252) -0.0127 -0.0029 -0.0025
Panel C: Mean and Median GAIN conditioned on top officer in attendance
Horizon CEO CFO Other
(+1,+3) -0.0004 -0.0011 0.0013
(+1,+10) 0.0020 * -0.0017 0.0007
(+1,+15) -0.0002 -0.0018 0.0000
(+1,+30) 0.0010 -0.0037 0.0010
(+1,+60) 0.0026 -0.0065* 0.0006
(+1,+252) -0.0058 -0.0014 -0.0049 *, **, *** Significantly different from zero at the 0.10, 0.05, and 0.01 level, respectively, using a two-tailed t-test (means) and a Wilcoxon signed rank test (medians). †, ††, ††† Significantly greater than no off-line or other officer sample at the 0.10, 0.05, and 0.01 level, respectively, using a one-tailed test
Table 5 presents univariate evidence on the profitability of post-presentation trading. To compute the potential post-presentation trading gains (GAIN), we multiply the NETBUYS indicator times the buy-and-hold size-adjusted returns (SAR) over various windows subsequent to the selective access period. We set the indicator variable NETBUYS equal to 1 if abnormal net buys are positive during the event period and -1 otherwise. We identify each trade as a buy or sell using the Lee and Ready [2001] algorithm with a zero-second delay between trades and quotes (Rogers [2008]). We compute size-adjusted returns by compounding the firm’s raw return starting with the stock price two hours after the presentation (or at the end of the day if it comes first) and ending at horizons three, 10, 15, 30, 60, and 252 trading days after the presentations. We subtract the returns for the firm’s size decile from these returns, where we start the compounding for the size portfolio at the start of the presentation date. A positive value of GAIN indicates that investors were buying (selling) during the selective access period and subsequent abnormal returns for the firm were positive (negative). Panel A shows the mean and median GAIN for horizons between three and 252 trading days after the presentation for all sample presentations. Panel B shows mean values of GAIN conditioned on formal off-line access. Panel C shows mean values of GAIN conditioned on the top officer in attendance.

49
TABLE 6 Regression of Post-Presentation Trading Gains on Presentation and Firm Characteristics
Panel A: Regressions of GAIN for various horizons after the presentation
Horizons After the Presentation
Pred. Sign (+1,+3) (+1,+10) (+1,+15) (+1,+30) (+1,+60) (+1,+252)
D1ON1 + 0.006 *** 0.006 ** 0.003 0.005 0.002 -0.014
DBREAKOUT + 0.003 ** 0.004 ** 0.006 *** 0.008 *** 0.006 -0.006
DCEO + -0.001 0.000 0.000 0.000 0.002 0.002
DCFO -0.003 * -0.003 -0.002 -0.004 -0.007 0.007
LNQUEST 0.001 0.002 0.002 0.001 0.000 0.000
ABRET0 0.000 0.000 0.000 0.002 -0.001 0.004
DINFO_EVENT -0.001 -0.003 -0.002 -0.003 -0.001 0.003
LMV -0.001 -0.002 * -0.001 -0.001 -0.001 -0.004
PIH -0.004 0.000 0.005 -0.012 -0.020 0.002
LNANL 0.002 0.001 0.002 0.000 -0.004 0.010
ANNMAR 0.003 0.006 * 0.007 * 0.005 0.018 ** 0.029 **
ANNTURN 0.001 -0.005 -0.002 0.010 0.014 -0.142 ***
DFORFIRM 0.005 0.011 0.009 0.002 -0.003 0.010
EP 0.032 * 0.019 0.033 0.019 0.060 0.006
DP -0.086 -0.099 -0.034 0.018 0.268 -0.547
BP -0.002 0.004 0.001 -0.004 0.001 0.006
CNI -0.002 0.004 0.000 0.020 -0.052 -0.078
SGR 0.002 0.001 -0.001 0.005 0.004 0.001
SPINDX 0.000 -0.001 -0.006 -0.003 0.001 -0.002
INTAN -0.001 0.002 -0.001 0.000 -0.001 -0.022
LEV 0.005 0.000 0.000 0.011 0.012 0.014
STD -0.177 -0.094 0.084 0.134 0.219 -0.376
BETA 0.002 0.004 0.003 0.005 0.013 * 0.007
LTIME 0.002 * 0.003 * 0.004 ** 0.005 * 0.005 0.010
Time Effects Incl. Incl. Incl. Incl. Incl. Incl.
Industry Effects Incl. Incl. Incl. Incl. Incl. Incl. N 7,052 7,052 7,052 7,052 7,052 7,052 Adjusted R2 0.02 0.01 0.01 0.01 0.01 0.01
*, **, *** Significantly different from zero at the 0.10, 0.05, and 0.01 level, respectively, using a one-tailed test for predicted changes; two-tailed otherwise.

50
TABLE 6 (Continued) Regression of Post-Presentation Trading Gains on Presentation and Firm Characteristics
Panel B: Regressions of GAIN for various horizons before the presentation
Horizons Before the Presentation
Pred. Sign (-252,-1) (-60,-1) (-30,-1) (-15,-1) (-10,-1) (-3,-1)
D1ON1 -0.021 -0.008 -0.005 -0.004 -0.006 -0.001
DBREAKOUT -0.010 -0.001 -0.002 -0.001 -0.002 -0.001
DCEO 0.028 * -0.003 0.002 0.000 0.004 0.002
DCFO 0.014 -0.006 -0.005 0.000 0.002 0.002
LNQUEST -0.016 *** 0.003 0.002 0.003 ** 0.002 0.001
ABRET0 -0.005 0.001 0.000 0.001 0.000 0.001 *
DINFO_EVENT 0.009 0.013 ** 0.006 0.005 * 0.003 0.000
LMV 0.009 0.000 -0.001 0.000 -0.001 0.000
PIH 0.014 -0.019 -0.009 -0.010 -0.006 -0.005
LNANL -0.009 0.000 0.001 -0.001 0.000 0.001
ANNMAR 0.008 0.005 0.000 0.000 -0.003 -0.001
ANNTURN -0.004 -0.001 -0.021 -0.017 -0.023 * -0.003
DFORFIRM 0.041 -0.015 0.001 0.001 -0.007 -0.010
EP -0.083 -0.079 -0.087 * -0.021 -0.038 0.010
DP 0.581 0.088 -0.132 -0.045 -0.074 -0.114 *
BP 0.022 -0.009 -0.011 -0.005 -0.009 -0.003
CNI 0.017 0.023 0.012 0.004 0.022 0.000
SGR 0.036 * 0.000 -0.006 -0.005 -0.004 -0.004
SPINDX -0.001 -0.007 0.002 0.002 -0.003 -0.001
INTAN -0.021 0.002 -0.007 -0.004 -0.006 -0.007
LEV -0.018 0.007 0.016 0.020 ** 0.013 0.012 **
STD 1.513 0.007 0.071 0.022 0.048 0.248 *
BETA -0.036 * -0.013 ** -0.009 * -0.005 -0.008 ** -0.002
LTIME 0.003 0.001 0.001 -0.001 0.000 0.000
Time Effects Incl. Incl. Incl. Incl. Incl. Incl.
Industry Effects Incl. Incl. Incl. Incl. Incl. Incl. N 7,052 7,052 7,052 7,052 7,052 7,052 Adjusted R2 0.01 0.01 0.01 0.01 0.01 0.01
*, **, *** Significantly different from zero at the 0.10, 0.05, and 0.01 level, respectively, using a two-tailed test.

51
TABLE 6 (Continued) Regression of Post-Presentation Trading Gains on Presentation and Firm Characteristics
Table 6 presents results of regressions of post-presentation trading gains (GAIN) on the presentation and firm characteristics. Panel A presents horizons starting with the price two hours after the presentation (or the end of the day, whichever comes sooner) and ending 3, 15, 30, 60, 90 120, and 252 trading days after the presentation. Panel B presents horizons starting 252, 120, 90, 60, 30, 15, and 3 days prior to the day before the presentation and ending the day before the presentation. To compute the potential post-presentation trading gains (GAIN), we multiply the NETBUYS indicator times the buy-and-hold size-adjusted returns (SAR) over the various horizons. We set the indicator variable NETBUYS equal to 1 if abnormal net buys are positive during the event period and -1 otherwise. We identify each trade as a buy or sell using the Lee and Ready [2001] algorithm with a zero-second delay between trades and quotes (Rogers [2008]). D1ON1 equals 1 if the presentation occurred at conference that provided one-on-one sessions, 0 otherwise. DBREAKOUT equals 1 if the presentation occurred at conference that provided breakout sessions, 0 otherwise. DCEO (DCFO) equals 1 if a firm’s presentation is made by the CEO (CFO), 0 otherwise. LNQUEST is the log of the number of questions asked during the Q&A portion of the presentation. ABRET0 is the abnormal absolute return during the presentation (time period 0). DINFO_EVENT equals one if an earnings announcement, management forecast, or Form 8-K/6-K filing occurs during the day of the presentation and zero otherwise. LMV is the log of the market value of equity. PIH is the percentage ownership by institutional investors, defined as total shares owned by institutions divided by the total shares outstanding, for the most recent calendar quarter end prior to the conference presentation. LNANL is the log of one plus number of analysts issuing earnings forecasts. ANNMAR is the buy-and-hold market-adjusted stock return over the year prior to 30 days before the presentation. ANNTURN is the average monthly share turnover, computed as volume divided by shares outstanding, for the year prior to 30 days before the presentation. DFORFIRM is an indicator variable set to 1 if the company is headquartered outside the U.S., 0 otherwise. EP is the earnings-to-price ratio at FYE prior to presentation. DP is the dividend-to-price ratio at FYE prior to presentation. BP is the book-to-price ratio at FYE prior to presentation. CNI is the change in net income, deflated by market value at FYE prior to presentation. SGR is the sales growth at FYE prior to presentation. SPINDX is the indicator for listing on any S&P index at FYE prior to presentation. INTAN is the intangible assets/total assets at FYE prior to presentation. LEV is the leverage at FYE prior to presentation. STD is the standard deviation of stock returns (from CRSP) for year prior to presentation. BETA is the beta (from CRSP) of the stock for year prior to presentation. LTIME is the log of the number of years the company has been listed.