do investors overreact to super-salient events? evidence...
TRANSCRIPT

Do Investors Overreact to Super-Salient Events? Evidence
from "Nine-Eleven"∗
Timothy R. Burch, Douglas R. Emery and Michael E. Fuerst†
January 2011
Abstract
We study investor reaction to the terrorist attacks of September 11, 2001 (“nine-
eleven”) using the share price responses of closed-end mutual funds. Nine-eleven is an
exogenous, highly visible, and economically significant event that provides a natural
experiment to study investor reaction to new information. To avoid the controversy
of constructing an artificial benchmark using an asset pricing model, we use net asset
value returns (NAVs) as price return benchmarks. We find pervasive overreaction and
panicked selling in the first week of trading after nine-eleven, followed by a reversal
during the subsequent two weeks. While the extant literature finds underreaction to
information that is inversely related to the salience of an event, we find that a “super-
salient”event can cause overreaction. In light of the extant literature, our results are
consistent with investor reaction to a news event lying along an under-overreaction
continuum in which the salience of the event determines the direction and magnitude
of mispricing.
JEL classification: G12, G14
Keywords: Asset pricing, Overreaction, Behavioral finance
∗We thank Pat Fishe, David Heike, Alok Kumar, and Tyler Shumway for helpful comments, and Hua(Allen) Song for valuable research assistance. Any errors are our own. E-mail addresses: [email protected],[email protected], and [email protected].†All three authors are from the University of Miami.

Do Investors Overreact to Super-Salient Events? Evidencefrom "Nine-Eleven"
Abstract
We study investor reaction to the terrorist attacks of September 11, 2001 (“nine-eleven”)
using the share price responses of closed-end mutual funds. Nine-eleven is an exogenous,
highly visible, and economically significant event that provides a natural experiment to
study investor reaction to new information. To avoid the controversy of constructing an
artificial benchmark using an asset pricing model, we use net asset value returns (NAVs) as
price return benchmarks. We find pervasive overreaction and panicked selling in the first
week of trading after nine-eleven, followed by a reversal during the subsequent two weeks.
While the extant literature finds underreaction to information that is inversely related to
the salience of an event, we find that a “super-salient”event can cause overreaction. In light
of the extant literature, our results are consistent with investor reaction to a news event
lying along an under-overreaction continuum in which the salience of the event determines
the direction and magnitude of mispricing.
JEL classification: G12, G14
Keywords: Asset pricing, Overreaction, Behavioral finance

1 Introduction
It’s said that when money is at stake, people pay close attention. Despite this adage,
there is clear evidence of systematic inattention by investors and market underreaction to
news (Dellavigna and Pollet, 2009; Hirshleifer, Lim, and Teoh, 2009; Louis and Sun, 2010),
although such underreaction is smaller the more salient the news is (Klibanoff, Lamont,
and Wizman, 1998). This phenomenon is broadly consistent with studies that show how
the prominence of news and media coverage affects investment decisions and asset prices.1
Klibanoff, et al. (1998) show that greater news salience leads to more effi cient price
reactions in closed-end fund prices due to less investor underreaction, and that the larger
impact of more salient news is not due simply to its larger information content. That is,
the effect of increased attention to news that is more salient is in addition to that of the
greater amount of information. Although salience has no natural upper limit by definition,
however, underreaction is truncated at zero (i.e., it is bounded by a correct reaction). It is
therefore unclear how investors react to a “super-salient”news event, which is the question
we address. It is possible that a super-salient news event results in a particularly high
degree of investor attention, little (if any) underreaction, and a very effi cient price reaction
to the information contained in the news. Another possibility, however, is that investor
reaction relates to salience along a continuum and that when salience increases beyond
some threshold, investor reaction also crosses a threshold and results in an overreaction.
This paper examines the share-price responses of 229 fixed income and 66 equity closed-
end mutual funds to the super-salient news event of the terrorist attacks on September
11, 2001 (hereafter “nine-eleven”). Nine-eleven offers an exogenous, highly visible, and
economically significant event that occurred simultaneously across the assets we study,
eliminating the need to align observations in event time to construct a sample of comparable
observations. In this sense our study is a natural experiment that shares similarities with
others that examine how asset prices react to a macroeconomic shock (e.g., Pearce and
1Barber and Odean (2008) find that stocks with greater media coverage are more likely to be purchasedby individual investors, and Sirri and Tufano (2002) find a similar effect on mutual fund investors. Fang andPeress (2009) find that stocks with greater media coverage have lower future stock returns, presumably dueto individual investors’willingness to pay higher prices for such stocks.
1

Roley, 1985 and Anderson, Bollerslev, Diebold, and Vega, 2003). Studying closed-end
funds is particularly useful, because it allows us to avoid the controversy of specifying an
asset pricing model to construct an artificial price-return benchmark. Closed-end funds
have their own natural price-return benchmark, namely returns in net asset values (NAVs),
against which we can measure mispricing. Studying this asset class also follows an extensive
literature (e.g., Swaminathan (1996), Dimson and Minio-Kozerski (1999), Grullon andWang
(2001), and Gemmill and Thomas (2002)), and allows us to extend the Klibanoff et al.
(1998) findings of underreaction in closed-end funds.
We document strong evidence of short-term overreaction to nine-eleven, followed by a
correction in the form of reversal.2 As shown in Figure 1, for both fixed income and equity
funds there were significant price declines that are more severe than those for NAVs. Cross-
sectional, time-series regressions show that pricing errors were statistically and economically
significant in both classes of funds, but that they were particularly severe for the fixed
income funds. This suggests that, at least initially, many closed-end fund investors did
not correctly comprehend the potential impact of nine-eleven on the market values of the
funds’ underlying assets. In the face of ambiguity as to the economic impact of nine-
eleven, investors may have presumed a worst-case scenario (Epstein and Schneider, 2008),
which allowed the overreaction and pricing errors to persist for more than a week until
pricing errors were largely corrected. Consistent with corrective market forces eventually
reversing the trend of widening price-NAV differences, we find that the magnitude of each
fund’s correction is directly tied to the magnitude of each fund’s specific overreaction. This
finding is important because it shows that corrections were not solely due to general investor
sentiment becoming less pessimistic.
In robustness work we present evidence that contradicts the possibility that the overre-
action and correction patterns are caused by “stale”or otherwise erroneous NAVs, bid-ask
2Because mispricing may have also occurred in the markets of the securities underlying closed-end fundholdings, our evidence more literally shows the overreaction in the prices of closed-end funds relative to thoseof their underlying assets. Assuming individuals are a larger proportion of the investors in closed-end fundsas compared to the average stock based on Weiss’s (1989) finding, our results can be viewed as indicativeof overreaction by unsophisticated individual investors and an initial reluctance from more sophisticatedtraders to engage in risky arbitrage positions to correct widening price-NAV differences. Arbitragers mayhave refrained from trading due to increased noise trader risk and increased trading costs (Gemmill andThomas, 2002), the latter of which we document in a subsequent section.
2

errors, a lack of market depth or many traditionally-posed explanations for closed-end fund
discounts. However, we do find substantially increased bid-ask spreads during the first trad-
ing days following nine-eleven, which initially may have discouraged sophisticated traders
from pursuing risky arbitrage strategies and mitigating the mispricing we observe.
Our findings offer potential insights into the workings of financial markets more generally.
Although super-salient, unanticipated news events that affect virtually the entire economy
are not common, dramatic firm-specific events occur frequently (e.g., unanticipated law
suits, fraud, bankruptcy filings, and technological breakthroughs). Hence, our findings
raise the question of whether super-salient events can cause overreaction in other types of
assets and markets.
2 Related Literature
Our study is most closely related to Klibanoff, et al. (1998), which examines how closed-end
country fund price returns track NAV returns in typical weeks versus weeks with salient
news events concerning the country in which the fund invests. Klibanoff, et al. finds that
prices typically underreact relative to changes in NAVs, but significantly less so following
salient news events. This result is consistent with increased investor attention and less
mispricing when news is more salient. Our paper uses the same asset class to study how
investors react to a “super-salient”news event that causes substantial uncertainty and has
a potentially large economic impact. Rather than finding diminished mispricing following a
news event, we document overreaction and increased mispricing following the super-salient
event we study. In light of the findings in Klibanoff, et al., our findings are consistent with
investor reaction to a news event lying on an under-overreaction continuum in which event
salience affects the direction and magnitude of pricing errors.
As reviewed in Dimson (1988) and Hirshleifer (2001), numerous empirical studies exam-
ine investor under- or overreaction to a corporate event (as opposed to a macroeconomic
event as in our study). For example, Loughran and Ritter (1995) study performance fol-
lowing seasoned equity offerings (SEOs) and Ikenberry, Lakonishok, and Vermaelen (1995)
3

study share repurchases. Most of these studies are based on highly visible but endogenous
managerial decisions which may help resolve asymmetric information between investors
and managers regarding firm value. Some of these studies find underreaction, while others
appear to find overreaction. Kadiyala and Rau (2004) attempt to resolve this apparent
inconsistency by conditioning on both the event and the information prior to the event (in
their analysis of SEOs, stock-financed acquisitions, cash-financed acquisitions, and share
repurchases). They argue the return patterns are better characterized as underreaction,
a conclusion that is consistent with many other studies that find pervasive underreaction
(Klibanoff, et al., 1998; Peng, Xiong, and Bollerslev, 2007; Dellavigna and Pollet, 2009;
Hirshleifer, et al., 2009; and Louis and Sun, 2010).
Aside from our focus on a macroeconomic event, our study differs from those above
along other dimensions as well. The event we examine is exogenous and common across all
observations. We also document reversals in mispricing that occur over a few weeks. Such
reversals are likely aided by the availability of information regarding fundamental values
contained in frequently disclosed NAVs. For the funds we examine, NAVs can be obtained
with little effort on a daily basis from websites or the funds themselves, or more passively
through the weekly NAV listings in major newspapers such as The Wall Street Journal and
The New York Times.3 Despite the daily availability of NAVs, however, reversals are by no
means immediate and occur over a full two weeks.
In a more general sense, our paper is related to behavioral models of investors that
predict overreaction, such as Barberis, Shleifer, and Vishny (1998), Daniel, Hirshleifer, and
Subrahmanyam (1998), and Hong and Stein (1999).4 Each of these papers invokes some
sort of cognitive error by investors to explain under- or overreaction. De Long, Shleifer,
Summers, and Waldmann (1990a and 1990b) are also relevant. In De Long et. al. (1990a),
one set of investors exhibits positive feedback trading by buying (selling) on a rising (falling)
3One general internet source for NAVs is www.closed-endfunds.com. This site updates close to 90% oftheir NAVs by 8:00 p.m. on the same day, and the rest are updated by about 9:00 a.m. the next morning.NAVs for the funds in our sample are disclosed on a daily basis on this site, and the administrators of thissite have informed us that NAVs were disclosed as usual following nine-eleven. We have also confirmedthat NAVs were reported as usual in The New York Times (on Sundays) and The Wall Street Journal (onMondays) following nine-eleven.
4See Hirshleifer (2001) for an overview of these and other behavioral models.
4

price trend. In another model, De Long, et. al. (1990b) use correlated irrational misper-
ceptions among a subset of investors to generate mispricing risk (discounts or premiums
relative to fundamentals). In this view, “sentiment”is a set of shared (correlated) mistaken
beliefs among a subset of investors that lead them to trade irrationally. Lee, Shleifer, and
Thaler (1991) examine the De Long et al. (1990b) view and conclude that individual in-
vestors are especially vulnerable to sentiment and discuss closed-end fund mispricing and
fund ownership by individual investors.
In our context, it is possible that a wave of pessimism, reinforced by the broader market’s
decline, helps to explain why price declines exceed NAV declines during the first trading
week following nine-eleven. As the broader market recovers somewhat in the weeks that
follow, so do closed-end fund prices, causing CARs (cumulative abnormal returns) to re-
cover and approach zero. Burch, Emery, and Fuerst (2003) also examine the behavior of
closed-end fund prices in the wake of nine-eleven, and they argue that investor sentiment
plays a role in closed-end fund discounts following nine-eleven. However, as we document
later, systematic movements in investor sentiment do not fully explain the overreaction and
correction patterns we observe. This is because a fund’s reversal in the second and third
weeks of trading after nine-eleven is significantly related to the fund’s abnormal return
during the first post-nine-eleven trading week.
Finally, there is a substantial body of literature that studies other financial aspects of
nine-eleven (e.g., Carter and Simkins (2004), Drakos (2004), Ito and Lee (2005), Maillet
and Michel (2005), Glaser and Weber (2005), Charles and Darne (2006), Nikkinen, Omran,
Sahlström, and Äijö (2008), and Epstein and Schneider (2008)).
3 Data
Our sample consists of closed-end funds that report daily NAVs from September 8, 2000
through November 5, 2001 (we exclude funds that only disclose NAVs on a weekly basis).
NAVs are obtained from Thompson Financial Inc.’s Wiesenburger division, and closing
prices are from the Center for Research in Security Prices (CRSP). We limit the sample
5

to funds that report NAVs daily, so that we can examine daily price and NAV return
patterns during the weeks of trading following the event. An additional benefit is that this
limits our sample to funds for which frequently updated valuation information is available
(NAV disclosures).5 We also exclude funds that are missing a Friday NAV during the time
period we study because some of the analysis examines weekly returns.6 The final sample
consists of 66 equity funds and 229 fixed income funds (as classified by Barron’s). Our
analysis segregates the sample on this basis due to the substantially different nature of the
underlying assets.
4 Closed-End Fund Returns around Nine-Eleven
4.1 The event
Nine-eleven needs no justification as an economically relevant event, but it is useful to
review briefly the climate and the timing of the equity markets’closure and reopening. In
the months prior to nine-eleven, the U.S. economy had been showing signs of weakness, and
hence, many feared the event would push the economy into a steep decline. For example, the
day after the attack, The Wall Street Journal published a front page story entitled “Attacks
Raise Fears of a Recession.”7 After the attacks, the U.S. equity markets remained closed for
four consecutive weekdays and did not reopen until Monday, September 17, 2001.8 On that
day, the log return on the S&P 500 index -5.0%. The index continued to drop throughout
the trading week, with a cumulative log return of -12.3% relative to its September 10, 2001
closing level.
5Arguably, investors should be able to reasonably approximate NAVs (and hence one measure of funda-mental values) on their own, but their ability to do so will vary across funds according to the nature of theirunderlying assets and the frequency of updated fund holdings information. Using funds that disclose NAVsdaily mitigates any complicating issues in our analysis with respect to cross-sectional variation in the abilityof investors to approximate fundamental values.
6The patterns around nine-eleven are completely consistent when these funds are included, but the paneldata regression techniques we use have better asymptotic properties when a balanced panel is used.
7See “Attacks raise fears of a recession,”by G. Ip and J. McKinnon (The Wall Street Journal, September12, 2001, Section A, page 1).
8The fixed income markets were closed for two days following nine-eleven and reopened earlier, on Thurs-day, September 13. Many market participants were particularly concerned about the reaction in the equitymarkets that opened a few days later, however. For example, see "After the attacks: The economy; Nationshifts its focus to Wall Street as a major test of the attack’s aftermaths," by R. Stevenson with J. Fuerbringer(The New York Times, September 17, 2001, Section A, page 1).
6
4.2 Univariate evidence
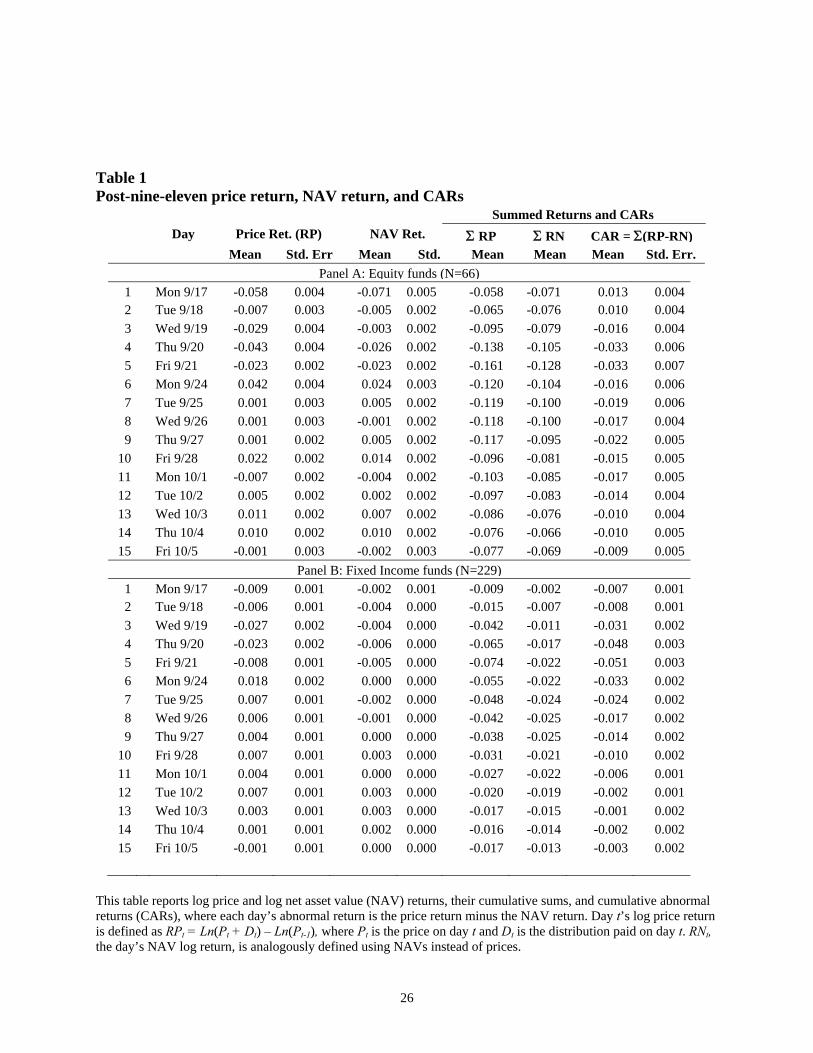
Table 1 presents daily returns for our sample of funds following nine-eleven. Day 1 denotes
the return from 9/10 to the first post-nine-eleven trading day after the equity markets
reopened, on Monday, 9/17. The log price return on day t, denoted RPt, is
RPt = Ln(Pt +Dt)− Ln(Pt−1), (1)
where Pt is closing price on trading day t, Dt is the dividend on trading day t, and Ln is
the natural log operator. The log NAV return for day t (denoted RPt) is similarly defined,
using NAVs in place of closing prices. Because NAVs are calculated using closing prices of
the funds’assets, NAV returns provide a good benchmark for price returns (Klibanoff, et
al., 1998). In a subsequent section, we discuss potential problems with NAV calculations
during this time period, and examine the robustness of our findings to such problems.
For equity funds (panel A), the day 1 mean price return on 9/17 is -5.8%, versus a mean
NAV return of -7.1%. Thus, on the first day of trading following nine-eleven equity funds
have a mean underreaction. However, on days two through four (9/18 - 9/20) price returns
are more negative than NAV returns, particularly on Wednesday (9/19) and Thursday
(9/20).
The far right column of Table 1 reports cumulative abnormal returns (CARs), which are
accumulations of price returns minus NAV returns. Because log returns are used, a CAR of
zero on day t would imply that earlier mispricing in percentage terms has been completely
reversed by that day during the measurement window. On Thursday, 9/20 and Friday,
9/21, the mean equity CAR is at its largest (absolute) magnitude during the sample period
at -3.3%. Given the negative cumulative NAV return on Friday (-12.8%), the CAR of -3.3%
implies an economically significant overreaction, and the standard error of 0.7% implies the
overreaction is statistically significant as well. The mean CAR of -3.3% on 9/21 is over two-
and-one-half times the size (in absolute value) of the 1.3% first-day underreaction on 9/17.
Hence, despite an initial (first-day) mean price return that is less negative than the mean
7

NAV return, we argue that the overall pattern in returns across the first post-nine-eleven
week is much more consistent with an overreaction by closed-end fund investors.
The mean equity price and NAV returns are equal on Friday, 9/21, and a reversal begins
on Monday, 9/24. By the 9/24 close, the mean CAR (-1.6%) is roughly half the mean CAR
on 9/21 (-3.3%). Although NAV returns on this day are a positive 2.4% on Monday, price
returns are much larger at 4.2%. Mean CARs fluctuate a bit over the next few days, and
then steadily attenuate toward zero during the week beginning Monday, 10/01. By Friday,
10/05, the mean CAR is only -0.9% and is not significantly different from zero.
The pattern of overreaction and reversal in fixed income funds is even more pronounced.
For these funds (see panel B of Table 1), the mean first-day price return on Monday, 9/17
is -0.9% compared to -0.2% for the NAV return, so there is overreaction from day one.
It is interesting that the first-day patterns are so different in the equity and fixed income
funds. This reaction difference may reflect a timing difference in the reopening of the two
markets and, hence, the earlier availability of market prices in the fixed income markets.
The domestic equity markets did not reopen until Monday 9/17, whereas the fixed income
markets reopened earlier, on Thursday, 9/13. The mean CAR of -0.7% on 9/17 steadily
declines to its low of -5.1% on Friday, 9/21. Similar to the pattern for equity funds, fixed
income funds begin a reversal on Monday, 9/24, when the mean CAR increases to -3.3%.
By Friday, 10/05 the mean CAR is only -0.3%.
Figures 1 and 2 graph these patterns. In Figure 1, which begins earlier on 9/4 in order
to present return patterns in a broader context, the cumulative NAV returns (ΣRN) are
shown with solid lines and the cumulative price returns (ΣRP ) are shown with dashed lines.
The fixed income fund returns are boldfaced and the equity fund returns are not. Following
nine-eleven, prices of fixed income funds decline much more sharply than do NAVs, but
then recover by 10/5. The pattern for equity funds is similar, except on day 1 price returns
underreact relative to NAV returns (as reported in Table 1) and cumulative price returns
on 10/5 are not quite as close to cumulative NAV returns.
8

Figure 2 plots both mean CARs for the close-end funds and the cumulative S&P 500
index return (here, we align the starting point with Table 1 in order to plot the fund CARs
reported in that table). This figure highlights the post-nine-eleven mispricing. The dark
solid line plots the mean fixed income CAR and clearly shows the overreaction and reversal;
the CAR falls to its lowest value on 9/11 and then returns essentially to zero by early
October. The dotted line plots the mean equity CAR and illustrates the pattern reported
in Table 1. There is an initial underreaction, but thereafter the overall pattern is similar to
that for the fixed income funds. The gray line plots the cumulative S&P 500 index return.
It is interesting to note that the cumulative abnormal returns (CARs) of both fund types
generally follow the same sort of broad pattern in the S&P 500 cumulative returns through
much of the time period. By Friday, 9/21, investors may have been particularly pessimistic,
as suggested by the market’s performance as a leading economic indicator. Consistent with
such pessimism, an article headline in The New York Times the morning of 9/21 contained
“Deepening gloom pushes S&P Index below 1,000 mark.”9 As the market began to recover
the following week, however, so did the CARs for both types of funds. It is important to
note that although one would expect the NAV returns for equity funds to track the return
of a broad-based equity market index, there is no reason to expect cumulative abnormal
returns (i.e,. cumulative price returns relative to cumulative NAV returns) to do so.
The next question we address is whether investor sentiment improved systematically
across all funds or the initial overreactions were reversed on a fund-by-fund basis. To
investigate this, as well as the significance of the overreaction and reversal relative to typical
weeks, we use regression analysis.
4.3 Pooled, cross-sectional time series regressions
Table 2 presents our primary regression results. We focus on weekly (Friday-to-Friday)
abnormal returns to test whether the overreaction by the end of the first post-nine-eleven
trading week, and the reversal that follows, are statistically significant. We use a pooled,
9See “A nation challenged: The markets; Deepening gloom pushes S&P Index below 1,000 mark,”by A.Berenson (The New York Times, September 21, 2001, Section C, page 7).
9

cross-sectional time-series approach that controls for fixed fund effects (i.e., each fund has
its own intercept term). In many respects our approach is similar to Klibanoff, et al.
(1998). One key difference, however, is that they regress price returns on contemporaneous
and lagged NAV returns and interact regressor variables with salient news week indicator
variables.10 In contrast, we regress abnormal returns (price returns less NAV returns) on
an event indicator variable, lagged event indicator variables, lagged abnormal returns, and
interaction terms, where an abnormal return is defined as the price return minus the NAV
return. We prefer our approach because it allows us to investigate the extent to which a
fund’s abnormal return in a given week is directly tied to its prior-week abnormal return.
In turn, this allows us to investigate the extent to which reversals during the second and
third trading weeks following nine-eleven are fund-specific and tied to the magnitude of the
overreaction in each fund during the first post-nine-eleven trading week.
We define the abnormal return for trading week t as
ARt = RPt −RNt, (2)
where RPt is defined according to equation (1), and RNt is analogously defined using NAVs
in place of prices. We can view ARt as measuring the extent to which price returns are
“abnormal” relative to changes in valuations captured by NAV returns. The regression
analysis includes 48 pre-nine-eleven weekly abnormal return observations, the abnormal
return over the event itself, and five post-nine-eleven observations. Note that the abnormal
return over nine-eleven spans two calendar weeks, measured from Friday, 9/8, to Friday,
9/21, because of the market closure. All models include unreported fund-specific constants
(i.e., fixed group-effect indicators) and allow for autocorrelated and heteroscedastic error
terms. In addition, we allow for a distinct error term for the nine-eleven abnormal return,
which corrects for increased volatility due to (1) the event itself and (2) the greater than
usual number of calendar days over this abnormal return’s measurement period.11
10We also estimated such regressions and found results consistent with those reported below. These resultsare available upon request11We estimate time-series, cross-sectional models using the Gauss-Newton method of Davidson and McK-
innon (1980) and allow for heteroscedasticity both between funds and between event and non-event weeks.In addition, we allow for first-order autocorrelation among the residuals of each fund and obtain unbiased
10

To distinguish between returns linked to the trading week of nine-eleven and those that
are not (either contemporaneously or with a lag), we define three event indicator variables
Et, Et−1, and Et−2. The first, Et, equals 1 if trading week t contains nine-eleven (and equals
0 otherwise), and Et−1 equals 1 if the prior trading week contains nine-eleven. Similarly,
Et−2 equals 1 if the trading week two weeks prior contains nine-eleven. In the regressions,
the coeffi cients on Et, Et−1, and Et−2 measure, respectively, the abnormal returns for the
trading week of nine-eleven, the first trading week after nine-eleven, and the second trading
week after nine-eleven.
We also interact these event indicator variables with abnormal returns to define lagged
abnormal return regressor variables that do (or do not) include nine-eleven. For example,
relative to the dependent variable (which is the abnormal return for week t), the regressor
variable Et−1 x ARt−1 equals the abnormal return over nine-eleven if the prior week t-1
includes nine-eleven. Otherwise, Et−1 x ARt−1 equals zero (because Et−1 is zero). Thus,
Et−1 x ARt−1 equals the lagged abnormal return only when week t-1 includes nine-eleven
and is zero otherwise. In contrast, the regressor variable (1 − Et−1) x ARt−1 equals the
lagged abnormal return when week t-1 does not include nine-eleven and is zero otherwise.
Similarly, Et−2 x ARt−2 equals the abnormal return two weeks prior when it includes nine-
eleven, and (1 − Et−2) x ARt−2 equals the abnormal return two weeks prior when it does
not include nine-eleven.
As a benchmark, Model (1) reports a basic regression using only pre-nine-eleven data
for the equity funds. The coeffi cient on (1−Et−1) x ARt−1 is significantly negative with a
coeffi cient (p-value) of -22.6% (<0.001). This shows that a typical week’s abnormal return
is negatively related to the prior week’s abnormal return. On average, about 22.6% of the
abnormal return in a given week is reversed during the next. Reversals continue into the
second week as well; the coeffi cient on (1−Et−2) x ARt−2 is -13.4% and is significant with
a p-value less than 0.001. The evidence in Klibanoff, et al. (1998) implies a similar pattern
of reversals. They conclude that prices typically underreact to contemporaneous changes in
estimates of this correlation. Our approach differs from Klibanoff, et al. (1998) in that we allow for first-order autocorrelation in the residuals. The overreaction and reversal effects in the regressions we documentare qualitatively unaffected by alternative techniques including simple ordinary least squares both with andwithout fixed effects.
11

NAVs, and that underreactions partially reverse in the weeks that follow.12 In salient news
weeks, however, they find that contemporaneous underreaction is significantly smaller.
Model (2) includes the nine-eleven event indicator variables in a regression that also
includes the nine-eleven trading week and the five post-nine-eleven trading weeks. The
coeffi cient (p-value) on Et is -3.2% (<0.001). This indicates that the average abnormal
return for the first post-nine-eleven trading week is -3.2%, which is consistent with the
findings in Table 1. The coeffi cient (p-value) on Et−1 is 1.4% (0.019), indicating that
in the subsequent week about half of the negative abnormal return across nine-eleven is
reversed. The reversal does not continue significantly into the week that follows (Et−2 is
insignificant). Overall, Model (2) shows that equity funds experience an overreaction (a
negative post-nine-eleven abnormal return) followed by a partial reversal, and this pattern
is statistically significant. In the context of the findings in Klibanoff, et al. (1998), it appears
that nine-eleven was so intensely salient that instead of less pronounced underreaction, there
was overreaction.
Model (3) adds the terms that interact lagged abnormal returns with the lagged nine-
eleven indicator variables. These terms test whether the magnitudes of reversals during the
second and third trading weeks following nine-eleven are tied to the nine-eleven abnormal
returns (i.e., from 9/10 through 9/21). The coeffi cient (p-value) on Et−1 x ARt−1 is -37.8%
(0.001), indicating that the second week’s abnormal return includes on average 37.8% of
the nine-eleven abnormal return, in the opposite direction. Hence, there is a significant
fund-specific component to the first week of nine-eleven reversals.
Fund-specific reversals extend to the third post-nine-eleven week as well, as the co-
effi cient (p-value) on Et−2 x ARt−2 is -24.9% (0.005). Note that both of the coeffi -
cients on Et−1 and Et−2 are insignificant in Model (3). Along with the significance of
Et−1 x ARt−1 and Et−2 x ARt−2, this implies that for the equity funds, reversals following
nine eleven overreactions are primarily fund specific. It may well be true that systematic
sentiment, as discussed in De Long et al. (1990b) and Lee, et al. (1991), plays a significant
12 If we follow Klibanoff, et al. (1998) and regress price returns on contemporaneous and lagged NAVreturns (instead of regressing abnormal returns on lagged abnormal returns), we replicate both of thesefindings for the non-event weeks in our sample period.
12

role in the initial first-week overreaction to nine-eleven. The evidence on the reversals,
however, shows that systematic sentiment by itself cannot explain the overall patterns we
observe for equity funds.
Models (4) through (6) repeat the regressions for the fixed income funds. Model (4),
estimated with only pre-nine-eleven data, shows that fund-specific reversals are also the
norm for fixed income funds, albeit with a lag. The coeffi cient on (1 − Et−1) x ARt−1 is
not statistically significant, but that on (1 − Et−2) x ARt−2 is negative with a p-value of
less than 0.001. Model (5) includes the entire sample period and adds the three indicator
variables Et, Et−1, and Et−2. The coeffi cient (p-value) on Et is -3.9% (<0.001), indicating
that the average abnormal return associated with nine-eleven is -3.9% for the fixed income
funds. The coeffi cient (p-value) on Et−1 is 0.025 (<0.001). Thus, on average, the reversal for
fixed-income funds during the second post-nine-eleven trading week is 2.5%. The coeffi cient
on Et−2 is not significant.
Model (6) adds the terms that test for a fund-specific reversal component. Et−1 x ARt−1 has
a coeffi cient of -54.5% and a p-value of less than 0.001. Therefore, more than half of the
average fund’s nine-eleven abnormal return is reversed in the week that follows. The coeffi -
cient on Et−2 x ARt−2 is weakly significant (p = 0.052) with a coeffi cient of -6.8%. Hence,
a fund-specific reversal continues during the third post-nine-eleven trading week as well,
although it is relatively small. The coeffi cient on Et−1 remains positive and significant,
indicating that there is a systematic component to nine-eleven reversals after controlling
for the fund-specific components. However, the coeffi cient is small (0.004) and hence not
particularly significant from an economic perspective.
It is interesting that the patterns of overreaction we document are more severe for fixed-
income than equity funds. This may be due to closed-end fund investors misunderstanding
the potential impact of nine-eleven on the fundamental values of fixed income securities
(the funds’underlying assets). Nine-eleven could have impacted two primary determinants
of fixed income security values. First, the values of fixed-income securities depend on
risk-free interest rates of the comparable maturity, and such rates were widely observable
following nine-eleven. Medium and long-term risk-free rates declined slightly in response to
13

actions taken by the Federal Reserve. Second, the values of fixed-income securities depend
on spreads on comparable-risk debt, which were also observable following nine-eleven. As
shown in Figure 3, spreads on risky bonds increased by around 50 basis points over their pre-
nine-eleven levels. Changes in these two components partially offset each other, and resulted
in only slightly higher yields and hence slightly lower values for the assets underlying fixed-
income funds (see Figure 1). It appears, however, that many investors in fixed-income funds
overreacted and sold these funds as if they expected the underlying assets to experience a
significant loss in value similar to that of common stocks.
4.4 Robustness and discussion
In this section we examine the robustness of our findings and discuss several alternative
explanations.
4.4.1 Errors in net asset values
We first consider whether the evidence is potentially explained by errors in reported NAVs.
Suppose NAVs during the first week after nine-eleven (and on Friday, 9/21, in particular)
were overstated because they were not updated after nine-eleven due to the disrupted en-
vironment. If that were the case, the abnormal returns could be due to errors in the NAVs
instead of investor overreaction. However, we find that only one fund has the same NAV
both on the last trading day prior to nine-eleven and on the first trading Friday (9/21) after
nine-eleven. Thus, NAVs were updated during the first trading week following nine-eleven.
Another possibility is that, although reported NAVs were updated, some of the asset
prices used in NAV calculations were stale. This could have resulted in valuation errors
immediately after nine-eleven. For example, suppose the risk of default increased immedi-
ately following nine-eleven. If bond prices for NAV calculations were stale or matrix-priced
based on a pre-nine-eleven risk assessment, they would have been too high (relative to true
fundamentals), which would have caused overstated fixed-income NAVs.
14

Figure 3 plots the Baa-rated corporate bond yield spread (above the 10-year treasury
yield) and shows that the default premium did increase following nine-eleven. However, the
patterns of price and NAV returns are not consistent with NAVs being overstated because
of increased default risk. As shown in Figure 3, the default premium remains substantially
elevated through 10/05. And yet, cumulative price returns recovered to the level of cu-
mulative NAV returns instead of cumulative NAV returns converging to cumulative price
returns (see Figure 1 for fixed income funds). If bond prices were erroneously high and did
not reflect the increased default premium at first, then as bond prices became increasingly
accurate, cumulative NAV returns should have converged to cumulative price returns.
Moreover, it is notable that the pattern of fixed income fund CARs is generally similar
to that of equity funds. Because the equity markets were open and actively trading during
the entire first post-nine-eleven trading week, equity fund CARs should not be materially
affected by NAV errors. Even for thinly traded stocks, updated, secondary-market based
prices would have been available after a full week of trading. When the entire post-nine-
eleven trading week is considered, the general patterns in the fixed income versus equity
abnormal returns are quite similar. This similarity in CARs for the two types of funds is at
odds with NAV errors causing the observed patterns because NAV errors are functionally
more likely to occur in fixed income funds.13
As an additional check, we spoke with multiple people responsible for the NAV calcula-
tions of a variety of closed-end funds. They assured us that prior to Friday, 9/21, accurate,
updated secondary-market based prices were being used to calculate NAVs. The overall
evidence strongly supports the notion that NAVs for Friday 9/21 are not based on stale
prices, and thus, that stale NAV values do not explain our findings.
13One potential exception is the case of certain foreign-equity funds (“country funds”) that own thinlytraded stock or equities for which it is otherwise more diffi cult to obtain updated secondary market pricesthan for US domestic stocks. As we report in the subsequent section, however, the results for equity fundsare not driven by country funds.
15

4.4.2 The effect of foreign funds
We next examine whether the results are significantly influenced by funds that primarily
hold non-U.S. assets. As we allude to in the prior section, for example, perhaps NAV
calculations for funds holding foreign assets are less accurate. Such a possibility makes it
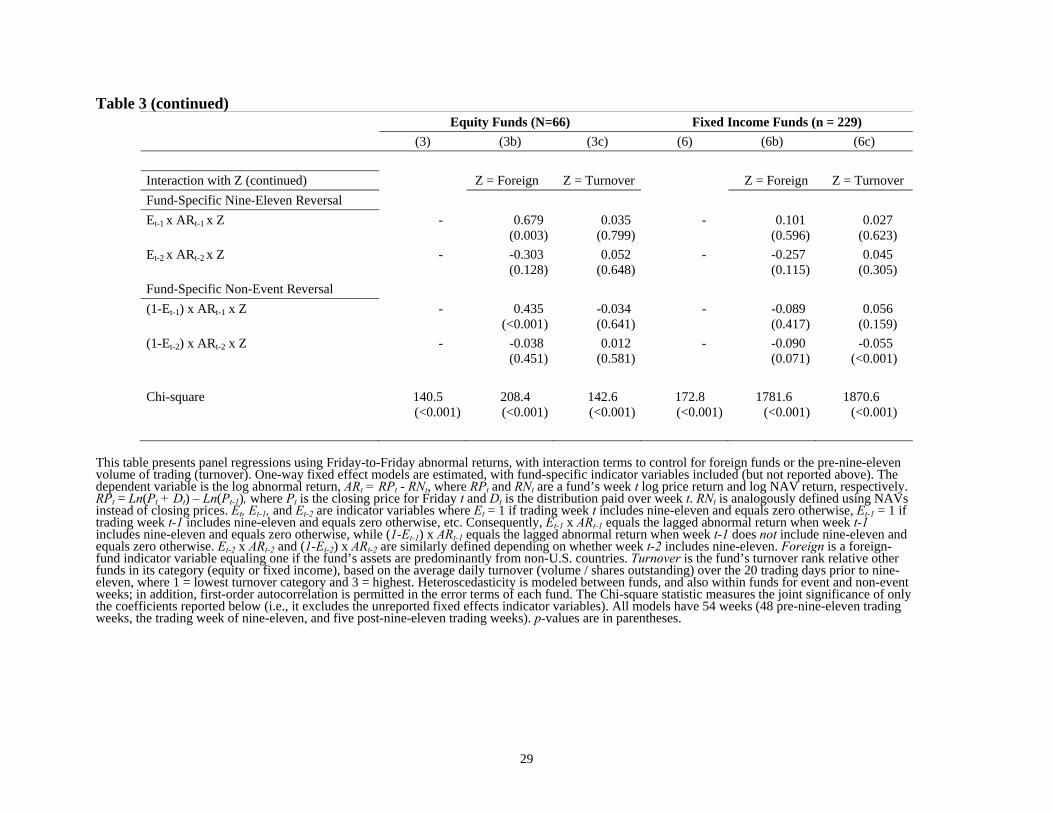
important to investigate whether such funds drive the findings, which we do in Table 3. The
first model is model (3) from Table 2, which we include to facilitate comparisons. The second
regression (3b) investigates whether the results differ between funds primarily invested in
foreign versus U.S. assets. This model includes interaction terms with a foreign indicator
variable (Z equals 1 for foreign and zero otherwise), which are reported in the bottom half
of the table. We classify as “foreign”all funds included in Barron’s world equity closed-end
fund category, one Canadian fund, and one global fund (based on its name and holdings).
Forty-one of the 66 equity funds are classified as foreign, leaving 25 classified as domestic.
We do not include a foreign fund indicator variable by itself, because we already include
fixed effects at the fund level (which makes including a foreign fund indicator redundant).
Comparing model (3b) to model (3), we observe that the pattern of overreaction and
reversal is more pronounced for the 25 domestic funds. This can be seen by comparing the
coeffi cient of -0.044 on Et in model (3b) to the coeffi cient of -0.032 in model (3) (note that
in model (3b) the interaction term Et x Z is also included, which allows for a foreign-fund-
specific mean and causes Et to measure the domestic mean). The fund-specific reversal
is also much more dramatic, as the coeffi cient on Et−1 x ARt−1 changes from -0.378 in
model (3) to -0.735 in model (3b). This indicates that for domestic funds, the reversal in
the second week following nine-eleven includes about 74% of the negative abnormal return
following nine-eleven.
For foreign equity funds, summing the coeffi cients on Et and Et−1 x Z indicates that the
abnormal return following nine-eleven is -2.3% on average. Reversals during the second and
third post-nine-eleven trading weeks are not particularly significant in the economic sense.
For example, for the systematic component of the reversal, the sum of the coeffi cients on
Et and Et−1 x Z yields a combined coeffi cient of only 0.006, and the combined coeffi cient
16

for the fund-specific reversal, the sum of (Et−1 x ARt−1) and (Et−1 x ARt−1 x Z), is
only -0.056 of each fund’s prior-week abnormal return (ARt−1). Overall, we conclude that
the overreaction and reversal patterns for equity funds are not caused by foreign funds.
Instead, the patterns are actually more pronounced for funds that invest in U.S. equities.
In untabulated results, we repeat the analysis using interaction terms with an emerging
market indicator variable (instead of the more general foreign fund indicator variable) and
obtain similar results. For completeness, model (6b) adds foreign fund interaction terms
for the fixed income funds. Only 12 of the 229 fixed income funds are classified as foreign
funds, so not surprisingly the results for fixed income funds remain robust to any concerns
about funds primarily invested in foreign assets.
4.4.3 Market depth effects in the closed-end fund shares
The lack of suffi cient market depth to accommodate panicked sellers is another potential
explanation for the results. Investors may have been willing to pay a premium to liquidate
their shares immediately. This is another manifestation of overreaction, where panicked
investors liquidated their holdings immediately because they were concerned that liquidation
prices in the future could be even lower. Liquidity providers may have taken advantage of
this and profited from buying shares at transaction prices that were artificially low compared
to NAVs.
To explore the lack of market depth explanation, we calculate each fund’s average share
turnover (the trading volume divided by shares outstanding) during the 20 trading days
preceding nine-eleven. This variable is a proxy for the ability to sell shares without causing
a significant price movement (i.e., the depth the overall market provides to sellers). We
rank order the 66 equity funds by their pre-nine-eleven average turnover, and divide them
into three equal-sized groups. A turnover rank is then assigned (1 for the lowest turnover
group and 3 for the highest).
The market depth explanation predicts that panicked sellers of funds with lower pre-
nine-eleven turnover (i.e., lower market depth) will accept much lower prices in order to
attract buyers. Therefore, overreaction and reversal patterns should have been more (less)
17

pronounced in funds with lower (higher) turnover. In model (3c) in Table 3 we report a
regression that interacts the variables with the turnover rank variable (denoted by Z) for
equity closed-end funds. A positive coeffi cient on Et x Z would indicate that the negative
abnormal return is less negative for funds with higher turnover. In fact, we find that the
coeffi cient on Et x Z is insignificantly negative, which fails to support the market depth
argument. Model (6c) repeats this exercise for the fixed income funds. In this case, the
coeffi cient on Et x Z is significantly negative (p<0.001), indicating more pronounced over-
reaction for funds with higher liquidity (as measured by pre-nine-eleven turnover). Hence,
for fixed income funds as well, we conclude that the results are not explained by a lack of
market depth in the closed-end fund shares.
4.4.4 Bid-ask errors
Kaul and Nimalendran (1990) show that apparent short-run price reversals (i.e., negative
autocorrelation measured with daily returns) for NASDAQ firms are largely due to bid-
ask errors. They show that measured autocorrelation patterns are sensitive to whether
transaction prices or quoted prices (bid or ask) are examined. The patterns we observe
are over a longer time period and are unlikely to be explained by a bid-ask error effect.
Nevertheless, we investigate the robustness of the results by using closing ask quotes.
Table 4 repeats the models reported in Table 2 using returns calculated from closing
ask quotes in place of transaction prices. The inferences are not materially affected. For
example, in model (3) for the equity funds we find the average abnormal return after nine-
eleven (the coeffi cient on Et) is -3.0% compared to -3.2% in Table 2. The terms that capture
the systematic and fund-specific reversals are also similar in the two tables. Models (4)
through (6) show that the results for the fixed income funds are also materially unaffected.
Moreover, the results are again similar for both classes of funds using closing bid quotes
(results are available upon request). We conclude that bid-ask errors do not explain the
results.
18

4.4.5 Closed-end fund discount explanations
Price and NAV returns diverge because a closed-end fund’s premium or discount has
changed. It is therefore possible that explanations for closed-end fund discounts play a
role in the patterns of price and NAV returns we observe. Grullon and Wang (2001) present
a model in which closed-end fund discounts (negative premiums) occur when investors in
the closed-end funds are less informed than investors in the fund’s underlying assets. Their
information differential theory is potentially important in our setting, because any informa-
tion differential surely would have been exacerbated by nine-eleven and the market closure.
In turn, this implies that the divergence between prices and NAVs (i.e., the widening of
discounts) should have been at its most severe at the market’s reopening on Monday, 9/17.
Note also that throughout the subsequent trading week, the information differential should
have narrowed as closed-end fund investors became more informed about fundamental val-
ues by observing market activity, and in particular, disclosed NAVs. Hence, according to
this theory, prices and NAVs should have converged (i.e., discounts should have narrowed)
throughout the first post-nine-eleven trading week.
The patterns we observe are not consistent with these predictions. As shown in Table
1, discounts were at their most severe on Friday, 9/21 (the end of the first trading week),
not Monday, 9/17 when the market reopened. Moreover, the cumulative price and NAV
returns move away from each other and discounts widen throughout the first trading week,
as shown by the increasingly negative mean CARs.
There are, of course, other proposed explanations for closed-end fund discounts. Among
these are unrealized capital gains, managerial performance and agency problems, segmented
markets, restricted or illiquid stock holdings, and excessive turnover within the fund’s assets
(for a review, see Dimson and Minio-Kozerski, 1999). None of these explanations are likely
to explain the patterns we observe. To varying degrees, these explanations imply that
discounts should have been unaffected around nine-eleven or at their widest on Monday,
9/17, when the market reopened. None of these explanations imply that discounts should
19
have become wider through the first post-nine-eleven trading week, only to narrow over the
subsequent two weeks.
Swaminathan (1996) finds that higher discounts forecast a worsening economy, and con-
cludes that small investors have predictive information regarding future expected earnings
and inflation. Hirshleifer (2001) further interprets these results as investors overreacting
to the economic decline they anticipate. The patterns we observe in connection with nine-
eleven can indeed be interpreted as being caused by small investors overreacting to fears of
a declining economy. If so, the overreaction reversed itself as investors gradually realized
the adverse economic effect would not be as severe as they initially believed.
4.4.6 Increased costs to arbitrage
Did increased costs to arbitrage strategies play a role? Gemmill and Thomas (2002) argue
that closed-end fund prices can diverge more significantly from NAVs when costs to arbi-
trage price-NAV differentials are higher. As their paper suggests, when fund price returns
are significantly more negative than NAV returns, a risky arbitrage strategy is to buy fund
shares and short a portfolio approximating the fund’s holdings.14 Such a strategy, if em-
ployed by a significant number of investors, works to limit the divergence between prices
and NAVs. In the aftermath of nine-eleven, however, this strategy would have entailed
higher than usual costs. Closed-end fund bid-ask spreads during the 9/17 to 9/21 trading
week were considerably wider than their pre-nine-eleven levels, which would have discour-
aged sophisticated traders who normally attempt to arbitrage price-NAV differentials.15 It
is also likely that bid-ask spreads and the costs of short positions were higher for the assets
held by closed-end funds; however, we do not have data to provide empirical evidence of
this. Finally, arbitrageurs may have perceived higher than usual risks associated with their
14This strategy is risky because there is no guarantee that prices will increase suffi ciently relative to NAVsto make the strategy profitable net of transaction costs.15Mean bid-ask spreads during the pre-nine-eleven trading week were 0.30% for equity funds and 0.15% for
fixed income funds. The average spreads increased to 0.47% and 0.26%, respectively, during the first tradingweek following nine-eleven. It is interesting to note that bid-ask spreads somewhat declined during thesecond and third trading weeks (although not to their pre-nine-eleven levels), coinciding with the reversalsthat took place. The average spreads for equity and fixed income funds were, respectively, 0.41% and 0.24%during the second week and 0.40% and 0.21% during the third week.
20

typical closed-end fund trading strategies. De Long, et al. (1990b) view individual investors
(the majority of closed-end fund investors in our context) as noise traders, and note that
the beliefs of such traders may not quickly revert to their mean and may even become more
extreme in the interim. Whatever the reason, clearly closed-end fund arbitrageurs did not
enter the market in suffi cient dollar quantities to prevent the overreaction we document
during the first trading week after nine-eleven.
5 Conclusion
We document significant overreactions and subsequent reversals in the prices of closed-end
funds relative to their NAVs (net asset values) following nine-eleven. During the first post-
nine-eleven trading week, price returns are significantly more negative than NAV returns.
The overreaction largely reverses itself in the two weeks that follow, with the magnitude of
each fund’s reversal directly proportional to each fund’s earlier overreaction. Hence, even
though some of our findings are consistent with the small-investor sentiment hypothesis
in De Long et. al. (1990b) and Lee, Shleifer and Thaler (2000), systematic sentiment by
itself cannot explain the overall patterns that we document. We build on Klibanoff, et al.’s
(1998) study of closed-end funds, which finds that although investors underreact to news
in general, they underreact less when news is more salient. Our results are consistent with
a broader continuum for their finding in the sense that a super-salient news event not only
results in less underreaction, but can result in overreaction. Hence, investor reaction may
lie on an under-overreaction continuum in which the salience of the event determines the
direction and magnitude of mispricing.
Much of the extant research on investor reaction to new information is subject to con-
cerns about endogeneity, comparability across observations, and biases caused by risk mea-
surement error. Our study circumvents these concerns by examining the share price behav-
ior of closed-end funds around the tragic events of nine-eleven. This setting is particularly
useful because the event we examine is entirely exogenous, economically significant, and
naturally aligns comparable observations in calendar time. Using returns in net asset val-
21

ues as benchmarks for price returns, we avoid the need to construct artificial benchmarks
using an asset pricing model.
From one viewpoint, the nine-eleven attacks might be thought of as being totally unique.
However, from a broader perspective, nine-eleven is a major news event, and major news
events are not unusual. In this light, we believe our findings can be generalized to offer
insights into how investors react to dramatic events, both systematic and firm specific,
such as a sudden macroeconomic shock or the revelation of a corporate scandal. Because
individual investors play a more prominent role in closed-end fund trading relative to the
role they play in the securities underlying NAVs, our findings may be most relevant for
assets in which individual investors play a relatively more important role such as small
stocks.
An issue we leave for future research is the role and timing of trading by arbitrageurs
and other sophisticated investors in the aftermath of super-salient news events. In the case
of closed-end funds and nine-eleven, it is likely that such investors were initially reluctant to
trade away mispricing due to increased noise trader risk, greater uncertainty, and elevated
transaction costs. As these conditions abated during the second and third weeks following
nine-eleven, such investors may have intervened to cause the reversals in mispricing we
document.
22

References
Anderson, Torben G., Tim Bollerslev, Francis X. Diebold, and Clara Vega, 2003, “MicroEffects of Macro Announcements: Real-Time Price Discovery in Foreign Exchange,”American Economic Review 93, 38-62.
Barber, Brad M., and Terrance Odean, 2008, “All That Glitters: The Effect of Attentionand News on the Buying Behavior of Individual and Institutional Investors,”Review ofFinancial Studies 21, 785-818.
Barberis, Nicholas, Andrei Shleifer, and Robert Vishny, 1998, “A Model of InvestorSentiment,”Journal of Financial Economics 49, 307-343.
Burch, Timothy, Douglas Emery, and Michael Fuerst, 2003, “What Can ‘Nine-Eleven’TellUs about Closed-End Fund Discounts and Investor Sentiment?”Financial Review 38,515-529.
Carter, David, and Betty Simkins, 2004, “The Market’s Reaction to Unexpected,Catastrophic Events: The Case of Airline Stock Returns and the September 11thAttacks,”Quarterly Journal of Economics and Finance 44, 539-558.
Charles, Amélie, and Olivier Darné, 2006, “Large Shocks and the September 11thTerrorist Attacks on International Stock Markets,”Economic Modelling 23, 683-698.
Davidson, Russell, and James. G. MacKinnon, 1980, “Estimating the Covariance Matrixfor Regression Models with AR(1) Errors and Lagged Dependent Variables,”EconomicLetters 6, 119-23.
Daniel, Kent, David Hirshleifer, and Avanidhar Subrahmanyam, 1998, “InvestorPsychology and Security Market Under- and Overreactions,”Journal of Finance 53,1839-1886.
Dellavigna, Stefano, and Joshua M. Pollett, 2009, “Investor Inattention and FridayEarnings Announcements,”Journal of Finance 64, 709-749.
De Long, J. Bradford, Andrei Shleifer, Lawrence Summers, and Robert Waldmann, 1990a,“Positive Feedback Investment Strategies and Destabilizing Rational Speculation,”Journal of Finance 45, 379-395.
De Long, J. Bradford, Andrei Shleifer, Lawrence H. Summers, and Robert J. Waldmann,1990b, “Noise Trader Risk in Financial Markets,”Journal of Political Economy 98,703-738.
Dimson, Elroy, 1988, Stock Market Anomalies, Cambridge University Press.
Dimson, Elroy, and Carolina Minio-Kozerski, 1999, “Closed-End Funds: A Survey,”Financial Markets, Institutions and Instruments 8, no. 2, 1-41.
Drakos, Konstantinos, 2004, “Terrorism-Induced Structural Shifts in Financial Risk:Airline Stocks in the Aftermath of the September 11th Terrorist Attacks,”EuropeanJournal of Political Economy 20, 435-446.
23

Epstein, Larry, and Martin Schneider, 2008, “Ambiguity, Information Quality, and AssetPricing,”Journal of Finance 63, 197-228.
Fang, Lily, and Joel Peress, 2009, “Media Coverage and the Cross-section of StockReturns,”Journal of Finance 64, 2023-2052.
Gemmill, Gordon, and Dylan Thomas, 2002, “Noise Trading, Costly Arbitrage, and AssetPrices: Evidence from Closed-End Funds,”Journal of Finance 57, 2571-2594.
Glaser, Markus, and Martin Weber, 2005, "September 11 and Stock Return Expectationsof Individual Investors," Review of Finance 9, 243-279.
Grullon, Gustavo, and F. Albert Wang, 2001, “Closed-End Fund Discounts with InformedOwnership Differential,”Journal of Financial Intermediation 10, 171-205.
Hirshleifer, David, 2001, “Investor Psychology and Asset Pricing,”Journal of Finance 56,1533-1597.
Hirshleifer, David, Sonya Seongyeon Lim, and Siew Hong Teoh, 2009, “Driven toDistraction: Extraneous Events and Underreaction to Earnings News,”Journal of Finance64, 2289-2325.
Hong, Harrison, and Jeremy C. Stein, 1999, “A Unified Theory of Underreaction,Momentum Trading and Overreaction in Asset Markets,”Journal of Finance 54,2143-2184.
Ikenberry, David, Josef Lakonishok, and Theo Vermaelen, 1995, “Market Underreaction toOpen Market Share Repurchases,”Journal of Financial Economics 39, 181-208.
Ito, Harumi, and Darin Lee, 2005, “Assessing the Impact of the September 11th TerroristAttacks on U.S. Airline Demand,”Journal of Economics and Business 57, 75-95.
Kadiyala, Padma, and P. Raghavendra Rau, 2004, “Investor Reaction to Corporate EventAnnouncements: Underreaction or Overreaction?”Journal of Business 77, 357-386.
Kaul, Gautam, and M. Nimalendran, 1990, “Price Reversals: Bid-Ask Errors or MarketOverreaction?”Journal of Financial Economics 28, 67-93.
Klibanoff, Peter, Owen Lamont, and Thierry Wizman, 1998, “Investor Reaction to SalientNews in Closed-End Country Funds,”Journal of Finance 53, 673-699.
Lee, Charles, Andrei Shleifer, and Richard Thaler, 1991, “Investor Sentiment and theClosed-End Fund Puzzle,”Journal of Finance 46, 75-109.
Loughran, Tim, and Jay Ritter, 1995, “The New Issues Puzzle,”Journal of Finance 50,23-51.
Louis, Henock, and Amy Sun, 2010, “Investor Inattention and the Market Reaction toMerger Announcements,”Management Science 56, 1781-1793.
Maillet, Bertrand B., and Thierry L. Michel, 2005, “The Impact of the 9/11 Events on theAmerican and French Stock Markets,”Review of International Economics 13, 597-611.
24

Nikkinen, Jussi, Mohammad M. Omran, Petri Sahlström, and Janne Äijö, 2008, “StockReturns and Volatility Following the September 11 Attacks: Evidence from 53 EquityMarkets,”International Review of Financial Analysis 17, 27-46.
Pearce, Douglas, and V. Vance Roley, 1985, “Stock Prices and Economic News,”Journalof Business 58, 49-67.
Peng, Lin, Wei Xiong, and Tim Bollerslev, 2007, “Investor Attention and Time-VaryingComovements,”European Financial Management 13, 394-422.
Sirri, Erik R. and Peter Tufano, 1998, “Costly Search and Mutual Fund Flows,”Journalof Finance 53, 1589-1622.
Swaminathan, Bhaskaran, 1996, “Time-Varying Expected Small Firm Returns andClosed-End Fund Discounts,”Review of Financial Studies 9, 845-888.
Weiss, Kathleen, 1989, “The Post-Offering Price Performance of Closed-End Funds,”Financial Management 18, 57-67.
25
26
Table 1 Post-nine-eleven price return, NAV return, and CARs
Summed Returns and CARs Day Price Ret. (RP) NAV Ret. Σ RP Σ RN CAR = Σ(RP-RN) Mean Std. Err Mean Std. Mean Mean Mean Std. Err.
Panel A: Equity funds (N=66)1 Mon 9/17 -0.058 0.004 -0.071 0.005 -0.058 -0.071 0.013 0.0042 Tue 9/18 -0.007 0.003 -0.005 0.002 -0.065 -0.076 0.010 0.0043 Wed 9/19 -0.029 0.004 -0.003 0.002 -0.095 -0.079 -0.016 0.0044 Thu 9/20 -0.043 0.004 -0.026 0.002 -0.138 -0.105 -0.033 0.0065 Fri 9/21 -0.023 0.002 -0.023 0.002 -0.161 -0.128 -0.033 0.0076 Mon 9/24 0.042 0.004 0.024 0.003 -0.120 -0.104 -0.016 0.0067 Tue 9/25 0.001 0.003 0.005 0.002 -0.119 -0.100 -0.019 0.0068 Wed 9/26 0.001 0.003 -0.001 0.002 -0.118 -0.100 -0.017 0.0049 Thu 9/27 0.001 0.002 0.005 0.002 -0.117 -0.095 -0.022 0.005
10 Fri 9/28 0.022 0.002 0.014 0.002 -0.096 -0.081 -0.015 0.00511 Mon 10/1 -0.007 0.002 -0.004 0.002 -0.103 -0.085 -0.017 0.00512 Tue 10/2 0.005 0.002 0.002 0.002 -0.097 -0.083 -0.014 0.00413 Wed 10/3 0.011 0.002 0.007 0.002 -0.086 -0.076 -0.010 0.00414 Thu 10/4 0.010 0.002 0.010 0.002 -0.076 -0.066 -0.010 0.00515 Fri 10/5 -0.001 0.003 -0.002 0.003 -0.077 -0.069 -0.009 0.005
Panel B: Fixed Income funds (N=229)1 Mon 9/17 -0.009 0.001 -0.002 0.001 -0.009 -0.002 -0.007 0.0012 Tue 9/18 -0.006 0.001 -0.004 0.000 -0.015 -0.007 -0.008 0.0013 Wed 9/19 -0.027 0.002 -0.004 0.000 -0.042 -0.011 -0.031 0.0024 Thu 9/20 -0.023 0.002 -0.006 0.000 -0.065 -0.017 -0.048 0.0035 Fri 9/21 -0.008 0.001 -0.005 0.000 -0.074 -0.022 -0.051 0.0036 Mon 9/24 0.018 0.002 0.000 0.000 -0.055 -0.022 -0.033 0.0027 Tue 9/25 0.007 0.001 -0.002 0.000 -0.048 -0.024 -0.024 0.0028 Wed 9/26 0.006 0.001 -0.001 0.000 -0.042 -0.025 -0.017 0.0029 Thu 9/27 0.004 0.001 0.000 0.000 -0.038 -0.025 -0.014 0.002
10 Fri 9/28 0.007 0.001 0.003 0.000 -0.031 -0.021 -0.010 0.00211 Mon 10/1 0.004 0.001 0.000 0.000 -0.027 -0.022 -0.006 0.00112 Tue 10/2 0.007 0.001 0.003 0.000 -0.020 -0.019 -0.002 0.00113 Wed 10/3 0.003 0.001 0.003 0.000 -0.017 -0.015 -0.001 0.00214 Thu 10/4 0.001 0.001 0.002 0.000 -0.016 -0.014 -0.002 0.00215 Fri 10/5 -0.001 0.001 0.000 0.000 -0.017 -0.013 -0.003 0.002
This table reports log price and log net asset value (NAV) returns, their cumulative sums, and cumulative abnormal returns (CARs), where each day’s abnormal return is the price return minus the NAV return. Day t’s log price return is defined as RPt = Ln(Pt + Dt) – Ln(Pt-1), where Pt is the price on day t and Dt is the distribution paid on day t. RNt, the day’s NAV log return, is analogously defined using NAVs instead of prices.

27
Table 2 Panel data regressions of Friday-to-Friday abnormal returns
Equity Funds (N=66) Fixed Income Funds (n = 229) (1) (2) (3) (4) (5) (6)
Nine-Eleven Reaction Et - -0.032
(<0.001)-0.032
(<0.001) - -0.039
(<0.001)-0.039
(<0.001)General Nine-Eleven Reversal Et-1 (Positive implies reversal) - 0.014
(0.019)0.003
(0.504) - 0.025
(<0.001)0.004
(0.035)Et-2 (Positive implies reversal) - 0.001
(0.961)-0.005 (0.223)
- -0.002 (0.145)
-0.001 (0.839)
Fund-Specific Nine-Eleven Reversal Et-1 x ARt-1 (Negative implies reversal) - - -0.378
(0.001) - - -0.545
(<0.001)Et-2 x ARt-2 (Negative implies reversal) - - -0.249
(0.005) - - -0.068
(0.052)Fund-Specific Non-Event Reversal (1-Et-1) x ARt-1 (Negative implies reversal) -0.226
(<0.001)-0.077 (0.090)
-0.214 (0.001)
0.007 (0.816)
0.281 (0.281)
0.099 (0.003)
(1-Et-2) x ARt-2 (Negative implies reversal) -0.134 (<0.001)
-0.136 (<0.001)
-0.124 (<0.001)
-0.120 (<0.001)
(-0.167)(<0.001)
-0.098 (<0.001)
Chi-square 61.4 (<0.001)
140.0 (<0.001)
140.5 (<0.001)
172.8 (<0.001)
1426.8 (<0.001)
1766.9 (<0.001)
Weeks 48 54 54 48 54 54
One-way fixed effect models are estimated, with fund-specific indicator variables included (but not reported above). The dependent variable is the log abnormal return, ARt = RPt - RNt, where RPt and RNt are a fund’s week t log price return and log NAV return, respectively. RPt = Ln(Pt + Dt) – Ln(Pt-1), where Pt is the closing price for Friday t and Dt is the distribution paid over week t. RNt is analogously defined using NAVs instead of closing prices. Et, Et-1, and Et-2 are indicator variables where Et = 1 if trading week t includes nine-eleven and equals zero otherwise, Et-1 = 1 if trading week t-1 includes nine-eleven and equals zero otherwise, etc. Consequently, (Et-1)(ARt-1) equals the lagged abnormal return when week t-1 includes nine-eleven and equals zero otherwise, while (1-Et-1) x ARt-1 equals the lagged abnormal return when week t-1 does not include nine-eleven and equals zero otherwise. Et-2 x ARt-2 and (1-Et-2) x ARt-2 are similarly defined depending on whether week t-2 includes nine-eleven. Heteroscedasticity is modeled between funds and also within funds for event and non-event weeks; in addition, first-order autocorrelation is permitted in the error terms of each fund. The Chi-square statistic measures the joint significance of only the coefficients reported below (i.e., it excludes the unreported fixed effects indicator variables). Regression models 2, 3, 5, and 6 have 54 weeks (48 pre-nine-eleven trading weeks, the 1 trading week containing nine-eleven, and 5 post-nine-eleven trading weeks), and models 1 and 4 only include the 48 pre-nine-eleven trading weeks. p-values are in parentheses.

28
Table 3 Panel data regressions controlling for foreign funds or market depth effects
Equity Funds (N=66) Fixed Income Funds (n = 229) (3) (3b) (3c) (6) (6b) (6c)
Nine-Eleven Reaction Et -0.032
(<0.001)-0.044
(<0.001)-0.026 (0.026)
-0.039 (<0.001)
-0.039 (<0.001)
-0.014 (<0.001)
General Nine-Eleven Reversal Et-1 (Positive implies reversal) 0.003
(0.504)-0.008 (0.411)
-0.002 (0.881)
0.004 (0.035)
0.004 (0.047)
-0.007 (0.154)
Et-2 (Positive implies reversal) -0.005 (0.223)
0.011 (0.182)
-0.007 (0.524)
-0.001 (0.839)
0.001 (0.980)
0.001 (0.973)
Fund-Specific Nine-Eleven Reversal Et-1 x ARt-1 (Negative implies reversal) -0.378
(0.001)-0.735
(<0.001)-0.474 (0.146)
-0.545 (<0.001)
-0.536 (<0.001)
-0.607 (<0.001)
Et-2 x ARt-2 (Negative implies reversal) -0.249 (0.005)
-0.057 (0.732)
-0.374 (0.188)
-0.068 (0.052)
-0.051 (0.150)
-0.174 (0.081)
Fund-Specific Non-Event Reversal (1-Et-1) x ARt-1 (Negative implies reversal) -0.214
(0.001)-0.426
(<0.001)-0.144 (0.347)
0.099 (0.003)
0.117 (0.001)
-0.050 (0.596)
(1-Et-2) x ARt-2 (Negative implies reversal) -0.124 (<0.001)
-0.137 (0.003)
-0.149 (0.002)
-0.098 (<0.001)
-0.097 (<0.001)
0.021 (0.462)
Interaction with Z Z = Foreign Z = Turnover Z = Foreign Z = Turnover Nine-Eleven Reaction Et x Z - 0.021
(0.015)-0.003 (0.561)
- -0.007 (0.373)
-0.014 (<0.001)
General Nine-Eleven Reversal Et-1 x Z - 0.014
(0.175)0.002
(0.713) - 0.022
(0.030)0.006
(0.020) Et-2 x Z - -0.022
(0.021)0.001
(0.837) - -0.014
(0.143)-0.001 (0.954)
29
Table 3 (continued) Equity Funds (N=66) Fixed Income Funds (n = 229) (3) (3b) (3c) (6) (6b) (6c)
Interaction with Z (continued) Z = Foreign Z = Turnover Z = Foreign Z = Turnover Fund-Specific Nine-Eleven Reversal Et-1 x ARt-1 x Z - 0.679
(0.003)0.035
(0.799) - 0.101
(0.596)0.027
(0.623) Et-2 x ARt-2 x Z - -0.303
(0.128)0.052
(0.648) - -0.257
(0.115)0.045
(0.305) Fund-Specific Non-Event Reversal (1-Et-1) x ARt-1 x Z - 0.435
(<0.001)-0.034 (0.641)
- -0.089 (0.417)
0.056 (0.159)
(1-Et-2) x ARt-2 x Z - -0.038 (0.451)
0.012 (0.581)
- -0.090 (0.071)
-0.055 (<0.001)
Chi-square 140.5
(<0.001)208.4 (<0.001)
142.6 (<0.001)
172.8 (<0.001)
1781.6 (<0.001)
1870.6 (<0.001)
This table presents panel regressions using Friday-to-Friday abnormal returns, with interaction terms to control for foreign funds or the pre-nine-eleven volume of trading (turnover). One-way fixed effect models are estimated, with fund-specific indicator variables included (but not reported above). The dependent variable is the log abnormal return, ARt = RPt - RNt, where RPt and RNt are a fund’s week t log price return and log NAV return, respectively. RPt = Ln(Pt + Dt) – Ln(Pt-1), where Pt is the closing price for Friday t and Dt is the distribution paid over week t. RNt is analogously defined using NAVs instead of closing prices. Et, Et-1, and Et-2 are indicator variables where Et = 1 if trading week t includes nine-eleven and equals zero otherwise, Et-1 = 1 if trading week t-1 includes nine-eleven and equals zero otherwise, etc. Consequently, Et-1 x ARt-1 equals the lagged abnormal return when week t-1 includes nine-eleven and equals zero otherwise, while (1-Et-1) x ARt-1 equals the lagged abnormal return when week t-1 does not include nine-eleven and equals zero otherwise. Et-2 x ARt-2 and (1-Et-2) x ARt-2 are similarly defined depending on whether week t-2 includes nine-eleven. Foreign is a foreign-fund indicator variable equaling one if the fund’s assets are predominantly from non-U.S. countries. Turnover is the fund’s turnover rank relative other funds in its category (equity or fixed income), based on the average daily turnover (volume / shares outstanding) over the 20 trading days prior to nine-eleven, where 1 = lowest turnover category and 3 = highest. Heteroscedasticity is modeled between funds, and also within funds for event and non-event weeks; in addition, first-order autocorrelation is permitted in the error terms of each fund. The Chi-square statistic measures the joint significance of only the coefficients reported below (i.e., it excludes the unreported fixed effects indicator variables). All models have 54 weeks (48 pre-nine-eleven trading weeks, the trading week of nine-eleven, and five post-nine-eleven trading weeks). p-values are in parentheses.

30
Table 4 Panel data regressions of Friday-to-Friday abnormal returns based on closing ask quotes
Equity Funds (N=66) Fixed Income Funds (n = 229) (1) (2) (3) (4) (5) (6)
Nine-Eleven Reaction Et - -0.030
(<0.001) -0.030
(<0.001) - -0.036
(<0.001) -0.037
(<0.001) General Nine-Eleven Reversal Et-1 (Positive implies reversal) - 0.012
(0.001) 0.002
(0.586) - 0.023
(<0.001) 0.004
(0.046) Et-2 (Positive implies reversal) - 0.001
(0.920) -0.005 (0.169)
- -0.001 (0.294)
0.001 (0.910)
Fund-Specific Nine-Eleven Reversal Et-1 x ARt-1 (Negative implies reversal) - - -0.344
(0.001) - - -0.542
(<0.001) Et-2 x ARt-2 (Negative implies reversal) - - -0.262
(0.001) - - -0.073
(0.039) Fund-Specific Non-Event Reversal (1-Et-1) x ARt-1 (Negative implies reversal) -0.226
(<0.001) -0.044 (0.304)
-0.177 (0.003)
0.007 (0.816)
0.286 (<0.001)
0.088 (0.009)
(1-Et-2) x ARt-2 (Negative implies reversal) -0.134 (<0.001)
-0.140 (<0.001)
-0.124 (<0.001)
-0.120 (<0.001)
-0.167 (<0.001)
-0.094 (<0.001)
Chi-square 61.4 (<0.001)
129.8 (<0.001)
138.5 (<0.001)
172.8 (<0.001)
1426.8 (<0.001)
1675.3 (<0.001)
Weeks 48 54 54 48 54 54 One-way fixed effect models are estimated, with fund-specific indicator variables included (but not reported above). The dependent variable is the log abnormal return, ARt = RPt - RNt, where RPt and RNt are a fund’s week t log price return and log NAV return, respectively. RPt = Ln(Pt + Dt) – Ln(Pt-1), where Pt is the closing ask quote for Friday t and Dt is the distribution paid over week t. RNt is analogously defined using NAVs instead of closing ask quotes. Et, Et-1, and Et-2 are indicator variables where Et = 1 if trading week t includes nine-eleven and equals zero otherwise, Et-1 = 1 if trading week t-1 includes nine-eleven and equals zero otherwise, etc. Consequently, Et-1 x ARt-1 equals the lagged abnormal return when week t-1 includes nine-eleven and equals zero otherwise, while (1-Et-1) x ARt-1 equals the lagged abnormal return when week t-1 does not include nine-eleven and equals zero otherwise. Et-2 x ARt-2 and (1-Et-2) x ARt-2 are similarly defined depending on whether week t-2 includes nine-eleven. Heteroscedasticity is modeled between funds, and also within funds for event and non-event weeks; in addition, first-order autocorrelation is permitted in the error terms of each fund. The Chi-square statistic measures the joint significance of only the coefficients reported below (i.e., it excludes the unreported fixed effects indicator variables). Regression models 2, 3, 5, and 6 have 54 weeks (48 pre-nine-eleven trading weeks, the 1 trading week containing nine-eleven, and 5 post-nine-eleven trading weeks), and models 1 and 4 only include the 48 pre-nine-eleven trading weeks. p-values are in parentheses.

31
Figure 1 Cumulative price and NAV returns around nine-eleven Mean cumulative price and net asset value (NAV) returns around the nine-eleven terrorist attack are plotted for 66 equity and 229 fixed income closed end funds. The cumulative price return (ΣRP) sums daily log price returns, where day t’s log price return is defined as RPt = Ln(Pt + Dt) – Ln(Pt-1), where Pt is the price on day t, and Dt is the distribution paid on day t. The cumulative NAV return (ΣRN) sums daily log NAV returns, where day t’s log NAV return is analogously defined using NAVs instead of prices.

32
Figure 2 Cumulative abnormal fund returns and S&P 500 cumulative return post-nine-eleven
Mean cumulative abnormal returns (CARs) from Monday 9/10 are plotted for 66 equity and 229 fixed income closed end funds are plotted alongside the cumulative S&P 500 Index return. The abnormal return for a fund on day t is RPt – RNt, where RPt and RNt are each day’s log price return and log net asset value (NAV) return, respectively. RPt = Ln(Pt + Dt) – Ln(Pt-1), where Pt is the price on day t and Dt is the distribution paid on day t, and RNt is analogously defined using NAVs instead of prices. CARs are accumulated from 9/10 forward. The cumulative S&P 500 Index return accumulates the daily log return in the index, Ln(It) – Ln(It-1), where I is the level of the S&P 500 Index. Figure 3 Bond yield spreads This graph plots the spread, in percent, of the Moody’s seasoned Baa corporate bond yield over the ten-year constant maturity yield. Both yields are obtained from the Federal Reserve Bank of St. Louis.