do leverage, dividend policy and profitability influence the firm value
DESCRIPTION
Influence of firm value by leverageTRANSCRIPT

Electronic copy available at: http://ssrn.com/abstract=1158251
Do Leverage, Dividend Policy and Profitability influence the
Future Value of Firm? Evidence from India
By
Saurabh Ghosh∗
and
Arijit Ghosh**
Indira Gandhi Institute of Development Research
Gen. A.K. Vaidya Marg, Goregaon (East),
Mumbai-400065, India
Email: [email protected]
∗ Saurabh Ghosh is presently a Research Officer in Monetary Policy Department, Reserve Bank of India. **Arijit Ghosh is Doctoral Fellow in Indira Gandhi Institute of Development Research (IGIDR). Views expressed by the authors are their personal. The usual disclaimer applies.

Electronic copy available at: http://ssrn.com/abstract=1158251
Do Leverage, Dividend Policy and Profitability influence the
Future Value of Firm? Evidence from India
Abstract
This paper examines the effect of past dividend policy, leverage and profitability on the probability
of increase in future value of the firm (in terms of market to book value ratio (MBVR)) for an
emerging economy, India. We use fixed effect logit model to predict the probability of increase in
future value of the S&PCNX500 firms, from 1989-90 to 2001-02. We find that there is a non-linear
relation between leverage, profitability and probability of increase in future value of the firm.
Probability of increase in future value of firm reduces exponentially with the increase in leverage,
whereas, it increases with the raise in dividend payout and profitability of the firm. Among the
companies from different ownership groups, foreign standalone firms have larger probability to
create better future value than group-affiliated firms.
JEL Classification: G 32 G35 C23 C25
Keywords: Dividend Policy, Profitability, Firm Value, Logit Model, Panel Data

Do Leverage, Dividend Policy and Profitability influence the Future Value of Firm?
Evidence from India
1. Introduction With the ushering of economic liberalization in 1992, Indian stock market has
undergone several changes over the last decade. These include introduction of new
exchanges, massive computerization and electronic limit order book integrating the stock
exchanges across the nation, establishing of clearing corporation and subsequent
introduction of new derivative products in the market. Perhaps the most important among
these changes was the establishment of Securities and Exchange Board of India (SEBI) in
1992 as the market watchdog. SEBI, since it’s inception has strived in the direction of
narrowing the information gap between Indian corporations and investors, enforce better
corporate governance practices through guidelines, rules and regulations and through
active market for corporate control that has marked a new era in the Indian financial
arena. The investors reveled their confidence through their participation in the primary
and secondary market. Large number of new companies came to the primary market over
1993-96 and the market capitalization of S&PCNX 500 has increased considerably over
1990s. India has emerged as an emerging economy with largest number of companies
listed in its stock markets.
Over the last decade corporate governance has received considerable importance
in Indian financial market. With the initiation of market for corporate control and
activities in the merger and acquisition market, CEOs have assigned tremendous
importance for creating value for their firms. Accordingly companies from different
sectors (and/or ownership groups) have adopted different strategies to signal their earning
and growth potential over the years and thereby influence their stock prices. With this in
the background this paper attempts to analyze the factors that influenced the future value
of the companies listed in Indian stock markets and also how the effect of these factor
changes over different categories of firms.

The reminder of the paper is organized as follows. Section 2 gives a brief
overview of the literature. Data and the statistical specification used in this study are
described Section 3. Section 4 presents the empirical results and their interpretations.
Section 5 concludes the paper.
2. Background Literature
The well-developed and vibrant literature in modern corporate finance has its root
in the seminal paper by Franco Modigliani and Merton Miller (1958, 1963), (M-M
henceforth). This branch of finance started with the assumption of perfect information
and complete markets. It postulates that in a typical neoclassical market with perfect
competition, absence of agency costs, transaction and banking costs, the average cost of
raising fund for any firm is completely independent of its capital structure. With the same
set of assumptions M-M (1963) argued that the value of the firm is unaffected by the
dividend policy. However, over time many of these simplified assumptions were relaxed
and subsequent research showed capital structure does matter and there could exist
optimal dividend policy in the modified M-M framework.
Academic literature over the last decade has documented the effect of different
strategic factors influencing the firm values for the developed countries. Rappaport
(1981, 1987) has used value creation literature for corporate mergers and acquisition and
underlined the importance of growth rate, operating profit, income tax rate and fixed
capital investment as the major factor influencing the firms’ value. Recently some of the
studies concentrated on emerging market to analyze the factors that influenced the firms’
value in this market. Ben Naceur and Goaied (2002) investigated value creation process
for Tunisian stock exchange using a random probit model with unbalanced panel data. It
considered that the managers’ succeeded creating value to its share holders if the market
value of the share exceeds the book value of the corporation and vice versa. The authors
considered three main determinants of value creation: financial policy, profitability and
dividend policy.

In the modified M-M framework, literature has shown that firm’s performance
depends on the capital structure (or financial policy). Ross (1977) argued that more
leverage would signal the investors about the improved firm prospect and influence the
firm’s value in future. Increase in dividend payout increases the investors’ income at
present and signal the expected future cash flow for the corporation. Profitability is
undoubtedly one of the major factors determining the firm value. Ben Naceur and Goaied
(2002) argued that while profitability and debt have positive effect on the probability of
crating future value, the pay-out have reverse effect on the same.
India has one of the most developed stock markets in the world with large number
of domestic and international players investing in Indian stock market. With maximum
number of companies listed in the Indian stock exchanges from different industries and
different ownership groups (e.g. business affiliated firms, Indian standalone, foreign
standalone) and with the emphasis on corporate governance practices, India has become
an important and interesting destination for such studies. Among the available studies in
this area, Sahu (2002) used a sample of companies listed in BSE to explain the abnormal
stock returns by dividend stability and found no statically significant result. Another
study by Tuli and Mittal (2001) used 101 Indian firms and found price earning ratio is
significantly influenced by variability of market price and dividend pay out ratio.
However, the authors did not find any significant effect of industry and ownership pattern
on price to earning ratio.
This papers aims at determining the factors influencing the probability of future
firm value for Indian corporations after controlling for the industry and time specific
effects. In particular this study attempts to answer the following questions:
1. How the probability of future value creation is affected by firm’s
profitability, financing pattern and the dividend pay-out policy?
2. Whether the firms belonging to business groups have different effect on
probability of value creation?

3. Data
The primary source of the data for this paper is PROWESS database, compiled
by Center for Monitoring the Indian Economy (CMIE). This dataset is similar to the
COMPUSTAT database in USA. We have selected the firms that are presently included
in S&PCNX 500 index. The accounting and stock price data for these companies are
extracted for the year 1989-90 to 2001-02 from Prowess dataset for this study1.
Variable Description
Market to book value ratio (MBVR) is defined as the ratio of closing price of the
equity to book value of equity at the end of the financial year. MBVR is the dependent
variable for the OLS regression. For the logit model the dependent variable is a binary
series, which takes the value 1 if price to book value ratio is greater than one (i.e., market
perceived that future value of the firm is going to increase) and zero otherwise.
The other variables of interest include those representing Leverage Policy,
Dividend Policy and Profitability that have key bearing on the firms’ future value
creation. While the ratio of total amount of long-term debt to total amount of equity
capital (LEVERAGE) is included to proxy the leverage policy of the corporation, the ratio
of total dividend to total earning of the firm (PAY_OUT) is included to capture the
dividend policy of the same. The profitability of a company, on the other hand, is
captured by the ratio of net profit to net worth of the firm, which is also known as return
on equity (ROE).
To control for the size of the firm we consider total assets (ASSET) of the firm as a
proxy variable. To control for the differenced arising due to the firms belonging to
different business groups this paper considers different dummy variables. If the firm is
1 Among the large number of listed companies, those included in S&PCNX 500 are often considered for empirical studies for their liquid nature and representative characteristics.

private Indian standalone then the dummy, D_PVT_IND, take the value one and zero
otherwise. If, on the other hand, a firm is private foreign standalone then the dummy,
D_PVT_FOR, take the value one and otherwise zero. Indian companies differ considerably
access the industries. So industry dummies were used to control for industry specific
heterogeneity. Since 1990, Indian economy has undergone several changes, which have
their influence on the corporate valuation. So time dummies were also included to control
for the time trend. All the nominal variables are deflated by GDP deflator and expressed
at constant price of 1987-88.
(Insert Table-1 here)
Table 1 shows the mean values and the standard deviations (in parenthesis) of the
variables under consideration under six different cases (namely, all firms, large firms,
small firms, group-affiliated firms, Indian standalone firms and foreign standalone firms).
The descriptive statistics reported in Table 1 shows that the value of a firm, in terms of
MBVR, is higher for the small firms and the foreign standalone firms. Large firms get
more leverage than any other category of firms. Profitability of the firm, in terms of ROE,
is higher for the Indian standalone companies. Table 2 shows the Pearson correlation
coefficient matrix between the variables of interest. It shows that MBVR has significant
negative correlation with leverage and size of the firm and positive correlation with
dividend policy and profitability of the firm. In the Appendix Figure 1 and 4 show that
with the ushering of economic liberalization there is a sharp rise in MBVR and ROE in
the year 1992, which have gradually decreased over the years. Figure 2 shows since post
liberalization period, the leverage has shown an increasing trend. However, dividend
payout policy does not depict any significant trend over this period.
4. Methodology & Results
So far we have done the univariate and bivariate analysis in the previous section.
To examine the factors effecting the future value creation of the firms listed in the Indian
stock exchange we first examine the effect of previous year’s leverage, dividend and

profitability on the MBVR of the company in a multivariate framework. The generic
form for this unbalanced panel model is as follows:
MBVRit = α + αt + β1LEVERAGEt-1 + β2(LEVERAGEt-1)2 + β3 PAY_OUTt-1 + β4 ROEt-1
+ β5(ROEt-1)2 + β6 LOG(ASSETt-1) + β7 D_PVT_INDit + β8 D_PVT_FORit +
+ ε∑=
+
22
18 )_(
kktk DINDβ it (1)
To account for the non-linearity in the relationship, the square of the previous
year’s leverage, pay out and profitability were also included in the regression. The
regression results based on the model specified in equation one is reported in Table 3
below.
(Insert table 3 here)
From Table 3, it appears that the previous year’s leverage has a negative effect (-
0.14) on the MBVR of the company, which is significant at one per cent level. This effect
however decreases with the increases in leverage, which appears from the positive
coefficient of the square of LEVERAGE-t-1 term. For the Indian corporations the previous
years pay-off (0.87) and return on equity (0.35) have positive influence on the
corporations’ MBVR. Moreover the square term of ROE has a positive coefficient
implying that ROE influences MBVR at an increasing rate. The log of assets and the
dummies for group companies were all significantly different from zero at ten per cent
levels. The significance of these coefficients prompted separate analysis of the future
value creation across different groups and size2. The results reported in table 3
substantiate conclusions of the pooled model as the signs of the independent variables
coefficients as they are obtained in the pooled model. However, the previous year’s
payout significantly affects MBVR for the all firms sample and especially for the sample
of foreign standalone companies.
2 Companies with total asset more than median of total asset is considered as large size and others are considered as small. The asset size however differs considerable across the broad classification. To account for it ln(asset) was included as a control variable in these sub-groups.

This paper also attempts to model the probability of increase in the future value of
the firm. The binary variable (Y) takes value 1 if MBVR is greater than one (i.e., if the
market value of the firm is greater than the book value), otherwise zero. The logistic
model is as follows:
ee
ititt
ititt
X
X
itit XYob εβαα
εβαα
+′++
+′++
+==
1)|1(Pr (2)
where Xit are the same explanatory variables used in equation (1). This model
aims to predict how the probability of improvement of the future value of the firm
influenced by the previous year’s dividend and leverage policy and profitability of the
firm. The empirical results of the logit model is reported in the table-4 below
The coefficient of lagged value of leverage (-O.44) and its square term (0.007)
imply that as the leverage of the firm increases, the probability of raise in future firm’s
values declines at a decreasing rate. The negative influence of leverage on the probability
of future value creation was observed across the ownership groups and size. The
profitability of the firm (as apparent from the coefficient of ROE) increases the
probability of increase in future value creation. Point to note is, this increase is higher for
foreign standalone firms as compare to Indian standalone or group-affiliated firms.
Unlike the OLS model, the dividend payout did not significantly explain the chance of
future value creation. Neither in the pooled model nor in the size and ownership group
specific regression the coefficient of payout was significantly different from zero at 10
per cent level.
This paper analyzed the accounting factor that influence the probability of
increase in future market valuation of the firms’ listed in Indian stock exchange after
controlling for the time and industry specific effects. The empirical results indicate that
the increase in leverage has a negative impact on the chance of future value increase of
the firm. It could be because more reliance on credit increases the conflict of interest
between shareholders and creditors, giving more control to the managers/promoter, which
in turn have a negative influence on the future valuation. Alike Naceur and Goaied
(2002), we found previous year’s profitability positive influences future firm’s value, as

increase in profitability might have signaled better quality of management. However, the
pay-off did not significantly influence the probability of future MBVR increase in the
pooled model as well as the models across ownership group and size. This finding could
be because of the fact that the dividend payment the future performance varied
considerably across firms listed in Indian stock exchange.
5. Conclusion
This paper investigates the value creation process of the firms listed in the Indian
stock market and their dependence on the accounting variables. It used an unbalanced
logit model and found that the increase in profitability has a positive influence on the
probability of creating future value and the relation is stronger for foreign standalone
firms as compared to private Indian standalone or business group owned firms. Leverage,
one the other hand, has negative impact on the chances of increase in future value of the
corporation and this relation was uniform across size and ownership group. It could be
because of the potential conflict of interest between the equity holders and the creditors
that got reflected in the stock prices. The dividend pay-off policy of the firm, however,
could not significantly influence the probability of future value creation of the firms
listed in Indian stock market.

Reference:
Ben-Naceur, Samy and Mohamed Goaied (2002), “The Relationship between Dividend Policy, Financial Structure, Profitability and Firm Value”, Applied Financial Economics, 12(12), 843-49.
Modigliani, Franco and Merton Miller (1958), "The Cost of Capital, Corporation Finance, and the Theory of Investment." American Economic Review, 48, 261-97. Modigliani, Franco and Merton Miller (1963), "Corporate Income Taxes and the Cost of Capital." American Economic Review, 53, 433-43. Rappaport, A. (1986) Linking Competitive Strategy and Shareholder Value Analysis. The Journal of Business Strategy, 3, 58-67 Rappaport, A. (1987) Corporate Performance Standards and Shareholder Value. The Journal of Business Strategy 4, 28-38. Ross. S (1977). The Determination Of Financial Structure The Incentive Signaling Approach. Bell Journal of Economics. 8, 23-40 Sahu, Chinmoy (2002), “An Empirical Test of Stable Dividend Hypothesis”, Finance India, 16(2), 613-26. Tuli, Nishi and, R K Mittal (2001), “Determinants of Price-Earnings Ratio”, Finance India, 15(4), 1235-50.

Table 1: Descriptive statistics (MBVR) is ratio of closing price of the equity to book value of equity at the end of the financial year. LEVERAGE is
the ratio of total amount of long-term debt to total amount of equity capital. PAY_OUT is the ratio of total dividend to total earning of the firm. Return on equity (ROE) is the ratio of net profit to net worth of the firm. ASSET total assets
of the firm.
Variable All Firms Large Firms Small Firms Group Firms Indian
Standalone Firms
Foreign Standalone Firms
MBVR 3.137 (5.993)
2.133 (3.537)
3.349 (6.372)
2.833 (5.659)
2.850 (5.119)
5.776 (8.255)
LEVERAGE 1.726 (4.140)
3.057 (7.151)
1.441 (3.063)
1.973 (4.470)
1.247 (3.094)
0.319 (0.484)
DIVIDEND PAY OFF 0.023 (0.029)
0.025 (0.028)
0.023 (0.029)
0.024 (0.030)
0.024 (0.026)
0.020 (0.023)
PROFITABILITY (ROE) 0.138 (0.367)
0.095 (0.449)
0.148 (0.346)
0.133 (0.372)
0.168 (0.283)
0.148 (0.397)
SIZE 13.795 (75.556)
66.395 (170.110)
2.500 (2.248)
16.639 (84.509)
3.632 (9.212)
2.146 (6.210)

Table 2: Pearson Correlation Matrix. (MBVR) is ratio of closing price of the equity to book value of equity at the end of the financial year. LEVERAGE is
the ratio of total amount of long-term debt to total amount of equity capital. PAY_OUT is the ratio of total dividend to total earning of the firm. Return on equity (ROE) is the ratio of net profit to net worth of the firm. ASSET total assets
of the firm.
MBVR LEVERAGE POLICY DIVIDEND POLICY PROFITABILITY SIZE
MBVR 1.000
LEVERAGE -0.158 (<.0001) 1.000
PAY-0FF 0.028 (0.060)
-0.093 (<.0001) 1.000
ROE 0.074 (<.0001)
-0.210 (<.0001)
0.124 (<.0001) 1.000
SIZE -0.042 (<.0001)
0.076 (<.0001)
-0.011 (0.450)
-0.021 (0.155) 1.000
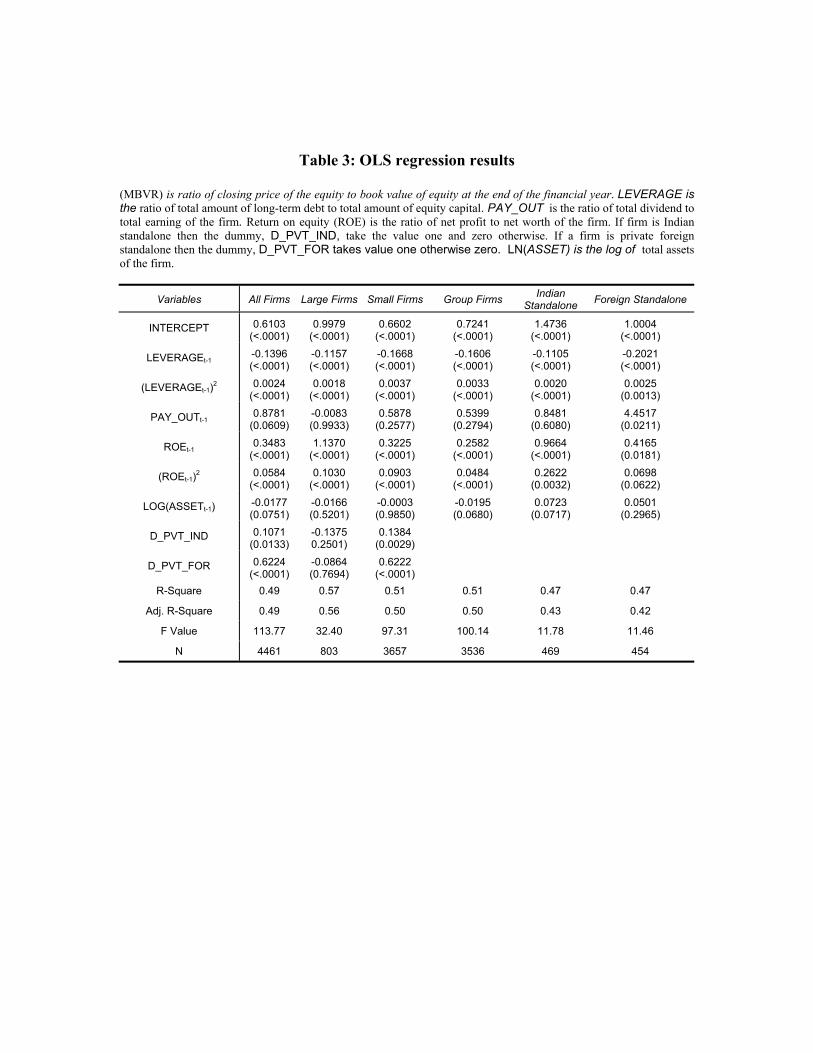
Table 3: OLS regression results (MBVR) is ratio of closing price of the equity to book value of equity at the end of the financial year. LEVERAGE is the ratio of total amount of long-term debt to total amount of equity capital. PAY_OUT is the ratio of total dividend to total earning of the firm. Return on equity (ROE) is the ratio of net profit to net worth of the firm. If firm is Indian standalone then the dummy, D_PVT_IND, take the value one and zero otherwise. If a firm is private foreign standalone then the dummy, D_PVT_FOR takes value one otherwise zero. LN(ASSET) is the log of total assets of the firm.
Variables All Firms Large Firms Small Firms Group Firms Indian Standalone Foreign Standalone
INTERCEPT 0.6103 (<.0001)
0.9979 (<.0001)
0.6602 (<.0001)
0.7241 (<.0001)
1.4736 (<.0001)
1.0004 (<.0001)
LEVERAGEt-1 -0.1396 (<.0001)
-0.1157 (<.0001)
-0.1668 (<.0001)
-0.1606 (<.0001)
-0.1105 (<.0001)
-0.2021 (<.0001)
(LEVERAGEt-1)2 0.0024 (<.0001)
0.0018 (<.0001)
0.0037 (<.0001)
0.0033 (<.0001)
0.0020 (<.0001)
0.0025 (0.0013)
PAY_OUTt-1 0.8781
(0.0609) -0.0083 (0.9933)
0.5878 (0.2577)
0.5399 (0.2794)
0.8481 (0.6080)
4.4517 (0.0211)
ROEt-1 0.3483
(<.0001) 1.1370
(<.0001) 0.3225
(<.0001) 0.2582
(<.0001) 0.9664
(<.0001) 0.4165
(0.0181)
(ROEt-1)2 0.0584 (<.0001)
0.1030 (<.0001)
0.0903 (<.0001)
0.0484 (<.0001)
0.2622 (0.0032)
0.0698 (0.0622)
LOG(ASSETt-1) -0.0177 (0.0751)
-0.0166 (0.5201)
-0.0003 (0.9850)
-0.0195 (0.0680)
0.0723 (0.0717)
0.0501 (0.2965)
D_PVT_IND 0.1071 (0.0133)
-0.1375 0.2501)
0.1384 (0.0029)
D_PVT_FOR 0.6224 (<.0001)
-0.0864 (0.7694)
0.6222 (<.0001)
R-Square 0.49 0.57 0.51 0.51 0.47 0.47
Adj. R-Square 0.49 0.56 0.50 0.50 0.43 0.42
F Value 113.77 32.40 97.31 100.14 11.78 11.46
N 4461 803 3657 3536 469 454

Table 4: Logit Model
(MBVR) is ratio of closing price of the equity to book value of equity at the end of the financial year. LEVERAGE is the ratio of total amount of long-term debt to total amount of equity capital. PAY_OUT is the ratio of total dividend to total earning of the firm. Return on equity (ROE) is the ratio of net profit to net worth of the firm. If firm is Indian standalone then the dummy, D_PVT_IND, take the value one and zero otherwise. If a firm is private foreign standalone then the dummy, D_PVT_FOR takes value one otherwise zero. ASSET total assets of the firm.
Variable All Firms Large Firms Small Firms Group Firms Indian Standalone
Foreign Standalone
INTERCEPT 2.7600 (<.0001)
4.2975 (<.0001)
3.6718 (<.0001)
2.8716 (<.0001)
3.3319 (0.0102)
1.7466 (0.0635)
LEVERAGEt-1 -0.4360 (<.0001)
-0.5412 (<.0001)
-0.5455 (<.0001)
-0.4940 (<.0001)
-0.2410 (0.0422)
-0.3466 (0.1855)
(LEVERAGEt-1) 2 0.0072 (<.0001)
0.0076 (<.0001)
0.0142 (<.0001)
0.0102 (<.0001)
0.0047 (0.1803)
-0.0109 (0.1208)
PAY_OUTt-1 0.1380
(0.9186) -3.3405 (0.3194)
-0.7560 (0.6159)
-0.5285 (0.7196)
3.5130 (0.4677)
-16.3592 (0.1716)
ROEt-1 0.7577
(0.0015) 2.4710
(0.0153) 2.0384
(<.0001) 0.6067
(0.0203) 1.4478
(0.2860) 5.3722
(0.0023)
(ROEt-1)2 0.1106 (0.0043)
0.2200 (0.0282)
1.9982 (<.0001)
0.0829 (0.0115)
10.9652 (0.0007)
20.3404 (0.0023)
LOG(ASSETt-1) 0.0079
(0.8062) -0.0644 (0.4948)
0.1003 (0.0558)
0.0171 (0.6258)
0.0842 (0.5473)
-0.2233 (0.3070)
D_PVT_IND 0.2314 (0.0755)
-1.0167 (0.0155)
0.4163 (0.0045)
D_PVT_FOR 1.1884 (<.0001)
-1.6773 (0.1886)
1.3467 (<.0001)
Log likelihood 1805.28 319.90 1369.90 1416.72 143.90 99.44
Likelihood Ratio 38.00 31.00 31.00 36.00 33.00 24.00

Annexure
Figure 1
Price-Book Value Ratio Trend
0
2
4
6
8
10
12
1990 1991 1992 1993 1994 1995 1996 1997 1998 1999 2000 2001 2002
Year
P-B
Rat
io
(PBVR) is ratio of closing price of the equity to book value of equity at the end of the financial year.

Figure 2
Leverage Trend
0
0.5
1
1.5
2
2.5
3
3.5
1990 1991 1992 1993 1994 1995 1996 1997 1998 1999 2000 2001 2002
Year
Leve
rage
LEVERAGE is the ratio of total amount of long-term debt to total amount of equity capital.

Figure 3
Dividend Payout trend
0
0.005
0.01
0.015
0.02
0.025
0.03
1990 1991 1992 1993 1994 1995 1996 1997 1998 1999 2000 2001 2002
Year
Div
eden
d Pa
yout
PAY_OUT is the ratio of total dividend to total earning of the firm.

Figure 4
ROE trend
0
0.05
0.1
0.15
0.2
0.25
1990 1991 1992 1993 1994 1995 1996 1997 1998 1999 2000 2001 2002
Year
RO
E
Return on equity (ROE) is the ratio of net profit to net worth of the firm.