do makeup wednesday algebra 1b name quiz 3 on thursday
TRANSCRIPT
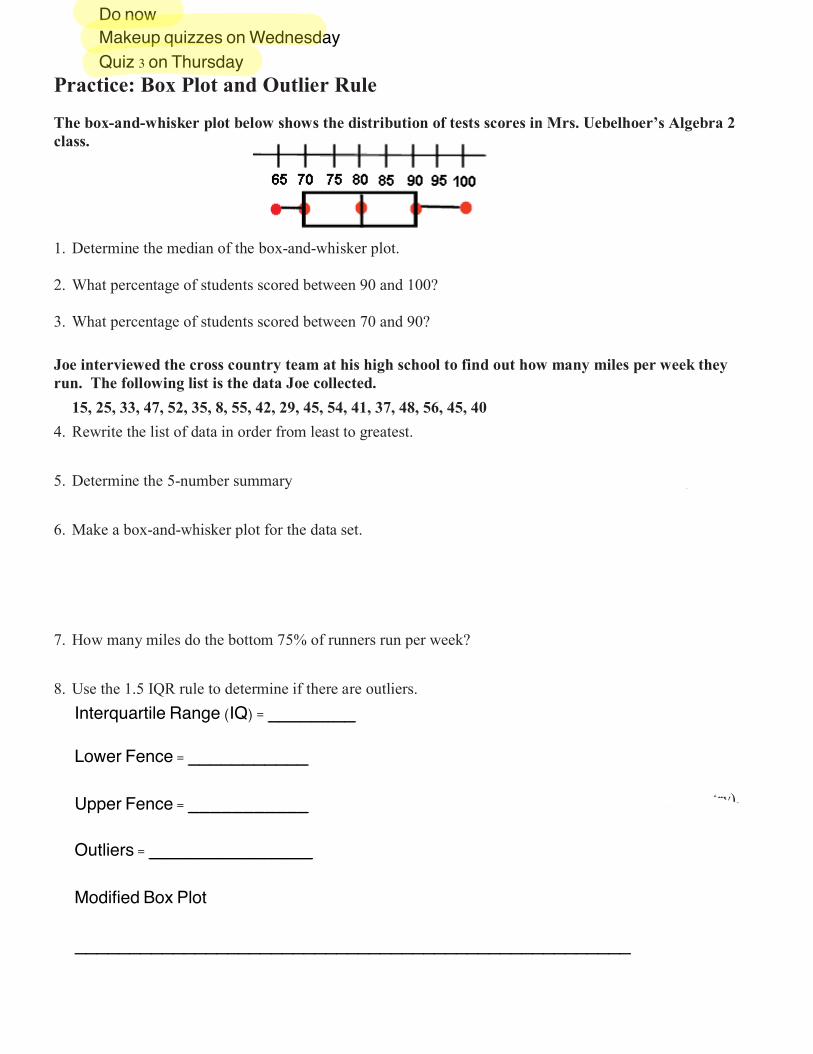
Algebra 1B Name _____________________ Practice: Box Plot and Outlier Rule Block _____ Date ___________ The box-and-whisker plot below shows the distribution of tests scores in Mrs. Uebelhoer’s Algebra 2 class. 1. Determine the median of the box-and-whisker plot. 2. What percentage of students scored between 90 and 100? 3. What percentage of students scored between 70 and 90?
Joe interviewed the cross country team at his high school to find out how many miles per week they run. The following list is the data Joe collected.
15, 25, 33, 47, 52, 35, 8, 55, 42, 29, 45, 54, 41, 37, 48, 56, 45, 40
4. Rewrite the list of data in order from least to greatest. 5. Determine the 5-number summary (minimum, lower quartile, median, upper quartile, maximum) of this data. 6. Make a box-and-whisker plot for the data set. 7. How many miles do the bottom 75% of runners run per week? 8. Use the 1.5 IQR rule to determine if there are outliers. 9. If there are outliers: How would the center (mean, median, mode), spread (range, standard deviation), and shape (symmetry), change if there were not outliers?
If there are not outliers: How would the center (mean, median, mode), spread (range, standard deviation), and shape (symmetry), change if there were outliers?
Lower Fence = ___________ Upper Fence = ___________ Outliers = _______________ Modified Box Plot ___________________________________________________
Do now Makeup quizzes on Wednesday Quiz 3 on Thursday
Interquartile Range (IQ) = ________
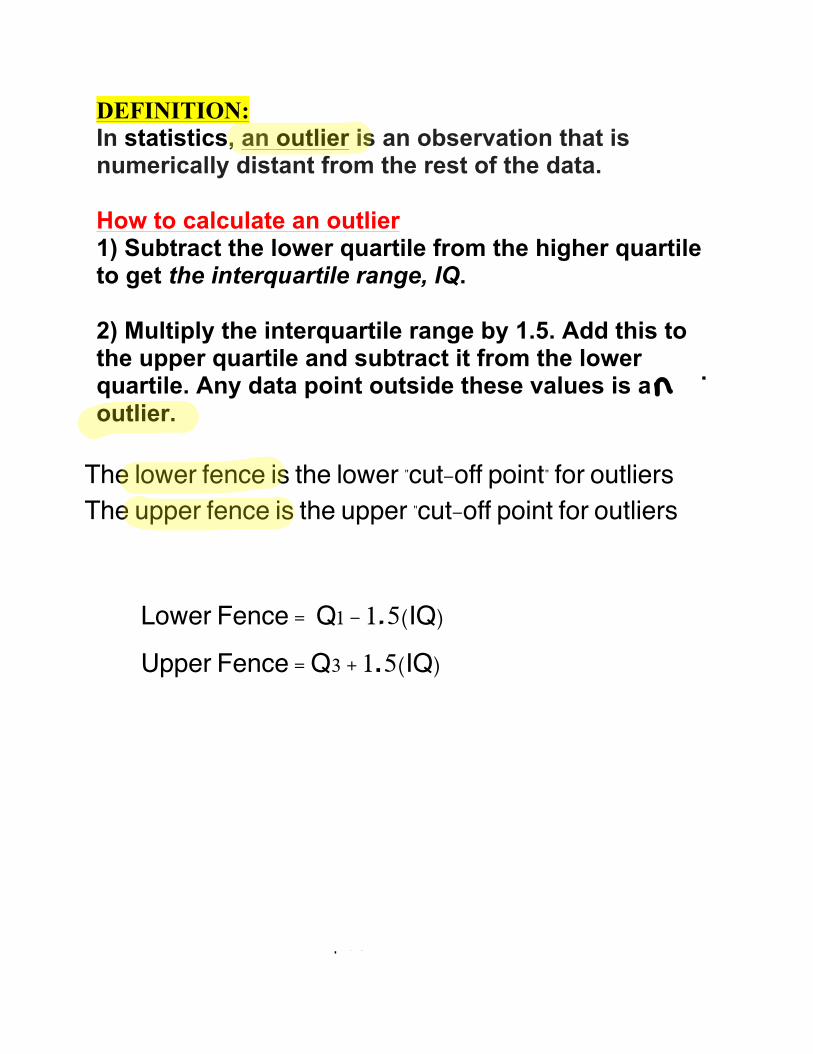
DEFINITION: In statistics, an outlier is an observation that is numerically distant from the rest of the data. How to calculate an outlier 1) Subtract the lower quartile from the higher quartile to get the interquartile range, IQ. 2) Multiply the interquartile range by 1.5. Add this to the upper quartile and subtract it from the lower quartile. Any data point outside these values is a mild outlier.
The lower fence is the lower "cut-off point" for outliers The upper fence is the upper "cut-off point for outliers
Lower Fence = Q1 - 1,5(IQ) Upper Fence = Q3 + 1,5(IQ)
http://youtu.be/PYEGFVqbsCI
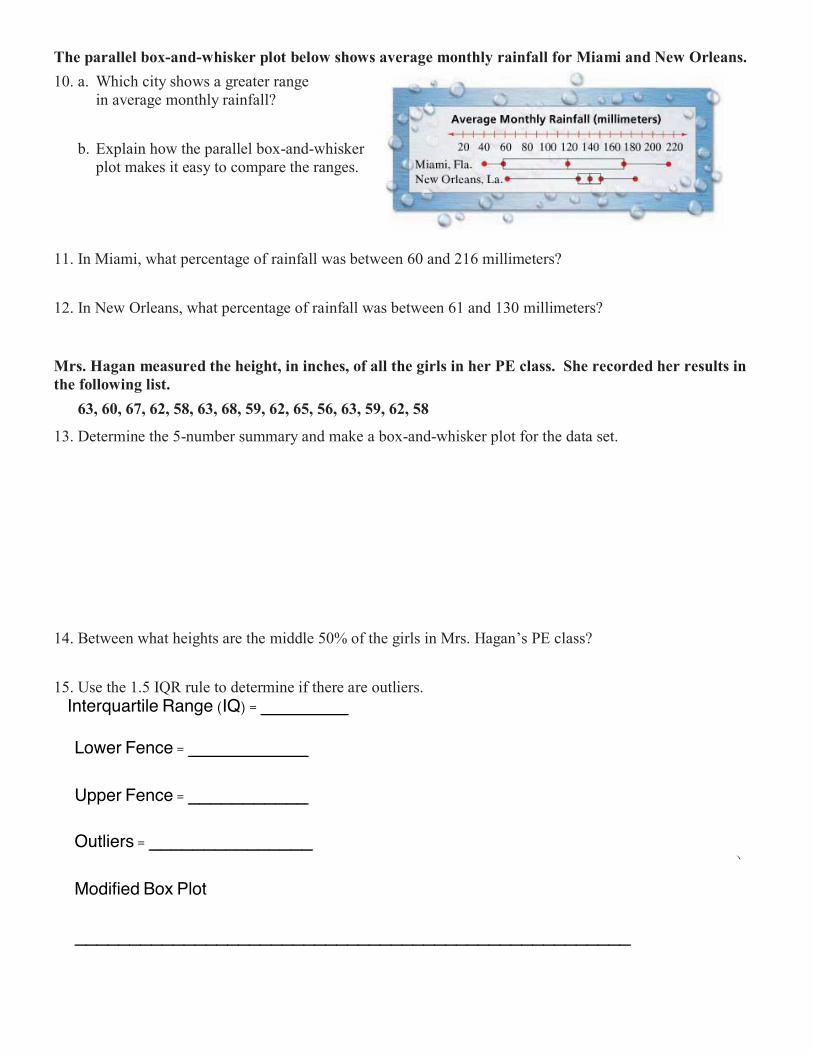
The parallel box-and-whisker plot below shows average monthly rainfall for Miami and New Orleans.
10. a. Which city shows a greater range in average monthly rainfall?
b. Explain how the parallel box-and-whisker plot makes it easy to compare the ranges. 11. In Miami, what percentage of rainfall was between 60 and 216 millimeters? 12. In New Orleans, what percentage of rainfall was between 61 and 130 millimeters? Mrs. Hagan measured the height, in inches, of all the girls in her PE class. She recorded her results in the following list.
63, 60, 67, 62, 58, 63, 68, 59, 62, 65, 56, 63, 59, 62, 58
13. Determine the 5-number summary and make a box-and-whisker plot for the data set. 14. Between what heights are the middle 50% of the girls in Mrs. Hagan’s PE class? 15. Use the 1.5 IQR rule to determine if there are outliers. 16. If there are outliers: How would the center (mean, median, mode), spread (range, standard deviation), and shape (symmetry), change if there were not outliers?
If there are not outliers: How would the center (mean, median, mode), spread (range, standard deviation), and shape (symmetry), change if there were outliers?
Lower Fence = ___________ Upper Fence = ___________ Outliers = _______________ Modified Box Plot ___________________________________________________
Interquartile Range (IQ) = ________
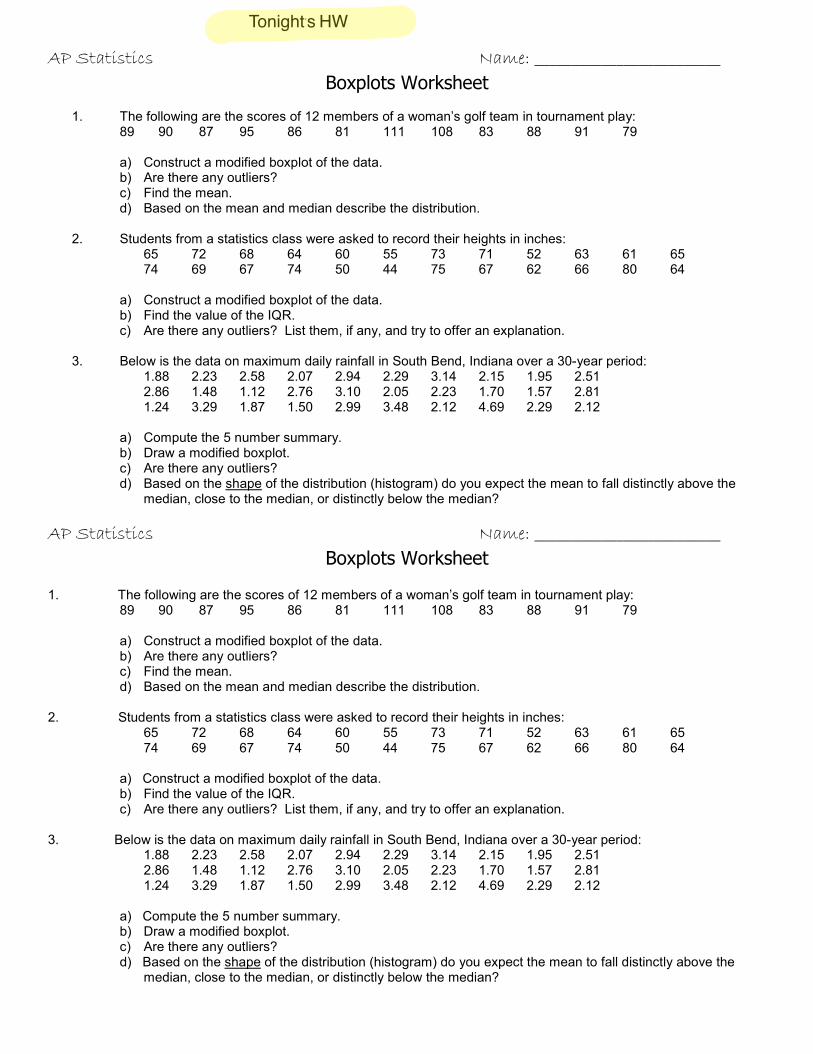
AP Statistics Name: _________________________ Boxplots Worksheet
1. The following are the scores of 12 members of a woman’s golf team in tournament play:
89 90 87 95 86 81 111 108 83 88 91 79 a) Construct a modified boxplot of the data. b) Are there any outliers? c) Find the mean. d) Based on the mean and median describe the distribution.
2. Students from a statistics class were asked to record their heights in inches: 65 72 68 64 60 55 73 71 52 63 61 65 74 69 67 74 50 44 75 67 62 66 80 64 a) Construct a modified boxplot of the data. b) Find the value of the IQR. c) Are there any outliers? List them, if any, and try to offer an explanation.
3. Below is the data on maximum daily rainfall in South Bend, Indiana over a 30-year period: 1.88 2.23 2.58 2.07 2.94 2.29 3.14 2.15 1.95 2.51 2.86 1.48 1.12 2.76 3.10 2.05 2.23 1.70 1.57 2.81 1.24 3.29 1.87 1.50 2.99 3.48 2.12 4.69 2.29 2.12
a) Compute the 5 number summary. b) Draw a modified boxplot. c) Are there any outliers? d) Based on the shape of the distribution (histogram) do you expect the mean to fall distinctly above the
median, close to the median, or distinctly below the median? AP Statistics Name: _________________________
Boxplots Worksheet
1. The following are the scores of 12 members of a woman’s golf team in tournament play: 89 90 87 95 86 81 111 108 83 88 91 79 a) Construct a modified boxplot of the data. b) Are there any outliers? c) Find the mean. d) Based on the mean and median describe the distribution.
2. Students from a statistics class were asked to record their heights in inches: 65 72 68 64 60 55 73 71 52 63 61 65 74 69 67 74 50 44 75 67 62 66 80 64 a) Construct a modified boxplot of the data. b) Find the value of the IQR. c) Are there any outliers? List them, if any, and try to offer an explanation.
3. Below is the data on maximum daily rainfall in South Bend, Indiana over a 30-year period: 1.88 2.23 2.58 2.07 2.94 2.29 3.14 2.15 1.95 2.51 2.86 1.48 1.12 2.76 3.10 2.05 2.23 1.70 1.57 2.81 1.24 3.29 1.87 1.50 2.99 3.48 2.12 4.69 2.29 2.12
a) Compute the 5 number summary. b) Draw a modified boxplot. c) Are there any outliers? d) Based on the shape of the distribution (histogram) do you expect the mean to fall distinctly above the
median, close to the median, or distinctly below the median?
Tonight's HW