do mergers create value for high-tech firms? the hounds of...
TRANSCRIPT
Journal of High Technology Management Research 27 (2016) 196–213
Contents lists available at ScienceDirect
Journal of High Technology Management Research
Do mergers create value for high-tech firms? The hounds ofdotcom bubble☆
Devi Lusyana a, Mohamed Sherif b,c,⁎a Business School, University of Edinburgh, Edinburgh EH8 9JS, United Kingdomb Accountancy, Economics, and Finance Department, Heriot-Watt University, Edinburgh EH14 4AS, United Kingdomc Cairo University Business School, Egypt
a r t i c l e i n f o
☆ The first author acknowledges support from the Ind⁎ Corresponding author at: Accountancy, Economics,
E-mail address: [email protected] (M. Sherif).
http://dx.doi.org/10.1016/j.hitech.2016.10.0091047-8310/© 2016 Elsevier Inc. All rights reserved.
a b s t r a c t
Available online November 20169
Using both 1078 high-tech target deals (divided into 244 cross-border and 834 domesticdeals), and the market model, this study examines the performance of bidders acquiringhigh-tech US targets in the short run and long run. The study also aims to bridge the gapin knowledge between the bidder's performance during 2007–2014, and the dotcom bubbleperiod of 1996–2002. We use event study methodology to measure the abnormal returns(CARs) and (BHAR), and the change in the value of bidders that acquire high-tech targets.We find positive abnormal returns for the domestic bidders during 2007–2014, thereby imply-ing that the domestic bidders earn more wealth than the cross-border bidders. Additionally,we find that abnormal returns are higher after the dotcom bubble period of 1997–2002: inparticular during the period 2007–2014 for short-term domestic performance. We also findsupportive evidence that cash-rich bidders required high-tech targets to seize growth opportu-nities, and consequently earned high abnormal returns. Overall, our results suggest that inves-tors and bidders are overoptimistic about the future performance of high-tech mergers, andhave increased their expectations overtime, in particular for domestic bidders and investorsduring the bubble and short-term periods.© 2016 Elsevier Inc. All rights reserved.
Keywords:High-tech acquisitionsDotcom bubblesFirm value
1. Introduction
Mergers and acquisitions are some of the most financially significant events for both a firm and the economy, with large, andin some cases extraordinary, returns offered by companies to compensate shareholders. According to Dumont and Holmes (1999),the total aggregate value of merger deals globally in the 1990s was around $2.5 trillion, with the United States accounting for over$1.6 trillion of these merger activities. Understandably, the study of mergers and acquisitions has been a long standing focus in theeconomic and financial communities (see for example, Franks, Harris, & Titman, 1991; Calori, Michael & Phillipe, 1994; Hubbard &Palia, 1995; Loughran & Vinjh, 1997; Chang, 1998; Kohers & Kohers, 2000; Ghosh, 2001; Aw & Chatterjee, 2004; Conn, Cosh,Guest, & Hughes, 2005; Laamanen & Keil, 2008; Antoniou, Arbour, & Zhao, 2008; Aybar & Ficici, 2009; Bris & Cabolis, 2008;Savor & Lu, 2009; Bi & Gregory, 2011; Danbolt & Maciver, 2012; Sherif, 2012; Singh, 2015).
onesia Endowment Fund (LPDP).and Finance Department, Heriot-Watt University, Edinburgh EH14 4AS, United Kingdom.
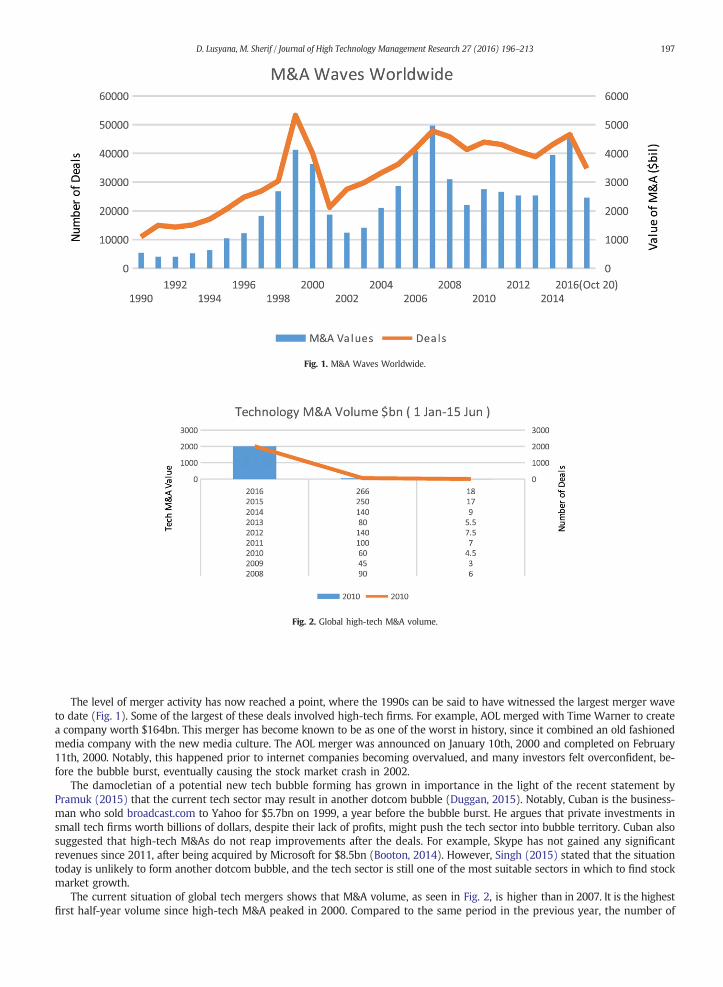
Fig. 1. M&A Waves Worldwide.
Fig. 2. Global high-tech M&A volume.
197D. Lusyana, M. Sherif / Journal of High Technology Management Research 27 (2016) 196–213
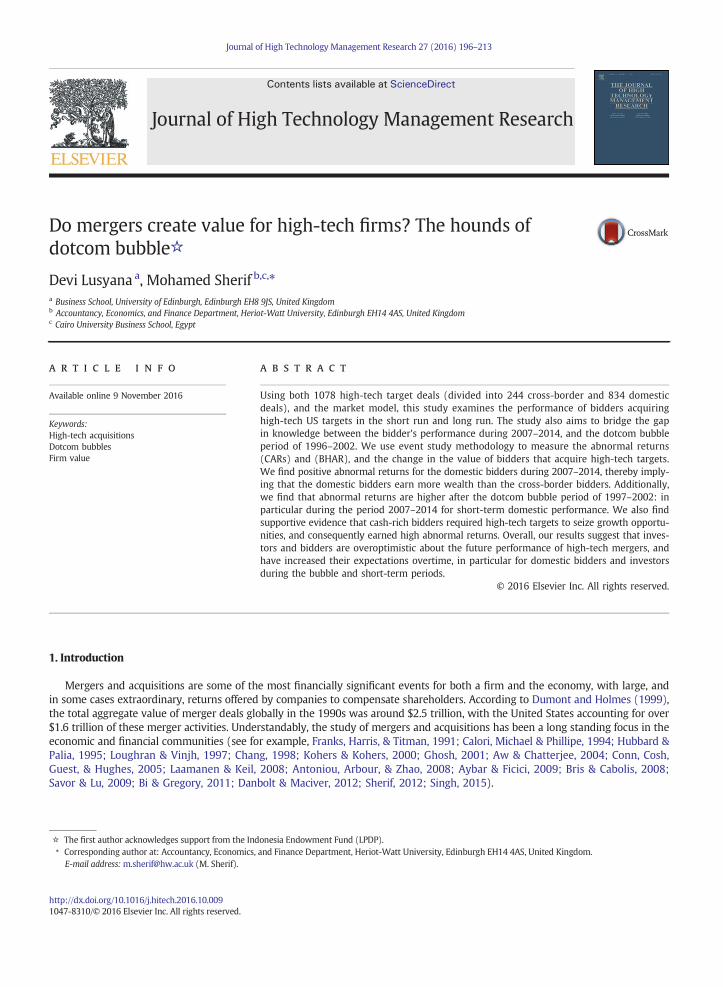
The level of merger activity has now reached a point, where the 1990s can be said to have witnessed the largest merger waveto date (Fig. 1). Some of the largest of these deals involved high-tech firms. For example, AOL merged with Time Warner to createa company worth $164bn. This merger has become known to be as one of the worst in history, since it combined an old fashionedmedia company with the new media culture. The AOL merger was announced on January 10th, 2000 and completed on February11th, 2000. Notably, this happened prior to internet companies becoming overvalued, and many investors felt overconfident, be-fore the bubble burst, eventually causing the stock market crash in 2002.
The damocletian of a potential new tech bubble forming has grown in importance in the light of the recent statement byPramuk (2015) that the current tech sector may result in another dotcom bubble (Duggan, 2015). Notably, Cuban is the business-man who sold broadcast.com to Yahoo for $5.7bn on 1999, a year before the bubble burst. He argues that private investments insmall tech firms worth billions of dollars, despite their lack of profits, might push the tech sector into bubble territory. Cuban alsosuggested that high-tech M&As do not reap improvements after the deals. For example, Skype has not gained any significantrevenues since 2011, after being acquired by Microsoft for $8.5bn (Booton, 2014). However, Singh (2015) stated that the situationtoday is unlikely to form another dotcom bubble, and the tech sector is still one of the most suitable sectors in which to find stockmarket growth.
The current situation of global tech mergers shows that M&A volume, as seen in Fig. 2, is higher than in 2007. It is the highestfirst half-year volume since high-tech M&A peaked in 2000. Compared to the same period in the previous year, the number of

Fig. 3. High-tech acquisitions in the US stock market.Source: Statista (Richter, 2014).
198 D. Lusyana, M. Sherif / Journal of High Technology Management Research 27 (2016) 196–213
transactions jumped by 13%. The price Facebook paid for the acquisition of WhatsApp has been one of the most discussed investmentthemes of 2014 (Prathap, Jubilson, Rajkumar, Shibu, & Vinil Dani, 2014). This price is more than 100 times higher thanWhatsApp's rev-enues in 2013 and even more than 200 times higher than the EBITDA (Prathap et al., 2014). This leads to the question of how this andother high prices can be explained. Fig. 3 shows the most recent high-tech acquisitions in the US stock market.
One of the recent debates relates to whether there is a tendency for high-tech firms' upward share price trend to continue inthe stock market. Barreto (2014) reports that the world's largest initial public offering, worth $25bn, happened in 2014 whenAlibaba was listed on the New York Stock Exchange. Ernst and Young (EY) (2015a) also showed that there has been an increasein high-tech M&A activity since 2014 and they predict that it will continue to grow. Jeff Liu (2015), EY's Global Sector Head ofTechnology, also asserted that people do not have to feel afraid of a new bubble, since the revenues of tech companies todayare supported by a visible shift towards the use of technology in day-to-day life.
Nevertheless, despite a considerable volume of research on corporate takeovers, results remain inconclusive regarding thevaluation effects of acquisitions on acquiring companies' share price. In addition, this era witnessed an unjustifiable rise in theprices of the majority of stocks, although this was more prominent in the high-tech stocks. The large number of time-,industry-, security- and deal-specific determinants influencing the individual company's share price makes it difficult to detecta general acquisition-related security return pattern. Therefore, high-tech market and mergers offer the best opportunity tostudy the extent to which bubbles can affect the performance of bidders acquiring high-tech targets. To our knowledge, noresearch has been conducted studying the performance of high-tech mergers during the dotcom bubble of 1996–2002, or thenew hype of dotcom M&A activity over the second period of 2007–2014. Thus, our study attempts to assess previous findingsand contribute additional evidence that investigates the acquirer's performance during the new high-tech industry hype, by inves-tigating the short-term and long-term abnormal returns after the M&A announcement in the US tech sector. Further, we splitdeals into domestic and cross-border types and classify them by method of payment: cash, stock or hybrid. Therefore, thelong-term performance following an M&A deal during 2007–2014 is examined to identify whether overconfidence in high-techM&A deals either persists, is not present, or has reversed. Previous studies have not dealt with the existence of abnormal returnsof high-tech firms during 2007–2014 nor its comparison to the dotcom bubble of the late 1990s. Our study also aims to shed lighton current debates, through a comparison between M&A deals during the dotcom bubble of 1996–2002 and the new hype ofdotcom M&A activity over the second period of 2007–2014.
Overall, our results show that the announcement had a positive market reaction, with the target company receiving the majority ofthe wealth effects in comparison to the acquirer. Crucially, we demonstrate clear evidence that acquisitions with foreign-based targetshad a greater, more positive impact compared with the domestic transactions. We also find supportive evidence that cash-rich biddersrequired high-tech targets to seize growth opportunities, and consequently earned high abnormal returns.
The remainder of the paper is structured as follows. Section 2 is a brief literature review. Section 3 provides details of the data,models and methodology. Section 4 presents the empirical findings and Section 5 concludes.
2. Literature review
The impact of mergers and acquisitions (M&A) on shareholders' wealth effect has been a subject of much discussion andempirical analysis in both the economic and financial literature. Indeed, there has been a long-running debate on the performanceof bidders acquiring high-tech targets (see for example, Manne, 1965; Mueller, 1969; Eckbo, 1983; Ranft & Lord, 2000; Datta,Iskandar-Datta, & Raman 2001; Ranft & Lord, 2002; Rossi & Volpin, 2004; Ranft, 2006).

199D. Lusyana, M. Sherif / Journal of High Technology Management Research 27 (2016) 196–213
Regarding high-tech M&A, this has been studied using different approaches that have generated a considerable amount ofempirical and theoretical studies, resulting in high fragmentation of points of view (Halpern, 1983; Jensen & Ruback, 1983;Mackinlay, 1997; Sudarsanam, 1995, 2003; Capasso & Meglio, 2005; Martynova & Renneboog, 2008). One strand of literaturehas placed emphasis on the enigma of high-tech M&A. The idiosyncratic high-growth and high-risk nature of high-tech industryraises a question on the wealth creation in technology firms' acquisitions. It is argued that the market tends to exhibit excessenthusiasm about the expected benefits of certain high-tech acquisitions (Kohers & Kohers, 2001). Such a tendency for increasingM&A activity in high-tech sectors is mainly driven by small and young start-up acquisitions. The M&A phenomenon has significantrelationship to the core business firms, as Kohers and Kohers (2000, p.315) stated: ‘the nature of high-growth technology-basedindustries distinguishes them from other types of industries. In addition to their high-growth potential, however, another distinctivefeature of high-tech industries is the inherent uncertainty associated with companies whose values rely on future or developments inunproven, unchartered fields’.
In a seminal study, Ahuja and Katila (2001) report two types of acquisitions in technology-driven acquisitions; high-tech com-panies' acquisitions, and acquisitions, where the technology is the target's only asset component. Similarly, Kohers and Kohers(2001) indicate that the term ‘high-tech’ covers a number of different industries from biotechnology to electronic devices,which are mainly characterized by the term “innovation”. They also argued that the complexity of high-tech firms leads to uncer-tainty and misperception of the market. In another study, Daniel, Hirshleifer, and Subrahmanyam (1998) suggest that this condi-tion might lead to investors' overconfidence. High-tech driven firms are also characterized by important patenting activity(Klevorick, Levin, Nelson, & Winter, 1995; Puranam & Srikanth, 2007). The tight, highly competitive world of high-tech industriesis believed to be the main cause of merger overvaluation, driven by a fear of being less competitive than the others (Rossi, Tarba,& Raviv, 2013). Varied results are also found for high-tech M&A performance literature. On the one hand, Porrini (2004) shows apositive correlation between target firms and the value creation of the acquisition, whereas Paruchuri, Nerkar, and Hambrick(2006) find that the combined firms perform poorly. An interesting finding of multi-national technology-based companies byBannert and Tschirky (2004) claim that the main cause of failure of acquisition is a lack of integrative decision-making or system-atic process. Further, a number of studies attempt to reveal the post-acquisition outcomes in high-tech sectors. For example, Ahujaand Katila (2001) and Cloodt, Hagedoorn, and Van Kranenburg (2006) analyze the ex-ante M&A performance and find positiveimpact on the R&D process. In contrast, different results were obtained which show poor post-acquisition bidder's performancein several industry sectors such as pharmaceutical and biotechnology, software, computers and office equipment, telecommunica-tions, health services, communications and medical equipment (Dalziel, 2008; Laamanen & Keil, 2008; Ragozzino, 2006).
As one of the deal characteristics, method of payment can reveal the importance of relationship with M&A activity. Here,Myers and Majluf (1984) stated that stock-financing in mergers could be described as a manager's belief that the firm isovervalued. In this vein, several empirical studies argued that stock offers yield significant negative abnormal returns, whereascash payments provide positive abnormal returns (Amihud, Lev, & Travlos, 1990; Bradley, Desai, & Kim, 1988; Hansen, 1987;Loughran & Vinjh, 1997; Servaes, 1991). To examine the effects of method of payment in M&A activity, Wansley, Lane, andYang (1983) and Travlos (1987) find that stock offers yield negative abnormal returns for the bidders. It has also been foundthat there is no significance if bidders pay for the mergers by cash. Similarly, Franks and Harris (1989) show that cash methodsare more profitable than equity for the target. Regardless of the takeover types, Goergen and Renneboog (2004) argue that theequity payment method gives less returns for the target. Additionally, method of payment in M&A can be used as a signal forthe important information of the real value of M&A participants associated with asymmetric information (Myers & Majluf,1984). In addition, Jensen (1986) stated that cash financed mergers can mitigate against the possibility of agency problems andwill outperform stock payment in the subsequent three years.
Another issue considered in our study is whether the target's origin is within or outside the US. For example, Martynova andRenneboog (2008), using domestic acquisition studies, show significant abnormal returns. In contrast, previous studies find thatcross-border deals could earn more advantage than domestic acquisition from within the US (Harris & Ravenscraft, 1991;Wansley et al., 1983). Similarly, some studies on international cross-border M&As have demonstrated a better performance ofcross-border acquisitions compared to domestic acquisitions (Ahern, Daminelli, & Fracassi, 2012; Bris & Cabolis, 2008; Danbolt,2004; Martynova & Renneboog, 2008). In the same vein, Conn and Connell (1990) indicated that higher returns can be obtainedsince cross-border acquirers have valuable access to new markets.
Given this prior evidence, our study will control for the payment method, and it is expected that bidders using shares willshow poor post-M&A performance than cash- and hybrid-financed deals. In addition, another deal characteristic that involvescross-border and domestic diversification would be implied; cross-border acquisitions will perform better than domesticacquisitions.
Another body of research focuses on the short-term performance of the high-tech firm acquirer for cross-border and domesticacquisition. Indeed, there has been a long-running debate on the rational component of manager's expectations and sentiment. Inrecent years, there has been an increasing interest in corporate behavioral finance, which also plays an important role in M&Aactivities. It is believed that one of the most common causes of merger failure is managers' overconfidence, as they tend to believethat their actions will maximize their value. When it comes to difficult tasks and their own abilities, the managers may displayoverconfidence. This means a bias related to the understanding of people of their own abilities and knowledge, which maylead them to believe that they are better than they actually are (Shefrin, 2007). The overconfident managers would overestimatetheir returns. They internally believed and thought that the investors undervalued their portfolio. This causes them to be morereluctant to use external finance, increases mergers bidding and lowers the deal quality (Roll, 1986). They tend to make poordecisions on M&A or even investments; especially if the firms are cash-rich. Several studies have indicated that it is not only

200 D. Lusyana, M. Sherif / Journal of High Technology Management Research 27 (2016) 196–213
technical finance that plays a role in M&A activity but also issues relating to behavioral finance. Here, Shiller (2003) suggests thatbehavioral finance can help understand the stock market bubble, while Ritter (2003) proposes two different forms of behavioralfinance; cognitive psychology (the way people think) and the arbitrage limit (the time when the market is inefficient). Moreover,Malmendier and Tate (2008) conclude that overconfident managers would drive the market 65% higher than non-overconfidentCEOs; a conclusion based on data from 394 large US firms from 1980 to 1994. By controlling the target and acquirer relationship,the targets' CEO ownership, the acquirer's board size, and method of financing; it was found that the investors reacted negatively.Three days after the announcement, the firms lost an average of 90 basis points, compared to 12 basis points from the other CEOs'companies.
The study of behavioral finance has thus been trying to uncover the motives behind M&A activity and whether M&A deals wouldcarry the benefit to aggregatemarket value. The hubris hypothesis, to explain corporate takeovers, states that the acquirer infected byhubris would overpay for the targets (Roll, 1986). It is also argued that the hubris hypothesis explainswhy bids occurred in corporatetakeovers, even though the price was above the current market price. Roll (1986) also argued that the hubris hypothesis might sup-port other explanations such as taxes, synergy and inefficiency in target management. He believed that takeovers reflect individualdecisions. Moreover, the successful bidder's actions with many competitors would also blight them with the winner's curse. Thisimplies that the winning bidder has the tendency to actually be a loser, since the deal often exceeds its intrinsic value (Thaler,2012). In other words, the decision makers tend to pay too much for the target on average. During the takeover, the combinedvalue of both bidder and target should fall slightly; the bidder's value should decrease, and the target's value should increase. Anoverconfident manager will overestimate the fundamental value of the target's share and the merger synergy amount. This maywell cause the overconfident manager to pay more for the acquisition (Shefrin, 2007). On the other hand, the target will face twoproblems, the over-expectations of new-venture firms, and share combinations that may lead to dilution cost. The managers alsohave to make decisions as to whether the hoped-for synergy will justify the price to be paid.
Other studies have considered the relationship between stock price and corporate name change. For example, Cooper,Dimitrov, and Rau (2001) found a positive stock price reaction due to the corporate name change in internet-related dotcoms.This change gave cumulative abnormal returns of approximately 74% for the 10 days after the announcement. This interestingresearch identified how firms could attain a large and permanent value increase regardless of their attachment to the Internetindustry. These findings might help us understand how the markets behave according to the news. The observed boom mergerscould be attributed to the close relationship with technological changes; whereas technological shocks drive a company's growththat could be measured by Tobin's Q (Jovanovic & Rousseau, 2002). Another study by Kohers and Kohers (2000) shows the short-term performance of US high-tech mergers during the period 1985–1996. It was found that bidders tended to create positivevalue as with desirable growth opportunities. This study also claimed to conclusively show that the underperformance of longruns, over the three-year period after the high-tech merger, occurs.
Other research finds that the nature of technology industries is high-growth, which differentiates them from other industriesthat create high price tags. For example, Kohers and Kohers (2000) indicated that a high-tech target's performance shows positiveabnormal returns at the time of the merger announcement. However, the bidders may face the risk that the high expectation of atarget's performance may not actually be realized (Kohers & Kohers, 2001). They found that the market invested more enthusiasmin the expected benefits of high-tech acquisitions. Takeover performance could also be examined by accounting performance,operating performance and other measurements, such as size and book-to-market ratio (Fama & French, 1998).
Returning to the M&A activity, it has been noted in previous research that the effects of an event will be reflected immediatelyon security prices. It is believed that the movement will create abnormal returns that can be described as the difference betweenthe realized and expected returns that could be generated, if the takeover had not happened; this area of investigation is referredto as event studies (MacKinlay, 1997). Similarly, Andrade, Mitchell, and Stafford (2001) argued that event studies could be used toexamine whether M&A could make any impact on the stock price movement for both bidder and target. In the same vein, Fama(1970) highlighted the relevance of the future cash flow research and found that investors would be able to predict a firm's futurecash flow. Moreover, it is argued that the bidder's value will increase; many scientific literature reviews attempt to examinewhether takeovers will create or harm an acquirer's value.
To determine the impact of short-term performance, Bosch and Hirschey (1989) found a positive market reaction to corporatename change announcements. A study of high-tech firms was carried out by Cooper et al. (2001) who showed that the firms thatchanged to a dotcom name gained significant abnormal returns at about 53% around the five days' announcement period. Heargued that investors were tempted by the name being associated with the internet, and this condition lends support to theinvestor mania hypothesis, instead of the rational pricing hypothesis; the former being based on the idea of irrational investorbehavior. However, it has also been claimed that markets react positively when a firm removes dot.com from the company'sname (Cooper, Khorana, Osobov, Patel, & Rau, 2005).
Investigating the question of how the acquirer gains wealth from takeovers, Jensen and Ruback (1983) concluded that mea-suring a bidder's return is not that straightforward. Further, they argued that the merger type affects the transaction result.Much of the available literature on M&A looks at whether M&A would give any advantages to the acquirers. As Bradley et al.(1988) pointed out, the value combination of the target and acquirer companies rises 7.5% on the merger announcement. Theyconcluded that the advantages of synergy to the target firm exist when there are multiple bidders involved. Here, Moeller,Schlingemann, and Stulz (2005) indicated that large companies failed to get benefit when compared to small companies, whileHitt, Harrison, and Ireland (2001) stated that both small and large companies do not earn financial gains. Detailed examinationof bidders' performance by Lang, Stulz, and Walkling (1989) showed that well-managed companies got more advantage whenacquiring a poorly managed target firm. In contrast, a good target firm will gain less advantage from tender offers.

201D. Lusyana, M. Sherif / Journal of High Technology Management Research 27 (2016) 196–213
It is argued that, in M&A, the bidder's value will increase and many literature reviews attempt to examine whether takeoverswill create or harm an acquirer's value. In an investigation by Jensen and Ruback (1983), it was found that measuring a bidder'sreturns is more complicated than measuring a target's return. Moreover, the merger type also affected the transaction result.Meanwhile, Sirower (1997) found that wealth distribution occurred for the target firm's stockholders. By assessing mergertypes, whether they are conglomerate or non-conglomerate, Wansley et al. (1983) found that there are no significant differencesbetween the two. However, when the method of payment is controlled, it was found that the pure conglomerate gave greaterabnormal returns when stock payment was used.
Interestingly, some researchers have found that target shareholders would have been the winners in the merging companies,due to the statistically significant abnormal return (Datta, Pinches, & Narayanan, 1992; Hansen & Lott, 1996). A broader perspec-tive has been adopted by Bruner (2002), who argues that targets would earn positive excess returns, regardless of the differenttime periods and deal types. Haleblian, Devers, McNamara, Carpenter, and Davison (2009) see this as ‘not surprising’ since thebidder is the one who pays the merger premium. Moeller et al. (2005) are more concerned with the fifth merger wave, whichrecorded the bidder's loss as the highest across M&A history, although the target shareholders recorded positive excess returns.However, to identify whether an M&A deal is a success or a failure we need to fully understand the M&A process and its stages.There are five stages: corporate strategy development; organizing for acquisitions; deal structuring and negotiation; post-acquisition integration and post-acquisition audit and organizational learning (Sudarsanam, 2003).
Research using event studies typically focuses on the abnormal returns around the event data. An in-depth investigation intohubris was carried out by Roll (1986), who stressed that the impact of hubris tended to make the bidder pay too much for thetarget, which implied the overconfidence of the bidder's manager. An interesting study was carried out by Danbolt andMaciver (2012), who analyzed the domestic and cross-border acquisitions of the targets and acquirers in the UK and identifiedthat both targets and acquirers get the benefit of cross-border acquisition, rather than domestic. The cross-border targets' positivesignificant level was 10.1 percentage points over a 3-day event window, whereas the bidders have only 1.5 percentage points atthe same event window. Further findings ascertained that there is no difference in bid characteristics, when explaining the hightarget's performance. The target would also gain more advantage when the bidders have good governance systems. Anotherinteresting study by Kohers and Kohers (2000) showed that regardless of the method of payment, whether it is by cash orstock, acquirers of high-tech targets experienced significant positive abnormal returns. This finding concluded that the marketfeels optimistic about the acquirer's growth chances when they acquire high-tech targets.
Our study provides an important opportunity to advance the understanding of M&A activity surrounding the high-tech indus-try by observing the bidders' performance during that period. As a result of the research, it is believed that the US high-techdomestic acquisitions will perform better than cross-border deals, due to the technological power in US being greater, comparedto other countries. Hence, the first hypothesis (H1) can be stated as follows:
H1. The high-tech firm acquirers perform better for cross-border acquisition than domestic for a short-run period.
In their analysis of stock as a method of payment, Shleifer and Vishny (2003) stated that overvalued stock prices during theM&A would gain advantage from market inefficiencies over the period, by using stock as a method of payment to get benefitfrom the market's inefficiencies. In this study, tech firms, which are believed to have more cash than other industries, would per-form better than with other methods of payment. Scharfstein and Stein (2002) observed notable rent-seeking behavior and foundthat division managers can raise their bargaining power and get overall compensation from the CEO that does not take the formof cash wages but instead chooses capital budgeting allocations. Other hypotheses to be considered are:
H2. The tech-firm acquirers that used cash payment perform better for cross-border acquisition in the short-run period.
Not only the domestic acquisition, but also the cross-border performance, would be assessed by its method of payment.
H3. The tech-firm acquirers that used cash payment perform better for domestic acquisition in the short-run period.
A series of papers have also attempted to examine the short-term performance of the high-tech firm acquirer for cross-borderand domestic acquisition. We begin with a major study by Kohers and Kohers (2001) who examined tech-firms' takeover wealthcreation. They found that the acquirers were underperforming according to industry-matched benchmarks and size and book-to-market matched control portfolios in the long run. Similarly, Andrade et al. (2001) asserted that long-term event studies wouldgive broader views on the impacts of particular events than short-term performances. The importance of assessing long-termeffects of high-tech M&A is also asserted by Hagedoorn and Duysters (2002). Managers' acquisition decisions are believed tolead to their wealth maximization, based on the motives of takeovers that can be defined based on the acquirers' and businessstrategy objectives (Sudarsanam, 1995). In a key study, Martynova and Renneboog (2008) believed that inconsistency mightoccur for long-term performance and it would lead to a downward trend in the prices for long-term abnormal returns. In anotheranalysis of long-term performance, Barber and Lyon (1997) designed an event study for long-run abnormal stock returns for one-to five-years. By controlling sizes and book-to-market ratios, they stated that long-term analysis could be unpredictable.
Long-term shareholder wealth has also been investigated with the long-term event study approach with several results.Kothari and Warner (1997) argued that long-horizon studies require more attention to reduce the misspecification of actualor potential problems. Similarly, Barber and Lyon (1997) forward the view that long-run abnormal returns gained a testmisspecification that might arise because of survivor bias, rebalancing bias and skew bias. For tender offer activity, and byassessing the size and book-to-market-adjusted returns, Loughran and Vinjh (1997) and Rau and Vermaelen (1998) found

202 D. Lusyana, M. Sherif / Journal of High Technology Management Research 27 (2016) 196–213
significant positive returns at about 43% and 9%, respectively. In contrast, Dodd and Ruback (1977) and Loderer and Martin (1992)found negative abnormal returns. For the merger activity, Langetieg (1978), Franks et al. (1991), Agrawal, Jaffe, and Mandelker(1992), Loughran and Vinjh (1997) and Rau and Vermaelen (1998) found significant negative abnormal returns. Other studiesby Limmack (1991) and Kennedy and Limmack (1996) who investigated the issue of post-acquisition abnormal returns in UKmarket, also revealed bidders' insignificant negative abnormal returns. The poor long-term performance is argued to be causedby the underperformance of low book-to-market firms (Rau & Vermaelen, 1998).
Other studies (e.g. Savor & Lu, 2009) have attempted to draw a fine distinction regarding how methods of payment wouldaffect firms' performance. They found that by using equity as the method of payment, overvalued companies gain benefitfor their long-term shareholders. Similarly, when bid status and targets type are controlled, it will give significant result whenmethod of payment is counted (Mitchell & Stafford, 2000). While Malatesta (1983), in his study, indicated that the acquirer isinsignificantly negative for both short and long-run investments. However, the immediate impact on the target firm is positive andhighly significant. In the same vein, Bradley and Sundaram (2004) are more concerned with the two-year post-announcementreturns, where they found that outcomes are positive for the public target but negative for a private target.
In addition, researchers have mainly been interested in questions concerning high-tech long-term M&A performances in othercountries. For example, Sudarsanam and Mahate (2003) found significantly negative abnormal returns in bidders' long-termperformance, while 35–45% of acquirers earned positive returns. However, Limmack (2003) noted significantly negative returns.Gao and Sudarsanam (2005) studied the long-term benefit for the target firm's shareholders that follow the high-technologytarget acquisitions in the UK. They found that high-tech firms that take over other high-tech firms would create value, althoughthe activity would also create a risk multiplier. Negative relationships between management shareholders and the high-tech firm'sperformance, after the merger, also played an important role in managers' overconfidence. Here, Kohers and Kohers (2001) studied304 mergers during January 1984 to December 1995 in US stock markets and suggest the long-term post-merger underperformanceof acquirers that buy high-tech targets compared to non-acquirer firms.
In the same vein, Conn et al. (2005) examined the announcement and post-acquisition performance of UK bidders for domestic,cross-border, public and private targets through the long-run perspective and concluded that cross-border acquisitions obtainedlower long-run returns compared to domestic acquisition. The acquisitions that involved high-tech firms will perform well incross-border deals. They assessed the performance based on the long-run performance for 36-months post-merger; and found signif-icantly negative abnormal returns for both domestic and cross-border public targets. The most obvious issue to emerge from thisstudy is whether a bidder's long-term performance will be better for high-tech firms for cross-border and domestic acquisition.This will be examined by using buy-and-hold abnormal returns as a long-run approach. Based on the above discussion, the fourthhypothesis (H4) is stated as follows:
H4. The tech-firm acquirers perform better for cross-border acquisition than for domestic acquisition over the long-run period.
Another substantial body of work has investigated the high-tech market bubbles. For example, Acquisti et al. (2015) statedthat one of the main causes of a stock market bubble is media publications that reassure and even encourage the public to investin risky companies instead of being guided by basic financial or legal principles. This sounds familiar when thinking about thedotcom boom of the late 1990s or the financial turmoil in 2007, which grew based on the adage of “Get Big Fast” which aroseduring the dotcom era. This slogan describes start-ups that operated with a short-term loss business plan, trying to cover marketshare and market share domination so that they can charge what they want later. A bubble is a compounded pricing error thatcan be called ‘the foolishness of a lot of investors’ when investors think that they can sell something to someone else at a higherprice (Nofsinger, 2005). High-tech US M&A reached its highest volume and value in 2014, since it peaked in the 2000 bubble, withmid-sized deals ranging from $100mn to $1bn (Ernst & Young, 2015b). This M&A trend begun in 2007 when 3345 mergers andacquisitions occurred, rising to about 3512 deals in 2014. Not only were M&A trades happening, but many technology firms' initialpublic offering also occurred. However, Ernst and Young (2015b) believed that this time around does not reflect the over-hypedbubble that burst the dot.com era darlings. It is also expected that in 2015 robust Tech-M&A activity will continue.
Furthermore, Shleifer (2000) also mentioned the overreaction evidence proved that during the long horizons, security priceswill overreact in a consistent pattern; which means that ‘good track record securities’ tend to be overpriced and have low averagereturns. Consequently, a model of investor sentiment has been created to prove the psychological evidence that people tend to failto make decisions under uncertainty. Bernard and Thomas (1989) supported the under-reaction hypothesis from stock cross-section returns. They examined 84,792 US companies' earnings announcements during 1974 and 1986 and found that stockswith positive earnings would also earn positive returns before the earnings' announcement, since the prices already reflectedthe earnings. Moreover, stocks with positive earnings would yield positive earnings on and after the announcement.
In addition, Duggan (2015) stated that the dotcom hype will create a market bubble that might be even worse for investors,since the trend has the same scenario with the late 1990's dotcom bubble. Today, broadcast.com, AOL and Netscape have beenmodernized to Uber, Twitter and Facebook Inc. (finance.yahoo.com). The phenomenon of the private crowd funding movement,where small investors have the opportunity to invest in start-up tech companies, will have the negative impact to the sharestrade. During the 1990s dotcom bubble, although the companies did not transpire to be reliable, there was the temptation forinvestors to trade the stocks since they were public companies. Duggan (2015) argued that the only difference between thetwo situations was that the modern startups were mostly pitching apps, whereas dotcom start-ups were pitching web-sites. How-ever, since they were private crowd-funded apps, when something bad happened, the investors would be less likely to be able tosell their shares and get their money back, compared to the 2000 dotcom bubble that was based on public companies.

203D. Lusyana, M. Sherif / Journal of High Technology Management Research 27 (2016) 196–213
Thus, on the basis of the research reviewed above, there are several important areas where our study makes an originalcontribution to the M&A field. One of them is by trying to explain the existence of abnormal returns during the new hype ofhigh-tech firms and the dotcom bubble in the late 1990s. The extended approaches from Kohers and Kohers (2001) focusedon the takeovers of high-tech firms. Further studies by Conn et al. (2005) and Antoniou et al. (2008) provide more evidence ofthe over-optimistic perceptions of the high-tech firms' performance. Hence, the performance for the period 1996–2002 and during2007–2014 could be compared. The hypothesis construct is that positive excess returns for the second period would be obtainedsince it is expected that high-tech M&A will create value for the acquirers' shareholders. Similarly, Benou and Madura (2005)stated that the acquired firms were still young or even start-ups. The study by Meglio (2009) stated that M&A success is deter-mined by the quality of the integration process. Technology-driven sectors are of concern for both the economic and innovativepost-acquisition performance (Cassiman, Colombo, Garrone, & Veugelers, 2005).
H5. The high-tech acquirers perform better during the years 2007–2014 than the years 1996–2002 for short-run performance.
3. Data and methodology
The data adopted in this study is daily data on M&A activities and spans the period January 1, 2007–December 31, 2014.The data has been obtained from the Securities Data Corporation (SDC) M&A database of Thomson Finance using high-techfirms SIC code. The sample consists of high-tech bidders whose targets are high-tech (conglomerate) and non-high-tech (non-conglomerate) industries. The data on the announcement and effective dates, deal value of M&A, acquirer names, target names,CUSIP number market capitalization (size), book to market, payment method, deal attitudes and target origin country werealso obtained from SDC. Following Puranam and Srikanth (2007), Klevorick et al. (1995) and Kohers and Kohers (2000),technology-driven sectors, according to the Securities Data Corporation (SDC) and siccode.com, are classified into biotechnology,ICT, electronics, telecommunications, software and computer-related services, high-tech manufacturing, communication services,patenting activity, and miscellaneous publishing and biotechnology industries. For the acquisitions, we only use successful(complete) deals to investigate the effect of M&A announcements on bidder's shareholder wealth. The high-tech M&A bidder'scriteria are all US firms and the deal value that is worth more than $1 million and the percentage of shares owned by theacquirers after the deal required should be at least 50%. For method of payment, we use cash, shares or hybrid as deal character-istics. We also use the value-weighted return including dividend as a proxy for the market return. The domestic acquisitions arecategorized as a within-US country industry (domestic), while cross-border acquisitions are based on the origin's country of targetindustry. The announcement data and bidder's characteristics for the M&A announced between January 1, 2007 and December 31,2014 are obtained from Thomson One banker. As can be seen from Table 1 the total deals before using our criteria to filter thefinal sample is 2417, whereas it totals 1078 deals as a final sample.
As seen from Table 1, the cross-border and domestic samples are 244 deals and 834 deals respectively. In addition, the totalcross-border firms are 89, lower than domestic firms, which is 260 bidders. However, cross-border samples provide lower abnor-mal return and standard deviations compared to domestic acquisitions. The maximum value of domestic acquisitions is higherthan cross-border, 66.68% and 33.6% respectively. Similarly, the minimum value for domestic is also lower than cross-border.Another deal characteristic is payment method, which consists of all deals financed by cash, shares or hybrid. The definition‘cash only’ means that transactions is made by cash payment only, whereas share acquisition is made by the shares and hybridis the combination of both cash and share payment (Wansley et al., 1983). The cash only payment sample for domestic acquisi-tion has the biggest number of deals (421) of the total M&A deals, whereas the shares and hybrid deals totaled 158 and 255,
Table 1Sample with and cross-border acquisitions.
Total sample
Total deals 2417Incomplete data 1338Final sample bidders 1079
Cash Shares Hybrid Total sample
Cross-border 179 29 36 245Domestic 421 158 255 834
Cross-border Domestic Total
US high-tech M&A deals 244 834 1078Number of firms 89 260 349Average abnormal returns 0.0006 (−0.0285) 0.0015 (−0.0406)AR (max; min) [−0.1573; 0.3360] [−0.3046; 0.6668]
The table summarizes the bidder and target samples in high-tech firms in M&A deals during the period 2007–2014. The differentiation between domestic andcross-border M&A is based on the target's country. The criteria used to obtain the sample are based on the completed deals; bidders and targets are US firms;deal value is worth more than $1 million; method of payment used are either cash, shares and hybrid and percentage of shares owned of by the acquirersafter the deal of at least 50%. Abnormal return mean is the average of abnormal return for acquirers. Numbers in bracket are standard deviation of abnormal returnwhile the numbers in parentheses are abnormal return of maximum and minimum values.

204 D. Lusyana, M. Sherif / Journal of High Technology Management Research 27 (2016) 196–213
respectively. In contrast, the least deal numbers of cross-border are associated with share payment, registering at 29 deals, follow-ed by hybrid payment of 36 deals. Consequently, the number of domestic deals exceeds cross-border deals across all types of pay-ment methods.
Event studies are a crucial tool to examine the leak opportunity of delay information (Cuthbertson & Nietzsche, 2001, p.254).They have been widely used to measure the impact of an event on a firm's value. The main purpose of this method is to deter-mine the interest event and to identify the event windows that examine the security price during the event window (MacKinlay,1997). The aims of the event study are to examine the wealth impact of an occurring event and as a test of null hypothesis,whether the market reflects the new information efficiently. Event study is expected to be able to explain the impact of thecorporate action issues to the firm's value. For the event study methodology, the estimation window is used to estimate the valuesof the parameters required to calculate abnormal returns during the event window. For our study, the first public mergerannouncement date is the most common of event date. However, if the information is available before the date, the abnormalreturn incurred would be examined before the event date (Halpern, 1983).
To estimate the cumulative abnormal return during the event window, the estimation window is used to capture the eventimpact. Fig. 4 shows the event at time τ as the announcement day. T0 to T1 represent the normal return prior to the event.Assuming the event day is one single day =0, the event window will be extended to T1 = t to avoid the confoundedness ofthe event impact to the normal return during the estimation window.
The abnormal return is used to measure the shareholders' wealth effect around announcement date. The log return is con-structed from the daily company stock prices by using:
wherereturnValue-
wherecompa
Rit ¼ ln Pt=Pt−1ð Þ ð1Þ
where Rit is the return on firm i on day t, Pt is stock firm price at day t, and Pt−1 is firms stock price at day t − 1. The normalreturn is the expected returns if the event does not exist. In contrast, the prediction difference between actual and expectedreturn represents the abnormal returns. Both abnormal returns for short and long-horizon approaches are specified as:
ARit ¼ εit ¼ Rit− ∝i þ βiRmtð Þ ð2Þ
ARit is abnormal return in the event window, βi is the coefficient slope, Rit is the return on stock i for period t, Rmt is theon the market portfolio for period t. εit is disturbance term (εit=0). Market index represented the factor whereas CRSPweighted Index is chosen.
3.1. Short-term performance (abnormal return)
To measure the abnormal returns for short-term acquisitions, the market-adjusted return is adopted to estimate the predictedreturns. The most common method to measure the short-term performance is the cumulative abnormal return. It uses an arith-metic averaging approach and it can be calculated using a single control firm and the reference portfolios free of the new listingbias (Lyon, Barber, & Tsai, 1999). The short-run abnormal return is important to accommodate the event window, which is shownbelow:
CARi τ1; τ2ð Þ ¼Xτ2τ¼τ1
ARiτ ð3Þ
CARi(τ1,τ2) presents the cumulative abnormal returns from τ1 to τ2 where T1 b τ1 ≤ τ2 ≤ T2, ARit is the abnormal return of thesample in the event window. The cumulative abnormal return from τ1 ,τ2 is the sum of the included abnormal returns. Assumingabnormal return and cumulative abnormal return are independent across the companies and there is no overlap the formula isgiven as follows:
AARt ¼1N
XNi¼1
ARit ð4Þ
CARi τ1;τ2ð Þ ¼1N
XNi¼1
CARi τ1;τ2ð Þ ð5Þ
AARt is the aggregate abnormal return across the companies for period t. CARt is the cumulative abnormal return across thenies for period t. Our study uses both J1 and J2 to test the significance. It is assumed that there is no overlapping of event
Fig. 4. Event windows.
windogated
205D. Lusyana, M. Sherif / Journal of High Technology Management Research 27 (2016) 196–213
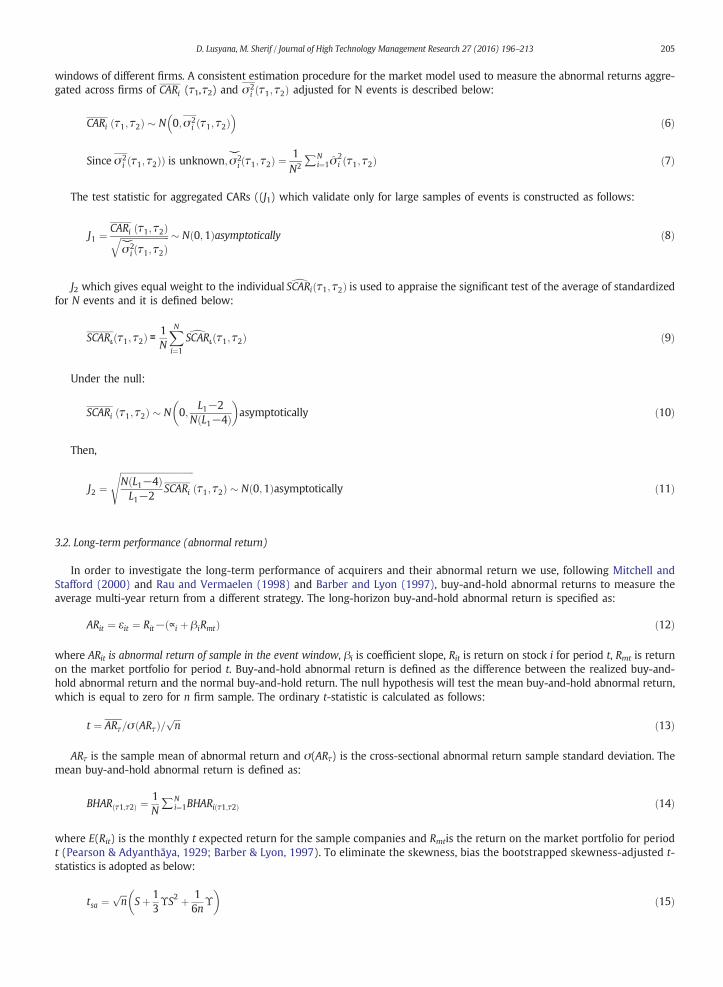
ws of different firms. A consistent estimation procedure for the market model used to measure the abnormal returns aggre-across firms of CARi (τ1,τ2) and σ2
i ðτ1; τ2Þ adjusted for N events is described below:
CARi τ1; τ2ð Þ � N 0;σ2i τ1; τ2ð Þ
� �ð6Þ
Since σ2i τ1; τ2ð ÞÞ is unknown;σ2
i τ1; τ2ð Þ ¼ 1N2 ∑
Ni¼1σ
2i τ1; τ2ð Þ ð7Þ
The test statistic for aggregated CARs ((J1) which validate only for large samples of events is constructed as follows:
J1 ¼ CARi τ1; τ2ð Þffiffiffiffiffiffiffiffiffiffiffiffiffiffiffiffiffiffiffiffiffiffiσ2
i τ1; τ2ð Þq � N 0;1ð Þasymptotically ð8Þ
J2 which gives equal weight to the individual dSCARiðτ1; τ2Þ is used to appraise the significant test of the average of standardizedfor N events and it is defined below:
SCARι τ1; τ2ð Þ ≡ 1N
XNi¼1
dSCARι τ1; τ2ð Þ ð9Þ
Under the null:
SCARi τ1; τ2ð Þ � N 0;L1−2
N L1−4ð Þ� �
asymptotically ð10Þ
Then,
J2 ¼ffiffiffiffiffiffiffiffiffiffiffiffiffiffiffiffiffiffiffiffiffiffiffiffiffiffiffiffiffiffiffiffiffiN L1−4ð ÞL1−2
SCARi
sτ1; τ2ð Þ � N 0;1ð Þasymptotically ð11Þ
3.2. Long-term performance (abnormal return)
In order to investigate the long-term performance of acquirers and their abnormal return we use, following Mitchell andStafford (2000) and Rau and Vermaelen (1998) and Barber and Lyon (1997), buy-and-hold abnormal returns to measure theaverage multi-year return from a different strategy. The long-horizon buy-and-hold abnormal return is specified as:
ARit ¼ εit ¼ Rit− ∝i þ βiRmtð Þ ð12Þ
where ARit is abnormal return of sample in the event window, βi is coefficient slope, Rit is return on stock i for period t, Rmt is returnon the market portfolio for period t. Buy-and-hold abnormal return is defined as the difference between the realized buy-and-hold abnormal return and the normal buy-and-hold return. The null hypothesis will test the mean buy-and-hold abnormal return,which is equal to zero for n firm sample. The ordinary t-statistic is calculated as follows:
t ¼ ARτ=σ ARτð Þ= ffiffiffin
p ð13Þ
ARτ is the sample mean of abnormal return and σ(ARτ) is the cross-sectional abnormal return sample standard deviation. Themean buy-and-hold abnormal return is defined as:
BHAR τ1;τ2ð Þ ¼1N∑N
i¼1BHARi τ1;τ2ð Þ ð14Þ
where E(Rit) is the monthly t expected return for the sample companies and Rmtis the return on the market portfolio for periodt (Pearson & Adyanthāya, 1929; Barber & Lyon, 1997). To eliminate the skewness, bias the bootstrapped skewness-adjusted t-statistics is adopted as below:
tsa ¼ffiffiffin
pSþ 1
3ΥS2 þ 1
6nΥ
� �ð15Þ

where
Table 2Bidders' descriptive statistics (abnormal returns & methods of payment).
Panel A: cross-border
Cash Shares Hybrid Total Cross-border
N 790 22 165 977Mean 0.0001 0.0091 0.0018 0.0060Standard deviation 0.0265 0.0367 0.0358 0.0285Median −0.0009 0.0075 −0.0006 −0.0009Min −0.1577 −0.0502 −0.0661 −0.1573Max 0.2528 0.1077 0.3364 0.3364
Panel B: domestic
Cash Shares Hybrid Total domestic
N 1793 275 1155 2860Mean −0.0004 −0.0007 0.0032 0.0015Standard deviation 0.0353 0.0478 0.0495 0.0406Median −0.0010 −0.0007 −0.0007 −0.0007Min −0.7208 −0.2101 −0.3030 −0.3046Max 0.3260 0.1797 0.6683 0.6668
1 The
206 D. Lusyana, M. Sherif / Journal of High Technology Management Research 27 (2016) 196–213
S ¼ ARτσ ARτð Þ ; and Υ ¼ ∑n
i¼1 ARiτ−ARτð Þ3nσ ARτð Þ3 ð16Þ
Υ is the skewness coefficient estimation andffiffiffin
pS is the t-statistics. The bootstrap application is conducted to provide scruti-
nized test statistics from the skewness-adjusted t-statistics specification.
4. Summary statistics and empirical findings
4.1. Summary statistics
We begin our analysis by reporting the summary statistics. Table 2 includes the mean, standard deviation, minimum, medianand maximum of the high-tech public firms listed on the US stock market and involved in M&A activities during the years 2007–2014; over the 11-day event window. Panel A in Table 2 shows statistics associated with cross-border acquisitions, while panel Bpresents statistics on the domestic acquisitions. Both panels have statistics on methods of payment; cash, share and hybrid pay-ments. As we can see in panel A, the total number of cross-border deals is 977 and panel B shows the domestic deals totaling2860.
The results indicate that both cross-border and domestic acquisitions are dominated by cash payments totaling 790 deals forcross-border acquisitions and 1793 deals associated with domestic acquisitions. In addition, the results show that the lowest meandomestic M&A is associated with cash only payment, while the highest average abnormal return is related to the hybrid payment,with values of 0.32%. The lowest standard deviation and minimum value are associated with cash as a method of pigment, 2.65%and −72.08% respectively. Overall, the domestic acquisitions have more deals with each payment method when compared to thecross-border deals as seen in panel A.
4.2. Empirical findings
4.2.1. Short-run performances US high-tech firms' resultsNow we move on to test the short-run performances of US high-tech firm's performance. Table 3 presents the cumulative
abnormal returns (CAR) and standardized cumulative abnormal returns (SCAR) for the bidder's around the announcement ofthe acquisition deal. The table also reports the results associated with the cross-border in comparison with the domestic high-tech M&A during the 11-day event window (t − 5, t + 5).
The findings show that the bidders of domestic acquisitions earn higher and significant abnormal returns over the 11-dayevent window. Interestingly, we find only one significant result with the cross-border deals during the day before the announce-ment date at 10% significance level for SCAR.1 Table 3 also shows significant (at 10% level of significance) negative abnormalreturns associated with day-3 and day-4 for the domestic acquisitions. Overall, we find that the cumulative abnormal return CARearned by the cross-border bidders is substantially below the CAR earned by the domestic bidders around the deal's announce-ment date. Additionally, the reaction of the cross-border bidders' shareholders is more volatile than the domestic bidders'reactions. Importantly, the domestic acquisitions show significant positive abnormal returns for the post-acquisition performance.
same pattern of results holds when using five-day event window (t − 2, t + 2), as seen in Table 7.

Table 3Test statistics of cross-border and domestic bidders in high-tech M&A.
Panel A: cross border
Event date CARs J1 SCARs J2
−5 0.0008 0.2762 0.0351 0.3209−4 −0.0025 −0.5887 −0.9730 −0.8898−3 −0.002 −0.3896 −0.1380 −1.262−2 −0.0016 −0.2729 −0.1560 −1.426−1 −0.0017 −0.2603 −1.810 −1.653⁎
0 0.0026 0.3557 −0.0619 −0.56561 0.0096 1.2198 0.0085 0.07742 0.0105 1.2530 0.0389 0.35593 0.1170 1.3167 0.0077 0.07024 0.0085 0.8988 −0.0257 −0.23515 0.0067 0.6709 −0.0436 −0.3988
Panel B: domestic
Event date CARs J1 SCARs J2
−5 −0.0032 −1.261 0.1140 −1.774⁎
−4 −0.0064 −1.766⁎ −0.1240 −1.932⁎
−3 −0.0076 −1.723⁎ −0.1390 −2.153⁎⁎
−2 −0.0072 −1.409 −0.1370 −2.130⁎⁎
−1 −0.0060 −1.058 −0.1160 −1.796⁎
0 0.0012 1.873⁎ 0.0368 0.57201 0.0174 2.582⁎⁎⁎ 0.1110 1.717⁎
2 0.0180 2.494⁎⁎ 0.1110 1.718⁎
3 0.0192 2.510⁎⁎ 0.1130 1.755⁎
4 0.0186 2.304⁎⁎ 0.1040 1.6125 0.0164 1.944⁎ 0.0933 1.450
This table presents the acquirer's cross-border and acquirer's domestic CAR with corresponding test J1 and J2 test during the 11-day event window.⁎ Denotes statistical significance at the 0.10 level.⁎⁎ Denotes statistical significance at the 0.05 level.⁎⁎⁎ Denotes statistical significance at the 0.01 level.
207D. Lusyana, M. Sherif / Journal of High Technology Management Research 27 (2016) 196–213
However, both cross-border and domestic acquisitions have earned negative abnormal returns before the announcement date,although positive abnormal returns appear on the announcement date. Figs. 5 and 6 shed more light on our findings, in particularCAR for cross-border and domestic acquisition. Hence, these results suggest that domestic acquisitions perform better than cross-border acquisitions.
With regard to investigating the impact of payment methods on the abnormal returns of the bidders, Table 4 shows that theannouncement's creation of abnormal returns indicates that non-cash deals perform better than all other methods of payment forcross-border acquisitions. For domestic acquisitions, we find evidence supporting the hybrid acquisitions. As is shown in Table 4,the acquisitions that used cash finance react significantly more negatively than the non-cash post-acquisitions' performance.Interestingly, for stock payments, we find that the cross-border deals provide higher abnormal returns than those associatedwith domestic bidders. However, there are no significant results for either cross-border or domestic post-performance for theshare-only payment method. Moreover, the pre-acquisition performance for domestic deals has significant negative resultsfrom 5 days before the announcement. Similarly, the cross-border acquisitions also show significant negative returns from2 days before the announcement. This finding implies that mergers with cash convey negative information for post-acquisition
-.0
1-.0
05
0.0
05
.01
.015
.02
CA
R
-5 5-1 0 1
Event Date
CARS Bidders around Domestic Acquisition
Fig. 5. CAR bidder's trend around domestic acquisitions.

-.0
02
0.0
02
.00
4.0
06
.00
8.0
1.0
12
CA
R
-5 5-1 0 1
Event Date
CARS Bidders around Cross-border Acquisition
Fig. 6. CAR bidder's trend around cross-border acquisition.
208 D. Lusyana, M. Sherif / Journal of High Technology Management Research 27 (2016) 196–213
performance. Consequently, this finding rejects H2 and H3 hypotheses, which stated that cash will provide positive post-M&A re-actions/returns.
4.2.2. Long-run performances US high-tech firms' resultsNext, we examine the long-term performance of the US high-tech bidder firms. Table 5 reports the buy-and-hold abnormal
returns for the 36 months following the M&A completion. Notably, there is a clear difference in the abnormal returns betweenthe cross-border and domestic sample of high-tech firms in the US stock market. In addition, bootstrapped t-statistics areused to eliminate any skewness bias. Starting with the cross-border acquisitions, the results show that the returns are slightlylower than those associated with the domestic acquisitions. Furthermore, it is found that both holding period and bootstrapped
Table 4Cross-border and domestic payments.
Panel A: cross-border
Cross-border cash payments Cross-border share payments Cross-border hybrid payments
E. window CARs J1 SCARs J2 CARs J1 SCARs J2 CARs J1 SCARs J2
−5 0.0009 0.2777 0.0284 0.2339 −0.0051 −0.1963 0.0332 0.0453 0.0015 0.1679 0.0755 0.2817−4 −0.0027 −0.6253 −0.1170 −0.9608 0.0034 0.0914 0.0913 0.1245 −0.0020 −0.1546 −0.0213 −0.0796−3 −0.0028 −0.5264 −0.1530 −1.2596 0.0415 0.9195 0.2890 0.3933 −0.0040 −0.2557 0.1150 −0.4287−2 0.0041 −0.6605 −0.2040 −1.680⁎ 0.0475 0.9101 0.1790 0.2446 0.0031 0.1713 0.0330 0.1233−1 −0.0051 −0.7419 −0.2430 −2.004⁎⁎ 0.0592 1.015 0.1830 0.2496 0.0059 0.2919 0.0771 0.28760 −0.0020 −0.2635 −0.1410 −1.1613 0.0910 1.424 0.6520 0.8882 0.0121 0.5491 0.2220 0.82731 0.0023 0.2828 −0.0521 −0.4286 0.1250 1.807 1.040 1.412 0.0284 1.192 0.1580 0.59112 0.0026 0.3020 −0.0171 −0.1403 0.1066 1.436 0.8740 1.191 0.0347 1.365 0.1930 0.71923 0.0060 0.6474 −0.0245 −0.2020 0.0942 1.203 0.7460 1.017 0.0273 1.013 0.0640 0.23904 0.0026 0.2669 −0.0538 −0.4431 0.0671 0.8138 0.5130 0.6990 0.0272 0.9562 0.0309 0.11545 0.0010 0.0871 −0.0605 −0.4978 0.1010 1.162 0.7240 0.9861 0.0199 0.6678 −0.0690 −0.2575
Panel B: domestic
Domestic cash payments Domestic share payments Domestic hybrid payments
E. window CARs J1 SCARs J2 CARs J1 SCARs J2 CARs J1 SCARs J2
−5 −0.0040 −1.450 −0.2190 −2.695⁎⁎⁎ −0.0038 −0.3864 −0.0428 −0.2060 −0.0035 −0.7128 −0.0894 −0.8827−4 −0.0047 −1.194 −0.1560 −1.923⁎ −0.0078 −0.5685 −0.0957 −0.4611 −0.0082 −1.263 −0.1280 −1.268−3 −0.0030 −0.6321 −0.1600 −1.905⁎ −0.0248 −1.475 −0.2070 −0.9995 −0.0119 −1.407 −0.1430 −1.412−2 −0.0049 −0.8884 −0.1710 −2.099⁎⁎ −0.0092 −0.4720 −0.1320 −0.6344 −0.0130 −1.332 −0.1450 −1.435−1 −0.0042 −0.6857 −0.1610 −1.983⁎⁎ −0.0114 −0.5257 −0.0675 −0.3250 −0.0085 −0.7833 −0.0848 −0.83780 0.0066 0.9715 −0.0315 −0.3881 −0.0004 −0.0189 0.0299 0.1442 0.0200 1.585 0.1130 1.1161 0.0033 0.4574 −0.0077 −0.0950 0.0035 0.1369 0.0852 0.4103 0.0271 2.104⁎⁎ 0.2280 2.250⁎⁎
2 0.0014 0.1845 −0.0179 −0.2204 0.0034 0.1238 0.0431 0.2076 0.0295 2.137⁎⁎ 0.2470 2.438⁎⁎
3 0.0009 0.1094 −0.0328 −0.4039 −0.0017 −0.0382 0.0512 0.2465 0.0332 2.268⁎⁎ 0.2590 2.555⁎⁎
4 −0.0032 −0.3688 −0.0619 −0.7610 −0.0070 −0.2274 0.0109 0.0524 0.0388 2.516⁎⁎ 0.2820 2.781⁎⁎⁎
5 −0.0042 −0.4594 −0.0618 −0.7609 −0.0082 −0.2535 0.0320 0.1543 0.0351 2.173⁎⁎ 0.2590 2.556⁎⁎
This table reports the bidders' cross-border (panel A) and bidders' domestic (panel B) t-statistics results: showing cash only, share and hybrid payment options(the latter involving a combination of cash and shares). J1 and J2 are test statistics.⁎ Indicates significance at the 10% level.⁎⁎ Indicates significance at the 5% level.⁎⁎⁎ Indicates significance at the 1% level.

Table 5Cross-border and domestic M&A long-run performance.
Panel A: cross-border
Number of observations HPRs J1 BHAR Bootstrapped t-statistics
44 −0.112 −1.08 −0.112 −0.972
Panel B: domestic
Number of observations HPRs J1 BHAR Bootstrapped t-statistics
14 −0.216 −0.754⁎ −0.216⁎⁎ −0.623⁎⁎⁎
This table shows cross-border and domestic high-tech M&A for holding period return (HPR), buy-and-hold abnormal return (BHAR) and bootstrapped t-statistics.⁎ Indicates significance at the 10% level, from a t-test of the mean.⁎⁎ Indicates significance at the 5% level, from a t-test of the mean.⁎⁎⁎ Indicates significance at the 1% level, from a t-test of the mean.
209D. Lusyana, M. Sherif / Journal of High Technology Management Research 27 (2016) 196–213
t-statistics show insignificant negative abnormal returns. Importantly, the bidders' performance in domestic acquisitions hasnegative returns of 21.60%. However, the cross-border acquisitions registered returns of −1.12%. It is worth noting that thereis no evidence of significant findings for both cross-border and domestic acquisitions. This result is associated with the three-year post-event buy-and-hold abnormal returns of equal-weighted acquirer firms.
4.2.3. High-tech performance during 1996–2002 and 2007–2014To test high-tech merger performance over time, the bidders' abnormal returns for different time periods are examined and
results are reported in Table 6. Importantly, for mergers announced during the 2007–2014 period there are significant resultsindicating positive abnormal returns on the announcement date at 10% significance level for domestic acquisitions. In addition,
Table 6High-tech short-term estimations— (1996–2002) and (2007–2014).
Panel A: high-tech performance during 1996–2002
Cross-border bidders Cross-border bidders
Event date CARs J1 SCARs J2 CARs J1 SCARs J2
−5 −0.0199 −0.4875 −0.0825 −0.1599 −0.018 −1.570 −0.392 −1.310−4 −0.0098 −0.1709 −0.0895 −0.1726 −0.133 −1.369 −0.242 −0.8087−3 −0.0004 −0.0063 −0.131 −0.2528 −0.013 −1.091 −0.249 −0.8326−2 −0.0167 −0.2055 −0.299 −0.5762 −0.0075 −5.438 −0.18 −0.6023−1 −0.0362 −0.3970 −0.292 −0.5628 −0.0043 −0.283 −0.925 −0.30880 0.0113 0.1132 −0.0876 −0.1687 0.0013 0.0797 0.0792 0.26451 −0.0182 −0.1685 −0.0090 −0.0174 −0.0008 −0.0424 0.102 0.34162 0.084 0.7289 0.304 0.5850 0.0002 0.0125 0.0891 0.29753 0.0907 0.7419 0.0933 0.1798 0.0061 0.2933 0.0879 0.29344 0.0834 0.6476 −0.109 −0.2091 0.0069 0.3182 0.124 0.41355 0.03 0.2222 −0.245 −0.4727 0.0145 0.6358 0.206 0.6893
Panel B: high-tech performance during 2007–2014
Cross-border bidders Domestic bidders
Event date CARs J1 SCARs J2 CARs J1 SCARs J2
−5 0.0008 0.2762 0.0351 0.3209 −0.0032 −1.260 0.114 −1.774⁎
−4 −0.0025 −0.5887 −0.973 −0.8898 −0.0064 −1.766⁎ −0.124 −1.932⁎
−3 −0.0020 −0.3895 −0.138 −1.262 −0.0076 −1.723⁎ −0.139 −2.153⁎⁎
−2 −0.0016 −0.2728 −0.156 −1.426 −0.0072 −1.408 −0.137 −2.130⁎⁎
−1 −0.0017 −0.2602 −1.81 −1.653⁎ −0.0060 −1.058 −0.116 −1.796⁎
0 0.0026 0.3557 −0.0619 −0.5656 0.0012 1.873⁎ 0.0368 0.57201 0.0095 1.219 0.0084 0.0773 0.0174 2.582⁎⁎⁎ 0.111 1.717⁎
2 0.0105 1.253 0.0389 0.3559 0.018 2.494⁎⁎ 0.111 1.718⁎
3 0.117 1.317 0.0077 0.0702 0.0192 2.510⁎⁎ 0.113 1.755⁎
4 0.0084 0.8988 −0.0257 −0.2351 0.0186 2.304⁎⁎ 0.104 1.6125 0.0066 0.6709 −0.0436 −0.3987 0.0164 1.944⁎ 0.0933 1.450
This table reports the bidders' cross-border and domestic M&A form the year 1996–2002 (panel A) and 2007–2014 (panel B) t-statistics result.⁎ Indicates significance at the 10%, from a t-test of the mean.⁎⁎ Indicates significance at the 5% from a t-test of the mean.⁎⁎⁎ Indicates significance at the 1% level, from a t-test of the mean.

Table 7Test statistics of cross-border and domestic bidders' performance in high-tech M&A.
Panel A: cross-border acquisition
Event date CARs J1 SCARs J2
−2 0.0003 0.0907 −0.0881 −0.8057−1 0.0001 0.0251 −0.0992 −0.90680 0.0044 0.7720 0.0488 0.44631 0.0115 1.7604⁎ 0.1300 1.1892⁎⁎
2 0.0124 1.6998⁎ 0.1480 1.3566
Panel B: domestic acquisition
Event date CARs J1 SCARs J2
−2 0.0004 0.1377 −0.0529 −0.8224−1 0.0016 0.3592 −0.0268 −0.41590 0.0193 3.5961⁎⁎⁎ 0.149 2.31571 0.0250 4.0366⁎⁎⁎ 0.194 3.01232 0.0256 3.6922⁎⁎⁎ 0.167 2.5964
The table presents the acquirer's cross-border and acquirer's domestic CAR with corresponding test J1 and J2 test during the 5-day event window.⁎ Denotes statistical significance at the 0.10 level.⁎⁎ Denotes statistical significance at the 0.05 level.⁎⁎⁎ Denotes statistical significance at the 0.01 level.
210 D. Lusyana, M. Sherif / Journal of High Technology Management Research 27 (2016) 196–213
pre-acquisition performance shows significant negative abnormal returns. Following the merger announcement date, the post-acquisitions show positive performance with 1% level of significance in one day after the announcement day. Notably, a rangeof significant results was obtained for the rest of the post-announcement event window. However, although the domestic acquisitionperformance yields significant results, the cross-border data shows insignificant positively abnormal returns after the acquisitions.Importantly, on the announcement day both cross-border and domestic M&As show positive performance, significant at the 10%level for domestic acquisitions only with 0.12% abnormal returns. Before the announcement day the abnormal returns are negativeduring the t − 5 event window with 10% level of significance on days 3 and 4.
Table 6 also shows no significant results for both cross-border and domestic acquisitions of high-tech firms' performancesduring the dotcom bubble. Five days before the announcement and one day after, there are only insignificant negative returnsfor both types of deal location; whereas during 2007–2014 there are a variety of significant results. This may be the case giventhe fact that during the first period dotcom bubble, the bidders' shareholders gained no real wealth from the deals. Althoughthe M&A value during the second period is higher than the previous period, the bidders still gain real value from the deals forthe short-run performance. Before the announcement dates, companies' shares reacted negatively during the four and five daysbefore the announcement for cross-border and domestic acquisitions respectively; however, the performance has improvedafter the announcement days. Additionally, there is only one significant level at 10% one day before the announcement date,while the results for domestic bidders varied during the event windows as seen in Table 7. This implies that the bidders didnot report significant short-term advantages for the M&A deals during the event windows [−5, +5]. In contrast, for the secondperiod during 2007–2014, the significant negative results occurred before the deal and then reacted positively to the abnormalreturns after the announcement date.
5. Conclusion
This study examined the performance of bidders acquiring high-tech US targets in the short and long runs. The study alsoaimed to bridge the gap in knowledge between the bidder's performance during 2007–2014 and the dotcom bubble period of1996–2002. We used event study approach to measure the abnormal returns (CARs) in the change in the value of bidders thatacquire high-tech targets. Evidence to support the growth of high-tech segment of merger market is discovered. We find positiveabnormal returns for the domestic bidders during 2007–2014. Importantly, the cross-border acquisition obtained insignificantpositive cumulative abnormal returns, implying that the domestic bidders earn more wealth than the cross-border bidders. Inaddition, we find that abnormal returns are higher after the dotcom bubble period 1997–2002, in particular during the period2007–2014 for short-term domestic performance. We also find supportive evidence that cash-rich bidders required high-techtargets to seize growth opportunities, and consequently earned high abnormal returns.
While this study helps rectify the gaps in existing literature on the performance of bidders acquiring high-tech targets in theshort- and long-term periods, it highlights a number of other gaps for further research. The most possible immediate expansionwould be to perform the study on domestic acquisitions in other countries, as they would have felt the spillover effect. In addition,the definition for high-tech industries could vary in each of the previous studies. This may lead to different conclusions. Anotheravenue for research would be to study the behavior of bidders to determine the sort of firms that acquired high-tech target andhow their firm characteristics impact on high abnormal returns for merger firms. Another interesting direction for future researchwould be to compare the M&A deals for both high and non-high-technology firms.

211D. Lusyana, M. Sherif / Journal of High Technology Management Research 27 (2016) 196–213
References
Acquisti, A., Brandimarte, L., & Loewenstein, G. (2015). Privacy and human behavior in the age of information. Science, 347(6221), 509–514.Agrawal, A., Jaffe, J., & Mandelker, G. (1992). The post-merger performance of acquiring firms: A re-examination of an anomaly. The Journal of Finance, 47(4),
1605–1621.Ahern, K., Daminelli, D., & Fracassi, C. (2012). Lost in translation? The effect of cultural values on mergers around the world. Journal of Financial Economics, 117(1),
165–189.Ahuja, G., & Katila, R. (2001). Technological acquisitions and the innovation performance of acquiring firms: A longitudinal study. Strategic Management Journal, 22(3),
197–220.Amihud, Y., Lev, B., & Travlos, N. (1990). Corporate control and the choice of investment financing: The case of corporate acquisitions. Journal of Finance, 45(2), 603–616.Andrade, G., Mitchell, M., & Stafford, E. (2001). New evidence and perspectives on mergers. Social science research network, 01-070.Antoniou, A., Arbour, P., & Zhao, H. (2008). How much is too much: Are merger premiums too high? European Financial Management, 14(2), 268–287.Aw, M., & Chatterjee, R. (2004). The performance of UK firms acquiring large cross-border and domestic takeover targets. Applied Financial Economics, 14(5), 337–349.Aybar, B., & Ficici, A. (2009). Cross-border acquisitions and firm value: An analysis of emerging-market multinationals. Journal of International Business Studies, 40(8),
1317–1338.Bannert, V., & Tschirky, H. (2004). Integration planning for technology intensive acquisitions. R&D Management, 34(5), 481–494.Barber, B., & Lyon, J. (1997). Detecting long-run abnormal stock returns: The empirical power and specification of test statistics. Journal of Financial Economics, 43(3),
341–372.Barreto, E. (2014). ‘Alibaba IPO ranks as worlds’s biggest after additiona shares sold’, Reuters. Retrieved from: http://www.reuters.com/article/2014/09/22/us-alibaba-
ipo-value-idUSKCN0HH0A620140922Benou, G., & Madura, J. (2005). High-tech acquisitions, firm specific characteristics and the role of investment bank advisors. The Journal of High Technology
Management Research, 16(1), 101–120.Bernard, V. L., & Thomas, J. K. (1989). Post-earnings-announcement drift: Delayed price response or risk premium? Journal of Accounting Research, 1–36.Bi, X. G., & Gregory, A. (2011). Stock market driven acquisitions versus the Q theory of takeovers: The UK evidence. Journal of Business Finance & Accounting, 38(5&6),
628–656.Booton, J. (2014). Tech mergers hotter than in the dotcom era, marketwatch, 13th November 2014. [Online] http://www.marketwatch.com/story/tech-mergers-
hotter-than-in-the-dot-com-era-2014-11-13.Bosch, J., & Hirschey, M. (1989). The valuation effects of corporate name changes. Journal of Financial Management, 18(4), 64–73.Bradley, M., & Sundaram, A. (2004). Do acquisitions drive performance or does performance drive acquisitions. Social science research network.Bradley, M., Desai, A., & Kim, E. (1988). Synergistic gains from corporate acquisitions and their division between the stockholders of target and acquiring firms. Journal
of Financial Economics, 21(1), 3–40.Bris, A., & Cabolis, C. (2008). The value of investor protection: Firm evidence from cross-border mergers. Review of Financial Studies, 21(2), 605–648.Bruner, R. (2002). Does M&A pay? A survey of evidence for the decision-maker. Journal of Applied Finance, 12(1), 48–68.Calori, Michael, L., & Phillipe, V. (1994). Control mechanism in cross-border acquisitions: An international comparison. Organization Studies, 15(3), 361–379.Cassiman, B., Colombo,M. G., Garrone, P., & Veugelers, R. (2005). The impact of M&A on the R&D process: An empirical analysis of the role of technological-andmarket-
relatedness. Research Policy, 34(2), 195–220.Chang, S. (1998). Takeovers of privately held targets, methods of payment, and bidder returns. Journal of Finance, 53(2), 773–784.Capasso, A., & Meglio, O. (2005). Knowledge transfer in mergers and acquisition: how frequent acquirers lean to manage the integration process. In A. Capasso, G. B.
Dagnino, & A. Lanza (Eds.), Strategic Capabilities and Knowledge Transfer Within and Between Organizations. Cheltenham: Edward Elgar.Cloodt, M., Hagedoorn, J., & Van Kranenburg, H. (2006). Mergers and acquisitions: Their effect on the innovative performance of companies in high-tech industries.
Research Policy, 35(5), 642–654.Conn, R. L., & Connell, F. (1990). International mergers: Returns to US and British firms. Journal of Business Finance & Accounting, 17(5), 689–711.Conn, R., Cosh, A., Guest, P., & Hughes, A. (2005). The impact on UK acquirers of domestic, cross-border, public and private acquisitions. Journal of Business Finance &
Accounting, 32(5&6), 815–870.Cooper, M., Dimitrov, O., & Rau, P. (2001). A Rose.com by any other name. Journal of Finance, 56(6), 2371–2388.Cooper, M., Khorana, A., Osobov, I., Patel, A., & Rau, P. (2005). Managerial actions in response to a market downturn: Valuation effects of name changes in the dot.com
decline. Journal of Corporate Finance, 11(1), 319–335.Cuthbertson, K., & Nitzsche, D. (2001). Investments. John Wiley & Sons, Ltd.Dalziel, M. (2008). The seller's perspective on acquisition success: Empirical evidence from the communications equipment industry. Journal of Engineering and
Technology Management, 25(3), 168–183.Danbolt, J. (2004). Target company cross-border effects in acquisitions into the UK. European Financial Management, 10(1), 83–108.Danbolt, J., &Maciver, G. (2012). Cross-border versus domestic acquisitions and the impact on shareholderwealth. Journal of Business Finance and Accounting, 39(7 & 8),
1028–1067.Daniel, K., Hirshleifer, D., & Subrahmanyam, A. (1998). Investor psychology and security market under-and overreactions. The Journal of Finance, 53(6), 1839–1885.Datta, S., Iskandar-Datta, M., & Raman, K. (2001). Executive compensation and corporate acquisition decisions. Journal of Finance, 56(1), 2299–2336.Datta, D. K., Pinches, G. E., & Narayanan, V. K. (1992). Factors influencing wealth creation from mergers and acquisitions: A meta-analysis. Strategic Management
Journal, 13(1), 67–84.Dodd, P., & Ruback, R. (1977). Tender offers and stockholder returns. Journal of Financial Economics, 5(3), 351–373.Duggan, W. (2015). Mark Cuban: Current tech bubble even worse than dotcom bubble. yahoo finance [online] http://finance.yahoo.com/news/mark-cuban-current-
tech-bubble-183702507.htmlDuggan, W. (2015). Mark Cuban; Current tech bubble even worse than dotcom bubble. Retrieved from: http://finance.yahoo.com/news/mark-cuban-current-tech-
bubble-183702507.htmlDumont, B., & Holmes, P. (1999). The breadth of intellectual property rights and their interface with competition law and policy: divergent paths to the same goal.
International Conference: Innovation, Appropriation Strategies, and Economic Policy, Paris. Financial Times, October 25, 1999.Eckbo, B. (1983). Horizontal mergers, collusion, and stockholder wealth. Journal of Financial Economics, 11(1), 241–273.Ernst and Young (2015a). Technology transformation drives record deal making in 2014, and sets stage for ‘robust’ 2015. [Online] http://www.ey.com/GL/en/
Newsroom/News-releases/news-EY-technology-transformation-drives-record-dealmaking-in-2014-sets-stage-for-robust-2015.Ernst, & Young (2015b). Technology transformation fueled record deal-making in 1Q15 driven by Internet of Things (IoT), security, smart mobility and cloud technol-
ogies. Retrieved from: http://www.ey.com/gl/en/newsroom/news-releases/news-ey-technology-transformation-fueled-record-deal-making-in-1q15Fama, E. (1970). Efficient capital markets: A review of theory and empirical work. Journal of Finance, 25(2), 383–417.Fama, F., & French, K. (1998). Market efficiency, long-term returns, and behavioral finance. Journal of Financial Economics, 49(3), 283–306.Franks, J., & Harris, R. (1989). Shareholder wealth effects of corporate takeovers: The UK experience. Journal of Financial Economics, 23(2), 225–249.Franks, J., Harris, R., & Titman, S. (1991). The post-merger share price performance of acquiring firms. Journal of Financial Economics, 29(1), 81–96.Gao, L., & Sudarsanam, P. (2005). Executive compensation, hubris, corporate governance: Impact on managerial risk taking and value creation in UK high-tech and
low-tech acquisitions. Corporate governance: Impact on managerial risk taking and value creation in UK high-tech and low-tech acquisitions. Social science research network.Ghosh, A. (2001). Does operating performance really improve following corporate acquisitions? Journal of Corporate Finance, 7(2), 151–178.Goergen, M., & Renneboog, L. (2004). Shareholder wealth effects of European domestic and cross-border takeover bids. European Financial Management, 10(1), 9–45.Hagedoorn, J., & Duysters, G. (2002). The effect of mergers and acquisitions on the technological performance of companies in a high-tech environment. Technology
Analysis & Strategic Management, 14(1), 67–85.

212 D. Lusyana, M. Sherif / Journal of High Technology Management Research 27 (2016) 196–213
Haleblian, J., Devers, C., McNamara, G., Carpenter, M., & Davison, R. (2009). Taking stock of what we know about mergers and acquisitions: A review and researchagenda. Journal of Management, 35(3) (469-50).
Halpern, P. (1983). Corporate acquisition: A theory of special case? A review of event studies applied to acquisitions. Journal of Finance, 38(2), 297–317.Hansen, R. (1987). A theory for the choice of exchange medium in mergers and acquisitions. Journal of Business, 60(1), 75–95.Hansen, R. G., & Lott, J. R. (1996). Externalities and corporate objectives in a world with diversified shareholder/consumers. Journal of Financial and Quantitative
Analysis, 31(1), 43–68.Harris, R. S., & Ravenscraft, D. (1991). The role of acquisitions in foreign direct investment: Evidence from the US stock market. Journal of Finance, 46(3), 825–844.Hitt, M. A., Harrison, J. S., & Ireland, R. D. (2001). Mergers & acquisitions: A guide to creating value for stakeholders. Oxford University Press.Hubbard, R. G., & Palia, D. (1995). Executive pay and performance evidence from the US banking industry. Journal of Financial Economics, 39(1), 105–130.Jensen, M. (1986). Agency cost of free cash flow, corporate finance, and takeovers. American Economic Review, 76(2), 323–329.Jensen, M., & Ruback, R. (1983). The market for corporate control: The scientific evidence. Journal of Financial Economics, 11(1–4), 5–50.Jovanovic, B., & Rousseau, P. (2002). The Q-theory of mergers. National Bureau of economic research. Working paper, 8740.Kennedy, V. A., & Limmack, R. J. (1996). Takeover activity, CEO turnover, and themarket for corporate control. Journal of Business Finance & Accounting, 23(2), 267–285.Klevorick, A. K., Levin, R. C., Nelson, R. R., & Winter, S. G. (1995). On the sources and significance of interindustry differences in technological opportunities. Research
Policy, 24(2), 185–205.Kohers, N., & Kohers, T. (2000). The value creation potential of high-tech mergers. Journal of Financial Analysts Journal, 56(3), 40–50.Kohers, N., & Kohers, T. (2001). Takeovers of technology firms: Expectations vs. reality. Journal of Financial Management, 30(3), 35–54.Kothari, S. P., & Warner, J. B. (1997). Measuring long-horizon security price performance. Journal of Financial Economics, 43(3), 301–339.Laamanen, T., & Keil, T. (2008). Performance of serial acquirers: Toward an acquisition program perspective. Strategic Management Journal, 29(6), 663–672.Lang, L., Stulz, R., & Walkling, R. (1989). Managerial performance, Tobin's Q, and the gains from successful tender offers24(1), 137–154.Langetieg, T. (1978). An application of a three-factor performance index to measure stakeholder gains from merger. Journal of Financial Economics, 6(4), 365–384.Limmack, R. J. (1991). Corporate mergers and shareholder wealth effects: 1977–1986. Accounting and Business Research, 21(83), 239–252.Limmack, R. (2003). Discussion of Glamour Acquirers, Method of Payment and Post‐acquisition Performance: The UK Evidence. Journal of Business Finance &
Accounting, 30(1‐2), 343–350.Loderer, C., & Martin, K. (1992). Post-acquisition performance of acquiring firms. Journal of Financial Management., 21(3), 69–79.Loughran, T., & Vinjh, A. M. (1997). Do long-term shareholders benefit from corporate acquisitions? Journal of Finance, 52(3), 1765–1790.Liu, J. (2015). ‘Technology transformation drives record deal making in 2014, and sets stage for ‘Robust’ 2015’, Ernst and Young. Retrieved from: http://www.ey.com/
ru/en/newsroom/news-releases/ey-news-technologytransformation-drives-record-dealmaking-in-2014-sets-stage-for-robust-2015Lyon, J., Barber, B., & Tsai, C. (1999). Improved methods for tests of long-run abnormal stock returns. The Journal of Finance, 54(1), 165–201.Mackinlay, A. (1997). Event studies in economics and finance. Journal of Economic Literature, 35(1), 13–29.Malatesta, P. (1983). The wealth effect of merger activity and the objective functions of merging firms. Journal of Financial Economics, 11(1–4), 155–181.Malmendier, U., & Tate, G. (2008). Who makes acquisitions? CEO overconfidence and the market's reaction. Journal of Financial Economics, 89(1), 20–43.Manne, H. (1965). Mergers and the market for corporate control. Journal of Political Economy, 73(4), 3–51.Martynova, M., & Renneboog, L. (2008). A century of corporate takeovers: What have we learned and where do we stand. Journal of Banking & Finance, 32(10),
2148–2177.Meglio, O. (2009). Measuring performance in technology-driven M&As: Insights from a literature. Advances in Mergers and Acquisitions, 8(1), 103–118.Mitchell, M., & Stafford, E. (2000). Managerial decisions and long-term stock price performance. The Journal of Business., 73(3), 287–329.Moeller, S. B., Schlingemann, F. P., & Stulz, R. M. (2005). Wealth destruction on a massive scale? A study of acquiring-firm returns in the recent merger wave.
The Journal of Finance, 60(2), 757–782.Mueller, D. C. (1969). A theory of conglomerate mergers. Quarterly Journal of Economics, 83(1), 643–660.Myers, S., & Majluf, N. (1984). Corporate financing and investment decisions when firms have information that investors do not have. Journal of Financial Economics,
13(2), 187–221.Nofsinger, J. (2005). The psychology of investing. Upper Saddle River, N.J.: Pearson/Prentice Hall.Paruchuri, S., Nerkar, A., & Hambrick, D. (2006). Acquisition integration and productivity losses in the technical core: Disruption of inventors in acquired companies.
Organization Science, 17(5), 545–562.Pearson, E., & Adyanthāya, N. (1929). The distribution of frequency constants in small samples from non-normal symmetrical and skew populations. Biometrika, 21(1/4),
259–286.Porrini, P. (2004). Alliance experience and value creation in high-tech and low-tech acquisitions. The Journal of High Technology Management Research, 15(2), 267–292.Pramuk, J. (2015). Cuban: Tech bubble worse now than 15 years ago, CNBC. Retrieved from: http://www.cnbc.com/2015/03/04/cuban-tech-bubble-worse-now-than-
15-years-ago.htmlPrathap, J., Jubilson, A., Rajkumar, D., Shibu, J., & Vinil Dani, W. (2014). Facebook - WhatsApp Merger – A Revolution in the Social Networks. International Journal of
Electrical & Computer Sciences, 14(4), 17–24.Puranam, P., & Srikanth, K. (2007). What they know vs. what they do: How acquirers leverage technology acquisitions. Strategic Management Journal, 28(8), 805–825.Ragozzino, R. (2006). Firm valuation effects of high-tech M&A: A comparison of new ventures and established firms. The Journal of High Technology Management
Research, 17(1), 85–96.Ranft, A. (2006). Knowledge preservation and transfer during post-acquisition integration. Advances in mergers and acquisitions, 5, 51–67.Ranft, A., & Lord, M. (2000). Acquiring new knowledge: The role of retaining human capital in acquisitions of high-tech firms. The Journal of High Technology
Management Research, 11(2), 295–319.Ranft, A., & Lord, M. (2002). Acquiring new technologies and capabilities: A grounded model of acquisition implementation. Organization Science, 13(4), 420–441.Rau, R., & Vermaelen, T. (1998). Glamour and the post-acquisition performance of acquiring firms. Journal of Financial Economics, 49(2), 223–253.Richter, F. (2014). ‘WhatsApp Deal Dwarfs Other High-Profile Tech Acquisitions’, Statista. Retrieved from: https://www.statista.com/chart/1927/tech-acquisitions/Ritter, J. (2003). Why has IPO underpricing changed over time. Social science research network.Roll, R. (1986). The hubris hypothesis of corporate takeovers. Journal of Business, 59(2), 197–216.Rossi, S., & Volpin, P. (2004). Cross-country determinants of mergers and acquisitions. Journal of Financial Economics, 74(2), 277–304.Rossi, M., Tarba, S., & Raviv, A. (2013). Mergers and acquisitions in the hightech industry: a literature review. International Journal of Organizational Analysis, 21(1),
66–82.Savor, P., & Lu, Q. (2009). Do stock mergers create value for acquirers? The Journal of Finance, 64(3), 1061–1097.Scharfstein, D., & Stein, J. (2002). The dark side of internal capital markets: Divisional rent-seeking and inefficient investment. The Journal of Finance, 55(6), 2537–2564.Servaes, H. (1991). Tobin's Q and the gains from takeovers. Journal of Finance, 409–419.Shefrin, H. (2007). Behavioral finance: Biases, mean–variance returns, and risk premium. CFA Institute Conference Proceedings Quarterly, 24(2), 4–12.Sherif, M. (2012). Gains and payments of mergers and acquisitions: Further evidence from the UK. Corporate Ownership and Control, 9(3), 288–302.Shiller, R. (2003). Efficient markets theory to behavioral finance. American Economic Association, 17(1), 83–104.Shleifer, A. (2000). Inefficient markets. An introduction to behavioral finance. Oxford University Press.Shleifer, A., & Vishny, R. W. (2003). Stock market driven acquisitions. Journal of Financial Economics, 70(3), 295–311.Singh, R. (2015). Are we in a tech bubble, or not? International Banker [online] http://internationalbanker.com/finance/are-we-in-a-tech-bubble-or-not/.Sirower, M. (1997). The Synergy Trap: How Companies Lose the Acquisition Game? New York: Simon & Schuster.Sudarsanam, S. (1995). The essence of mergers and acquisitions. London: Prentice Hall.Sudarsanam, S. (2003). Creating value from mergers and acquisitions. London: Prentice Hall.Sudarsanam, S., & Mahate, A. (2003). Glamour acquirers, method of payment and post-acquisition performance: The UK evidence. Journal of Business Finance and
Accounting, 30(1), 299–341.

213D. Lusyana, M. Sherif / Journal of High Technology Management Research 27 (2016) 196–213
Thaler, R. (2012). The winner's curse: Paradoxes and anomalies of economic life. Simon and Schuster.Travlos, N. (1987). Corporate takeover bids, methods of payment and bidding firms stock returns. Journal of Finance, 42(4), 943–964.Wansley, J., Lane, W., & Yang, H. (1983). Abnormal returns to acquired firms by type of acquisition and method of payment. Financial Management, 16(1), 22–451.
Further reading
Sundaram, A. K., & Inkpen, A. C. (2004). The corporate objective revisited. Organization Science, 15(3), 350–363.