do non-debt tax shields matter for debt policy?home.utah.edu/~u0519018/working paper - do non-debt...
TRANSCRIPT

Do Non-debt Tax Shields Matter for Debt Policy?
Madhuparna Kolay* James Schallheim*†
Kyle Wells**
Draft August 2011
Comments are welcome.
ABSTRACT
We provide new evidence on the relationship between non-debt tax shields (NDTS) and debt tax shields by using a novel proxy for NDTS called “tax spread” measured by the difference between tax expenses and taxes paid. We find a positive and significant relationship between Graham’s (2000) measure of under-leverage and our measure of NDTS, inferring that firms have alternatives to debt in order to reduce taxable income. Using our tax spread measure as a replacement for previous proxies of NDTS in extant capital structure models, we find that as predicted by theory, NDTS substitute for debt tax shields leading to a negative relation between the two. We also verify that our measure does indeed capture the effects of NDTS by comparing the tax spreads of firms involved in tax shelter cases to a matched sample. Overall, we contribute by devising an easy-to-measure proxy for NDTS which provides more robust evidence about its role in capital structure compared to extant empirical research in this area.
“You can’t underestimate how many of America’s greatest minds are being devoted to what economists would all say is totally useless economic activity.” - Peter Cobb, former Deputy Chief of Staff of the Joint Committee on Taxation _________________________________________________ * David Eccles School of Business, University of Utah, Salt Lake City, UT 84112-9303 ** Udvar-Hazy School of Business, Dixie State College of Utah, 225 South 700 East, St. George, UT 84770 † Contact Author. Email addresses for the authors are [email protected], [email protected] and [email protected]. A previous version of this paper was circulated under the name Debt and Taxes: A New Measure of Tax Shields. We are responsible for all remaining errors.
2
I. Introduction
The impact of taxes on the financing choice of the firm has been extensively researched
in the corporate finance literature. Modigliani and Miller (1958) suggested the irrelevance of
capital structure in perfect markets but in their 1963 study included interest tax deductions to
show that debt in the capital structure could yield large gains in the form of the tax shields. De
Angelo and Masulis (1980) further proposed that firms may have deductibles other than debt to
reduce their corporate tax burden and therefore, debt and non-debt tax shields could as
substitutes. Examples of such non-debt tax shields include depreciation, investment tax credits,
or loss carry forwards. Bradley, Jarrell and Kim (1984) were among the first to test for the tax
effects suggested by DeAngelo and Masulis (1980). By regressing firm-specific debt-to-value
ratios on non-debt tax shields they found that debt is positively related to non-debt tax shields,
in contrast to the prediction in De Angelo and Masulis (1980). Bradley et al. (1984) use
depreciation and investment tax credits, research and development, and advertising expenses as
their proxies for non-debt tax shield. As Graham (2003) points out, if a firm invests heavily
and borrows to invest, a positive relation between such proxies for non-debt tax shield and debt
may result. A mechanical positive relationship of this type overwhelms and renders
unobservable any substitution effects between debt and non-debt tax shields (NDTS).
In this study, we present a new proxy for measuring the quantity of a firm’s NDTS. We
use the difference between the provision for taxes on the firm’s income statement and taxes
actually paid as revealed in the footnotes to the accounting statements as a proxy for NDTS.
Since this directly measures the difference between the accounting tax and the income tax, it
has the benefit of being a relative more comprehensive measure of NDTS since it can
potentially capture the effects of deductions such as accelerated depreciation, stock option

3
deductions, tax-shelters and so on. By capturing the effect of a wider variety of NDTS at the
same time, the probability that this measure is correlated with the firm’s investment is greatly
reduced compared to measures such as depreciation. Other papers such as MacKie-Mason
(1990) model incremental financial decisions and use tax loss carryforwards and investment
tax credits as proxies for NDTS. Graham, Lang and Shackelford (2004) investigate whether
corporate stock options are a form of NDTS and find that firms which have large deductions
from options are indeed underleveraged. More recently, Shivdasani and Stefanescue (2010)
show that pension assets and liabilities also act as tax shields and pension contributions are
about a third of those from interest payments. In fact, in their sample leverage ratios for firms
with pension plans are about 35% higher when pension assets and liabilities are incorporated
into the capital structure. While these papers study one or few types of tax shields, we
contribute by proposing a more general measure for NDTS. As mentioned above, there are a
whole host of tax shields, some of these unobservable, and we contend that our proxy is a
simple but effective means to capture an overall effect of NDTS. Graham and Tucker (2006)
employ a novel identification strategy: they find that in their sample consisting of 76 firms, 38
which use tax shelters have debt ratios significantly lower than their matched peer firms. Thus,
they find direct evidence that firms which have NDTS in the form of tax shelters use lower
debt. While our study does not rely on observed NDTS such as that used in Graham and
Tucker (2006), our proxy has the advantage of using data that is commonly observed and being
applicable to a large sample of firms.
While we do not attempt to explicitly identify sheltering firms as Graham and Tucker
(2006) do, we use their strategy to verify our measure of NDTS. Thus, in our first set of
empirical tests, we attempt to answer the following question: do the firms with the tax shelters

4
identified in the Graham and Tucker (2006) study exhibit greater tax spreads when these tax
shelters were in operation? If our measure of NDTS does indeed pick up the type of opaque
tax shields exemplified by tax shelters then we would expect to significantly higher tax spreads
during these periods. We replicate Graham and Tucker’s methodology and compare our
measures of spread for sheltering firms to a matched sample of firms which were not known to
have tax shelters during the same time period. Doing so, we find that we are able to directly
verify the validity of our measure of NDTS.
Our second set of analyses examine the effectiveness of the tax spread variable as a
proxy for NDTS in the empirical studies that examine corporate capital structure . Using firm-
year data from 1988-2008, we re-estimate three cross-sectional regression analyses of three
different types of capital structure models that have been used in the literature in the past.1
Graham (1996a) calculates the marginal corporate tax rate using an algorithm based on
reported income that incorporates the nuances of the U.S. tax code. Thus he is able to
circumvent the problem with early capital structure studies that used the average tax rate and
not the marginal tax rate as suggested by theory. The marginal tax rate is defined as the
present value of current and expected future taxes paid on an additional dollar of income
earned today. Using a version of this measure, the before-financing marginal tax rate, Graham,
As
mentioned earlier, Bradley, Jarrell and Kim (1984)’s study was among the first to use NDTS as
an explanatory variable to test for the existence of an optimal capital structure and they found a
positive sign on their measure of NDTS. We substitute tax spread as a proxy for NDTS into
their empirical test and find a significant and negative relation, indicating that NDTS does act
as a substitute for debt.
1 COMPUSTAT reports “taxes paid” (TXPD) for some firms beginning in 1987 with nearly all firms reporting by the following year, therefore our data is technically limited to firm-year observations after 1987.

5
Lemmon and Schallheim (1998) find strong evidence that high marginal tax rate firms do have
higher debt levels. We add our tax spread to the regression model of Graham, Lemmon and
Schallheim (1998) and find the tax spread is negatively and significantly related to debt in the
presence of a host of capital structure control variables. In our last test in this section, we use
our measure of NDTS in a relatively recent model of capital structure, Frank and Goyal (2004).
Analogous to our findings using the Bradley, Jarrell and Kim (1984) and the Graham, Lemmon
and Schallheim (1998) models, our results with the Frank and Goyal (2004) model also shows
that our measure of NDTS is strongly negatively correlated with the usage of debt in the capital
structure. Overall, we employ our measure in a range of ways to demonstrate that our measure
captures the effects of a wide variety of NDTS well enough to be strongly negatively correlated
with debt irrespective of what model is used.
In our next set of empirical tests, we attempt to find determinants of the tax spread
based on observed accounting variables that may proxy for transparent and opaque tax shields.
Manzon and Plesko (2002) examine the differences between book and taxable income and find
that a relatively small set of variables explain a large percentage of the cross-sectional variation
in the book-tax income spread across firms. Using the Manzon and Plesko (2002) set of
variables, we use regressions to empirically examine the determinants of tax spread. This
serves dual purpose; first, we are able to identify the drivers behind our measure of NDTS.
Manzon and Plesko (2002) identify four types of activities that are likely to affect book-tax
income spread: 1) demand controls for tax favored investment and financing action, 2) direct
sources of investment related timing differences, 3) permanent differences and 4) noise factors.
We find mixed results from our attempts to cross-check whether the explanatory variables the
tax spread measures match those found in Manzon and Plesko (2002).

6
Our second purpose is to test the tax spread as an explanatory variable for the
underleverage measure developed by Graham (2000). In this study, Graham simulates interest-
deduction benefit functions for individual firms and uses them to estimate the tax-reducing
value of each incremental dollar of interest expense. Graham integrates over possible states of
the world (taxable and nontaxable) to determine the expected tax benefit of an incremental
dollar of interest deduction. After accounting for reductions for personal taxes, he finds that the
tax benefit of debt under the marginal benefit curve is between seven to eight percent of firm
value. Graham also quantifies how aggressively firms use debt. He calls this estimate the
“kink” because it is the point at which the next dollar paid in interest changes from a flat to
decreasing marginal tax benefit. We use our predicted tax spreads as an instrumental variable
to explain kink and find a significant positive relation between the tax spread and the kink.
This suggests that firms may not be acting sub-optimally with respect to the debt tax shield.
Through permanent deferrals, accounting discretion, and opaque tax shelters, firms that appear
under-levered may be simply overstating book income relative to taxable income.
This paper is organized as follows. Section II introduces the tax spread measure and
describes our dataset and summary statistics. Section II contains the test of the tax shelter
sample. Section III shows the results regarding the determinants of tax spread. In Section IV
we use tax spread as a proxy for NDTS in cross-sectional capital structure regressions to see if
it works better than previous proxy variables. Section V presents the results of the relation
between kink and the tax spread. Section VI concludes.
II. Tax Spread as a measure of NDTS
Why do firms prefer alternative tax shields to debt? First, many tax shields are less
costly than debt. Debt usually requires costly interest payments. Many tax shields do not
7
require any additional outlays for the firm. Other tax shields have a much larger return per
dollar invested (subject to the risk of disqualification by the IRS). Another reason for the
preference of NDTS is the cost to the firm associated with debt covenants. Debt covenants are
likely to cause high transaction costs for some firms. Finally, tax shields often exploit
provisions in the accounting rules that allow the firm to reduce taxes without affecting the
income statement. If accounting earnings matter, and there is a large literature claiming
support for this notion, then these tax shields may be favored over debt tax shields. 2
In his calculation of the marginal tax rate using the simulated interest-deduction benefit
functions for individual firms, Graham (2000) accounts for tax favored investing activities in
his calculation. However, firms have significant incentives to permanently defer or avoid taxes,
usually without transparency. Bankman (1999) provides anecdotal evidence on several known
tax sheltering schemes that have been or could be used to reduce taxable income while not
affecting book income.
Our
measure of unobserved NDTS called the “Tax Spread” is measured as the difference between
provision for taxes on the firm’s income statement and taxes actually paid as revealed in the
footnotes to the accounting statements.
3
2 See evidence by Beneish (1999), Dechow, Sloan and Sweeney (1995) and Kasznik (1999)
Plesko (2003) suggests that the relation between financial and tax
reporting may be very weak. For example, GAAP requires foreign subsidiaries to consolidate
under the parent company. These earnings are not recognized as taxable income until the
income is transferred to the parent company. Companies may permanently defer income tax
through reinvestment abroad. Some evidence of this is found in the tax footnotes of
Microsoft’s 2002 annual report;
3 As mentioned, Graham and Tucker (2006) show direct evidence that tax shelters indeed reduce taxable income and result in lower debt ratios than comparable firms with similar size and industry.

8
Microsoft has not provided for U.S. deferred income taxes or foreign withholding taxes on $780 million of its undistributed earnings for certain non-U.S. subsidiaries, all of which relate to fiscal 2002 earnings, since these earnings are intended to be reinvested indefinitely.
While a complete list of specific tax shields and deferrals is not available, factors that are likely
to affect spread are categorized generally as: 1) tax favored investing activities (e.g. investment
tax credits), 2) timing differences, such as depreciation schedules and retirement benefit
expensing, and 3) permanent differences such as accounting for items of income or loss that
bypass the income statement (e.g. exercised employee stock options, change in other
comprehensive income, discontinued operations, extraordinary items, and the cumulative effect
of change in accounting policies). One of the major difficulties of measuring NDTS is that
most measures capture a certain type of NDTS e.g. effects of stock options or depreciation tax
shields. By covering a wider variety of tax shields, our measure of NDTS is a more
comprehensive measure than the proxies for NDTS used in the extant literature.
In addition, an element of judgment is required in financial reporting that may be
applied differently across firms. Accounting rules place emphasis on consistency within a firm
over time and less weight on uniformity across firms. Such differences in discretion could
confound the relation between tax and financial data series.
A. Measuring the Tax Spread
Our measure of the tax spread attempts to capture tax shields or shelters that often have
been overlooked in the capital structure literature. We measure this spread two ways. The first
is the difference between provision for taxes on the firm’s income statement and taxes actually
paid as revealed in the footnotes to the accounting statements. We call this measure the Total
Tax Spread.

9
(1) Total Tax Spread = Total Tax Expense – Taxes Paid
For many firms, a portion of this value reported as “provisions for taxes” is attributed to
deferred taxes which arise due to timing differences. Compustat defines deferred taxes as net
income tax deferrals due to timing differences between the reporting of revenues and expenses
for financial statements and tax forms. The timing effects of well-known tax shields such as
depreciation are captured in deferred taxes. Another well known tax shield is the investment
tax credit (ITC). To remove these well known timing effects, we define a second tax spread
variable based on the value of the current tax expense.
(2) Current Tax Expense = Total Tax Expense – (Deferred Taxes + ITC)
The difference between the current tax expense and the taxes actually paid we call the Current
Tax Spread.
(3) Current Tax Spread = Current Tax Expense – Taxes Paid
The purpose of our current tax spread measure is to remove timing effects from the tax
spread. In a “static world,” timing effects would tend to reverse the tax spread so that positive
tax spreads would be followed by negative spreads, resulting in an average zero tax spread
over time. Our contention is that the tax spread will not “zero out” on average due to the
opaque tax shields, many of which do not necessarily reverse over time. However, the tax
spread will be zero or negative in many cases.
We begin with Compustat firms with book value of assets over 1 million over the
periods 1987 to 2008. We eliminate regulated firms (SICs 4900-4999) and financial firms
(SICs 6000-6999). We are limited to these firm-year observations due to the lack of cash flow
summary data available prior to 1987. The variables from equations (1) - (3), total tax

10
expense, deferred tax, investment tax credit, and tax paid are reported by Compustat as TXT,
TXDI, ITCI, and TXPD respectively. After calculating tax spreads, we eliminate outliers by
removing all firm-year Total Tax Spread observations outside of ±30 percent of book value of
assets. These observations may be due to data mistakes or severely distressed firms. This
eliminates less than 1 percent of our sample set. In addition, for our tests of capital structures,
we focus on results for only those firm-years which have non-negative tax spreads. Firm years
during which the provision for taxes is lower than taxes paid would imply that the firm has
zero or negative taxable income. Therefore, it is unlikely that the spread measures NDTS in
those firm-years. Desai and Dharmapala (2006) also point out that in this situation, the
incentives of the firm to engage in tax sheltering is attenuated.
Other recent literature which links the size of the book-tax income gap and the presence
of a tax shelter include Desai (2003) and Wilson (2009). Desai (2003) adjusts the book income
and tax income gap for differential treatment of depreciation, foreign source income, and
employee compensation and concludes that the growing difference in the years 1996-2000 is
due to increasing levels of tax sheltering. Wilson (2009) uses a small sample of tax shelters
(including those used in Graham and Tucker (2006)) and finds that the probability of a firm
engaging in tax sheltering activity is related to the book-tax gap.
The sources of our measure if NDTS, tax spread, involves three areas: tax favored
investing activities, timing differences, and permanent differences. Differences between
financial and tax income revenue and expense recognition policy give rise to timing
differences. These timing differences create deferred tax account balances. For example,
postretirement benefits expense funds often create tax-deferred assets while accelerated
depreciation of new assets will likely increase tax-deferred liabilities. These deferred taxes are

11
the net balance of tax-deferred assets and tax-deferred liabilities reported on the income
statement. Tax deferrals reverse over time and current tax expense will increase netting out the
deferral. The firm benefits from deferred liabilities by the present value of the deferral.
Permanent deferrals arise when revenue or expense is recognized under one system but
not the other. Items such as interest paid on municipal bonds and dividends received from
other corporations are generally excluded from taxable income but are included for financial
reporting purposes. Unlike deferred taxes, these permanent differences do not reverse.
Permanent differences also arise when items of income or loss by-pass the income
statement during the year that goes directly to comprehensive income. Some examples of this
are employee stock options that are exercised, the taxes on discontinued operations,
extraordinary items, and cumulative effect of changes in accounting policy. When book
income is greater (less) than tax income, a net tax induced gain (loss) occurs. Given the
difference between financial and tax reporting incentives, well-designed shields are continually
being created with the purpose to reduce taxable income often without affecting reported
financial income.
Compustat defines taxes paid as cash payments for income taxes to federal, state, local,
and foreign governments during the fiscal period. This variable by nature has a timing aspect
that does not directly match that of tax expense reported on the income statement. For
instance, fourth quarter taxes are not commonly paid until the following year and in rare cases -
due to audits and/or disputes - tax expenses in one fiscal term may not be paid until several
periods following. Pre-payment may also occur in rare occasions when firms anticipate future
taxes or hold a tax credit. There is no way to match dollar to dollar the tax bill to the tax

12
payment. In most cases, taxes are paid continuously with some lag; on average, these lags do
not change significantly over time.
B. Time Series of Tax Spread
Over our sample period from 1988 to 2008, there has been a general increase in the tax
spreads. Figure 1 shows a growing trend for both Total and Current Tax Spread with
significant growth in the 1990’s, a pronounced fall subsequent to the “dot-com” fall in 2001,
and a return to highly positive tax spreads until the financial crisis that began in 2008.
Figure 1 – Tax Spread
Trends in Mean Yearly Tax Spreads
-10.0
-5.0
0.0
5.0
10.0
15.0
20.0
1988
1990
1992
1994
1996
1998
2000
2002
2004
2006
2008
Year
Mea
n Ye
arly
Tax
Spr
ead
Current Tax Spread Total Tax Spread
The tax spread measure the discrepancy between tax provision (tax expense) as
reported on the income statement and taxes paid as reported in the footnote disclosures to the
cash flow statement. Ideally, access to income tax information reported in schedule M-1 of

13
form 1120 for publicly traded corporations would provide the most accurate detail for
comparison of book and tax income. A special report prepared for the IRS does show M-1
information for aggregate data for the period 1991-1997. Figure 2a shows the total tax
expense, current tax expense, and taxes paid for the same 1991-97 period. Figure 2b shows the
aggregate book and taxable income reported by a select group of firms from 1991 to 1997
reported by the U.S. Department of the Treasury (1999). Both exhibits show a very similar
trend.
Figure 2a -- Time Series of Tax Spread as Reported in Financial Statements.

14
Figure 2b – Book and Tax Corporate Income4
Figures 2a and 2b demonstrate that the tax spread has been growing over the 1991-1997
period with the book-tax income spread appearing to lead the tax spread. The figures also
demonstrate that there are times when the average corporate taxes paid actually exceed the
book income tax expense. The latter appears to happen in economic downturn (as in the early
1990s) in addition to the increased use of tax shields such as the change in goodwill
amortization rules or the increased exercise of employee stock options. In our analysis, we
examine the sample using both the entire range of the tax spread as well as just the non-
negative observations of the tax spread.
As mentioned, the tax spread takes on both positive and negative values. The aggregate
time series pattern of the positive and negative values of the total and current spreads are
shown in Figure 3.
4 Book Income = After-tax book income from Schedule M-1 + Federal taxes – tax exempt interest Tax Income = Total Receipts – Total Deductions Corporations with mean assets over $1 Billion, excluding S-Corp, Rics, Reits and Foreign Corporations. Source: Internal Revenue Service

15
Figure 3 – Positive/Negative Tax Spreads
Trends in Mean Yearly Tax Spreads
-40
-30
-20
-10
0
10
20
30
40
50
1988
1990
1992
1994
1996
1998
2000
2002
2004
2006
2008
Year
Mea
n Ye
arly
Tax
Spr
eads
Negative Current Tax Spread Negative Total Tax SpreadPositive Total Tax Spread Positive Current Tax Spread
This figure indicates a positive trend in all the tax spreads through most of the 1990s. After
2000, there is much more pronounced tax spreads in both the positive and negative categories.
Table 1 reports a statistical summary for both Total Tax Spread and Current Tax Spread
by year from 1988 to 2008. The totals from this table are limited to public firms with no
missing variables or extreme values as discussed above. Over our sample period, the total
difference between tax expense and tax paid is over 287 billion dollars. The Current Tax
Spread totals over 187 billion over the same 21-year period.
Table 2 reports individual firms with the largest cumulative Total Tax Spread. The
table is sorted by cumulative Total Tax Spread and therefore biased toward larger firms. If tax
spread was only a factor of deferral tax payments, over time the tax spread for each firm would

16
approach zero in the limit. While some firms did have alternating positive and negative
spreads, the firms reported in this table either produced a positive or a negative tax spread
consistently over our sample interval. Also, the individual firms do not appear to display any
clustering by industry type. The firm reporting the largest positive spread, General Electric, is
not surprising in that GE has been historically aggressive in its use of tax shields.5
III. Tax Shelters and Tax Spread
In this section, we examine the following question: does the tax spread detect known
tax shelter activities by firms accused by the government of sheltering activity? A sample of
48 tax sheltering firms: 43 of these are from the Graham and Tucker ((2006) study and 5 more
are from Wilson (2009). Following, Graham and Tucker (2006), we use a set of match-paired
firms to compare the tax spread differences between the tax shelter firms and the matched
sample. A few of the firms appear more than once if they have two different tax shelters
operating for different periods of time. Our sample is reduced when missing data does not
allow the computation of our variable of interest: the tax spread. The matched sample is
created using firms from the same industry (2 digit SIC code) that have book assets within +/-
25 percent and profitability within +/- 50 percent of the tax shelter firm’s ratios in the same
year. Another four firms are lost due to unavailable matched firms. In the end, our sample of
tax-shelter firms and matching firms consists of 24 unique tax shelters and 63 firm-year
observations.
As expected, the Total Tax Spread and the Current Tax Spread are much larger for the
tax shelter firms than for the matched sample. Table 3, Panel A reports results for the 63 firm-
year observations. The Total Tax Spread and the Current Tax Spread is significantly larger for
5 As one example of GE’s tax policy, see Stickney, Weil, and Wolfson (1983).

17
the tax-shelter firms versus the matching sample. The Total Tax Spread is approximately 2.5
times larger than the spread for the matched sample and the Current Tax Spread for the tax
shelter firms is about 3.6 times larger than the matching group.
Panel B of Table 3 examines the averages over the years of the identified tax shield of
each firm, again, compared to the matching sample. For these observations, the total and
Current Tax Spreads are significantly larger than the matched firms although the magnitude of
the difference is a bit smaller.6
IV. Determinants of the Tax Spread
The Total Tax Spread for the tax shelter firms is 1.7 times
larger than the matched firms and the Current Tax Spread for the tax shelter firms is 2.7 times
larger. These results are consistent with the notion that the tax spread does indeed pick up non-
debt tax shields when they are otherwise unobservable.
Manzon and Plesko (MP) examine the differences between book and taxable income.
They identify four types of activities that are likely to affect book-tax income spread: 1)
demand controls for tax favored investment and financing action, 2) direct sources of
investment related timing differences, 3) permanent differences and 4) noise factors. MP find
that a relatively small set of variables explain a large percentage of the cross-sectional variation
in the book-tax income spread across firms. We use the MP set of variables as determinants of
tax spread, as well as adding variables to capture accounting changes and lease obligations.7 A
description of each variable (and Compustat Data Item) are summarized in the Appendix.8
6 The significance level using the non-parametric sign-rank test has a p-value of 11 percent for the current spread differential, but the sample size is much smaller in Panel B of Table 9.
7 In addition to the Manzon and Plesko variables, we have added the variables: Accounting Change, Operating Lease Expense, Capital Lease Obligation. Descriptions of each and how they are measured are reported in the appendix. 8 For greater detail pertaining to these variables, see Manzon and Plesko (2001).

18
Table 4 reports regression results for the Total Tax Spread, Current Tax Spread, and
non-negative tax spreads for both. Panel A reports the regressions of the Total Tax Spread
with Column (1) showing all firms, Column (2) reported the sample with both non-negative
total and current tax spreads, and Column (3) displaying the equation for just the sample with
non-negative total spreads. Panel B repeats the same regressions but with the Current Tax
Spread as the dependent variable.9
The reported adjusted R2 and F-Statistic indicate that the model explains a significant
portion of the variation in the Total and Current Tax Spread for all firms (adjusted R2 of .34
and .28). When only the non-negative observations are included, even more variation is
explained with adjusted R2 in the .60 to .70 range.
10
The profitability variable, Pretax Income, is positive and highly significant in all of the
regression models. This is consistent with firms’ increasing demand for tax-favored
investments and financing actions, especially those that reduce taxable income but may not
affect book income. The presence of NOLs (I(Positive NOL Carryforward)) indicate that the
firm is unable to make use of additional tax deductions and credits. The NOL variable is
positive and significantly correlated with Total Tax Spread for all firms but is insignificant in
predicting Current Tax Spread. It appears that NOLs have more of a timing effect rather than a
permanent impact on tax spread.
Change in Sales appears positive and significant in predicting Current Tax Spread but
is not generally a significant predictor of Total Tax Spread. In relation to Current Tax Spread,
9 Our sample size could be reduced dramatically due to missing observations in some of the MP variables. The variable Change in Postretirement Benefits is especially limiting, for example. In this case, we replace observations omitting postretirement benefit obligation (PRBA) with zero values. 10 These results suggest that our combined variables are adequate instruments for the tax spread variables.

19
growth firms may have more discretion in accounting procedures in comparison to a firm with
stable revenue. Growth firms may be able to create a book-income tax spread through accrual
methods used on financial accounting statements but reduce taxable income by using cash
based methods. Gross PP&E and Net to Gross PP&E, represent timing differences. Gross
PP&E is negative and significantly related to Total and Current Tax Spread. Firms with more
PP&E assets are likely to have more discretion when accounting for the depreciation and the
book value of assets. They also have more discretion in the use of one method for book value
(such as straight-line depreciation) and different methods for tax accounting (such as
accelerated depreciation). Curiously, we find that these differences appear to have both a
timing effect and perhaps a more permanent effect on the tax spread given both the total and
current spreads are significant. The positive sign of the ratio of Net to Gross PP&E indicates
that “newer” assets create more temporary deferrals as captured in the Total Tax Spread.
While not significant, the positive relationship with Current Tax Spread may indicate that
younger firms on the “positive” side of their depreciation schedules are better able also to
create a Current Tax Spread.
The coefficients on Pre-1993 Goodwill is negative but not always significant in relation
to Total and Current Tax Spread. MP predicted that Goodwill amortization prior to 1993
reduced income for financial reporting purposes but was not deductible for tax purposes. The
coefficient for the Change in Goodwill after 1993 is only significant for all firms in the Current
Tax Spread regression.
The coefficient on Change in Postretirement Benefits is only significant for Total Tax
Spread for all firms (Panel A, column 1). This is consistent with the MP prediction that year to
year, firms that increase their post-employment obligation by an amount greater than the

20
reduction in post-employment obligation will report a negative tax spread. Shivadasani and
Stefanescu (2010) finds that the tax benefits of debt are 47 percent larger when pension debt is
included.
The Foreign Pretax Income11
While operating leases should be treated the same for tax and financial reporting,
capital leases tend to be treated differently for each.
is positive and significant related to both Total and
Current Tax Spread in all the samples, which is consistent with firms not expatriating income
from lower-taxed foreign countries to U.S. operations.
12
11 Foreign Tax Expense and Foreign Tax Paid are included in the Tax Expense and Tax Paid, respectively. We can not separate foreign tax paid from tax paid therefore differentiating the portion of the tax spread attributed to the foreign taxes isn’t possible using COMPUSTAT data. We attempt to circumvent this problem by eliminating all firms from our sample paying foreign taxes but find a sample bias is doing so.
Capital leases result in depreciation and
interest expenses. Depreciation usually results in timing differences as previously discussed.
Interest expense for capital leases may result in a book-tax difference because the interest rate
on capital leases is an imputed figure. Varying assumptions could easily lead to different
interest expense. Leasing also has been employed in some tax shielding transactions (for
example, the so-called lease-stripping transactions and the SILO, Sales-In, Lease-Out,
transactions used for leasing to municipalities). It is unclear how these transactions are
reported in financial statements, but it is likely that they could lead to deviations between tax
and accounting reporting. Curiously, the operating leases are positively (but insignificant) in
the Total Tax Spread regressions, but negative and marginally significant for the Current Tax
Spread regressions. The capital lease variable shows up with a negative coefficient in all the
regressions with significance for the non-negative samples for the Current Tax Spread.
12 There are the exceptions such as the synthetic lease that is treated as debt for tax purposes but treated as an operating lease for financial disclosure.

21
The Lag of Tax Spread indicates the persistence of the tax spread relative to the past
year. It is positive and significant in relation to both Total and Current Tax Spread indicating
that timing related differences are persistent.
In summary, the accounting variables suggested by MP for explaining the variance in
the book-tax income spread, also help to explain the tax spread variance. Although the signs of
the coefficients are not always as predicted by MP, the variables generally support the notion
that demand controls, timing differences, and noise factors explain the tax shield motivations
of corporations. The variables that we add in addition to MP – operating leases, capital leases,
and accounting change – also support the NDTS activities by corporations leading to greater
tax spread.
V. Capital Structure Empirical Models and the Tax Spread
Empirical tests of capital structure theories have been ongoing for decades. One of the
puzzles resulting from early capital structure tests was the inability to demonstrate reliable and
consistent tax results. This led Myers (1984) to issue a challenge to the profession to find a
significant relation between taxes and debt policy as well as Myers and Majluf (1984) to
suggest that taxes may be a second-order effect in the determination of debt policy. In this
section we use the tax spread as a proxy for NDTS in capital structure cross-sectional
regressions. We add this variable to three extant models: Bradley, Jarrell and Kim (1984),
Graham, Lemmon and Schallheim (1998), and Frank and Goyal (2004) representing the last 20
years of empirical work in this area.

22
Figure 4a – Debt versus Total Tax Spreads
Total Debt to Market Value by deciles of Total Tax Spreads
0.10
0.12
0.14
0.16
0.18
0.20
0.22
0.24
0.26
0.28
0.30
1 2 3 4 5 6 7 8 9 10
Deciles sorted by size of Total Tax Spread
Mea
n La
gged
Tot
al D
ebt/M
arke
t Val
ue fo
r ea
ch d
ecile
Firms with positive spread 1988-2008 All firms 1988-2008
Figure 4b – Debt versus Current Tax Spreads
Total Debt to Market Value by deciles of Current Tax Spreads
0.10
0.12
0.14
0.16
0.18
0.20
0.22
0.24
0.26
0.28
0.30
1 2 3 4 5 6 7 8 9 10
Deciles sorted by size of Current Tax Spread
Mea
n La
gged
Tot
al D
ebt/M
arke
t Val
ue fo
r ea
ch d
ecile
Firms with positive spread 1988-2008 All firms 1988-2008
Figure 4a and 4b presents preliminary evidence that tax spreads are negatively related
to the capital structure. For figure 4a, we sort our data into deciles based on the value of total
tax spread. Decile one represents the firms with the lowest total tax spread whereas decile ten

23
includes those with the highest total tax spread. The y-axis in the figure is the mean value of
the leverage for each decile. 13
Bradley, Jarrell and Kim (1984) (BJK) develop a model that incorporates tax effects
and expected costs of financial distress. BJK develop a model of optimal capital structure and
conclude that there are three testable implications for the trade-off theory. Debt policy should
be related to (1) the costs of financial distress, (2) non-debt tax shields (NDTS), and (3) the
volatility of earnings. They hypothesize that due to financial distress costs – both bankruptcy
and agency costs of debt – firms with higher volatility of earnings will use debt more
conservatively. They empirically measure volatility directly by the standard deviation of the
first difference in annual earnings.
For 4b, we repeat the same process using current tax spreads
instead of the total tax spread. As can be seen from the plot using all positive spreads, apart
from decile two, there is an almost monotonic relationship between the tax spread and the debt
level. The linear relationship is much more evident when positive spreads are used. As
discussed earlier, firms which have zero or negative earnings are relatively less likely to
engage in sheltering which may make the relationship between spreads and debt level less
evident for such firms.
BJK measure NDTS as the sum of depreciation charges and investment tax credits
(ITC). BJK also include a measure of the sum of R&D and advertising expenses. They argue
that these expenses may be related to tax affects, decreasing the need for debt. Alternatively,
BJK point out that Myers (1977) argues that these two activities create assets that may be
viewed as creating growth options that increase the agency costs of debt. Thus their model
predicts that both will vary inversely with the level of debt.
13 Debt to Market value in this is as defined in Frank and Goyal (2004).

24
They compare their empirical measures to the 20-year average of debt to value to
minimize the effects of transient variations through time due to business cycles or lagged
adjustments by firms towards their “target” leverage ratios. Empirically, debt levels are not
random nor are they consistently high but are clustered among industries (Schwartz and
Aronson (1967), Scott (1972)). They find that the volatility of firm earnings is an important
and inverse determinant of firm leverage. The level of R&D and advertising expenditures is
also related inversely to leverage. Contrary to the prediction of their model, they find a
statistically significant, positive relation between firm leverage and the relative amount of
NDTS.
We retest their results substituting tax spread for their measure of NDTS. Rather than a
single year cross-section, we control for year with dummy variables and include observations
from 1988 to 2008. This increases the sample size from 851 firms to 31,117 firm-year
observations14
All four predictors are significant for both inter- and intra-industry variations in firm
leverage ratios. Firm volatility and Advertising and R&D are inversely related to firm leverage
as predicted. The NDTS proxy, as calculated by BJK, is positively related to firm leverage as
they found in their 1982 cross-sectional empirical test and contrary to their model predictions:
however, we fail to find statistical significance for our sample. When we substitute tax spread
. We are not able to directly compare their results to ours due to data availability
constraints, but we do find similar results despite the time variance. Table 5 reports the results
of OLS regressions of firm leverage ratios on their hypothesized determinants with Panel A
reporting all observations and Panel B reporting results for the firm years with non-negative
tax spreads.
14 In recreating the BJK results, we estimated that the firms without at least a 17 year reporting period prior to the first firm-year observation are eliminated. Our data is further limited by tax spread missing observations.

25
for NDTS, we find an inverse relationship as predicted for both Total and Current Tax Spread
in the non-negative sample, Panel B. For all observations reported in Panel A, all the tax
spreads except the Total Tax Spread without industry dummy variables are significant with the
predicted negative sign. As an explanation to their “puzzling” results, BJK state:
A fundamental problem with the cross-sectional regressions is misspecification, which suggests a “missing variable” explanation for the perverse result on non-debt tax shields. The danger is that excluded variables are correlated with included variables, which can cause misleading inferences to be drawn from the regression results.
Our proxy for NDTS (tax spread) circumvents the misspecification problem by aggregating all
NDTS (both transparent and opaque). As the trade-off theory predicts, the debt ratio is
inversely related to the level of NDTS in aggregate.
MacKie-Mason (1990) showed significant tax effects when they regressed changes in
debt and equity financing (i.e., incremental changes) on the lagged tax variables. Graham
(1996a) computes a forward-looking marginal tax rate using the tax code, a series of forecasted
earnings, and the resulting simulated tax rates. Graham, Lemmon and Schallheim (1998)
(GLS) use a before-financing version of the simulated MTR to demonstrate a positive relation
between taxes and the level of debt. GLS also includes a large set of control variables for
financial distress costs and contracting costs. They also control for industry and year effects.
In Table 6, we replicate the GLS results and then add the total or current tax spread
variable. Panel A shows all observations and Panel B reports only the non-negative tax
spreads. Again, we find evidence of a statistically significant inverse relation between debt
ratios and Total and Current Tax Spread as proxies for the NDTS when using the non-negative
tax spread variables. Only the Current Tax Spread using all observations did not result in a
statistically significant coefficient (but still negative).
26
Frank and Goyal (2004) (FG) performed tests of debt ratios of U.S. firms in an attempt
to determine the relative importance of 39 factors in the leverage decision. FG suggest their
evidence is consistent with the trade-off theory, but do not find support for the pecking order or
market timing theories. They find 6 factors to be the most reliable: median industry leverage
(+), market-to-book ratio (-), collateral (+), profitability (-), dividend-paying firm (-), and log
of assets (+)15
We add tax spread to the FG analysis. Table 7 reports the results of the regressions
with Panel A again showing all observations while Panel B reports only the non-negative
results. The result for the tax spreads are qualitatively similar to the results reported for GLS.
The Total and Current Tax Spread variables are negatively significant with the exception of the
Current Tax Spread for all observations. However, the incremental contribution of the tax
spread to the R2 is small.
. FG also suggest that tax factors, such as net operating loss carry forwards are
not robust in their analysis.
In equilibrium, capital structure decisions are made in conjunction with tax shielding
decisions. In these tests of the three capital structure specifications, we employ the two-stage
least-squares regression approach to account for simultaneous determination of the tax and
capital structure policies by firms’ managers. Specifically, we use predicted tax spreads
resulting from the regressions from the next section as our independent variable instead of the
raw tax spread measures. The results (not tabulated) are qualitatively similar to those reported
in Tables 5-7 with highly significant coefficient estimates on the predicted tax spreads used
instead of the measured tax spread. In sum, the tax spread appears as a reliable and robust
estimate of NDTS in capital structure regressions.
15 FG also include expected inflation, a factor we did not include.

27
VI. Kink and the Tax Spread
Tax spread is our variable of interest and our proxy for the unobserved tax shields that
reduce firms’ incentives to use debt. We use a predicted tax spread from the previous section
for both Total and Current Tax Spreads for all regressions in this section. Our first set of tests
explores the extent to which tax spread can explain Graham’s kink variable. Kink is
determined by the firm’s marginal tax rate (MTR) and amount of existing debt. We control for
these two variables in the regression analysis before adding tax spread. After that, we add
several other traditional control variables. Graham (2000) finds that large, profitable firms
with low expected distress costs use debt conservatively. As a control for size, we include the
log of total assets. We control for profitability before financing decisions by earnings before
interest, taxes, depreciation and amortization (EBITDA). We include the ex ante probability of
financial distress by Altman (1968) Z-score as modified by MacKie-Mason (1990). Variable
descriptions are reported in Appendix A. We standardize Total Tax Spread, Current Tax
Spread and EBITDA by book value of assets. Because the observations for ‘kink’ are obtained
from Graham’s website, this section only covers the period 1988 to 1999 when the kink
variable is available.
Summary statistics for the variables used in our regression analysis are presented in
Table 8, Panel A. The mean (median) kink for our sample is around 2.66 (1.60), indicating
most firms appear to be substantially under-levered based on Graham’s measure. The debt
ratio measured by total debt to market value has a mean (median) in our sample in access of 25
(18) percent.
The correlations among these variables are presented in Table 8, Panel B. As Graham
(2000) reports, kink is highly correlated with size and profitability. The Total Tax Spread

28
shows a correlation with kink of 28 for the entire sample. The Current Tax Spread shows a
correlation with kink of 29. The two tax spreads have a correlation of about 67 percent.
We next estimate the extent to which kink can be explained by tax spread in a
multivariate framework, controlling for size, profitability, bankruptcy probability, and mean
industry kink levels. We estimate a system of two equations using a two-stage least-squares
regression approach. One equation predicts the tax spread using the predictor variables
described in the previous section. The second equation predicts the kink with the tax spread
and the other control variables described above.
Table 9 presents the estimated coefficients of the model in a step-wise fashion.
Because our dependent variable is right censored, we adjust for this censoring by using a Tobit
regression. We control for year so that intra-firm year-to-year observations are independent.
We also correct our standard errors using the Fama-MacBeth method (see Fama and MacBeth
(1973)). We omit regulated and financial firms. We also eliminate outliers by limiting all firm
year observation to Total Tax Spread to assets of less (greater) than 30 percent (-30 percent) of
total assets16
Model (1) and model (2) shows Graham’s kink variable regressed on our tax spread
variables (total and current tax spread). Both variables are significant at the 1 percent level
and the regression has an R-square of 0.068 and 0.077, respectively. In model (3) and model
(4) we control for size, operating income, Altman’s Z-score and median kink in the industry.
Even after controlling for these factors, both measures of tax spread are highly significant with
a positive sign, indicating that firms with higher tax spreads are more likely to have higher
.
16 This process eliminates less than 1% of the total observations. A small portion of our sample reported tax spreads greater than the value of total assets.

29
kink. The R-square increases substantially for these two regressions to 0.237 and 0.239,
respectively.
In model (3) and model (4) in Table 5 tax spread remains positively correlated with
kink in the presence of the additional control variables; however, the Current Tax Spread
significance disappears when clustering effects were controlled. We infer that firms that
appear under-levered -- having a kink significantly greater than one -- may be using NDTS in
place of debt. While statistically significant, the economic significance of this relation is not
overwhelming. Ceteris paribus, increasing Total Tax Spread (Current Tax Spread) from the 1st
to the 3rd quartile increases kink by 0.34 (0.30) or a 14.1 (11.2) percent increase in mean value
of kink. A two standard deviation change in Total Tax Spread (Current Tax Spread) increases
kink by 0.89 (0.87) or 0.32 (0.31) standard deviations of kink.
Although not reported, we also examine only the firms with non-negative values of tax
spread using the same model and find the coefficient on the tax spread increases by a factor of
18. We are also able to increase our R2 to over 50 percent. This may indicate a non-linear
relationship between tax spread and kink. In sum, there is a statistically significant relation
between kink and our tax spread measures indicating substitution between debt and non-debt
tax shields as predicted.
VIII. Conclusions
We use an alternative measure for non-debt tax shields (NDTS) which we call the tax
spread. This is simply the difference between the provision for income tax expense and the tax
paid. First, we address the question of whether our spread measure of NDTS really captures
opaque tax shields. We do this by examining if the tax spread measures are greater during
periods when IRS identified that a firm is operating a tax shelter. By comparing the tax spreads

30
of sheltering firms to a matched sample of non-sheltering firms, we confirm that the tax spread
for sheltering firms is indeed significantly higher.
The second purpose of this paper is to examine the effectiveness of the tax spread
variable as a proxy for NDTS in various capital structure models. We re-estimate three cross-
sectional capital structure regressions that have appeared in the literature to date: Bradley,
Jarrell and Kim (1984), Graham, Lemmon and Schallheim (1998) and Frank and Goyal
(2004). For each cross-sectional regression, we find that the tax spread is significantly
negatively correlated with debt, indicating that NDTS does act as a substitute for debt.
Next, we examine if our measure of NDTS can explain Graham (2000)’s finding that
firms are significantly underleveraged. We find a significant and positive relation between our
measure of tax spread and Graham’s measure for debt conservatism, the kink. This suggests
that firms may not be acting sub-optimally with respect to the debt tax shield.
Overall, we contribute to the literature with a novel and an easy to measure proxy for
NDTS which is able to capture the effects of a relatively wide variety of tax shields. Unlike
some other previous measures of NDTS, our measure is negatively correlated with debt levels.
This shows that our measure is able to overcome the problem of positive correlation between
investment related NDTS proxies and debt levels.

Appendix A
In the following, we define the variables and how they were constructed. Compustat data names are
included in the parenthesis. Compare to Manzon and Plesko (2002).
Table 3
• Total Tax Spread is defined as the Total Foreign, Federal, State and other taxes minus taxes paid
during the current period (TXT- TXPD).
• Current Tax Spread is defined as the Total Foreign, Federal, State and other taxes minus deferred
taxes minus Income Tax Credits minus the taxes paid during the current period (TXT-TXDI—
ITCI-TXPD).
• Pretax Income is directly collected from PI.
• Positive NOL Carryforward is a binary variable equal to one if the firm reports a NOL
carryforward and zero otherwise (I(TLCF)).
• Change in Net Sales is the current year net sales minus less the prior year net sales (SALE-
lag(SALE)).
• Gross PP&E is the cost of fixed property of a company used in the production of revenue before
adjustments for accumulated depreciation, depletion, and amortization (PPEGT).
• Net/Gross PP&E is the cost of tangible fixed property used in the production of revenue, less
accumulated depreciation divided by gross PP&E (PPENT/PPEGT).
• Change in Goodwill after 1993 is the difference between reported goodwill and the goodwill
reported by the firm in 1993 and zero prior to 1993 (GDWL).
• Non-Goodwill Intangible Assets are the difference between total intangible assets and goodwill
(INTAN-GDWL).
• Pre-1993 Goodwill is the amount of goodwill reported 1993 and earlier and equal to the value
reported in 1993 thereafter. (GDWL).

• Change in Post Retirement Benefit is the current year company’s obligation or prepaid cost for
postretirement benefits that is reported on the Balance Sheet minus the previous year obligation
(PRBA-lag(PRBA)). All missing data is set to zero.
• Foreign Pretax Income is the income of a company’s foreign operations before taxes as reported by
the company (PIFO).
• Total Assets less net PP&E and Intangibles is the company’s total assets minus net PP&E minus
intangible assets (AT-PPENT-INTAN).
• Change in Accounting Policy is the adjustments during the period in which an accounting change
occurs (ACCHG). All missing data is set to zero.
• Capital Lease Obligation is the capitalized lease obligations in debt (DCLO).
• Current Operating Lease Expense is the rental expense for the current year (XRENT).
Table 5
• Kink – See Graham (2000). Data is proprietary.
• Total and Current Tax Spread are predicted according to the two stage least squares procedure
described in Section IV. The predicted spread is then standardized by dividing by total assets.
• Log of Size is the natural log of total assets (ln(AT)).
• EBITDA is directly collected from Compustat OIBDP.
• Modified Altman’s Z-score is calculated as (3.3*EBIT + 1.0*Sales +1.4*Retained Earnings +
1.2*Working Capital)/Total assets.
• Median Industry Level is the median kink value by two digit SIC code and year.

Table 1 Summary Statistics
Panel A: Summary Statistics for Total Tax Spread This table reports the statistical summary for Total Tax Spread from the annual COMPUSTAT files during the period 1988 through 2008 for all firm-year observations with non-missing variables used in the Model of Factors Affecting Tax Spread regression. Mean, Median and Sum are reported in millions of US Dollars. Financial firms with one digit SIC code-6 are excluded. The first three columns include all firms, the second three columns only include firms with non-negative total and current tax spreads and the last three include only those firms with negative total and current tax spreads. Total Tax Spread is the difference between the total tax expense and the tax paid. Current Tax Spread is the difference between the current tax expense and the tax paid.
Total Tax Spreads
All data Data with non-negative total and current tax spread Data with negative total and current tax spread Year N Mean Median Sum N Mean Median Sum N Mean Median Sum 1988 353 1.8 0 618.5 168 8.2 1.0 1370.6 131 -6.7 -1.3 -883.8 1989 2058 -0.4 0 -868.7 939 5.3 0.5 5006 757 -9.4 -0.7 -7084.7 1990 2287 0.4 0 935.7 1093 4.5 0.5 4870.9 784 -7.2 -0.6 -5680.0 1991 2385 -4.4 0 -10509.3 1134 3.5 0.4 3955 833 -13.2 -0.7 -10959.8 1992 2376 1.0 0 2266.3 1158 4.4 0.5 5043.1 788 -3.9 -0.5 -3048.8 1993 2190 -1.6 0 -3564.5 1006 5.7 0.5 5757.8 691 -12.7 -0.6 -8743.0 1994 2574 3.3 0 8517.0 1231 6.4 0.7 7861.2 828 -1.7 -0.6 -1435.8 1995 2636 3.3 0 8758.4 1200 7.3 0.8 8774.2 891 -4.4 -0.8 -3958.9 1996 2512 4.5 0 11221.4 1220 6.6 0.9 8078.4 763 0.9 -0.8 687.3.0 1997 2284 4.6 0 10399.5 1108 8.1 1.0 8920.2 697 -1.6 -0.9 -1138.6 1998 2005 5.1 0 10184.9 950 9.1 0.9 8668.7 640 -2.1 -1.0 -1348.0 1999 2597 11.4 0 29622.3 1258 28.1 1.1 35369.3 830 -8.9 -0.9 -7396.6 2000 2504 13.9 0 34708.0 1201 34.1 1.0 40910.7 790 -12 -1.0 -9499.5 2001 2595 -5.3 0 -13848.3 1206 19.9 1.0 23981.5 887 -39.1 -1.6 -34638.7 2002 2935 10 0 29437.6 1396 31.0 2.1 43244.9 918 -21.2 -1.3 -19464.2 2003 2993 12.1 0.2 36188.8 1555 31.1 2.5 48395 788 -15.9 -0.9 -12497.4 2004 3027 16.6 0.1 50371.0 1569 43.3 2.7 67900.8 801 -25.6 -0.9 -20468.2 2005 2979 10.8 0 32313.1 1527 40.7 2.3 62223.2 832 -25.0 -1.9 -20767.7 2006 2981 6.1 0 18282.2 1408 33.2 2.0 46793.1 882 -32.5 -2.5 -28689.6 2007 2898 12.1 0 35174.5 1315 39.3 2.4 51679.6 893 -33.4 -2.7 -29863.9 2008 2789 -1.1 0 -3074.1 1052 41.2 2.1 43384.1 977 -43.7 -3.1 -42740.6
Total 51958 104.2 0.3 287134.3 24694 411 26.9 532188.3 16401 -319.3 -25.3 -269621

Panel B: Summary Statistics for Current Tax Spread This table reports the statistical summary for Current Tax Spread from the annual COMPUSTAT files during the period 1988 through 2008 for all firm-year observations with non-missing variables used in the Model of Factors Affecting Tax Spread regression. Mean, Median and Sum are reported in millions of US Dollars. Financial firms with one digit SIC code-6 are excluded. The first three columns include all firms, the second three columns only include firms with non-negative total and current tax spreads and the last three include only those firms with negative total and current tax spreads. Total Tax Spread is the difference between the total tax expense and the tax paid. Current Tax Spread is the difference between the current tax expense and the tax paid. Current Tax Spreads
All data Data with non-negative total and current tax spread Data with negative total and current tax spread Year N Mean Median Sum N Mean Median Sum N Mean Median Sum 1988 353 -0.3 0 -89.9 168 5.2 0.5 881.1 131 -6.2 -1.0 -809.8 1989 2058 -1.1 0 -2194.3 939 3.3 0.4 3143.6 757 -7.0 -0.6 -5335.7 1990 2287 0 0 20 1093 3.1 0.4 3441.2 784 -5.5 -0.5 -4318.0 1991 2385 -0.9 0 -2124.5 1134 3.2 0.4 3611.1 833 -7.9 -0.5 -6567.6 1992 2376 1.4 0 3316.8 1158 3.4 0.4 3965.2 788 -2.5 -0.5 -1979.8 1993 2190 0.5 0 1095 1006 3.8 0.4 3823.2 691 -4.5 -0.4 -3107.0 1994 2574 1.9 0 4765.1 1231 4.3 0.5 5287.5 828 -1.9 -0.5 -1599.1 1995 2636 1.5 0 3865.7 1200 4.9 0.6 5861.6 891 -3.0 -0.6 -2665.5 1996 2512 2.4 0 5993.6 1220 4.5 0.7 5493.7 763 0.6 -0.6 440.4 1997 2284 2.1 0 4789.8 1108 5.5 0.8 6116.5 697 -2.1 -0.7 -1433.3 1998 2005 2.4 0 4798.8 950 5.9 0.8 5634.9 640 -3.6 -0.7 -2285.7 1999 2597 6.6 0 17053.5 1258 18.5 0.8 23265.2 830 -7.0 -0.7 -5803.2 2000 2504 9.2 0 22930.1 1201 25.4 0.7 30523.4 790 -9.5 -0.8 -7527.9 2001 2595 -0.4 0 -962.8 1206 13 0.6 15721.5 887 -19.9 -0.9 -17694.9 2002 2935 5.9 0 17416.8 1396 23.6 1.1 32993.2 918 -15.3 -1.1 -14035.5 2003 2993 5.7 0 17152.3 1555 21.1 1.3 32775.8 788 -14.5 -0.7 -11419.4 2004 3027 10.7 0 32514.8 1569 31.8 1.5 49835.2 801 -19.5 -0.8 -15654.1 2005 2979 9.9 0 29517.3 1527 26.2 1.7 39960.6 832 -15.9 -0.9 -13201.1 2006 2981 1.8 0 5324.7 1408 19.6 1.4 27554.2 882 -24.9 -1.7 -21967.4 2007 2898 6.2 0 17856.4 1315 29.1 1.6 38275.7 893 -20.4 -1.8 -18253.8 2008 2789 1.6 0 4431.3 1052 30.8 1.3 32443.5 977 -26.2 -1.9 -25568.7
Total 51958 67.1 0 187470.5 24694 286.2 17.9 370607.9 16401 -216.7 -17.9 -180787

Table 2 Firms with the Highest and Lowest Tax Spread
This table reports the firms with the highest and lowest cumulative Total Tax Spread over our sample period of 1988 to 2008. This sample is ranked by Total Cumulative tax spread. Firms with non-reporting or missing variables were dropped from this sample.
Company Name Cumulative Total Tax Spread
Cumulative Total Tax spread as % of cumulative book value of assets
Highest Tax Spreads General Electric Co 24269.00 0.32% Microsoft Corp 16688.08 2.92% IBM Corp 13628.00 1.23% Boeing Co 5731.00 0.95% Andarko Petroleum Corp 4797.00 1.77% International Lease Finance Corp 4512.35 1.18% Chevron Corp 4159.00 0.46% ConocoPhillips 3771.00 0.38% News Corp 3726.35 0.90% Burlington Northern Railroad Co 3679.52 1.50% Chesapeake Energy Corp 3470.46 2.72% Hewlett-Packard Co 3338.00 0.46% Raytheon Co 3238.85 0.92% Merck & Co 3009.20 1.54% Lowest Tax spreads Pfizer Inc -7264.00 -0.93% General Motors Company -6183.00 -1.30% Coca-Cola Enterprises Inc -3340.00 -1.23% Weyerhauser Co -2143.00 -1.11% Gannett Co -2023.08 -1.19% Leucadia National Corp -1892.37 -3.58% Lennar Corp -1651.04 -2.24% Freecsale Semiconductor Corp -1564.00 -3.35% Liberty Media Capital Group -1283.00 -0.89% Dex One Corp -1222.94 -2.12% Nabisco Group Holdings Corp -1214.00 -0.37% Pacific Bell -1183.00 -0.87% Verizon New York Inc -1125.30 -0.51% Starwood Hotels & Resorts Worldwide -1054.00 -1.36% Texaco Inc -970.00 -0.32%

Table 3 Summary of Tax Spread difference for the years shelter is active
This table presents the summary of differences between the tax spreads of the firms which have a shelter and matched firms which do not have any shelter. Total and Current Tax Spread represents the difference between total tax expense/current tax expense and taxes paid. The current tax expense is the total tax expense (which is equal to total taxes less taxes paid) minus deferred taxes and investment tax credits. If the shelter lasted multiple years, each year the shelter lasted is taken as a single observation in Panel A. In Panel B, the firm-year statistics are averaged across all of the years that the shelter was allegedly active. Matched firms are in the same industry as the shelter firm and have book assets within +/- 25% and profitability within +/- 50% of the shelter firm’s ratios in the same year. All numbers are means. p values for the differences reported are calculated either on the basis of a t test for means and signed rank test for medians. *, **, *** imply significance at the 10%, 5%, and 1% respectively
Variable Number of
Observations Shelter firms
Match firms
Difference p value for signed rank test
p value for t test
Panel A: Results over entire shelter period with one observation per firm-year Total Tax spread 63 180.54 73.01 107.52 0.09* 0.02** Current Tax Spread
63 89.94 25.07 64.88 0.07* 0.04**
Panel B: Results over entire shelter period with one observation per firm Total Tax spread 24 188.72 109.91 78.81 0.05** 0.04** Current Tax Spread
24 73.47 27.4 46.07 0.11 0.06*

Table 4 OLS Regression Model of Factors Affecting Tax Spread
Panel A: OLS Regression Model of Factors Affecting Total Tax Spread
This table shows OLS regressions using Total Tax Spread as the dependent variable. Total Tax Spread is the difference between the total tax expense (TXT) and tax paid from the cash flow statement (TXPD). Current Spread is the difference between current tax expense and tax paid. Current tax expense is defined as total tax expense less deferred taxes and Income Tax Credits. Independent variables are as defined in Appendix A. Year dummies are used to control for time series variation but are not presented in this table. Model 1 includes all COMPUSTAT reporting firms are included except regulated (SICs 4900-4999) and financial firms (SICs 6000-6999) for the period 1988 through 2008. Model 2 includes all firms in model 1 except those which have either negative Total Tax Spread or negative Current Tax Spread. Model 3 only excludes those with negative Total Tax Spreads. *, **, *** Significant at the 10 percent, 5 percent, and 1 percent level, respectively. Robust t-statistics are reported in parentheses.
All firms All firms with non-negative Total & Current
Tax Spreads
All firms with non-negative Total Spreads
(1) (2) (3) Intercept -3.1668 1.0936 -0.7420
(-1.44) (0.45) (-0.36) Pretax Income 0.0811*** 0.0414*** 0.0483***
(7.28) (4.67) (5.09) I(Positive NOL Carryforward) 3.1977*** 0.7467 1.1580
(2.78) (0.75) (1.17) Change in Sales 0.0051 0.0081** -0.0002
(1.05) (2.27) (-0.05) Gross PP&E -0.0013 0.0087*** 0.0080***
(-0.88) (6.06) (5.66) Net/Gross PP&E 0.0608 -4.9993* 0.1786
(0.02) (-1.89) (0.06) Change in Goodwill after 1993 -0.0075 -0.0005 -0.0016
(-1.43) (-0.12) (-0.40) Non-Goodwill Intangible Asset -0.0146*** 0.0015 0.0024
(-2.59) (0.26) (0.51) Pre-1993 Goodwill -0.0067 0.0029 -0.0014
(-1.12) (0.74) (-0.31) Change in Postretirement Benefits 0.0355** 0.0192 0.0334*
(2.0) (1.48) (1.68) Foreign Pretax Income -0.0673*** -0.0521*** -0.0452***
(-3.93) (-3.49) (-2.92) Total Assets less PP&E and Intangibles
0.0008 0.0015* 0.0019** (0.61) (1.84) (2.16)
Accounting Change -0.0266 -0.1740** -0.1044 (-1.10) (-2.12) (-1.34)
Operating Lease Expense 0.0403 0.0130 0.0184 (1.27) (0.38) (0.54)
Capital Lease Obligation -0.0081 -0.0404 -0.0362 (-0.19) (-1.10) (-1.05)
Lag of Tax Spread 0.1526** 0.2095*** 0.0874 (2.19) (3.65) (1.03)
Adj. R2 0.336 0.708 0.604 F-Statistic 752.42 1714.77 1324.43 Observations 51958 24694 30369

Panel B: OLS Regression Model of Factors Affecting Current Tax Spread
This table shows OLS regressions using Total Tax Spread as the dependent variable. Total Tax Spread is the difference between the total tax expense (TXT) and tax paid from the cash flow statement (TXPD). Current Spread is the difference between current tax expense and tax paid. Current tax expense is defined as total tax expense less deferred taxes and Income Tax Credits. Independent variables are as defined in Appendix A. Year dummies are used to control for time series variation but are not presented in this table. Model 1 includes all COMPUSTAT reporting firms are included except regulated (SICs 4900-4999) and financial firms (SICs 6000-6999) for the period 1988 through 2008. Model 2 includes all firms in model 1 except those which have either negative Total Tax Spread or negative Current Tax Spread. Model 3 only excludes those with negative Current Tax Spreads. *, **, *** Significant at the 10 percent, 5 percent, and 1 percent level, respectively. Robust t-statistics are reported in parentheses. All firms All firms with non-
negative Total & Current Tax Spreads
All firms with non-negative Current Tax
Spreads (1) (2) (3) Intercept -1.1530 4.3190** 2.4770*
(-0.76) (2.34) (1.71) Pretax Income 0.0354*** 0.0363*** 0.0345***
(5.43) (4.33) (5.05) I(Positive NOL Carryforward) 0.7573 -0.3987 0.0134
(1.03) (-0.48) (0.02) Change in Sales 0.0098*** 0.0079*** 0.0068**
(3.42) (2.66) (2.40) Gross PP&E 0.0006 0.0060*** 0.0050***
(0.61) (4.41) (4.40) Net/Gross PP&E -1.7821 -5.4688*** -2.2794
(1.04) (-2.59) (-1.19) Change in Goodwill after 1993 -0.0055* -0.0020 -0.0011
(-1.90) (-0.63) (-0.36) Non-Goodwill Intangible Asset -0.0003 -0.0030 0.0005
(-0.09) (-0.83) (0.15) Pre-1993 Goodwill -0.0069** -0.0011 -0.0022
(-2.38) (-0.35) (-0.75) Change in Postretirement Benefits 0.0019 0.0044 -0.0073
(0.38) (0.48) (-1.01) Foreign Pretax Income -0.0410*** -0.0475*** -0.0350***
(-3.01) (-3.95) (-3.07) Total Assets less PP&E and Intangibles 0.0016** 0.0018** 0.0014**
(2.12) (2.15) (2.02) Accounting Change 0.0135 -0.0569 -0.0279
(0.59) (-0.71) (-0.59) Operating Lease Expense -0.0388* -0.0341 -0.0178
(-1.83) (-1.18) (-0.73) Capital Lease Obligation -0.0100 -0.0681** -0.0521*
(-0.42) (-2.10) (-1.89) Lag of Tax Spread 0.2011*** 0.2539*** 0.2461***
(2.89) (2.98) (3.17) Adj. R2 0.276 0.635 0.585 F-Statistic 566.00 1226.41 1206.18 Observations 51958 24694 29882
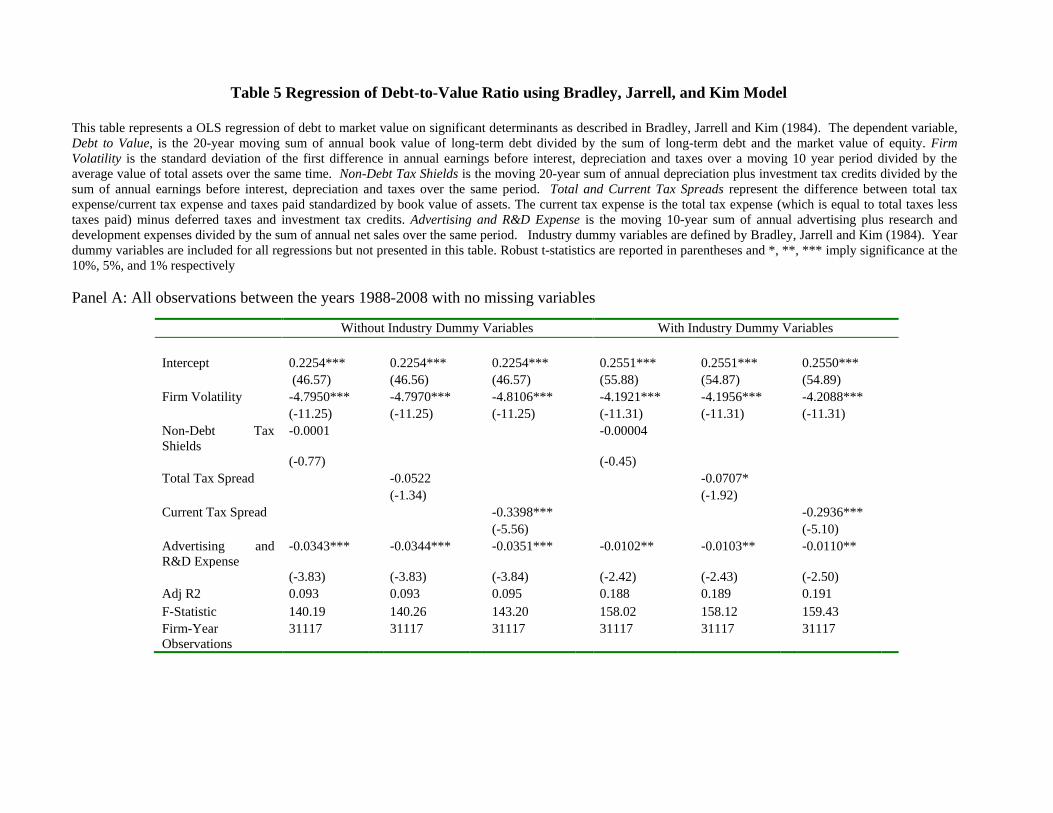
Table 5 Regression of Debt-to-Value Ratio using Bradley, Jarrell, and Kim Model
This table represents a OLS regression of debt to market value on significant determinants as described in Bradley, Jarrell and Kim (1984). The dependent variable, Debt to Value, is the 20-year moving sum of annual book value of long-term debt divided by the sum of long-term debt and the market value of equity. Firm Volatility is the standard deviation of the first difference in annual earnings before interest, depreciation and taxes over a moving 10 year period divided by the average value of total assets over the same time. Non-Debt Tax Shields is the moving 20-year sum of annual depreciation plus investment tax credits divided by the sum of annual earnings before interest, depreciation and taxes over the same period. Total and Current Tax Spreads represent the difference between total tax expense/current tax expense and taxes paid standardized by book value of assets. The current tax expense is the total tax expense (which is equal to total taxes less taxes paid) minus deferred taxes and investment tax credits. Advertising and R&D Expense is the moving 10-year sum of annual advertising plus research and development expenses divided by the sum of annual net sales over the same period. Industry dummy variables are defined by Bradley, Jarrell and Kim (1984). Year dummy variables are included for all regressions but not presented in this table. Robust t-statistics are reported in parentheses and *, **, *** imply significance at the 10%, 5%, and 1% respectively Panel A: All observations between the years 1988-2008 with no missing variables
Without Industry Dummy Variables With Industry Dummy Variables
Intercept 0.2254*** 0.2254*** 0.2254*** 0.2551*** 0.2551*** 0.2550*** (46.57) (46.56) (46.57) (55.88) (54.87) (54.89) Firm Volatility -4.7950*** -4.7970*** -4.8106*** -4.1921*** -4.1956*** -4.2088*** (-11.25) (-11.25) (-11.25) (-11.31) (-11.31) (-11.31) Non-Debt Tax Shields
-0.0001 -0.00004
(-0.77) (-0.45) Total Tax Spread -0.0522 -0.0707* (-1.34) (-1.92) Current Tax Spread -0.3398*** -0.2936*** (-5.56) (-5.10) Advertising and R&D Expense
-0.0343*** -0.0344*** -0.0351*** -0.0102** -0.0103** -0.0110**
(-3.83) (-3.83) (-3.84) (-2.42) (-2.43) (-2.50) Adj R2 0.093 0.093 0.095 0.188 0.189 0.191 F-Statistic 140.19 140.26 143.20 158.02 158.12 159.43 Firm-Year Observations
31117 31117 31117 31117 31117 31117

Panel B: All Non-negative Total and Current Tax Spread observations 1988-2008
Without Industry Dummy Variables With Industry Dummy Variables Intercept 0.2024*** 0.2107*** 0.2132*** 0.2217*** 0.2282*** 0.2309*** (22.09) (22.85) (23.39) (24.12) (24.69) (25.19) Firm Volatility -2.7834*** -2.7634*** -2.7117*** -2.4505*** -2.4385*** -2.3974*** (-6.29) (-6.37) (-6.41) (-6.49) (-6.57) (-6.61) Non-Debt Tax Shields 0.0001 0.00001 (0.23) (0.03) Total Tax Spread -0.6351*** -0.4933*** (-5.43) (-4.56) Current Tax Spread -1.2331*** -1.0413*** (-7.55) (-7.22) Advertising and R&D Expense
-0.0266*** -0.0276*** -0.0277*** -0.0055 -0.0065* -0.0072**
(-4.83) (-5.01) (-5.11) (-1.62) (-1.90) (-2.13) Adj R2 0.094 0.099 0.109 0.203 0.206 0.214 F-Statistic 32.73 34.50 38.48 39.94 40.62 42.55 Firm-Year Observations 7023 7023 7023 7023 7023 7023

Table 6 Regression of Debt-to-Value Ratio using Graham, Lemmon, and Schallheim Model
This table presents OLS regression of debt to market value on variables described in Graham, Lemmon and Schallheim (1998). The dependent variable, Debt to Value, is the ratio of the book value of debt net of capital leases to market value of assets (MVA). MVA is the book value of total assets minus the book value of equity plus the market value of equity plus the present value of operating leases. The Before-financing Marginal Tax Rate is simulated based on income after depreciation but before interest expenses are deducted (See Graham (1996a)). Z-score is the modified version of Altman's (1968) Z-Score. OENEG is a dummy variable equal to one if the book value of common equity is negative. Total and Current Tax Spreads represent the difference between total tax expense/current tax expense and taxes paid standardized by book value of assets. The current tax expense is the total tax expense (which is equal to total taxes less taxes paid) minus deferred taxes and investment tax credits. Market to Book is the total assets plus the present value of operating leases. Collateral is equal to net PP&E divided by the book value of total assets. Size is defined as the natural log of the market value of the firm (MVA). One-digit SIC code industry dummies and year dummies for 1987 through 1992 are included. ECOST is not included due to sample size limitations. Robust t-statistics are reported in parentheses. *, ** , *** imply significance at the 10 percent, 5 percent, and 1 percent level, respectively.
Panel A: All firm-year observations between the years 1988-2008
Estimated Coefficients Intercept 0.0654*** 0.0637*** 0.0650***
(12.64) (12.29) (12.51) Before-financing Marginal Tax Rate 0.0229*** 0.0208*** 0.0232***
(2.91) (2.65) (2.95) Z-Score -0.0014*** -0.0014*** -0.0014***
(-4.56) (-4.45) (-4.50) I(OENEG) 0.1122*** 0.1122*** 0.1123***
(19.00) (19.03) (19.02) Total Tax Spread -0.1612***
(-5.98) Current Tax Spread -0.0322
(-0.92) Market-to-Book -0.0168*** -0.0166*** -0.0168***
(-11.89) (-11.83) (-11.85) Collateral 0.1598*** 0.1603*** 0.1597***
(32.67) (32.78) (32.67) Size (log of firm value) 0.0060*** 0.0062*** 0.0060***
(14.06) (14.74) (14.16) I(SIC codes 1000-1999) -0.0129** -0.0121** -0.0129**
(2.20) (2.06) (-2.20) I(SIC codes 2000-2999) 0.0097*** 0.0094*** 0.0095***
(2.56) (2.48) (2.53) I(SIC codes 3000-3999) -0.0086*** -0.0086*** -0.0087***
(-2.49) (-2.50) (-2.51) I(SIC codes 4000-4900) 0.0018 0.0020 0.0017
(0.34) (0.38) (0.32) I(SIC codes 5000-5999) -0.0219*** -0.0221*** -0.0220***
(-5.62) (-5.67) (-5.65) I(SIC codes 7000-7999) -0.0148*** -0.0148*** -0.0148***

(-3.74) (-3.74) (-3.76) I(Year 1987-1992) 0.0106 0.0113 0.0108
(1.17) (1.24) (1.18) Adj. R2 0.168 0.169 0.168 F-Statistic 202.93 198.31 196.88 Observations 31995 31995 31995
Panel B: All firm year observations with Non-negative Total and Current Tax Spread 1988-2008
Estimate Coefficients Intercept 0.0627*** 0.0678*** 0.0655***
(8.44) (9.10) (8.83) Before-financing Marginal Tax Rate 0.0242** 0.0265** 0.0286***
(2.19) (2.40) (2.57) Z-Score -0.0012*** -0.0010*** -0.0011***
(-3.53) (-3.01) (-3.19) I(OENEG) 0.0963*** 0.0968*** 0.0981***
(12.03) (12.08) (12.24) Total Tax Spread -0.3520***
(-5.61) Current Tax Spread -0.3244***
(-4.62) Market-to-Book -0.0123*** -0.0120*** -0.0120***
(-9.13) (-9.10) (-9.07) Collateral 0.1481*** 0.1469*** 0.1450***
(21.65) (21.65) (21.29) Size (log of firm value) 0.0035*** 0.0035*** 0.0035***
(6.23) (6.25) (6.15) I(SIC codes 1000-1999) -0.0187** -0.0168** -0.0187**
(-2.38) (-2.14) (-2.38) I(SIC codes 2000-2999) 0.0073 0.0066 0.0065
(1.41) (1.28) (1.25) I(SIC codes 3000-3999) -0.0075 -0.0078* -0.0075
(-1.59) (-1.64) (-1.58) I(SIC codes 4000-4900) 0.0061 0.0059 0.0049
(0.82) (0.79) (0.66) I(SIC codes 5000-5999) -0.0206*** -0.0215*** -0.0213***
(-3.87) (-4.06) (-4.01) I(SIC codes 7000-7999) -0.0141*** -0.0133*** -0.0132***
(-2.64) (-2.50) (-2.48) I(Year 1987-1992) 0.0100 0.0096 0.0109
(0.81) (0.77) (0.88) Adj. R2 0.154 0.157 0.157 F-Statistic 86.98 86.33 86.58 Observations 15150 15150 15150

Table 7 Regression of Debt-to-Value Ratio using Frank and Goyal Model
This table presents an OLS regression of total debt to market value on the first 6 factors as determined in Frank and Goyal (2004). The dependent variable, Total Debt to Value (TDM), is the ratio of long term and current liabilities to market value of assets (MVA). MVA is the market value of equity plus the book value of long and current debt plus the value of preferred stock minus the liquidation value minus deferred taxes and investment tax credits. Industry Level is the median of the TDM by year and four digit SIC code. Market to Book is the ratio of MVA to total assets. Collateral is the ratio of inventory plus net PP&E to total assets. Dividend is a dummy variable which takes the value of one if a dividend was paid during the year. Log of Assets is the natural log of the book value of assets. Total and Current Tax Spread represent the difference between total tax expense/current tax expense and taxes paid standardized by book value of assets. The current tax expense is the total tax expense (which is equal to total taxes less taxes paid) minus deferred taxes and investment tax credits. All factors are lagged one year. Year dummy variables are included for all regressions but not presented in this table. Robust t-statistics are reported in parentheses and *, **, *** imply significance at the 10%, 5%, and 1% respectively Panel A: All firm-year observations between the years 1988-2008
Estimated Coefficients Intercept 0.0962*** 0.0911*** 0.0962*** (6.42) (5.68) (6.42) Industry Level 0.6484*** 0.6451*** 0.6483*** (41.35) (42.87) (41.35) Market to Book ratio -0.0058*** -0.0055*** -0.0057*** (-2.94) (-2.92) (-2.94) Collateral 0.1445*** 0.1458*** 0.1443*** (12.25) (12.50) (12.23) Profitability -0.0742*** -0.0676*** -0.0736*** (-8.63) (-8.18) (-8.55) Dividend -0.0869*** -0.0878*** -0.0870*** (-9.24) (-9.15) (-9.26) Log of Assets 0.0169*** 0.0175*** 0.0169*** (8.63) (7.09) (7.40) Total Tax Spread -0.6899** (-2.08) Current Tax Spread -0.0360 (-1.53) Adj R2 0.030 0.031 0.030 F-Statistic 70.57 69.33 67.89 Firm-Year Observations 55920 55920 55920
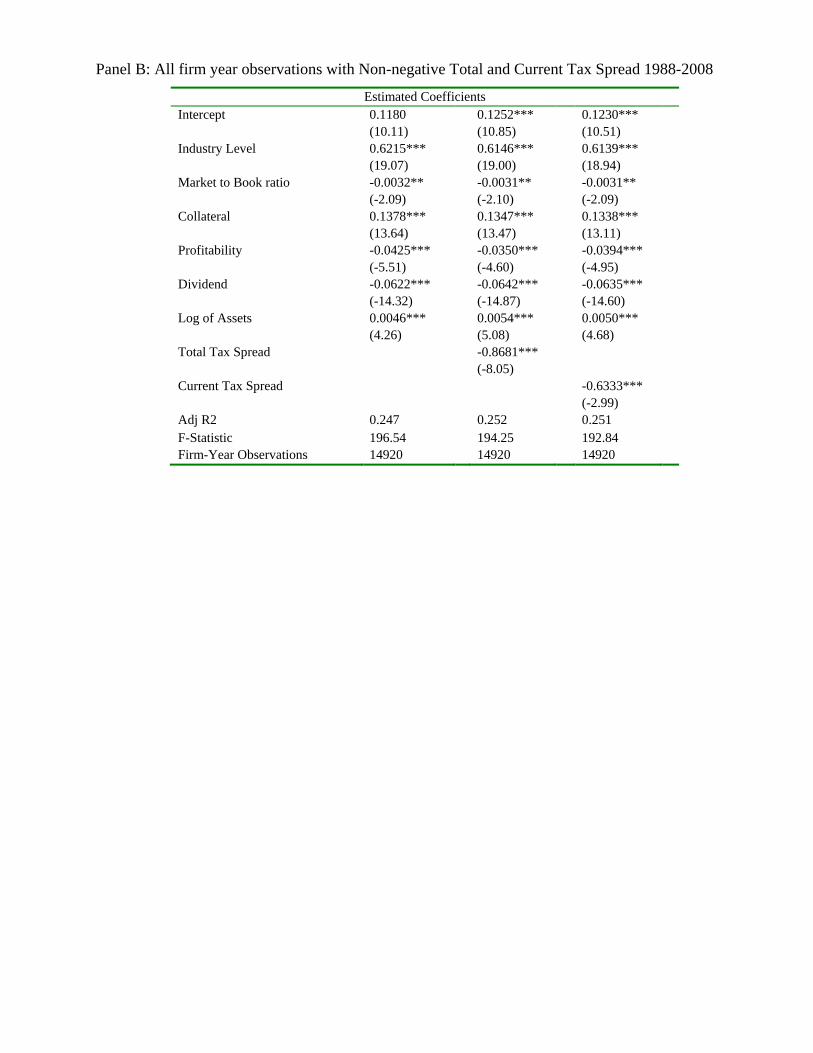
Panel B: All firm year observations with Non-negative Total and Current Tax Spread 1988-2008
Estimated Coefficients Intercept 0.1180 0.1252*** 0.1230*** (10.11) (10.85) (10.51) Industry Level 0.6215*** 0.6146*** 0.6139*** (19.07) (19.00) (18.94) Market to Book ratio -0.0032** -0.0031** -0.0031** (-2.09) (-2.10) (-2.09) Collateral 0.1378*** 0.1347*** 0.1338*** (13.64) (13.47) (13.11) Profitability -0.0425*** -0.0350*** -0.0394*** (-5.51) (-4.60) (-4.95) Dividend -0.0622*** -0.0642*** -0.0635*** (-14.32) (-14.87) (-14.60) Log of Assets 0.0046*** 0.0054*** 0.0050*** (4.26) (5.08) (4.68) Total Tax Spread -0.8681*** (-8.05) Current Tax Spread -0.6333*** (-2.99) Adj R2 0.247 0.252 0.251 F-Statistic 196.54 194.25 192.84 Firm-Year Observations 14920 14920 14920

Table 8 - Summary Statistics on Variables Used in ‘Kink’ Regression
Panel A: Summary Statistics Mean Median Std.
Dev. 25th % 75th %
Kink 2.6644 1.6000 2.8405 0.2000 4.0000 MTR After Interest Deduction 0.2104 0.3221 0.1570 0.0086 0.3473 Total Debt to Market Value 0.2510 0.1847 0.2433 0.0371 0.4010 Total Tax Spread to Book Assets 0.0008 0.0013 0.0053 -0.0010 0.0035 Current Tax Spread to Book Assets
0.0015 0.0019 0.0038 0.0001 0.0035
Log of Book Assets 4.9690 4.9272 1.9598 3.5664 6.3423 EBITDA to Book Assets 0.1080 0.1329 0.1933 0.0743 0.1876 Modified Altman's Z-score 3.0473 3.0283 3.2484 2.0190 4.2371 Median Industry Level 1.6461 1.3000 1.3168 0.8000 2.0000
Panel B: Correlation Coefficient Matrix
Kink MTR TDM Total
Spread Currrent Spread
Assets EBITDA Z-score
MTR After Interest Deduction 0.4617 1.0000 Total Debt to Market Value -0.4711 -0.2721 1.0000 Total Tax Spread to Book Assets 0.2833 0.2259 -0.1711 1.0000 Current Tax Spread to Book Assets
0.2938 0.2120 -0.2476 0.6667 1.0000
Log of Book Assets 0.2042 0.2826 0.0860 0.2535 0.2757 1 EBITDA to Book Assets 0.3833 0.4302 -0.1446 0.6979 0.6722 0.318 1.0000 Modified Altman's Z-score 0.3696 0.3212 -0.3395 0.4147 0.4905 0.0718 0.5553 1.0000 Median Industry Level 0.3144 0.1822 -0.1593 0.0967 0.1091 0.1159 0.1623 0.1190

Table 9 Two-Stage Least Squares Regression Using the ‘Kink’ in the Benefit Function as the Dependent Variable
This table represents a two-stage least squared regression using kink in the benefit function as the dependent variable (See Graham (2000)). Total Tax Spread is the difference between provision for income tax expense and tax paid. Current Tax Spread is the Total Tax Spread minus deferred taxes and income tax credits. Total and Current Tax Spread are predicted by exogenous factors defined by Manzon and Plesko (2002) and represents the difference between total tax expense/current tax expense and taxes paid standardized by book value of assets. The current tax expense is the total tax expense minus deferred taxes and investment tax credits. Log of Assets is the natural log of the book value of assets. EBITDA is the earnings reported before interest, taxes, depreciation and amortization standardized by book assets. Modified Altman’s Z-score is defined by Altman (1984). Median Industry Level is the median kink value by two digit SIC code and year. All COMPUSTAT reporting firms are included except regulated (SICs 4900-4999) and financial firms (SICs 6000-6999) by the period 1987 through 1999. Standard errors are corrected according to the Fama-MacBeth method and *, **, *** imply significance at the 10%, 5%, and 1% respectively
Estimated Coefficients
Intercept 2.4822*** 2.2513*** 0.8654*** 0.8532*** -0.014 -0.0613 (16.14) (15.99) (9.77) (9.57) (-0.12) (-0.50) Total Tax Spread to Book Assets 173.8753*** 35.236*** 33.0282*** (9.57) (4.79) (3.59) Current Tax Spread to Book Assets
244.7979*** -4.4166 9.2353
(13.34) (-0.45) (1.15) MTR After Interest Deduction 4.5366*** 4.3825*** (18.30) (17.03) Total Debt to Market Value -3.7897*** -3.8743*** (-66.15) (-52.51) Log of Size 0.1737*** 0.1745*** 0.1738*** 0.1698*** (15.15) (14.18) (11.59) (11.93) EBITDA to Book Assets 1.2458*** 1.951*** 2.306*** 2.7763*** (5.65) (7.44) (5.86) (5.62) Modified Altman's Z-score 0.0878*** 0.0871*** 0.2309*** 0.2291*** (4.19) (4.25) (3.34) (6.37) Median Industry Level 0.3178*** 0.317*** 0.474*** 0.4728*** (15.25) (14.84) (17.37) (17.09) OLS R2 0.068 0.077 0.413 0.416 0.237 0.239
F-Statistic 1320 1499 1848 1853 1152 1152 Observations 18068 18068 18068 18068 18068 18068 Fama-MacBeth Coefficients for Tax Spread (Pos/Sig Pos/Neg/Sig Neg)
12/12/0/0 12/12/0/0 12/5/0/0 7/0/5/0 10/4/2/0 7/2/5/0

REFERENCES
Altman, Edward I., 1968, Financial Ratios, Descriminate Analysis and the Prediction of Corporate Bankruptcy., Journal of Finance 23, 589-609.
Altman, Edward I., 1984, A Further Investigation of the Bankruptcy Cost Question., Journal of Finance 39, 1067-1089.
Bankman, Joseph, 1999, The New Market in Corporate Tax Shelters., Tax Notes 8, 1775-1795.
Barclay, Michael J., Erwan Morellec, and Clifford W Smith, Jr., 2001, On the debt capacity of growth options., Unpublished Working Paper, University of Rochester, NY.
Beneish, Messod D., 1999, The Detecting of Earnings Manipulation., Financial Analysts Journal 55, 24-26.
Bradley, Michael, Gregg A Jarrell, and E Han Kim, 1984, On the Existence of an Optimal Capital Structure: Theory and Evidence, Journal of Finance 39, 857-78.
Chirinko, Robert S., and Anuja R. Singha, 2000, Testing Static Tradeoff against Pecking Order Models of Capital Structure: A Critical Comment, Journal of Financial Economics 58, 417-25.
DeAngelo, Harry, and Ronald W. Masulis, 1980, Optimal Capital Structure under Corporate and Personal Taxation, Journal of Financial Economics 8, 3-29.
Desai, Mihir A, 2003, The Divergence Between Book Income and Tax Income, in James M. ed Poterba, ed.: Tax policy and the economy. Volume 17.
Desai, M. A. and D. Dharmapala, 2006. “Corporate Tax Avoidance and High-Powered Incentives,”Journal of Financial Economics 79, 145-179. Fama, Eugene F, and J.D. MacBeth, 1973, Risk, Return and Equilibrium: Empirical Tests,
Journal of Political Economy 81, 607-636.
Frank, Murray Z., and Vidhan K. Goyal, 2004, Capital Structure Decisions: Which Factors are Reliably Important?, Working Paper.
Graham, John R, 1996a, Debt and the Marginal Tax Rate, Journal of Financial Economics 41, 41-73.
Graham, John R, 2003, Taxes and Corporate Finance: A Review, Review of Financial Studies 16, 1075-1129.

Graham, John R, Mark H Lang, and Douglas A Shackelford, 2004, Employee Stock Options, Corporate Taxes, and Debt Policy, Journal of Finance 59, 1585-1618.
Graham, John R, and Allen Tucker, 2006, Tax Shelters and Corporate Debt Policy., Journal of Finance forthcoming.
Graham, John R., 2000, How Big Are the Tax Benefits of Debt?, Journal of Finance 55, 1901-41.
Graham, John R., Michael L. Lemmon, and James S. Schallheim, 1998, Debt, Leases, Taxes, and the Endogeneity of Corporate Tax Status, Journal of Finance 53, 131-62.
Jensen, Michael C., and William H. Meckling, 1976, Theory of the Firm: Managerial Behavior, Agency Costs and Ownership Structure, Journal of Financial Economics 3, 305-60.
Kasznik, Ron, 1999, On the Association between Voluntary Disclosure and Earnings Management, Journal of Accounting Research 37, 57-81.
Leary, Mark, and Michael Roberts, 2005, Financial Slack and Tests of the Pecking Order's Financing Hierarchy., Working Paper.
MacKie-Mason, Jeffrey K, 1990, Do Taxes Affect Corporate Financing Decisions?, Journal of Finance 45, 1471-93.
Manzon, Gil B., and George A Plesko, 2002, The Relation Between Financial and Tax Reporting Measures of Income, Tax Law Review 55.
Miller, Merton H., 1977, Debt and Taxes, Journal of Finance 32, 261-75.
Mills, Lillian, Kaye Newberry, and William B. Trautman, 2002, Trends in Book-tax Income and Balance Sheet Differences., Tax Notes.
Modigliani, Franco, and Merton Miller, 1963, Corporate Income Taxes and the Cost of Capital: A Correction, American Economic Review 53, 433-443.
Modigliani, Franco, and Merton H Miller, 1958, The Cost of Capital, Corporation Finance and the Theory of Investment, American Economic Review 48, 261-297.
Myers, Stewart C., 1977, Determinants of Corporate Borrowing, Journal of Financial Economics 5, 147-75.
Myers, Stewart C., 1984, The Capital Structure Puzzle, Journal of Finance 39, 575-92.

Myers, Stewart C., and Nicholas S. Majluf, 1984, Corporate Financing and Investment Decisions When Firms Have Information That Investors Do Not Have, Journal of Financial Economics 187-221.
Plesko, George A, 2003, An Evaluation of Alternative Measures of Corporate Tax Rates, Journal of Accounting and Economics 35, 201-26.
Schwartz, Eli, and J. Richard Aronson, 1967, Some Surrogate Evidence in Support of the Concept of Optimal Financial Structure., Journal of Finance 22, 10-18.
Scott, David F., 1972, Evidence on the Importance of Financial Structure., Financial Management Summer, 45-50.
Shevlin, Terry, 1990, Estimating Corporate Marginal Tax Rates with Asymmetric Tax Treatment of Gains and Losses., Journal of the American Taxation Association 11, 51-67.
Shivdasani, Anil and Irina Stefanescu, Irina, 2010, How Do Pensions Affect Corporate Capital Structure Decisions? Review of Financial Studies, 23(3), 1287-1323.
Shyam-Sunder, Lakshmi, and Stewart C. Myers, 1999, Testing Static Tradeoff against Pecking Order Models of Capital Structure, Journal of Financial Economics 51, 219-44.
Stickney, Clyde, Roman Weil, and Mark Wolfson, 1983, Income Taxes and Tax-Transfer Leases: General Electric's Accounting for a Molotov Cocktail, The Accounting Review, 58, 439-459.
Titman, Sheridan, and Roberto Wessels, 1988, The Determinants of Capital Structure Choice,
Journal of Finance 43, 1-19.
Weiss, Lawrence A, 1990, Bankruptcy Resolution: Direct Costs and Violation of Priority of Claims, Journal of Financial Economics 27, 285-314.
Wilson, Ryan J., An Examination of Corporate Tax Shelter Participants, The Accounting Review, vol 84, 2009, 969-999.
Zimmerman, Jerold L, 1983, Taxes and Firm Size, Journal of Accounting and Economics 5, 119-49.