do patients have a worse outcome with heart failure than
TRANSCRIPT

1
Do patients have a worse outcome with heart failure than cancer? A primary
care based cohort study with 10-year follow-up in Scotland
Short title: Outcomes in heart failure and cancer
Mamas A. Mamas1,2, Matthew Sperrin2, Margaret C. Watson3, Alasdair Coutts4, Katie
Wilde4, Christopher Burton5, Umesh T. Kadam6, Chun Shing Kwok1,7, Allan B
Clark8, Peter Murchie5, Iain Buchan2, Philip C Hannaford5, Phyo K. Myint7
1. Keele Cardiovascular Research Group, University of Keele, Stoke-on-Trent; Royal
Stoke Hospital, University Hospital North Midlands, Stoke-on-Trent, UK.
2. Farr Institute, University of Manchester, Manchester, UK.
3. School of Pharmacy and Pharmacology, University of Bath, Bath, BA2 7AY
4. Research Applications and Data Management Team, IT Services, University of
Aberdeen, Polwarth Building, Foresterhill, Aberdeen, AB25 2ZD.
5. Centre of Academic Primary Care, Institute of Applied Health Sciences, University
of Aberdeen, Aberdeen, AB25 2ZD.
6. Institute of Science and Technology in Medicine, University of Keele, Stoke-on-
Trent, UK.
7. Institute of Applied Health Sciences, University of Aberdeen, Aberdeen, AB25
2ZD.
8. Norwich Medical School, University of East Anglia, Norfolk, UK.
Corresponding author:
Mamas A. Mamas
Professor of Cardiology
Keele Cardiovascular Research Group
University of Keele
Stoke-on-Trent, United Kingdom
Email: [email protected]

2
Abstract
Aims: To evaluate whether the survival rates of patients with heart failure (HF) in the
community are better than those with a diagnosis of the 4 most common cancers in
men and women in a contemporary primary care cohort in Scotland.
Methods and Results: The data were obtained from the Primary Care Clinical
Informatics Unit from a database of 1.75 million people registered with 393 general
practices in Scotland. Sex-specific survival modeling was undertaken using Cox
proportional hazards models, adjusted for potential confounders. A total of 56,658
patients were eligible to be included in the study with 147,938 person years follow up
(median follow up 2.04 years). In men, heart failure (reference group; 5yrs survival
37.7%) had worse mortality outcomes than patients with prostate cancer (HR 0.61,
95%CI 0.57-0.65; 5yrs survival 49.0%), and bladder cancer (HR 0.88, 95%CI 0.81-
0.96; 5yrs survival 36.5%), but better than lung cancer (HR 3.86, 95%CI 3.65-4.07;
5yrs survival 2.8%) and colorectal cancer (HR 1.23 95%CI 1.16-1.31; 5 yrs survival
25.9%). In women, patients with HF (reference group; 5yrs survival 31.9%) had
worse mortality outcomes than patients with breast cancer (HR 0.55 95%CI 0.51-
0.59; 5yrs survival 61.0%), but better outcomes than lung cancer (HR 3.82, 95%CI
3.60-4.05; 5yrs survival 3.6%), ovarian cancer (HR 1.98, 95%CI 1.80-2.17; 5yrs
survival 19%) and colorectal cancer (HR 1.21, 95%CI 1.13-1.29; 5yrs survival
28.4%).
Conclusions: Despite advances in management, heart failure remains as ‘malignant’
as some of the common cancers in both men and women.

3
Keywords:
Heart failure
Cancer
Mortality

4
Introduction
Cardiovascular disease is the commonest cause of death globally, accounting
for an estimated 17.5 million deaths in 2012 – around a third of all deaths worldwide.1
Heart failure (HF) represents the end phenotype of many cardiovascular disorders and
has a prevalence of around 1-2% in the general population, rising to >10% in
individuals aged 70 years or older. HF is also the commonest cause of hospitalization
in the over 65s.2 Advances in pharmacological and intra-cardiac device based
therapies have reduced mortality rates in patients with heart failure by as much as
50% over the past decade, but both short and long term mortality rates remain
significant.3-5 The adverse outcomes associated with heart failure have drawn
comparisons to those of cancer amongst many commentators, including international
cardiological societies.7
Collectively cancer is the second leading cause of morbidity and mortality
worldwide, with approximately 14 million new cases and 8.2 million cancer-related
deaths in 2012.8 As with cardiovascular disease, improved treatments over recent
decades have reduced mortality rates from many cancers.5, A previous comparative
analysis of patients with a first admission to Scottish hospitals in the UK in 1991 with
HF and the four most common types of cancer specific to men and women, suggested
that, with the exception of lung and ovarian cancer, HF had a similar or worse five-
year survival rate than the remaining cancers.9 A comparable analysis of over 1.1
million hospital admissions in Sweden from 1998-2004 reported similar findings.5
Important limitations of these findings include the observation that a first
hospital admission for many cancers frequently relates to elective surgery or
investigations 5, whilst that for HF often represents an acute heart failure syndrome.
These differences will bias survival comparisons towards worse outcomes for HF.
Furthermore, until now, there has been no attempt to adjusted for comorbid burden,5,9
which has been increasingly recognised as important confounding factor in this
patient population that could substantially affect survival.
Finally, whilst improved survival rates have been reported for patients
diagnosed with HF and for many cancers over the past decade, that may have
occurred at different rates in diagnostic groups, past comparisons, therefore, may no
longer hold. In view of limitations of the previous studies highlighted above, it is
possible that the survival rates of patients with heart failure in the community are
significantly better than those with a diagnosis of cancer in contemporary practice,

5
particularly when differences in co-morbid burden are taken into account. We report
here an analysis of outcome in patients in care cohorts derived from a national
primary care database in Scotland to investigate whether the often quoted “HF is as
malignant as cancer” still holds in contemporary practice.
Methods
Study Design and Setting
The data for this study were obtained from the Primary Care Clinical
Informatics Unit (PCCIU).10,11 In brief, PCCIU was founded in 1999 to feedback
information to practices about aspects of clinical care as part of Royal College of
General Practitioners Scotland Programme of Clinical Improvement and
Effectiveness (SPICE). The work involved collecting anonymized clinical
information bi-annually between 2000 and 2011 from 393 practices across Scotland
caring for about a third of the Scottish population with data from 1.75 million patients
and are representative of the Scottish population with a similar spread of age, gender,
material deprivation and rurality.12
We carried out a retrospective analysis of PCCIU cohort; our population was
all adults aged 16 years or older with an incident diagnosis of either heart failure or a
cancer between 1 April 2002 and 31st March 2011 (the last update of the PCCIU
dataset). The first three years of PCCIU (1 April 1999 – 30 March 2002) were used to
mitigate the risk of including prevalent cases: patients with diagnosis codes for either
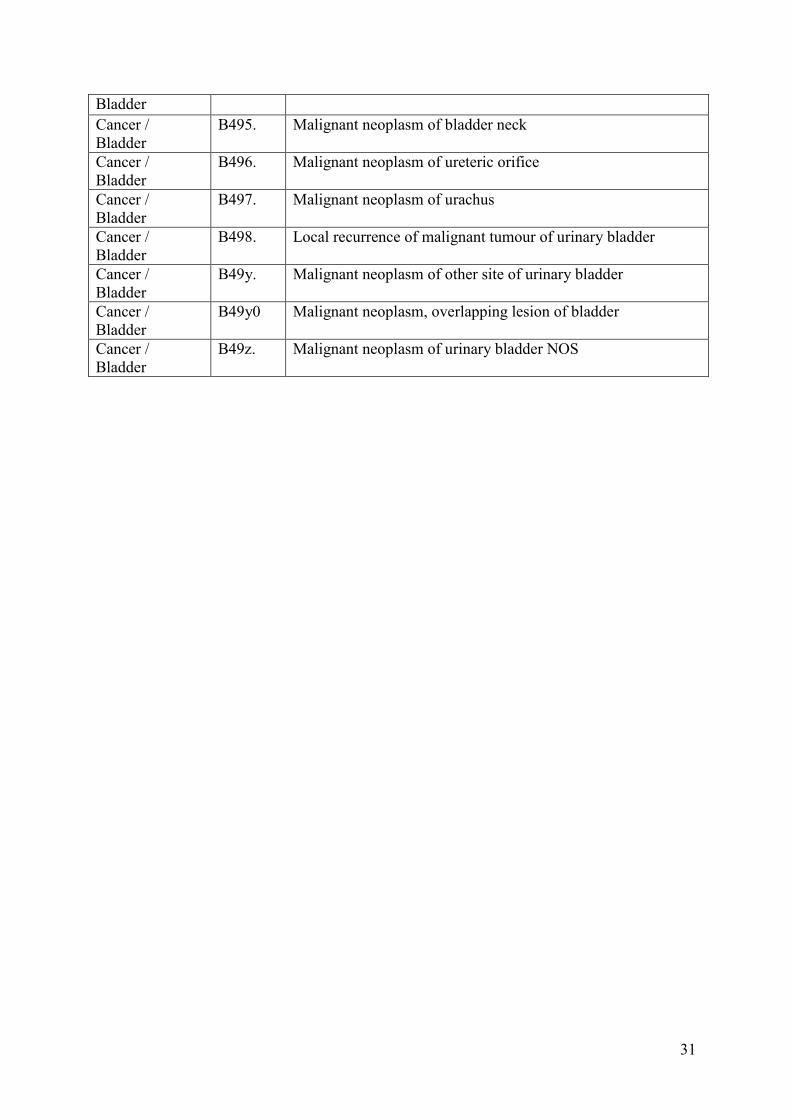
heart failure or cancer in this period were excluded. Included cancers were restricted
to the four most common by gender: prostate, lung, colorectal and bladder cancer for
men; breast, colorectal, lung and ovarian cancer for women. The Read codes (the
clinical coding system used in UK general practice to record patient diagnoses and
procedures in health-care IT systems) for these diagnoses are given in
Supplementary Tables 1A and 1B. The primary exposure was first entry of the
diagnosis of HF or cancer type on the healthcare record, and date of diagnosis was the
index date. Patients with both a HF and cancer diagnosis present were assigned to the
cohort of patients with whichever diagnosis was made first. When possible, we based
our morbidity definitions on Quality Outcomes Framework (QOF)
(http://qof.digital.nhs.uk/) business rules13 and read code groups for long-term
disorders (as defined by NHS Scotland).14 QOF is the world’s largest pay-for-
performance programme. It was introduced for all family practices in 2004, linking up

6
to 25% of family practitioners’ income to performance for more than 100 publicly
reported quality indicators relating to management of chronic disease, organisation of
care, and patient experience. A significant proportion of a family practitioners income
will depend on maintaining a register of patients with a particular diagnosis (such as
HF and cancer diagnosis) and will also relate to the proportion of such patients that
receive evidence based care.
The primary outcome was survival time to all-cause mortality. Potential
confounders that we accounted for included: age at index diagnosis (continuous
variable), material deprivation (Scottish index of material deprivation, in quintiles
with 1= least deprived and 5 = most deprived), rurality (urban/rural index, 6 levels,
with 1 representing most urban and 6 remote rural), smoking, comorbidities (before
index date only). These confounders were treated as ever/never terms – i.e. they were
not time-varying. Comorbidities were initially selected and derived from READ codes
following Barnett et al.10 A shortlist of these (Hypertension, Depression, Asthma,
Coronary Heart Disease, Diabetes, Thyroid disease, Rheumatoid Arthritis, COPD,
Stroke or TIA, Chronic Kidney Disease, Atrial Fibrillation, Peripheral Vascular
Disease, Epilepsy, Dementia, Schizophrenia, Bronchiectasis, Parkinsons Disease,
Multiple Sclerosis, Viral Hepatitis, Chronic Liver Disease, Previous Myocardial
Infarction) was then used for subsequent modeling. Comorbidities diagnosed after the
index date, and all medications for HF (diuretics, aldosterone receptor antagonists,
beta blockers, ACE-inhibitors, angiotensin receptor blockers, anti-platelets and lipids)
were not considered in multivariable models (Supplementary Table 2). Data cleaning
included removal of patients with missing information on deprivation and rurality,
and logical conflicts in dates of recorded events. Imputation of deprivation and
rurality was considered but the proportion of patients missing these fields was low
(1.94%) and it was felt reasonable to assume that these fields were missing
completely at random. The majority of the clinical variables were binary indicators of
presence of a clinical code; the associated condition or medication was assumed to be
absent if the code was absent.
Statistical Methods
Descriptive statistics were presented as means with standard deviations, or
proportions; these were stratified first by gender and then by primary exposure. These
were compared between exposure groups using ANOVA (to compare means) or Chi

7
squared tests (to compare proportions), with the P-values reported. The number of
comorbidities was compared between disease groups graphically; survival was
compared between groups using Kaplan-Meier plots.
Sex-specific survival modeling was carried out using Cox proportional
hazards models. Three models were considered: first a univariable model with the
primary diagnosis only; second a model corrected for demographic variables of age
and deprivation; and finally a fully adjusted model that corrected for all confounders
described above - i.e. age, deprivation, rurality, smoking, and all of the comorbidities
described above that were diagnosed before baseline. Many of these confounders
described may be highly correlated, which may make their effect sizes and standard
errors difficult to interpret. However, we do not make any inference about these. We
did not correct for any medications, as these may act as mediators. Continuous
variables such as age were treated as linear. The proportional hazards assumption was
checked using Schoenfeld residuals.15 All analyses were carried out using R version
3.0.2.16
Results
A total of 58,412 patients met the study inclusion criteria from a database of
1.75 million people registered with 393 medical practices in Scotland. Following
exclusions of 1754 patients; 3.0% (1119 patients with missing deprivation data and
635 patients in which date of death was the date of diagnosis, or could not establish
date of loss to follow up) the final dataset comprised 56,658 patients. There were
28,064 men and 28,594 women and mean age at first diagnosis was 69.16 (SD 12.76)
years. Median follow-up was 2.04 years and there were 147,938 person years in total.
There were 6,795 men with prostate, 4,693 lung, 4,239 colorectal and 2,028 bladder
cancer, and 10,309 with heart failure. Among the women, 10,760 had breast, 3,610
colorectal, 3,859 lung and 1,234 ovary cancer, and 9,131 heart failure.
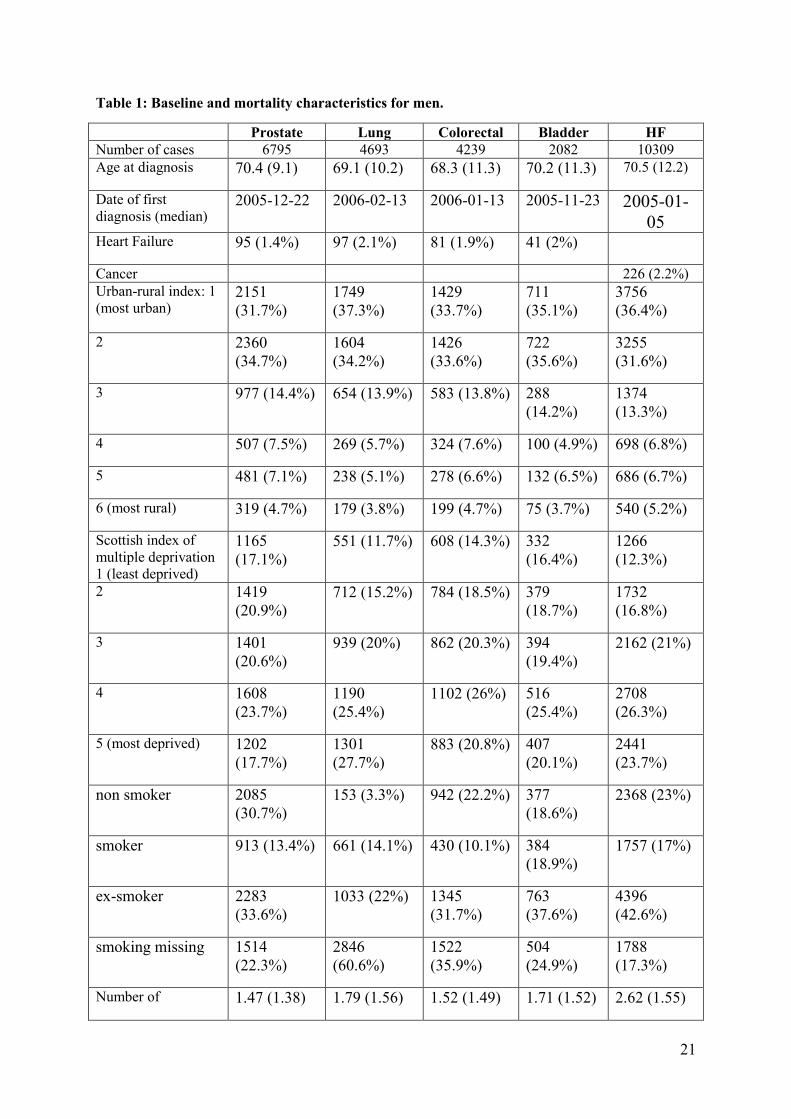
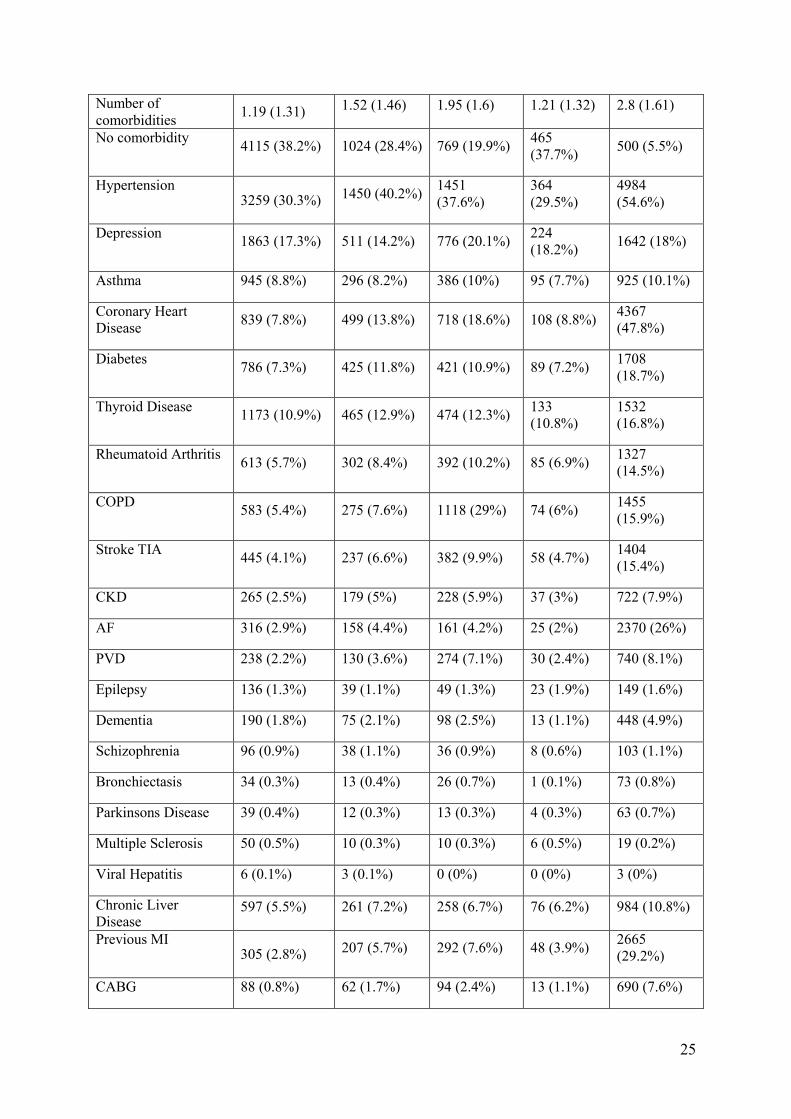
Descriptive sample characteristics are presented in Table 1 for men and Table
2 for women. In men, the age at cancer and heart failure diagnoses were similar whilst
in women heart failure diagnosis occurred later in life than cancer. Patients with heart
failure, both men and women, had more comorbidities than those with cancer; only
5.5% of heart failure patients of either gender, had no comorbidity, compared with 20
to 38% of patients with a diagnosis of cancer. The mean number of comorbid
conditions was also greater in patients with heart failure compared to those patients

8
diagnosed with cancer. Male patients with heart failure had a mean number of
comorbidities of 2.62 (SD 1.55), whilst in patients diagnosed with prostate cancer
(mean 1.47, SD 1.38), lung (1.79, SD 1.56), colorectal (1.52, SD 1.49) and bladder
cancer (mean 1.71, SD 1.52) mean number of comorbidities were less. Similar
observations were recorded in women with mean comorbidity number greater in
patients diagnosed with heart failure (2.8, SD 1.61) than breast (1.19, SD 1.31),
colorectal (1.52, SD 1.46), lung (1.95, SD 1.6) and ovarian cancer (1.21, SD 1.32).
The number of comorbidities at index date in each disease and gender group is shown
in Figures 1a and 1b.
30-day, one-year and five-year crude mortality rates are also presented in
Tables 1 and 2. The largest crude mortality rates occurred in patients with lung
cancer, with 8.7% of men and 9.3% of women dying within 30 days. The lowest
crude mortality rates were recorded in women diagnosed with breast cancer (0.5%)
and men diagnosed with prostate cancer. 30 day mortality rates for men following
diagnosis with heart failure were 1.5% and 2.2% for women whilst at 1 year mortality
rates were 14.5% and 17.7% respectively.
Kaplan-Meier plots for overall survival in years since diagnosis are presented
in Figure 2. The main Cox proportional hazards model results are presented in Table
3. Men with prostate (HR 0.61 95% CI 0.57-0.65, P<0.001) or bladder cancer (HR 0.88
95% CI 0.81-0.96), P<=0.005) had better survival than those with heart failure, while
those with lung (HR 3.86 95% CI 3.65-4.07), P<0.001) or colorectal cancer (HR 1.23
95% CI 1.16-1.31, P<0.001) generally fared worse. Women with breast cancer (HR 0.55
95% CI 0.51-0.59, P<0.001) had better survival than those with heart failure, while
those with lung (HR 3.82 95% CI 3.60-4.05, P<0.001), ovarian (HR 1.98 95% CI 1.80-
2.17, P<0.001) or colorectal cancer (1.21 95% CI 1.13-1.29, P<0.001) fared worse.
All models showed some deviation from proportional hazards. Deviations still
existed in the fully corrected models, but were minor and so should not affect the
interpretation of the results (see Supplementary Table 3A and 3B).

9
Discussion
Our analysis is the first to compare survival outcomes in a primary care setting
of patients with a diagnosis of heart failure and the 4 most common cancers in men
and women in a contemporary cohort of patients treated with current evidence based
practice that has changed dramatically over the two decades since the older studies
first reported outcomes following first time hospital admission with a diagnosis of
heart failure or cancer. Despite advances in care, we found that men and women with
a diagnosis of heart failure continue to have a worse survival than patients with one of
several common cancers. Our findings are particularly relevant given that the current
analysis overcomes many of the limitations of previous work particularly around
admission bias for different conditions and differences in co-morbid burden between
the patients with HF and cancer.
Advances in both the medical and device based treatments, have been
associated with improved survival rates in patients with HF in many17-20 but not all
national registry-based studies.21 Age-standardized death rates from heart failure have
been reported to decrease by 40% in seven European countries between 1987 and
2008.4 An analysis of all patients in Scotland hospitalised with a first episode of heart
failure between 1986 and 2003 demonstrated relative declines in short- and medium-
term case-fatality rates of 40-50% in men and 20-25% in women; changes associated
with significant increases in ACE inhibitor and beta blocker use over this period.17
There are limited data regarding longer-term outcomes of incident heart
failure in the community. Our analysis suggests that mortality rates in patients with
this condition remain significant. Our observed 1- and 5-year mortality rates of 13%
and 35% respectively in males, and 15% and 40% in females from time of first
recorded diagnosis of HF are lower than mortality rates recorded following an acute
admission to hospital for HF,22,23 probably because the latter population comprise a
sicker cohort. Our mortality rates were similar to the 5-year mortality rate of 38%
reported in a contemporary community cohort derived assembled in Ireland following
a new diagnosis of HF.24 Similarly, the ECHOES community based screening study,
reported 5-year mortality rates of 38% for those with HF with preserved ejection
fraction (HFPEF), and 47% with HF with reduced ejection fraction (HFREF)25
although this was a cross sectional analysis and did not report on survival from time
of diagnosis. Similarly data derived from Olmsted County reported a 5-year survival
of 45%, but again was a cross-sectional survival analysis from the time of initiation of
10
the study rather than the time of diagnosis of HF introducing bias towards worse
outcomes.26
HF survival rates, and that of many cancers, have improved over the past
decade, but these improvements have occurred at different rates in HF and cancer
populations. For example, an analysis by Stewart et al. of hospital admissions from
Sweden5 suggested that survival rates for heart failure admissions had improved by a
greater margin each calendar year than those observed for the cancers studied. Whilst
our analysis is not subject to many of the limitations of previous analyses such as
admission bias and failure to adjust for type and number of comorbidities,5,9 our
findings are remarkably similar to those reported initially by Stewart et al9 and
subsequently from hospital admission data derived from Sweden.5 This suggests that
even in a more contemporaneous cohort (by at least a decade) a diagnosis of HF
remains as ‘malignant’ as that of some cancers. Our findings were broadly consistent
when the data were stratified by comorbid burden and age of diagnosis.
The burden of comorbidity among patients with HF is significant.27 Only 3%
of patients with HF have no recorded comorbidity whilst up to a third of patients with
a cancer diagnosis had no comorbid conditions documented in their medical record.
The number of comorbidities among patients with heart failure appeared to be similar
in both sexes despite the average age at diagnosis for women with HF being 6 years
older than that of men. Previous studies have also reported a significant comorbid
burden in patients with HF and its presence is independently associated with
increased mortality.28,29 This burden appears to have increased over time.29 In the
cardiovascular network PRESERVE study undertaken between 2005-2008, less than
2% of HF patients had no comorbid conditions,30 whilst data derived from the
Spanish National Heart Failure Registry suggests that only 15% of patients with HF
have no comorbidity28 whilst only 4% individuals with HF in a Medicare dataset of
122,630 patients had no non-cardiac comorbid conditions and 40% had five or more
such comorbidities.31 It is not surprising that the burden of CV comorbidities is
greatest in patients with HF given that many of them, such as diabetes mellitus,
hypertension and coronary artery disease are risk factors for the future development
of HF.32 In contrast, studies of patients with cancer suggest that comorbid burden is
significantly less. For instance, perhaps only half of all lung cancer patients have
comorbidities33 with even less in those with breast 34 ovarian or uterine cancers.34

11
Our data suggest that the burden of CV disease in patients with a diagnosis of
cancer is also significant, with: 20% of men with a common cancer also having a
diagnosis of coronary artery disease; 10-20% of either gender diagnosed with
diabetes; significant rates of previous strokes or transient ischaemic attacks,
particularly in men; and hypertension prevalence varying from between 30-45% in
both genders. Previous registry-based studies have also reported significant CV
comorbidity in patients with lung and prostate cancer.35,36 CV comorbidity and
estimated CV risk have been independently associated with worse outcomes in
patients with lung and breast cancer.35,37
Our study also has several limitations. First, we relied on primary care coding
to identify the study cohort, with no validation of the codes. Like all other
observational research undertaken using data derived from electronic health care
records, PCCIUR relies on clinicians’ observations and entry of relevant codes into
electronic healthcare records, which may be an incomplete or an inaccurate
representation of patients’ health. Whilst diagnoses of cancer are generally made by
specialists based on imaging or biopsy information and hence robust, diagnoses of
heart failure may be clinical in the first instance and may be less robust particularly in
the presence of obesity or other conditions associated with dyspnea and edema.
However the diagnosis of heart failure is well recorded in the United Kingdom
primary care electronic healthcare records because it is an important part of the
Quality and Outcomes Framework pay-for-performance scheme which includes
maintenance of register of patients with a diagnosis of heart failure, and in such
patients records the percentage of patients with a diagnosis of heart failure which has
been confirmed by an echocardiogram or by specialist assessment 3 months before or
12 months after entry onto the register. In Scotland, the percentage of patients with a
diagnosis of heart failure (diagnosed on or after 1 April 2006) which has been
confirmed by an echocardiogram or by specialist assessment 3 months before or 12
months after entering on to the register is over 95%38 suggesting that the diagnosis of
heart failure is robust. Furthermore, the associated risk factor profile and survival
rates among the heart failure and cancer cohort are in line with those reported in the
literature for incident HF and cancer in the community. Second, whilst we were able
to report on outcomes associated with a heart failure diagnosis we were unable to
differentiate between heart failure with reduced ejection fraction (HFREF) or heart
failure with preserved ejection fraction (HFPEF). Previous studies have suggested that
12
patients with HFREF have similar39 or worse short- and long-term mortality outcomes
compared to those patients with HFPEF40 hence the comparative outcomes of HFREF
or HFPEF with those of patients with a cancer diagnosis may be different. Third,
whilst our analysis captures the diagnosis of cancer in the primary care health record,
it does not provide information relating to the stage of cancer, whether the cancer is
under remission, whether the cancer was “cured”, or what cancer-related treatments
were given. Finally, in order to reduce the risk of length time bias and exclude
prevalent cases of HF or cancer, patients with diagnosis codes for either heart failure
or cancer during the first three years of PCCIU (1 April 1999 – 30 March 2002) were
excluded and only those patients registered with the practice for at least 3 months
prior to their index diagnosis date were included. Nevertheless, we cannot exclude the
possibility of non-incident cases of either HF or cancer included in the cohort studied,
although numbers would be small.
In conclusion, the current report of over 147,938 person years of observation,
is the first to compare survival outcomes in a primary care setting of patients with a
diagnosis of heart failure and the four most common cancers in men and women
separately. It has revealed that despite advances in management, heart failure remains
as ‘malignant’ as some common cancers. Our results highlight the significant multi-
morbidity associated with heart failure that will represent a significant challenge for
delivery of healthcare in the future, particularly as the burden of heart failure
continues to grow. Targeted management of the co-morbidities that are common in
heart failure patient population may be associated with better survival and quality of
life in this patient population.
13
Contributorship
MAM and PKM conceived the study and developed study protocol and
analysis plan in collaboration with PCCIU Academic Team (MW, CB, PM, PH), Data
management team of PCCIU (KW, AC), Medical Statistics Group at University of
East Anglia (ABC) and the Farr Institute (MS, IB). Record linkage was performed by
KW & AC. MS analysed the data. MAM drafted the paper. All authors contributed in
interpretation of results and in making an important intellectual contribution to the
manuscript. PKM and MAM are guarantors.
Acknowledgments
None.
Funding sources
MS and IB were supported by the University of Manchester's Health eResearch
Centre (HeRC) funded by the Medical Research Council (MRC) Grant
MR/K006665/1.
Conflicts of interest
The authors have no conflicts of interest to declare.

14
References
1. World Health Organization. WHO Global status report on noncommunicable
diseases 2014. 2014; Available from:
http://www.who.int/nmh/publications/ncd-status-report-2014/en/.
2. Mosterd A, Hoes AW. Clinical epidemiology of heart failure. Heart
2007;93:1137-46.
3. Gabet A, Juilliere Y, Lamarche-Vadel A, Vernay M, Olie V. National trends
in rate of patients hospitalized for heart failure and heart failure mortality in
France, 2000-2012. Eur J Heart Fail 2015;17:583-90.
4. Laribi S, Aouba A, Nikolaou M, Lassus J, Cohen-Solal A, Plaisance P,
Pavillion G, Jois P, Fonarow GC, Jougla E, Mebazza A. Trends in death
attributed to heart failure over the past two decades in Europe. Eur J Heart Fail
2012;14:234-9.
5. Stewart S, Ekman I, Ekman T, Oden A, Rosengren A. Population impact of
heart failure and the most common forms of cancer: a study of 1 162 309
hospital cases in Sweden (1988 to 2004). Circ Cardiovasc Qual Outcomes.
2010;3:573-80.
6. Jaarsma T, Beattie JM, Ryder M, Rutten FH, McDonagh T, Mohacsi P,
Murray SA, Grodzicki T, Bergh I, Metra M, Ekman I, Angermann C,
Leventhal M, Pitsis A, Anker SD, Gavazzi A, Ponikowski P, Dickstein K,
Delacretaz E, Blue L, Strasser F, McMurray J. Palliative care in heart failure:
a position statement from the palliative care workshop of the Heart Failure
Association of the European Society of Cardiology. Eur J Heart Fail
2009;11:433-43.
7. World Health Organization. Cancer Fact sheet No 297. 2015; Available from:
`http://www.who.int/mediacentre/factsheets/fs297/en/.
8. Allemani C, Weir HK, Carreira H, Harewood R, Spika D, Wang XS, Bannon
F, Ahn JV, Johnson CJ, Bonaventure A, Marcos-Gragera R, Stiller C,
Azevedo e Silva G, Chen WQ, Ogunibyi OJ, Rachet B, Soeberg MJ, You H,
Matsuda T, Bielska-Lasota M, Storm H, Tucker TC, Coleman MP. Global
surveillance of cancer survival 1995-2009: analysis of individual data for
25,676,887 patients from 279 population-based registries in 67 countries
(CONCORD-2). Lancet 2015;385:977-1010.
9. Stewart S, MacIntyre K, Hole DJ, Capewell S, McMurray JJ. More 'malignant'
than cancer? Five-year survival following a first admission for heart failure.
Eur J Heart Fail 2001;3:315-22.

15
10. Barnett K, Mercer SW, Norbury M, Watt G, Wyke S, Guthrie B.
Epidemiology of multimorbidity and implications for health care, research,
and medical education: a cross-sectional study. Lancet 2012;380:37-43.
11. Macfarlane TV, Lefevre K, Watson MC. Aspirin and non-steroidal anti-
inflammatory drug use and the risk of upper aerodigestive tract cancer. Br J
Cancer 2014;111:1852-9.
12. Elder R, Kirkpatrick M, Ramsay W, Macleod M, Guthrie B, Sutton M, Watt
G. Measuring Quality in Primary Medical Services Using Data from SPICE.
NHS National Services Scotland: Edinburgh, Scotland; 2007.
13. NHS—Primary Care Commissioning. QOF implementation: business rules v
16.0, updated December 2009. http://www.pcc.nhs.uk/145/
14. Information Services Division, NHS National Services Scotland. Measuring
long-term conditions in Scotland, June 2008.
http://www.isdscotland.org/isd/5658.html
15. Grambsch PM, Therneau TM. Proportional hazards tests and diagnostics
based on weighted residuals. Biometrika [Internet] 1994;81:515-526.
16. R Core Team. R: A Language and Environment for Statistical Computing.
Vienna, Austria: 2015. Available from: http://www.r-project.org.
17. Jhund PS, Macintyre K, Simpson CR, Lewsey JD, Stewart S, Redpath A,
Chalmers JW, Capewell S, McMurray JJ. Long-term trends in first
hospitalization for heart failure and subsequent survival between 1986 and
2003: a population study of 5.1 million people. Circulation 2009;119:515-23.
18. Zarrinkoub R, Wettermark B, Wandell P, Mejhert M, Szulkin R, Ljunggren G,
Kahan T. The epidemiology of heart failure, based on data for 2.1 million
inhabitants in Sweden. Eur J Heart Fail 2013;15:995-1002.
19. Christ M, Stork S, Dorr M, Heppner HJ, Muller C, Wachter R, Riemer U.
Heart failure epidemiology 2000-2013: insight from the German Federal
Health Monitoring System. Eur J Heart Fail 2016;18:1009-18.
20. Schmidt M, Ulrichsen SP, Pedersen L, Botker HE, Sorensen HT. Thirty-year
trends in heart failure hospitalization and mortality rates and the prognostic
impact of co-morbidity: a Danish nationwide cohort study. Eur J Heart Fail
2016;18:490-9.
21. Teng TH, Katzenellenbogen JM, Hung J, Knuiman M, Sanfilippo FM,
Geelhoed E, Bessarab D, Hobbs M, Thompson SC. A cohort study: temporal
trends in prevalence of antecedents, comorbidities and mortality in Aboriginal
and non-Aboriginal Australians with first heart failure hospitalization, 2000-
2009. Int J Equity Health 2015;14:66.

16
22. Coles AH, Tisminetzky M, Yarzebski J, Lessard D, Gore JM, Darling CE,
Golberg RJ. Magnitude of and Prognostic Factors Associated With 1-Year
Mortality After Hospital Discharge for Acute Decompensated Heart Failure
Based on Ejection Fraction Findings. J Am Heart Assoc 2015;4:e0002303.
23. Chang PP, Chambless LE, Shahar E, Bertoni AG, Russell SD, Ni H, He M,
Mosley TH, Wagenknecht LE, Samadarshi TE, Wruck LM, Rosamond WD.
Incidence and survival of hospitalized acute decompensated heart failure in
four US communities (from the Atherosclerosis Risk in Communities Study).
Am J Cardiol 2014;113:504-10.
24. James S, Barton D, O'Connell E, Voon V, Murtagh G, Watson C, Murphy T,
Prendiville B, Brennan D, Hensey M, O’Neill L, O’Hanlon R, Waterhouse D,
Ledwidge M, Gallagher J, McDonald K. Life expectancy for community-
based patients with heart failure from time of diagnosis. Int J Cardiol
2015;178:268-74.
25. Hobbs FD, Roalfe AK, Davis RC, Davies MK, Hare R, Midlands Research
Practices C. Prognosis of all-cause heart failure and borderline left ventricular
systolic dysfunction: 5 year mortality follow-up of the Echocardiographic
Heart of England Screening Study (ECHOES). Eur Heart J 2007;28:1128-34.
26. Henkel DM, Redfield MM, Weston SA, Gerber Y, Roger VL. Death in heart
failure: a community perspective. Circ Heart Fail 2008;1:91-7.
27. Triposkiadis F, Giamouzis G, Parissis J, Starling RC, Boudoulas H,
Skoulargis J, Butler J, Filippatos G. Reframing the association and
significance of co-morbidities in heart failure. Eur J Heart Fail 2016;18:744-
58.
28. Ruiz-Laiglesia FJ, Sanchez-Marteles M, Perez-Calvo JI, Formiga F,
Bartolome-Satue JA, Armengou-Arxe A, Lopez-Quiros R, Perez-Silvestre J,
Serrado-Iglesias A, Montero-Perez-Barguero M. Comorbidity in heart failure.
Results of the Spanish RICA Registry. QJM 2014;107:989-94.
29. Blecker S, Paul M, Taksler G, Ogedegbe G, Katz S. Heart failure-associated
hospitalizations in the United States. J Am Coll Cardiol 2013;61:1259-67.
30. Saczynski JS, Go AS, Magid DJ, Smith DH, McManus DD, Allen L, Ogarek
J, Goldberg RJ, Gurwitz JH. Patterns of comorbidity in older adults with heart
failure: the Cardiovascular Research Network PRESERVE study. J Am
Geriatr Soc 2013;61:26-33.
31. Braunstein JB, Anderson GF, Gerstenblith G, Weller W, Niefeld M, Herbert
R, Wu AW. Noncardiac comorbidity increases preventable hospitalizations
and mortality among Medicare beneficiaries with chronic heart failure. J Am
Coll Cardiol 2003;42:1226-33.
17
32. Kannel WB. Epidemiology and prevention of cardiac failure: Framingham
Study insights. Eur Heart J. 1987;8 Suppl F:23-6.
33. Kehl KL, Lamont EB, McNeil BJ, Bozeman SR, Kelley MJ, Keating NL.
Comparing a medical records-based and a claims-based index for measuring
comorbidity in patients with lung or colon cancer. J Geriatr Oncol 2015;6:202-
10.
34. Sarfati D, Gurney J, Stanley J, Salmomd C, Crampton P, Dennett E, Koea J,
Pearce N. Cancer-specific administrative data-based comorbidity indices
provided valid alternative to Charlson and National Cancer Institute Indices. J
Clin Epidemiol 2014;67:586-95.
35. Kravchenko J, Berry M, Arbeev K, Kim Lyerly H, Yashin A, Akushevich I.
Cardiovascular comorbidities and survival of lung cancer patients: Medicare
data based analysis. Lung Cancer 2015;88:85-93.
36. Gandaglia G, Sun M, Popa I, Schiffmann J, Trudeau V, Shariat SF, Trinh QD,
Graefen M, Widmer H, Saad F, Briganti A, Montorsi F, Karakiewicz PI.
Cardiovascular mortality in patients with metastatic prostate cancer exposed to
androgen deprivation therapy: a population-based study. Clin Genitourin
Cancer 2015;13:e123-30.
37. Onwudiwe NC, Kwok Y, Onukwugha E, Sorkin JD, Zuckerman IH, Shaya
FT, Danial Mullins C. Cardiovascular event-free survival after adjuvant
radiation therapy in breast cancer patients stratified by cardiovascular risk.
Cancer Med 2014;3:1342-52.
38. QOF database. Data for HF002. Available at:
https://www.gpcontract.co.uk/child/UK/HF002/15
39. Quiroz R, Doros G, Shaw P, Liang CS, Gauthier DF, Sam F. Comparison of
characteristics and outcomes of patients with heart failure preserved ejection
fraction versus reduced left ventricular ejection fraction in an urban cohort.
Am J Cardiol 2014;113:691-6.
40. Meta-analysis Global Group in Chronic Heart F. The survival of patients with
heart failure with preserved or reduced left ventricular ejection fraction: an
individual patient data meta-analysis. Eur Heart J 2012;33:1750-7.

18
Figure Legends
Figure 1a and b: Number of comorbidities by disease group and gender.
Figure 2: Kaplan-Meier curves of overall survival, separated by gender.

19
Figure 1a and b: Number of comorbidities by disease group and gender.

20
Figure 2: Kaplan-Meier curves of overall survival, separated by gender.
21
Table 1: Baseline and mortality characteristics for men.
Prostate Lung Colorectal Bladder HF
Number of cases 6795 4693 4239 2082 10309 Age at diagnosis 70.4 (9.1) 69.1 (10.2) 68.3 (11.3) 70.2 (11.3) 70.5 (12.2)
Date of first
diagnosis (median) 2005-12-22 2006-02-13 2006-01-13 2005-11-23 2005-01-
05
Heart Failure 95 (1.4%) 97 (2.1%) 81 (1.9%) 41 (2%)
Cancer 226 (2.2%)
Urban-rural index: 1
(most urban) 2151
(31.7%)
1749
(37.3%)
1429
(33.7%)
711
(35.1%)
3756
(36.4%)
2 2360
(34.7%)
1604
(34.2%)
1426
(33.6%)
722
(35.6%)
3255
(31.6%)
3 977 (14.4%) 654 (13.9%) 583 (13.8%) 288
(14.2%)
1374
(13.3%)
4 507 (7.5%) 269 (5.7%) 324 (7.6%) 100 (4.9%) 698 (6.8%)
5 481 (7.1%) 238 (5.1%) 278 (6.6%) 132 (6.5%) 686 (6.7%)
6 (most rural) 319 (4.7%) 179 (3.8%) 199 (4.7%) 75 (3.7%) 540 (5.2%)
Scottish index of
multiple deprivation
1 (least deprived)
1165
(17.1%)
551 (11.7%) 608 (14.3%) 332
(16.4%)
1266
(12.3%)
2 1419
(20.9%)
712 (15.2%) 784 (18.5%) 379
(18.7%)
1732
(16.8%)
3 1401
(20.6%)
939 (20%) 862 (20.3%) 394
(19.4%)
2162 (21%)
4 1608
(23.7%)
1190
(25.4%)
1102 (26%) 516
(25.4%)
2708
(26.3%)
5 (most deprived) 1202
(17.7%)
1301
(27.7%)
883 (20.8%) 407
(20.1%)
2441
(23.7%)
non smoker 2085
(30.7%)
153 (3.3%) 942 (22.2%) 377
(18.6%)
2368 (23%)
smoker 913 (13.4%) 661 (14.1%) 430 (10.1%) 384
(18.9%)
1757 (17%)
ex-smoker 2283
(33.6%)
1033 (22%) 1345
(31.7%)
763
(37.6%)
4396
(42.6%)
smoking missing 1514
(22.3%)
2846
(60.6%)
1522
(35.9%)
504
(24.9%)
1788
(17.3%)
Number of 1.47 (1.38) 1.79 (1.56) 1.52 (1.49) 1.71 (1.52) 2.62 (1.55)

22
comorbidities
No comorbidity 1949
(28.7%)
1116
(23.8%)
1278
(30.1%)
499
(24.6%)
562 (5.5%)
Hypertension 2614
(38.5%)
1515
(32.3%)
1596
(37.7%)
801
(39.5%)
4711
(45.7%)
Depression 603 (8.9%) 464 (9.9%) 358 (8.4%) 190 (9.4%) 1068
(10.4%)
Asthma 491 (7.2%) 355 (7.6%) 286 (6.7%) 124 (6.1%) 788 (7.6%)
Coronary Heart
Disease 1303
(19.2%)
1091
(23.2%)
817 (19.3%) 488
(24.1%)
6295
(61.1%)
Diabetes 688 (10.1%) 562 (12%) 611 (14.4%) 314
(15.5%)
2234
(21.7%)
Thyroid Disease 202 (3%) 139 (3%) 109 (2.6%) 68 (3.4%) 480 (4.7%)
Rheumatoid Arthritis 584 (8.6%) 358 (7.6%) 382 (9%) 187 (9.2%) 1209
(11.7%)
COPD 611 (9%) 1241
(26.4%)
390 (9.2%) 237
(11.7%)
1707
(16.6%)
Stroke TIA 321 (4.7%) 445 (9.5%) 245 (5.8%) 112 (5.5%) 754 (7.3%)
CKD 550 (8.1%) 473 (10.1%) 381 (9%) 220
(10.8%)
1560
(15.1%)
AF 238 (3.5%) 168 (3.6%) 162 (3.8%) 106 (5.2%) 552 (5.4%)
PVD 388 (5.7%) 285 (6.1%) 250 (5.9%) 115 (5.7%) 2519
(24.4%)
Epilepsy 295 (4.3%) 508 (10.8%) 231 (5.4%) 149 (7.3%) 1153
(11.2%)
Dementia 78 (1.1%) 83 (1.8%) 57 (1.3%) 29 (1.4%) 172 (1.7%)
Schizophrenia 82 (1.2%) 72 (1.5%) 47 (1.1%) 46 (2.3%) 230 (2.2%)
Bronchiectasis 31 (0.5%) 60 (1.3%) 27 (0.6%) 14 (0.7%) 86 (0.8%)
Parkinsons Disease 32 (0.5%) 22 (0.5%) 15 (0.4%) 6 (0.3%) 54 (0.5%)
Multiple Sclerosis 50 (0.7%) 17 (0.4%) 22 (0.5%) 11 (0.5%) 100 (1%)
Viral Hepatitis 11 (0.2%) 3 (0.1%) 6 (0.1%) 2 (0.1%) 18 (0.2%)
Chronic Liver
Disease 2 (0%) 4 (0.1%) 2 (0%) 0 (0%) 3 (0%)
Previous MI 657 (9.7%) 563 (12%) 442 (10.4%) 261 4448

23
(12.9%) (43.1%)
CABG 416 (6.1%) 239 (5.1%) 233 (5.5%) 127 (6.3%) 1956 (19%)
Diuretics 2406
(35.4%)
1279
(27.3%)
1402
(33.1%)
699
(34.5%)
8189
(79.4%)
Aldosterone receptor
antagonist 464 (6.8%) 114 (2.4%) 218 (5.1%) 130 (6.4%) 741 (7.2%)
B-Blockers 1819
(26.8%)
733 (15.6%) 1048
(24.7%)
580
(28.6%)
6307
(61.2%)
ACE 1352
(19.9%)
451 (9.6%) 704 (16.6%) 396
(19.5%)
3634
(35.3%)
Angiotensin receptor
antagonist 580 (8.5%) 165 (3.5%) 245 (5.8%) 149 (7.3%) 1727
(16.8%)
Anti-platelet agents 3014
(44.4%)
1565
(33.3%)
1600
(37.7%)
944
(46.5%)
7683
(74.5%)
Lipid lowering
agents 2889
(42.5%)
1184
(25.2%)
1516
(35.8%)
903
(44.5%)
7143
(69.3%)
Dead 30 days after
diagnosis 25/6759
(0.4%)
405/4647
(8.7%)
102/4196
(2.4%)
22/2017
(1.1%)
156/10254
(1.5%)
Dead 1 year after
diagnosis
439/5862
(7.5%)
2879/4255
(67.7%)
850/3671
(23.2%)
290/1786
(16.2%)
1343/9322
(14.4%)
Dead 5 year after
diagnosis
1442/2829
(51%)
3707/3812
(97.2%)
1616/2181
(74.1%)
621/978
(63.5%)
3430/5508
(62.3%)
Dead (ever recorded) 1586/6795
(23.3%)
3727/4693
(79.4%)
1671/4239
(39.4%)
655/2028
(32.3%)
3713/10309
(36%)
Categorical variables given as number (percentage); continuous variables given as mean (standard
deviation), unless otherwise stated.

24
Table 2: Baseline and mortality characteristics for women.
Breast Colorectal Lung Ovary HF
Number of cases 10760
3610 3859 1234 9131
Age at diagnosis 61.3 (14.0)
70.0 (13.1) 69.7 (10.7) 62.7 (14.3) 76.4 (11.5)
Date of first diagnosis
(median) 30-11-2005 18-01-2006 20-04-2006 25-10-2005 25-01-2005
Heart Failure 85 (0.8%) 43 (1.2%) 61 (1.6%) 15 (1.2%)
Cancer 364 (4%)
Urban-rural index: 1
(most urban) 3688
(34.3%)
1322
(36.6%)
1550
(40.2%)
432 (35%) 3354
(36.7%)
2 3694
(34.3%)
1162
(32.2%)
1311 (34%) 407 (33%) 2899
(31.7%)
3 1484
(13.8%)
475 (13.2%) 471
(12.2%)
168
(13.6%)
1168
(12.8%)
4 655 (6.1%) 256 (7.1%) 198 (5.1%) 83 (6.7%) 690 (7.6%)
5 727 (6.8%) 217 (6%) 199 (5.2%) 91 (7.4%) 573 (6.3%)
6 (most rural) 512 (4.8%) 178 (4.9%) 130 (3.4%) 53 (4.3%) 447 (4.9%)
Scottish index of
multiple deprivation
1 (least deprived)
1542
(14.3%)
486 (13.5%) 431
(11.2%)
197 (16%) 1197
(13.1%)
2 2135
(19.8%)
700 (19.4%) 595
(15.4%)
242
(19.6%)
1453
(15.9%)
3 2270
(21.1%)
748 (20.7%) 750
(19.4%)
271 (22%) 2042
(22.4%)
4 2626
(24.4%)
866 (24%) 954
(24.7%)
274
(22.2%)
2293
(25.1%)
5 2187
(20.3%)
810 (22.4%) 1129
(29.3%)
250
(20.3%)
2146
(23.5%)
non smoker 4129
(38.4%)
1168
(32.4%)
140 (3.6%) 345 (28%) 3352
(36.7%)
Smoker 1646
(15.3%)
328 (9.1%) 617 (16%) 145
(11.8%)
1027
(11.2%)
ex-smoker 2264 (21%) 700 (19.4%) 760
(19.7%)
189
(15.3%)
2536
(27.8%)
smoking missing 2721
(25.3%)
1414
(39.2%)
2342
(60.7%)
555 (45%) 2216
(24.3%)
25
Number of
comorbidities 1.19 (1.31)
1.52 (1.46) 1.95 (1.6) 1.21 (1.32) 2.8 (1.61)
No comorbidity 4115 (38.2%) 1024 (28.4%) 769 (19.9%)
465
(37.7%) 500 (5.5%)
Hypertension 3259 (30.3%)
1450 (40.2%) 1451
(37.6%)
364
(29.5%)
4984
(54.6%)
Depression 1863 (17.3%) 511 (14.2%) 776 (20.1%)
224
(18.2%) 1642 (18%)
Asthma 945 (8.8%) 296 (8.2%) 386 (10%) 95 (7.7%) 925 (10.1%)
Coronary Heart
Disease 839 (7.8%) 499 (13.8%) 718 (18.6%) 108 (8.8%)
4367
(47.8%)
Diabetes 786 (7.3%) 425 (11.8%) 421 (10.9%) 89 (7.2%)
1708
(18.7%)
Thyroid Disease 1173 (10.9%) 465 (12.9%) 474 (12.3%)
133
(10.8%)
1532
(16.8%)
Rheumatoid Arthritis 613 (5.7%) 302 (8.4%) 392 (10.2%) 85 (6.9%)
1327
(14.5%)
COPD 583 (5.4%) 275 (7.6%) 1118 (29%) 74 (6%)
1455
(15.9%)
Stroke TIA 445 (4.1%) 237 (6.6%) 382 (9.9%) 58 (4.7%)
1404
(15.4%)
CKD 265 (2.5%) 179 (5%) 228 (5.9%) 37 (3%) 722 (7.9%)
AF 316 (2.9%) 158 (4.4%) 161 (4.2%) 25 (2%) 2370 (26%)
PVD 238 (2.2%) 130 (3.6%) 274 (7.1%) 30 (2.4%) 740 (8.1%)
Epilepsy 136 (1.3%) 39 (1.1%) 49 (1.3%) 23 (1.9%) 149 (1.6%)
Dementia 190 (1.8%) 75 (2.1%) 98 (2.5%) 13 (1.1%) 448 (4.9%)
Schizophrenia 96 (0.9%) 38 (1.1%) 36 (0.9%) 8 (0.6%) 103 (1.1%)
Bronchiectasis 34 (0.3%) 13 (0.4%) 26 (0.7%) 1 (0.1%) 73 (0.8%)
Parkinsons Disease 39 (0.4%) 12 (0.3%) 13 (0.3%) 4 (0.3%) 63 (0.7%)
Multiple Sclerosis 50 (0.5%) 10 (0.3%) 10 (0.3%) 6 (0.5%) 19 (0.2%)
Viral Hepatitis 6 (0.1%) 3 (0.1%) 0 (0%) 0 (0%) 3 (0%)
Chronic Liver
Disease 597 (5.5%) 261 (7.2%) 258 (6.7%) 76 (6.2%) 984 (10.8%)
Previous MI 305 (2.8%) 207 (5.7%) 292 (7.6%) 48 (3.9%)
2665
(29.2%)
CABG 88 (0.8%) 62 (1.7%) 94 (2.4%) 13 (1.1%) 690 (7.6%)

26
Diuretics 3531 (32.8%) 1451 (40.2%)
1309
(33.9%)
422
(34.2%)
8010
(87.7%)
Aldosterone receptor
blockers 320 (3%) 114 (3.2%) 79 (2%) 24 (1.9%) 566 (6.2%)
B-Blockers 2165 (20.1%) 840 (23.3%) 550 (14.3%)
228
(18.5%)
4480
(49.1%)
ACE 1358 (12.6%) 489 (13.5%) 337 (8.7%) 93 (7.5%)
2881
(31.6%)
Angiotensin receptor
antagonist 805 (7.5%) 261 (7.2%) 174 (4.5%) 57 (4.6%)
1684
(18.4%)
Anti-platelet agents 2493 (23.2%) 1056 (29.3%)
1218
(31.6%)
225
(18.2%)
6326
(69.3%)
Lipid lowering agents 2547 (23.7%) 1061 (29.4%) 994 (25.8%)
223
(18.1%)
5149
(56.4%)
Dead 30 day post
diagnosis 57/10666
(0.5%)
79/3577
(2.2%)
354/3826
(9.3%)
39/1224
(3.2%)
197/9065
(2.2%)
Dead 1 year post
diagnosis
480/9235
(5.2%)
719/3101
(23.2%)
2241/3427
(65.4%)
295/1105
(26.7%)
1441/8121
(17.7%)
Dead 5 year post
diagnosis
1582/4053
(39%)
1337/1867
(71.6%)
2920/3030
(96.4%)
596/736
(81%)
3448/5061
(68.1%)
Death (ever recorded) 1709/10760
(15.9%)
1376/3610
(38.1%)
2941/3859
(76.2%)
611/1234
(49.5%)
3747/3131
(41%)
Categorical variables given as number (proportion); continuous variables given as mean (standard
deviation), unless otherwise stated.

27
Table 3: Results of Cox proportional hazards models, separated by gender.
Disease Unadjusted HR (95%
CI), P
HR adjusted for age,
deprivation
HR, fully adjusted
Men
HF 1.0 (ref) 1.0 (ref) 1.0 (ref)
Prostate 0.64 (0.60,0.68),
P<0.001
0.64 (0.61,0.68),
P<0.001
0.61 (0.57,0.65),
P<0.001
Lung 5.72 (5.46,6.00),
P<0.001
6.27 (5.98,6.58),
P<0.001
3.86 (3.65,4.07),
P<0.001
Colorectal 1.34 (1.26,1.42),
P<0.001
1.45 (1.37,1.54),
P<0.001
1.23 (1.16,1.31),
P<0.001
Bladder 0.96 (0.88,1.04),
P=0.28
0.97 (0.89,1.05),
P=0.46
0.88 (0.81,0.96),
P<0.005
Women
HF 1.0 (ref) 1.0 (ref) 1.0 (ref)
Breast 0.34 (0.32,0.36),
P<0.001
0.58 (0.55,0.62),
P<0.001
0.55 (0.51,0.59),
P<0.001
Colorectal 1.05 (0.99,1.12),
P=0.12
1.31 (1.23,1.40),
P<0.001
1.21 (1.13,1.29),
P<0.001
Lung 4.22 (4.01,4.43),
P<0.001
5.64 (5.36,5.94),
P<0.001
3.82 (3.60,4.05),
P<0.001
Ovary 1.46 (1.34,1.59),
P<0.001
2.55 (2.33,2.78),
P<0.001
1.98 (1.80,2.17),
P<0.001

28
Supplementary Table 1A: Read Codes used for heart failure diagnosis.
Group Name Read
Code
Rubric
Heart failure G58.. Heart failure
Heart failure G580. Congestive heart failure
Heart failure G5800 Acute congestive heart failure
Heart failure G5801 Chronic congestive heart failure
Heart failure G5802 Decompensated cardiac failure
Heart failure G5803 Compensated cardiac failure
Heart failure G581. Left ventricular failure
Heart failure G5810 Acute left ventricular failure
Heart failure G582. Acute heart failure
Heart failure G58z. Heart failure NOS
Heart failure G1yz1 Rheumatic left ventricular failure
Heart failure 662f. New York Heart Association classification - class I
Heart failure 662g. New York Heart Association classification - class II
Heart failure 662h. New York Heart Association classification - class III
Heart failure 662i. New York Heart Association classification - class IV

29
Supplementary Table 1B. Read code for cancer diagnosis.
Group Name Read
Code
Rubric
Cancer / Breast B34.. Malignant neoplasm of female breast
Cancer / Breast B340. Malignant neoplasm of nipple and areola of female breast
Cancer / Breast B3400 Malignant neoplasm of nipple of female breast
Cancer / Breast B3401 Malignant neoplasm of areola of female breast
Cancer / Breast B340z Malignant neoplasm of nipple or areola of female breast NOS
Cancer / Breast B341. Malignant neoplasm of central part of female breast
Cancer / Breast B342. Malignant neoplasm of upper-inner quadrant of female breast
Cancer / Breast B343. Malignant neoplasm of lower-inner quadrant of female breast
Cancer / Breast B344. Malignant neoplasm of upper-outer quadrant of female breast
Cancer / Breast B345. Malignant neoplasm of lower-outer quadrant of female breast
Cancer / Breast B346. Malignant neoplasm of axillary tail of female breast
Cancer / Breast B347. Malignant neoplasm, overlapping lesion of breast
Cancer / Breast B34y. Malignant neoplasm of other site of female breast
Cancer / Breast B34y0 Malignant neoplasm of ectopic site of female breast
Cancer / Breast B34yz Malignant neoplasm of other site of female breast NOS
Cancer / Breast B34z. Malignant neoplasm of female breast NOS
Cancer / Lung B22.. Malignant neoplasm of trachea, bronchus and lung
Cancer / Lung B220. Malignant neoplasm of trachea
Cancer / Lung B2200 Malignant neoplasm of cartilage of trachea
Cancer / Lung B2201 Malignant neoplasm of mucosa of trachea
Cancer / Lung B220z Malignant neoplasm of trachea NOS
Cancer / Lung B221. Malignant neoplasm of main bronchus
Cancer / Lung B2210 Malignant neoplasm of carina of bronchus
Cancer / Lung B2211 Malignant neoplasm of hilus of lung
Cancer / Lung B221z Malignant neoplasm of main bronchus NOS
Cancer / Lung B222. Malignant neoplasm of upper lobe, bronchus or lung
Cancer / Lung B2220 Malignant neoplasm of upper lobe bronchus
Cancer / Lung B2221 Malignant neoplasm of upper lobe of lung
Cancer / Lung B222z Malignant neoplasm of upper lobe, bronchus or lung NOS
Cancer / Lung B223. Malignant neoplasm of middle lobe, bronchus or lung
Cancer / Lung B2230 Malignant neoplasm of middle lobe bronchus
Cancer / Lung B2231 Malignant neoplasm of middle lobe of lung
Cancer / Lung B223z Malignant neoplasm of middle lobe, bronchus or lung NOS
Cancer / Lung B224. Malignant neoplasm of lower lobe, bronchus or lung
Cancer / Lung B2240 Malignant neoplasm of lower lobe bronchus
Cancer / Lung B2241 Malignant neoplasm of lower lobe of lung
Cancer / Lung B224z Malignant neoplasm of lower lobe, bronchus or lung NOS
Cancer / Lung B225. Malignant neoplasm of overlapping lesion of bronchus and
lung
Cancer / Lung B226. Mesothelioma

30
Cancer / Lung B22y. Malignant neoplasm of other sites of bronchus or lung
Cancer / Lung B22z. Malignant neoplasm of bronchus or lung NOS
Cancer /
Prostate
B46.. Malignant neoplasm of prostate
Cancer / Bowel B13.. Malignant neoplasm of colon
Cancer / Bowel B130. Malignant neoplasm of hepatic flexure of colon
Cancer / Bowel B131. Malignant neoplasm of transverse colon
Cancer / Bowel B132. Malignant neoplasm of descending colon
Cancer / Bowel B133. Malignant neoplasm of sigmoid colon
Cancer / Bowel B134. Malignant neoplasm of caecum
Cancer / Bowel B135. Malignant neoplasm of appendix
Cancer / Bowel B136. Malignant neoplasm of ascending colon
Cancer / Bowel B137. Malignant neoplasm of splenic flexure of colon
Cancer / Bowel B138. Malignant neoplasm, overlapping lesion of colon
Cancer / Bowel B139. Hereditary nonpolyposis colon cancer
Cancer / Bowel B13y. Malignant neoplasm of other specified sites of colon
Cancer / Bowel B13z. Malignant neoplasm of colon NOS
Cancer / Bowel B14.. Malignant neoplasm of rectum, rectosigmoid junction and anus
Cancer / Bowel B140. Malignant neoplasm of rectosigmoid junction
Cancer / Bowel B141. Malignant neoplasm of rectum
Cancer / Bowel B142. Malignant neoplasm of anal canal
Cancer / Bowel B1420 Malignant neoplasm of cloacogenic zone
Cancer / Bowel B143. Malignant neoplasm of anus unspecified
Cancer / Bowel B14y. Malignant neoplasm of other sites of rectum, rectosigmoid
junction and anus
Cancer / Bowel B14z. Malignant neoplasm of rectum, rectosigmoid junction and anus
NOS
Cancer / Ovary B44.. Malignant neoplasm of ovary and other uterine adnexa
Cancer / Ovary B440. Malignant neoplasm of ovary
Cancer / Ovary B441. Malignant neoplasm of fallopian tube
Cancer / Ovary B442. Malignant neoplasm of broad ligament
Cancer / Ovary B443. Malignant neoplasm of parametrium
Cancer / Ovary B444. Malignant neoplasm of round ligament
Cancer / Ovary B44y. Malignant neoplasm of other site of uterine adnexa
Cancer / Ovary B44z. Malignant neoplasm of uterine adnexa NOS
Cancer /
Bladder
B49.. Malignant neoplasm of urinary bladder
Cancer /
Bladder
B490. Malignant neoplasm of trigone of urinary bladder
Cancer /
Bladder
B491. Malignant neoplasm of dome of urinary bladder
Cancer /
Bladder
B492. Malignant neoplasm of lateral wall of urinary bladder
Cancer /
Bladder
B493. Malignant neoplasm of anterior wall of urinary bladder
Cancer / B494. Malignant neoplasm of posterior wall of urinary bladder
31
Bladder
Cancer /
Bladder
B495. Malignant neoplasm of bladder neck
Cancer /
Bladder
B496. Malignant neoplasm of ureteric orifice
Cancer /
Bladder
B497. Malignant neoplasm of urachus
Cancer /
Bladder
B498. Local recurrence of malignant tumour of urinary bladder
Cancer /
Bladder
B49y. Malignant neoplasm of other site of urinary bladder
Cancer /
Bladder
B49y0 Malignant neoplasm, overlapping lesion of bladder
Cancer /
Bladder
B49z. Malignant neoplasm of urinary bladder NOS

32
Supplementary Table 2. Drug group and search string.
Drug Group Search String
Diuretic Neo NaClex, Diumide K, Centyl K, Mannitol, aldactide, triam-co, burinex, aridil, moduretic, amil-co, co-amilofruse, burinex, frusene,
lasilactone, co-flumactone, kalspare, dytide, dyazide, co-triamterzide, navispare, coamilozide, dytac, Amilamont, aldactone,
spironolactone, inspra, eplerenone, triamterene, amiloride, Lasilactone, Frusene, Burinex A, Co-amilofruse, frusol, rusyde, frusid, froop,
torem, torasemide, burinex, bumetanide, lasix, frusemide, furosemide, diurexan, xipamide, metenix, metolazone, natrilix, indapamide,
navidrex, cyclopenthiazide, hygroton, chlorthalidone, chlortalidone, Neo-NaClex, Aprinox, bendroflumethiazide, bendrofluazide
ARA slocinx, doxadura, rogitine, phentolamine, dibenyline, phenoxybenzamine, hytrin, terazosin, hypovase, prazosin, doralese, baratol,
indoramin, doxazosin, cardura
Bblocker Propranolol, Angilol, Syprol, Inderal, Half Inderal, Half Inderal, Bedranol, Beta Prograne, Slo-Pro, Acebutolol, Sectral, Atenix, Atenolol,
Tenormin, Co tenidone, Kalten, Tenoret, Tenoretic, Beta Adalat, Tenif, Bisoprolol Fumarate, Bisoprolol, Vivacor, Cardicor, Emcor,
Carvedilol, Eucardic, Celiprolol, Celectol, Esmolol Hydrochloride, Esmolol, Brevibloc, Labetalol Hydrochloride, Labetalol, Trandate,
Metoprolol Tartrate, Metoprolol, Betaloc, Lopresor, Nadolol, Corgard, Nebivolol, Nebilet, Oxprenolol, Trasicor, Trasidrex, Pindolol,
Visken, Viskaldix, Sotalol, Beta Cardone, Sotacor, Timolol, Betim, Prestim
ACE tarka, gopten, trandolapril, triapin, tritace, lopace, rampril, accuretic, accupro, quinil, quinapril, coversyl, perindopril, perdix ,moexipril
,zestoretic ,lisicostad ,zestril ,carace ,lisinopril ,tanatril ,imidapril ,staril ,fosinopril ,innozide ,innovace, enalapril, vascace, cilazapril,
capozide, capto co, co-zidocapt, capoten, tensopril, kaplon, Captopril, ecopace
ARB co-diovan, diovan, valsartan, micardis, telmisartan, olmesartan, olmetec, cozaar, losartan, coaprovel, aprovel, irbesartan, teveten,
eprosartan, candesartan, amias
Antiplatelet acetylsalicylic, Aggrastat, Tirofiban, intergrilin, Eptifibatide, Asasantin, Persantin, Dipyridamole, Plavix, Clopidogrel, Nuseals, Nu-Seals,
Caprin, Angettes, Micropirin, Gencardia, Aspirin, Abciximab, ReoPro
Lipid Maxepa, Omega-3-Marine Triglycerides, Omacor, Omega-3-Acid Ethyl Esters, Niaspan, Nicotinic, Olbetam, Acipimox, Lopid,
Gemfibrozil, Supralip, Lipantil, Fenofibrate, Modalim, Ciprofibrate, Bezalip, Bezafibrate, Ezetrol, Ezetimibe, Colestid, Colestipol,
Questran, Cholestyramine, Colestyramine, Cholestagel, Colesevelam, Inegy, Zocor, simvador, Simvastatin, Crestor, Rosuvastatin,
Lipostat, Pravastatin, Lescol, Fluvastatin, Atorvastatin, Lipitor

33
Supplementary Table 3A: Hazard non-proportionality (Rho=0 is perfect proportionality) for men.
Disease Rho (p), uncorrected model Rho (p) corrected for age,
deprivation Rho (p), fully adjusted
HF Ref Ref Ref Prostate 0.06 (<0.001) 0.05 (<0.001) 0.07 (<0.001) Lung -0.12 (<0.001) -0.12 (<0.001) 0.01 (0.35) Bowel -0.08 (<0.001) -0.08 (<0.001) -0.02 (0.02) Bladder -0.02 (0.03) -0.02 (0.02) -0.003 (0.72)
Supplementary Table 3B: Hazard non-proportionality (Rho=0 is perfect proportionality) for women.
Disease Rho (p), uncorrected model Rho (p) corrected for age,
deprivation Rho (p), fully adjusted
HF Ref Ref Ref Breast 0.03 (<0.001) 0.04 (<0.001) 0.06 (<0.001) Bowel -0.10 (<0.001) -0.09 (<0.001) -0.04 (<0.001) Lung -0.12 (<0.001) -0.11 (<0.001) 0.002 (0.81) Ovary -0.04 (<0.001) -0.03 (0.004) 0.03 (0.004)