do port state control inspections influence flag- and
TRANSCRIPT

HAL Id: hal-00455155https://hal.archives-ouvertes.fr/hal-00455155
Preprint submitted on 9 Feb 2010
HAL is a multi-disciplinary open accessarchive for the deposit and dissemination of sci-entific research documents, whether they are pub-lished or not. The documents may come fromteaching and research institutions in France orabroad, or from public or private research centers.
L’archive ouverte pluridisciplinaire HAL, estdestinée au dépôt et à la diffusion de documentsscientifiques de niveau recherche, publiés ou non,émanant des établissements d’enseignement et derecherche français ou étrangers, des laboratoirespublics ou privés.
Do Port State Control inspections influence flag- andclass-hopping phenomena in shipping ?
Pierre Cariou, François-Charles Wolff
To cite this version:Pierre Cariou, François-Charles Wolff. Do Port State Control inspections influence flag- and class-hopping phenomena in shipping ?. 2010. �hal-00455155�

EA 4272
Do Port State Control inspections influence flag- and class-hopping
phenomena in shipping ?
Pierre Cariou (*)
François-Charles Wolff (**)
2010/08
(*) World Maritime university - malmö (**) LEMNA – Université de Nantes / CNAV – INED - Paris
Laboratoire d’Economie et de Management Nantes-Atlantique Université de Nantes
Chemin de la Censive du Tertre – BP 52231 44322 Nantes cedex 3 – France
www.univ-nantes.fr/iemn-iae/recherche
Tél. +33 (0)2 40 14 17 17 – Fax +33 (0)2 40 14 17 49
Document de Travail
Working Paper

Do Port State Control inspections influence flag- and class-
hopping phenomena in shipping? #
Pierre CARIOU Corresponding author. World Maritime University, Citadellsvägen 29, PO Box 500, S-201 24 Malmö,
Sweden. Phone: +46-(0)40 35 63 75, Fax +46-(0)40 12 84 42.
E-mail: [email protected]
Francois-Charles WOLFF LEMNA, University of Nantes, BP 52231 Chemin de la Censive du Tertre, 44322 Nantes Cedex 3,
France; CNAV and INED, Paris, France.
E-mail: [email protected] www.sc-eco.univ-nantes.fr/~fcwolff
Abstract
The flag of registry and classification society are an integral part of the target factors used by
Port State Control authorities (PSC) when deciding on vessels to select for inspection. A ship-
owner may then have an interest in changing the flag of registry (flag-hopping) and
classification society (class-hopping) to avoid future controls. Using data on PSCs collected
over 6 years from 7,500 vessels, we study the relevance of this assumption using bivariate
Probit models. Our estimates show that vessels in relatively bad conditions are more likely to
be subject to flag- and class-hopping and that these phenomena are more likely amongst
vessels which have changed flag and class in the past.
January 2010
# We would like to thank one anonymous referee and the editor, Steven Morrison, for their helpful comments on
a previous draft. The usual disclaimer applies.

Do Port State Control inspections influence
flag- and class-hopping phenomena in shipping?
1. Introduction
The flag of registry and classification society of a vessel are very often seen as
indicators of quality in shipping. They are, for instance, an integral part of Port State Control
authorities (PSC) target factors when selecting vessels to inspect1. This may thus create
incentives for ship-owners to change the flag of registry (flag-hopping) and classification
society (class-hopping) of their vessels. In this paper we are interested in knowing whether a
vessel that has been subject to detention and/or with a high number of deficiencies noted
during a PSC occurring in t is more likely to record a change in its flag of registry and/or in its
classification society when the next inspection takes place in t+1.
Our primary focus is to shed light on the magnitude of these two events (changes in
flag, changes in classification society) using information from 30,578 PSC inspections (7,500
vessels) carried out from January 1, 2002 to August 31, 2008 by countries belonging to the
regional Indian Ocean PSC Memorandum of Understanding (MoU). We turn to an
econometric analysis to investigate the determinants of the probability of change in flag of
registry and in classification of a vessel and estimate bivariate Probit and dynamic Probit
models. We contribute to the existing literature in the two following ways.
Firstly, flag- and class-hopping are assessed in a dynamic way, seen as the
consequence of a former PSC, while these phenomena are usually approached in a static way,
comparing at date t the performance of a flag of registry and a classification society with the
average performance of the category they belong to. Secondly, our analysis is carried out at
the vessel level. This allows us to consider all changes occurring in flag and class, while most
studies only identify flag- and class-hopping when a vessel changes registration from a
national to a foreign flag2. For instance, if a ship-owner from country A chooses a foreign flag
of registry from country B in t, and then later transfer the vessel under country C’s flag in t+1,
only one flag change (-hopping) is usually considered while two changes will be recorded
when assessed at the vessel level.
PSC is the inspection of foreign ships in national ports to verify that the condition of the ship and its equipment
comply with the requirements of international regulations and that the ship is manned and operated in
compliance with these rules.2 Or the use of a flag-of-convenience defined as when a vessel flies the flag of a country other than the country
of ownership.

The remainder of our paper is organised as follows. Section 2 provides a literature
review of the flag- and class-hopping phenomena and highlights why these strategies are
commonly used in shipping. In Section 3, our empirical approach explains why vessels in
relatively poor conditions are more likely to change later their flag of registry or classification
society and further presents our econometric strategy. The data for our empirical analysis are
described in Section 4 and econometric results are discussed in Section 5. Finally, our
concluding comments are gathered in Section 6.
2. Literature review of flag- and class-hopping in shipping
Flag- and class-hopping materialise the fact that for a ship operator, it might be
relevant for economic reasons to change the vessel’s registry from one flag to another and/or
from one classification society to another. These economic motivations are multiple and
related to potential cost savings generated by the different operational conditions for a vessel
which is governed by the vessel’s flag and class (registration fee, taxation, working conditions
and employability aboard the vessel, etc)3. An OECD study on the competitive advantages of
non-observance of applicable international rules and standards (OECD/GD(96)4) showed, for
instance, that the level of expenditures to comply with basic maritime regulations would range
from 2,750 USD/day to 7,500 USD/day for a 20 year-old bulk carrier of 30,000 dwt and from
3,100 USD/day to 9,500 USD/day for a 14-year old product tanker of 40,000 dwt according to
the conditions applying to a vessel.
Indeed, although flag states, classification societies, ship management companies,
banks, insurance companies, charterers are all playing a major role in explaining the condition
of a ship, the light is very often shed on the first two actors. Flag states, as defined by the
United Nations Convention on the Law of the Sea (UNCLOS), have for instance the overall
responsibility for the implementation and enforcement of international maritime regulations4
for all ships granted the right to fly their flags (Bimco et al., 2007). The focus on flag states
has furthermore increased during the last 30 years following the registration of vessels under
foreign flags (i.e. flags-of-convenience - FOCs) as: “the administrations of many FOCs would
be generally less rigorous in their pursuit of high standards that might conflict with their aim
of maximising the number of ships under their registries” (OECD 2001, p.8).
3 All conditions are not considered in this article but can be found in regular studies carried out mainly by the
main national ship-owners associations which provide extensive comparisons on the cost of flying their national
flag of registry in comparison with other flags. 4 Edited by the International Maritime Organisation as well as the International Labor Organisation and the
International Oil Pollution Compensation funds.

The role of classification societies (IACS 5) is to develop technical standards (i.e. rules
for the construction of ships), approve design against these standards, conduct surveys during
the construction of a vessel and issue certificates, endorse vessel’s classification certificate for
periodical surveys. Their role can be even extended when a country delegates to a
classification society statutory surveys and related activities on behalf of flag state
administrations. When acting in such capacity, a classification society is a “recognized
organization” (in this paper we will use this term rather than recognized organizations).
Regarding classification societies, a perception exists on a two-tier market between members
of the IACS and other classes which are not. For the latter which are usually smaller, a lack in
technical expertise would not give them the possibility to secure sufficient standards of
quality and explain why the light is very often shed on them (OECD/GD(96)4, p. 20).
In the academic literature, the flag- and class-hopping phenomena are usually
approached in comparing the performance of a given flag and/or class with other flags or
classes, the concept of performance being either expressed in terms of maritime casualties or
PSC records. For instance, Li and Wonham (1999) analyse 20-years of data from the Lloyd’s
Casualty database on safety records for 36 flags of registry, using various indicators of safety
such as the total loss rates (percentage of loss ships among total ships for a flag). According to
their study, if safety records would have improved in general, a distinction exists amongst
three distinct groups of flags of registry: flags with less than 0.2 per cent total loss rate
(Russia, China, Brazil, Sweden, Hong Kong, Poland, Netherlands and Australia), flags above
0.75 per cent (South Korea, Panama, Greece, Malta, Saint Vincent, Taiwan, Cyprus and
Honduras), the other flags being in the middle.
Alderton and Winchester (2002) use a similar approach to compare the performance of
Flags of Convenience in terms of casualty rate for the years 1997-1999. They conclude that if
observable differences exist in the casualty rates between FOC (mean casualty rates of 3.58)
and national flags (1.36), disparities exist within the FOC group itself. For instance, new
entrants in the FOC market would be more likely to have higher casualty rates (3.64 per cent)
than old FOC (3.41 per cent), suggesting that the categorisation between FOC and non-FOC
flags as inherently unsafe is likely to mask the real situation. Robert and Marlow (2002)
investigation (logistic regression) on casualties in dry bulk shipping from 1963 to 1996 stress
that the risk of foundering would increase with the age of the ship and with the ship’s flag of
5 Since 1968, the 10 world’s leading societies have joined in the International Association of Classification
Societies (IACS) representing around 94 per cent of all commercial tonnage involved in international trade
worldwide (http://www.iacs.org.uk/).

registration and, most importantly, for heavy cargoes (iron ore and scrap steel) and for trading
routes to the Far East and from Europe to North America.
Talley’s (1999) estimations on the likelihood of ship accident seaworthiness provide
another example. Applied to 2,243 accidents that were investigated by the US Coast Guard
from 1981 to 1991, and amongst other attributes such as ship size and type, this author shows
that ships classified by the American Bureau of Shipping would be likely to record higher
levels of seaworthiness and that a high variance in the safety performance of various
classification societies exists.
Investigations conducted by Knapp (2007) on the performance of flags on the black
list of flags6 edited by PSC Paris MoU and of non-IACS classification societies using PSC
inspections and casualty data also give insights into the phenomena of flag and class-hopping.
Regarding the former, and for a flag with more than 50 ships, her estimates stress that black-
listed flags would have a higher probability to be involved in very serious casualties, this
being particularly prevalent for vessels flying the Syria, Belize, St Vincent & Grenadine,
Lebanon and Honduras flags of registry. Furthermore, the comparison between IACS and
non-IACS classification societies would also stress a higher probability of casualties and
detentions for the non-IACS classes: the Romanian Naval, Hellenic and China Corp
classifications having particularly poor records in terms of casualties.
Finally, Hoffman et al. (2004) study the determinants of vessel flag, seen as the
decision by a national operator to select a foreign flag7. They conclude that for a relatively
new vessels, classified with a non-IACS member, involved in international trade, operated by
ship-owners domiciled in developing countries and in countries with positive past safety
records, the probability to be foreign flagged would increase.
To summarize, this literature review suggests that both the flag of registry and
classification society may play an important role in explaining the vessel safety records. Also,
vessels registered under a FOC, black-listed and with a non-IACS classification society are
more likely to be substandard, but at the same time, important disparities exist within these
general categories. These findings are actually reflected within the target systems used by
most PSC authorities to select vessels that should be inspected. The Paris MoU is, for
instance, considering the flag (black-list of flags) and classification society (non-EU
6 A flag or a classification society is on the black list if in terms of detentions over a 3-year period and based on
binomial calculus, it performs significantly worse than the average (see Paris MoU for more details -
http://www.parismou.org/). 7 Around 46% of the cases in January 2003.

recognised organisation) of the vessel as well as information on its past detentions and
deficiencies to determine vessels that should be inspected.
3. Empirical strategy
From an empirical viewpoint, one of the main difficulties for this study is related to
selection. Indeed, vessels from suspicious flags or classification societies are expected to be
inspected more often. Ideally, data on both inspected vessels and non-inspected vessels would
be needed to account for this selection issue. However, to the best of our knowledge, we are
not aware of such a dataset available to researchers.
In this paper, we wonder whether flag and class-hopping observed for vessels that
have been inspected may be motivated and explained by the will to by-pass the selection
criteria (target factors) set up by PSC. To illustrate the relevancy of such an assumption, and
using the Paris MoU targeting system8 as an example, let us consider a vessel inspected in t,
flying a Paris MoU black-listed flag (high risk), registered with a non-EU recognised
organisation and with 10 deficiencies previously detected. When entering the Paris MoU
region more than a year later, this vessel will have a target factor equal to 48 points (20 points
for the flag, 20 points as it has not entered the region during the last 12 months, 3 points for
the classification society and 5 points for the number of deficiencies - all other parameters not
being considered). Now, if this vessel changes its flag to a White-listed flag (medium risk)
and is registered with an EU recognised class, its target factor is reduced to 29 points (4 points
for the flag, 20 points as it has still not entered the region during the last 12 months, 0 points
for classification society and 5 points for deficiencies that remain with the vessel). The
immediate consequence is that its probability to be selected for inspection will be strongly
reduced9.
In order to know whether ship owners indeed rely on such a strategy, two elements
need to be considered. Firstly, flag- and class-hopping decisions have to be assessed at the
vessel level. Indeed, performing an analysis at an aggregated level (only for FOC and non-
FOC or for IACS and non-IACS for instance) would not give the possibility to track most of
changes as stated previously. Secondly, the decision to change the vessel flag or class requires
8 http://www.parismou.org/ParisMOU/Target+Factor/xp/menu.3980/default.aspx
9 Considering this fictive example, one could argue that in a way, the aim of PSC is to force ship-owners to move
from a “bad” to a “good” flag or classification societies which can then be seen as a positive outcome. On the
other hand, the opposite example could have been taken showing that changing from a “good” flag to a “bad”
flag or classification society might have a limited impact on the likelihood of being inspected if the initial PSC
records were relatively good.

a dynamic framework in order to observe a PSC post-decision taken between t and t+1 and
based on the outcome of a former PSC in t (detention and number of deficiencies).
As a preliminary step, we consider that each vessel is inspected every year. We denote
respectively by tF and tC the flag and the classification society of the vessel in t, before
inspection in t+1. Using the following timeline representation, our main interest lies in the
transition from tF to 1tF and from tC to 1tC . Specifically, we study whether the outcome of
the PSC in t (like the number of deficiencies) affects )Pr( 1tt FF and )Pr( 1tt CC .
2211
21
,,, tttttt
ttt
CFCFCF
timePSCPSCPSC
Given that we use data on repeated inspections for each vessel, we have in fact to rely
on a restrictive assumption concerning the pattern of inspections over time. We suppose that
the time elapsed between two inspections does not depend on the vessel’s past PSC records,
and focus instead on potential changes between two inspections (whatever the time span is).
Nevertheless, it should be noted that this assumption is unlikely to hold, as shown by the two
following figures which concern respectively a vessel in good condition (case 1) and a vessel
in poor condition (case 2).
Case 1 tttttt
tt
CCFFCF
timePSCPSC
11
2
,,
Case 2 121211
21
,,, tttttttttt
ttt
CCFFCCFFCF
timePSCPSCPSC
In the case of a vessel with good past records in t (case 1), there is no incentive for the
ship owner to change either the flag or classification society of the vessel ( tF = 1tF and tC
= 1tC ), and the next inspection will occur only in t+2. In the second case, which concerns a
vessel in relatively bad condition, if the ship owner keeps the same flag and classification
society after the first inspection in t, the target factor for the vessel is high and the next
inspection (PSCt+1) is likely to occur soon. Now, if following a t+1 inspection, the ship owner

changes in an accurate way both the flag and classification society of the vessel, the time
before the next inspection which occurs in t+2 might be longer.
Another limitation stems from the fact that vessels in relatively poor condition are
likely to be overrepresented in our sample as they will be subject to more inspections. At the
same time, the strategic behaviour that we have previously illustrated is expected to have a
reverse effect, making the extent of a potential oversampling difficult to estimate. To limit
this drawback, we consider a sufficiently long period of time (8 years) to achieve a fair
balance between vessels in relatively bad and in good condition.
Given these shortcomings, our empirical analysis has to be viewed as a preliminary
attempt to shed light on the magnitude of the flag- and class- hopping phenomena in
shipping, respectively measured through )Pr( 1tt FF and )Pr( 1tt CC . Let tYF be a
variable which is equal to one when 1tt FF and 0 otherwise, and 1tYC when 1tt CC
and 0 otherwise. We suppose that there exists two latent (unobserved) variables, *
tYF and
*
tYC , such that 1tYF when 0*
tYF and 0 otherwise, and 1tYC when 0*
tYC and 0
otherwise. We rely on the following model structure:
CCttCt
FFttFt
XnYC
XnYF
*
*
(1)
with tn the number of deficiencies in t, tX a set of other vessel characteristics, F , C , F
and C the associated coefficients to estimate, and F and C two residuals. We assume that
the random perturbations follow a bivariate normal distribution function such that
)N(0,0,1,1,~ ),( FF , with the coefficient of correlation between the two error terms.
The corresponding model is thus a bivariate Probit model which is estimated using a
maximum likelihood method (see Greene, 2008). As we have repeated observations, standard
errors are corrected using a clustering method.
In doing so, our model provides a dynamic approach of the flag- and class hopping
phenomena and offers a way to investigate if PSC records in t play a significant role in the
decision by a ship-owner to implement flag- and class-hopping strategies between t and t+1, a
decision that will be observed when the inspection takes place in t+1.

4. Data and descriptive statistics
The initial sample comes from 35,261 PSC inspections on 12,229 vessels carried out
from January 1, 2002 to August 31, 2008 by countries belonging to the Indian Ocean regional
MoU10. Every PSC boarding generates a detailed inspection report containing the following
information: ship’s name, International Maritime Organization (IMO) vessel number, flag of
registry, recognised organization, vessel type, gross tonnage, deadweight tonnage, year built,
type of inspection, date of inspection, date of detention, date of release from detention, place
of inspection, inspecting authority, and nature of deficiencies.
Out of the 12,229 vessels, 4,683 have only been inspected one time over the period
and will not be considered in our final sample (as we focus on changes in characteristics
between two inspections t and t+1). The final sample is then made of 7,547 vessels (12,230-
4,683) that have been subjected to at least two inspections, which corresponds to 30,578
inspections. The average number of inspections per vessel is 4.05.
In addition to the number of deficiencies or detentions, we consider information on the
flag of registry for the nine first most important flags in the sample, which amounts to 67.4
per cent of all inspections. The remaining flags (see appendix A) are aggregated in an
“others” category. A similar approach was taken for the first ten ship’s type and for the first
nine most important classification societies11 that respectively represent 95.3 per cent and
92.8 per cent of inspections. The detailed composition of the other categories is again
described in appendix A. For the 30,578 inspections under consideration, Table 1 provides
descriptive statistics of the main variables.
Insert Table 1
Our two dependent variables are changes in flag of registry and in classification
societies between two successive inspections. We therefore only consider changes in the
status of a vessel between two successive inspections, which leads to drop the ‘last’ inspection
for each vessel. For instance, a vessel inspected three times (in t, t+1 and t+2) generates only
two observations and this reduces our sample to 23,031 observations.
At the vessel level (Panel A in Table 2), and provided that a vessel may have
changed flag or classification registry several times during the entire period, no change occurs
both in the flag and in the classification society between two consecutive inspections in 86.3%
of the cases. Conversely, in 2.6 per cent of the cases, a change in both flag and class has
10 In August 2008, the countries were: Australia, Bangladesh, Djibouti, Eritrea, Ethiopia (observer), India, Iran,
Kenya, Maldives, Mauritius, Mozambique, Myanmar, Oman, Seychelles, South Africa, Sri Lanka, Sudan,
Tanzania, and Yemen. 11 The 9 classifications societies are 9 of the 10 IACS members.

occurred. Interestingly, changes in flag appear to be more frequent than changes in
classification society, the proportions being 9.5 per cent and 6.8 per cent respectively.
Insert Table 2 here
We then wonder whether the same vessels are subjected to flag and/or class-hopping
over the period (Panel B in Table 2). For that purpose, we calculate the probability for a
vessel to have changed either its flag or classification society from 2002 to 2008. It appears
that the proportions for flag (25.3 per cent) and class-hopping (16.5 per cent) are higher than
at the vessel level. For 67.9 per cent of the vessels, there is no change in both the flag of
registry and classification society, while a change in both outcomes occurs for 9.7 per cent of
the vessels. According to the data, 21.9 per cent of the inspected vessels have changed their
flag only once during the period (and respectively 13.1 per cent for classification society),
while 3.4 per cent of them (respectively also 3.4 per cent) have changed their flag more than
twice12.
Finally, we analyse the main characteristics of vessels characterized by flag- and/or
class-hopping (Table 3). Looking first at flag-hopping, it is more likely to occur among
vessels between 10 and 20 years of age (respectively 10.1 per cent and 10.2 per cent in the
category), having Malta (15.0 per cent), Cyprus (14.2 per cent) and Greece (12.9 per cent) as
flag of registry, refrigerated cargo carriers (19.1 per cent), bulk carriers (10.7 per cent) and oil
tankers (10.6 per cent), and with Bureau Veritas (12.1 per cent), “Others” (11.6 per cent), and
Det Norske Veritas (11.0 per cent) as classification societies.
Turning then to class-hopping, this phenomena is more likely to occur among vessels
that are more than 25 years old (13.1 per cent), registered in Malta (9.6 per cent), “others”
(9.0 per cent) and Cyprus (8.3 per cent), general cargo/multi-purpose ship (9.5 per cent), oil
tanker (8.5 per cent), refrigerated cargo carriers (7.5 per cent) and Ro-ro cargo ship and,
registered with “Others” (25.9 per cent), American Bureau of Shipping (8.3 per cent) and
Bureau Veritas (7.9 per cent) classification societies13.
Insert Table 3 here
Finally, we look at the relationship between the number of deficiencies in t and the
occurrence of flag and class-hopping. We find a positive correlation between the condition of
12 By definition, the probability that a vessel experiences a change in flag/classification society several times
over the period increases with the number of inspections. For instance, the proportion of vessels having
experienced at least two changes in flag is 2.6 per cent for vessels inspected 3 times (N=1,599), 4.1 per cent with
4 inspections (N=1,136), 6.5 per cent with 5 inspections (N=816), 7.0 per cent with at least 6 inspections
(N=1,635). 13 Although the proportion of vessels from the ‘others’ category concerned with class-hopping is important, it
has to be kept in mind that about 93% of vessels were classified by the nine most important groups.
a vessel (expressed in terms of number of deficiencies) and its likelihood to change flag and
classification society. The corresponding coefficients of correlation are respectively equal to
0.043 and 0.079 and are significant at the 1 percent level. Furthermore, the positive
association is more important when the number of deficiencies denoted in t is more than five.
Although purely descriptive, these preliminary results are consistent with the idea that
ship owners would be more likely to change the flag and class of their vessel when it is in
relatively poor condition (PSC outcome). In what follows, we further investigate the
relevance of this conjecture by turning to an econometric analysis of the determinants of
changes in flag and classification society between two inspections.
5. Econometric results
We now consider the bivariate Probit model presented in section 3 to estimate the
determinants of the probability of flag- and class-hopping. In a preliminary step, we only
control for age at inspection, flag of registry, type of ship, classification society and year of
inspection. As shown in Table 4, a positive coefficient of correlation (0.559) between the
residuals of each equation is found, which is significant at the 1 percent level14. As expected,
the unobserved factors mainly related to the vessel’s condition have a similar influence on the
two outcomes under consideration (flag and class-hopping).
Insert Table 4 here
Results from the bivariate specification concerning flag-hopping (columns 2-4, Table
4) show that older vessels are more likely to be subject to flag-hopping. Compared to the
reference category (less than 5 years old), the different age dummies all have a positive and
significant influence. The mean probability is increased by about 3 percentage points for
vessels older than 10 years15. The probability of a change in flag between two inspections in t
and t+1 is higher when the initial flag of registry is from Malta (+2.8%) or Cyprus (+1.7%).
Conversely, the probability is lower when the vessel is initially registered with the
Russian Federation flag (-4.7%), and to a lesser extent with Singapore (-1.8%) and Panama (-
1.9%). Refrigerated cargo carriers, bulk carriers and oil tankers are more subject to flag-
hopping, while vehicle carriers and woodchip carriers are less so. Finally, vessels registered
14 In Table 4, we report the various estimates from the bivariate Probit model and include marginal effects
obtained from univariate Probit models. Indeed, in the bivariate model, there is no single conditional mean
function (Greene, 2008). We can get marginal effects for either YF|YC or YC|YF. 15 When introducing the continuous age variable in the regression, we obtain a coefficient equal to 0.038, with a
t-value of 4.64. The assumption of a continuous increase in flag-hopping with age is not supported and we find
that a quadratic profile fits better the data, with a concave age profile (the peak being at 18 years).
with the Russian Maritime Register of Shipping and the China Classification Society are less
often subject to flag-hopping16.
Then, turning to the class-hopping phenomenon (columns 5-7, Table 4), the main
striking element is that all coefficients for classification societies are now significant at 1%
level and negative. Since the nine classification societies identified are the nine largest ones,
this suggests that class-hopping affects relatively more vessels registered in smaller
classification societies. Again, this is in line with our expectations. Our estimates also show
that older vessels are more likely to experience a change in classification society between two
inspections. Similar conclusions hold among vessels registered in Singapore and Greece, bulk
carriers, general cargo/multi-purpose ship, oil tankers and refrigerated cargo carriers.
To further investigate the potential effect of PSC outcomes on flag- and class-hopping,
we then introduce two sets of additional explanatory variables related to deficiencies and
detention. As these two covariates are strongly correlated, we include them separately in the
bivariate Probit models. We first estimate regressions respectively with any deficiencies and
number of deficiencies observed in t (models 1A and 1B), then in t and in t-1 (models 2A and
2B) 17. Similar regressions with any detention in t (and in t and in t-1) are estimated (models 3
and 4)18. The corresponding results are presented in Table 5.
Insert Table 5
Concerning flag-hopping, the probability to observe a change in flag between t and
t+1 is positively correlated with both the presence of deficiencies and the number of
deficiencies detected in t (columns 2-4). In both cases, this effect is significant at the 1 percent
level (models 1A and 1B). In the same vein, the lagged value of either any deficiency or
number of deficiencies (observed in t-1) is also positive. In the former case, the probability of
flag-hopping is increased by 1.48 percentage point (model 2A), but the relationship is only
significant at the 10 percent level for the lagged number of deficiency (model 2B). This
pattern tends to confirm that ship owners are more likely to change flag when the vessel is a
relatively bad vessel, characterized by a ‘permanent’ presence of deficiencies. Interestingly,
we also find a positive correlation between the probability of changing flag and the fact that
16 We also find a negative effect for the Nippon Kaiji Kyokai classification society, the corresponding coefficient
being, however, only significant at the 10 percent level. 17 Including both deficiencies (detentions) in t and in t-1 reduces the size of the sample, since the model has to be
estimated on the subsample of vessels being inspected at least three times from 2002 to 2008. 18 Note that detention is a dichotomous variable. In a dynamic perspective, it could be argued that it matters to
control for the number of detentions. We have then constructed a cumulative index of detentions, but the number
of vessels concerned with multiple detentions is low.
the vessel is detained in t (model 3), although the current and lagged detentions are only
significant at the 10 percent level when being simultaneously introduced (model 4).
Results for class-hopping (columns 5-7) also stress a positive correlation between any
deficiency (model 1A), number of deficiencies (model 1B) and detention (model 3) in t and
the probability of recording a change in the classification society between two successive
inspections. Also, the lagged values of any deficiency/ number of deficiencies and detention
in t-1 (models 2A and 2B) are strong predictors of class-hopping (at the 1 percent level).
To conclude, our results are in accordance with the idea that vessels in bad condition
are more likely to change either their flag or their classification society, meaning that ship-
owners account for past PSC outcomes when deciding the flag and class for their vessels.
Finally, we investigate whether our previous results still hold when controlling for
state dependence. In order to know whether a vessel already subject to flag and class-hopping
is more likely to be later subject to another change, we estimate dynamic ordered Probit
models in which the lagged value of the dependent variable (either change in flag or in
classification society) is introduced as an additional covariate in the regression. Given the
complexity of the bivariate specification, we neglect the possibility that the two random
perturbations may be correlated and re-estimate separately the following two dynamic
models:
CCttCtt
FFttFtt
XnYCYC
XnYFYF
1
*
1
*
(2)
with 1tYF and 1tYC the lagged values respectively for flag and class-hopping. We further
decompose the error term F (respectively C ) and express it as a function of a vessel fixed
effect F (respectively C ) and a pure random perturbation Ft (respectively Ct ). The main
difficulty in estimating such a model is related to the so-called initial condition problem
(Heckman, 1981), since the initial state 1tYF ( 1tYC ) and the vessel fixed effects F ( C ) are
likely to be correlated. This implies that the lagged value cannot be treated as exogenous.
To consider these elements, we rely on the parametric approach described in
Wooldridge (2005)19. This consists of estimating an augmented random effects Probit model
19 See Wooldridge (2005) for a detailed description of the methodology. Note that there are different strategies to
estimate a dynamic Probit model, as shown in Heckman (1981) and Wooldridge (2005). Heckman (1981)
suggests for instance to rely on a linear auxiliary equation to explain the probability of the dependent variable in

in which in addition to the lagged value of the dependent variable, we also control for the
first-period value of the dependent variable and the time-average values of the other
exogenous covariates. Estimates of the dynamic Probit model were respectively computed for
flag- and class-hopping, and we focus on vessels inspected at least five times over the last
seven years to be able to account for state dependence. The number of deficiencies and the
mean number of deficiencies are also considered to account for the current condition of a
specific vessel20. The different sets of estimates are presented in Table 6.
Insert Table 6 here
The main result of the dynamic models is that a strong state dependence exists in both
flag- and class-hopping. The probability for a vessel to experience a change in flag between
two inspections is indeed much higher when the vessel has already been subject to a change in
the past. A similar pattern holds for class-hopping. As they stand, our findings suggest that
these phenomena are mainly restricted to very specific vessels which are in relatively poor
condition, the mean number of deficiencies in the regression being significant21.
6. Concluding comments
After more than 25 years of existence, PSCs have grown in importance so that
nowadays they are commonly used by policy makers as well as private operators. This paper
is a first attempt to show how the PSC outcomes, expressed in terms of detention or number
of deficiencies, may also be used by ship-owners when deciding on the future flag of registry
and/or the classification society of their vessels.
Despite limitations coming from potential selection bias, our estimates from data on
PSCs collected over 6 years on 7,500 vessels confirm most of the expected results. Firstly,
vessels in relatively bad conditions (detention or high number of deficiencies) are more likely
to be characterized by a change either in their flag or in their classification society at the next
inspection. Secondly, a strong state dependence in both flag- and class-hopping exists and
indicates that changes are more likely to occur for vessels that were already subject to former
changes.
the first period. However, the main drawback of this approach is the need of appropriate instruments, i.e.
variables expected to have an influence on the first-period choice only. As there is clearly no such variable in our
dataset, we choose instead the conditional approach of Wooldridge (2005). 20 We also estimated the same dynamic models with detention and time-average value of detention instead of
deficiencies which nonetheless does not affect the coefficients of the lagged value of the dependent variable
(change in flag and change in classification society). 21 But the current number of deficiencies is no longer significant.

Our interpretation is that given the importance of PSC inspections, the result of their
actions (detention and deficiencies detected) are nowadays considered by ship-owners when
deciding on the flag or on the classification society of their vessels. At first sight, this result
could be seen as rather encouraging as it stresses the effectiveness of PSC, forcing ship-
owners to move from relatively bad to good flags or classes. However, our findings merely
suggest that PSC actions give rise to opportunistic behavior among ship-owners operating
relatively bad vessels.
The fact that vessels which had already changed several times flags and classes in the
past are subject to more changes in the future is a very interesting result. From a public policy
point of view, this suggests that this criterion should be considered in targeting systems when
identifying vessels to inspect.

Table 1. Description of the sample Variables Distribution (in %)
Age at PSC inspection 0-4 14.7
5-9 21.1
10-14 17.3
15-19 15.3
20-24 18.2
25+ 13.4
Flag of registry Panama 28.3
Liberia 6.8
Hong Kong, China 6.5
Bahamas 4.8
Cyprus 4.4
Singapore 4.7
Russian Federation 3.4
Malta 4.3
Greece 3.2
Others 33.7
Type of ship Bulk carrier 49.8
General cargo/multi-purpose ship 16.6
Oil tanker 8.9
Containership 8.6
Chemical tanker 3.1
Vehicle carrier 3.2
Woodchip carrier 1.8
Refrigerated cargo carrier 1.2
Ro-ro cargo ship 1.2
Gas carrier 1.0
Others 4.7
Classification societies Nippon Kaiji Kyokai 31.7
Lloyd’s Register 14.8
Det Norske Veritas 9.1
American Bureau of Shipping 8.6
Germanischer Lloyd 8.0
Bureau Veritas 8.0
Russian Maritime Register of Shipping 4.8
China Classification Society 3.7
Korean Register of Shipping 4.0
Others 7.3
Year of inspection 2002 14.9
2003 14.7
2004 16.7
2005 15.4
2006 15.1
2007 13.4
2008 9.9
Number of observations 30578
Source: Indian MOU 2002-2008.

Table 2. Frequency of changes in flag and classification societies
A. Measured between two consecutive inspections
Change in flag
Change in classification societies
No Yes All
No 86.3% 4.2% 90.5%
(N=19,883) (N=957) (N=20,840)
Yes 6.9% 2.6% 9.5%
(N=1,582) (N=609) (N=2,191)
All 93.2% 6.8% 100.0%
(N=21,465) (N=1,566) (N=23,031)
B. Measured at the vessel level
At least one change in flag
At least one change in classification societies
No Yes All
No 67.9% 6.9% 74.7%
(N=5,124) (N=517) (N=5,641)
Yes 15.6% 9.7% 25.3%
(N=1,177) (N=729) (N=1,906)
All 83.5% 16.5% 100.0%
(N=6,301) (N=1,246) (N=7,547)
Source: Indian MOU 2002-2008.

Table 3. Description of the sample, by change in flag of registry and change in classification societies Variables Change in
Flag of registry
Change in
classification societies
No Yes No Yes
Age at PSC inspection 0-4 92.5 7.5 95.9 4.1
5-9 90.9 9.1 95.3 4.7
10-14 89.9 10.1 93.2 6.8
15-19 89.0 11.0 93.0 7.0
20-24 90.1 9.9 92.5 7.5
25+ 90.8 9.2 86.9 13.1
Flag of registry Panama 92.5 7.5 94.5 5.5
Liberia 89.2 10.8 93.8 6.2
Hong Kong, China 89.9 10.1 94.3 5.7
Bahamas 90.2 9.8 94.4 5.6
Cyprus 85.8 14.2 91.7 8.3
Singapore 92.7 7.3 97.1 2.9
Russian Federation 97.8 2.2 96.8 3.2
Malta 85.0 15.0 90.4 9.6
Greece 87.1 12.9 95.2 4.8
Others 89.8 10.2 91.0 9.0
Type of ship Bulk carrier 89.3 10.7 93.1 7.0
General cargo/multi-purpose ship 91.0 9.0 90.5 9.5
Oil tanker 89.4 10.6 91.5 8.5
Containership 92.1 7.9 96.3 3.7
Chemical tanker 92.8 7.2 95.5 4.5
Vehicle carrier 97.2 2.8 98.2 1.8
Woodchip carrier 97.6 2.4 99.0 1.0
Refrigerated cargo carrier 80.9 19.1 92.5 7.5
Ro-ro cargo ship 91.3 8.8 92.7 7.3
Gas carrier 97.2 2.8 98.1 2.0
Others 92.7 7.3 94.0 6.0
Classification Nippon Kaiji Kyokai 91.6 8.4 96.1 3.9
societies Lloyd’s Register 89.6 10.5 93.8 6.2
Det Norske Veritas 89.0 11.0 92.6 7.4
American Bureau of Shipping 89.7 10.3 91.7 8.3
Germanischer Lloyd 89.6 10.4 95.1 4.9
Bureau Veritas 87.9 12.1 92.1 7.9
Russian Maritime Register of Shipping 97.1 2.9 97.0 3.1
China Classification Society 94.1 5.9 96.0 4.0
Korean Register of Shipping 90.1 9.9 95.5 4.5
Others 88.4 11.6 74.1 25.9
Number of observations 20,840 2,181 21,465 1,566
Source: Indian MOU 2002-2008.
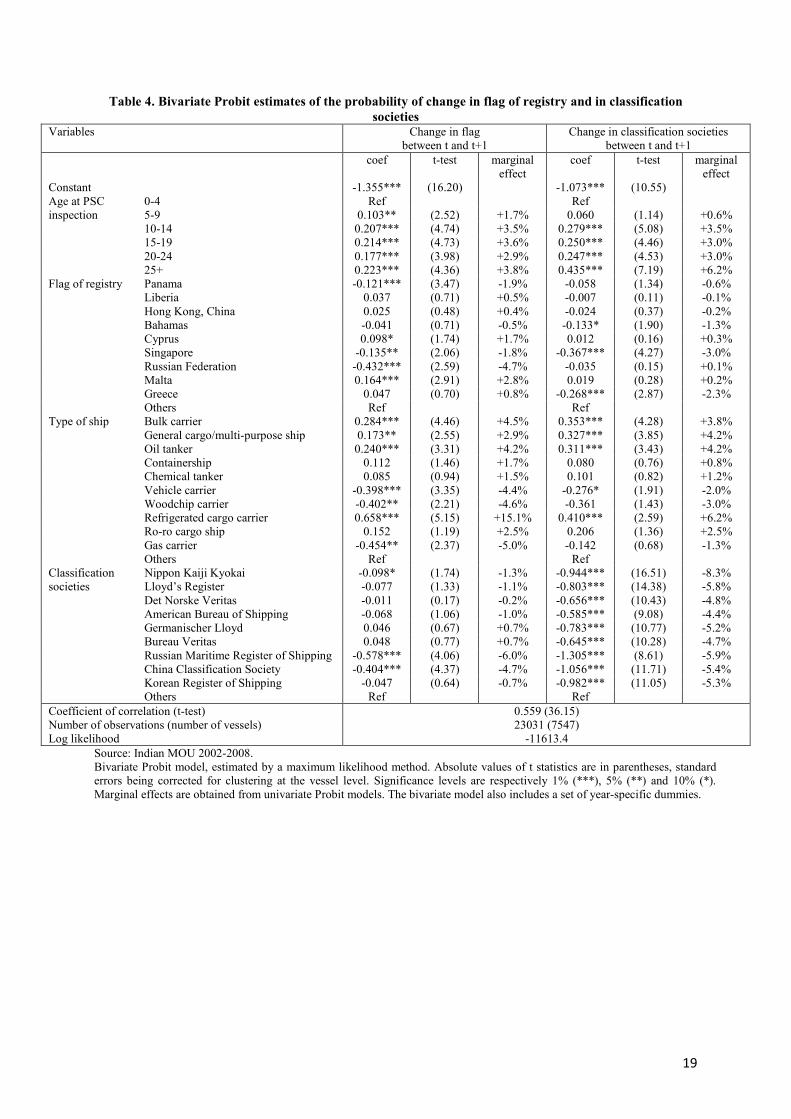
Table 4. Bivariate Probit estimates of the probability of change in flag of registry and in classification
societies Variables Change in flag
between t and t+1
Change in classification societies
between t and t+1
coef t-test marginal
effect
coef t-test marginal
effect
Constant -1.355*** (16.20) -1.073*** (10.55)
Age at PSC 0-4 Ref Ref
inspection 5-9 0.103** (2.52) +1.7% 0.060 (1.14) +0.6%
10-14 0.207*** (4.74) +3.5% 0.279*** (5.08) +3.5%
15-19 0.214*** (4.73) +3.6% 0.250*** (4.46) +3.0%
20-24 0.177*** (3.98) +2.9% 0.247*** (4.53) +3.0%
25+ 0.223*** (4.36) +3.8% 0.435*** (7.19) +6.2%
Flag of registry Panama -0.121*** (3.47) -1.9% -0.058 (1.34) -0.6%
Liberia 0.037 (0.71) +0.5% -0.007 (0.11) -0.1%
Hong Kong, China 0.025 (0.48) +0.4% -0.024 (0.37) -0.2%
Bahamas -0.041 (0.71) -0.5% -0.133* (1.90) -1.3%
Cyprus 0.098* (1.74) +1.7% 0.012 (0.16) +0.3%
Singapore -0.135** (2.06) -1.8% -0.367*** (4.27) -3.0%
Russian Federation -0.432*** (2.59) -4.7% -0.035 (0.15) +0.1%
Malta 0.164*** (2.91) +2.8% 0.019 (0.28) +0.2%
Greece 0.047 (0.70) +0.8% -0.268*** (2.87) -2.3%
Others Ref Ref
Type of ship Bulk carrier 0.284*** (4.46) +4.5% 0.353*** (4.28) +3.8%
General cargo/multi-purpose ship 0.173** (2.55) +2.9% 0.327*** (3.85) +4.2%
Oil tanker 0.240*** (3.31) +4.2% 0.311*** (3.43) +4.2%
Containership 0.112 (1.46) +1.7% 0.080 (0.76) +0.8%
Chemical tanker 0.085 (0.94) +1.5% 0.101 (0.82) +1.2%
Vehicle carrier -0.398*** (3.35) -4.4% -0.276* (1.91) -2.0%
Woodchip carrier -0.402** (2.21) -4.6% -0.361 (1.43) -3.0%
Refrigerated cargo carrier 0.658*** (5.15) +15.1% 0.410*** (2.59) +6.2%
Ro-ro cargo ship 0.152 (1.19) +2.5% 0.206 (1.36) +2.5%
Gas carrier -0.454** (2.37) -5.0% -0.142 (0.68) -1.3%
Others Ref Ref
Classification Nippon Kaiji Kyokai -0.098* (1.74) -1.3% -0.944*** (16.51) -8.3%
societies Lloyd’s Register -0.077 (1.33) -1.1% -0.803*** (14.38) -5.8%
Det Norske Veritas -0.011 (0.17) -0.2% -0.656*** (10.43) -4.8%
American Bureau of Shipping -0.068 (1.06) -1.0% -0.585*** (9.08) -4.4%
Germanischer Lloyd 0.046 (0.67) +0.7% -0.783*** (10.77) -5.2%
Bureau Veritas 0.048 (0.77) +0.7% -0.645*** (10.28) -4.7%
Russian Maritime Register of Shipping -0.578*** (4.06) -6.0% -1.305*** (8.61) -5.9%
China Classification Society -0.404*** (4.37) -4.7% -1.056*** (11.71) -5.4%
Korean Register of Shipping -0.047 (0.64) -0.7% -0.982*** (11.05) -5.3%
Others Ref Ref
Coefficient of correlation (t-test) 0.559 (36.15)
Number of observations (number of vessels) 23031 (7547)
Log likelihood -11613.4
Source: Indian MOU 2002-2008.
Bivariate Probit model, estimated by a maximum likelihood method. Absolute values of t statistics are in parentheses, standard
errors being corrected for clustering at the vessel level. Significance levels are respectively 1% (***), 5% (**) and 10% (*).
Marginal effects are obtained from univariate Probit models. The bivariate model also includes a set of year-specific dummies.

Table 5. Bivariate Probit estimates of the probability of change in flag of registry and in classification
societies
Basic covariates: age, flag, type, organization, year Change in flag
between t and t+1
Change in classification societies
between t and t+1
coef t-test marginal
effect
coef t-test marginal
effect
(1A) basic covariates + any deficiency in t 0.066*** (2.68) +1.07% 0.079*** (2.77) +0.90%
(1B) basic covariates +number of deficiencies in t 0.015*** (5.80) +0.24% 0.014*** (5.28) +0.16%
(2A) basic covariates + any deficiencies in t 0.057** (2.30) +0.93% 0.070 (2.46) +0.79%
+ any deficiencies in t-1 0.093*** (3.42) +1.48% 0.086 (2.79) +1.02%
(2B) basic covariates + number of deficiencies in t 0.016*** (4.62) +0.22% 0.014*** (4.08) +0.14%
+ number of deficiencies in t-1 0.007* (1.80) +0.09% 0.014*** (3.69) +1.42%
(3) basic covariates + detention in t 0.108** (2.37) +1.72% 0.150*** (3.20) +1.90%
(4) basic covariates + detention in t 0.102* (1.79) +1.46% 0.158*** (2.71) +1.85%
+ detention in t-1 0.097* (1.70) +1.41% 0.170*** (2.74) +2.03%
Source: Indian MOU 2002-2008.
Estimates from bivariate Probit models, estimated by a maximum likelihood method. Absolute values of t statistics are in
parentheses, standard errors being corrected for clustering at the vessel level. Significance levels are respectively 1% (***), 5%
(**) and 10% (*). Marginal effects are obtained from univariate Probit models.

Table 6. Dynamic Probit estimates of the probability of change in flag of registry and in classification
societies Variables Change in flag
between t and t+1
Change in class between t
and t+1
coef t-test coef t-test
Constant -1.870*** (12.51) -1.862*** (9.84)
Change in flag between t-1 and t 0.270*** (4.26)
Change in flag in t=1 -0.002 (0.04)
Change in class between t-1 and t 0.769*** (8.64)
Change in class in t=1 0.183** (2.01)
Number of deficiencies 0.007 (1.45) -0.002 (0.30)
Mean number of deficiencies 0.034*** (3.86) 0.041*** (4.01)
Number of observations (number of vessels) 11613 (2451) 11613 (2451)
Log likelihood -2809.2 -2062.6
Source: Indian MOU 2002-2008.
Dynamic Probit models, estimated by the conditional approach of Wooldridge (2005). Absolute values of t statistics are in
parentheses. Significance levels are respectively 1% (***), 5% (**) and 10% (*).The dynamic models also control for age (6
dummies), flag (10 dummies), type (10 dummies) and organization (10 dummies).

Appendix A. Construction of the explanatory variables
Flag of registry:
- Nine categories: Panama, Liberia, Hong Kong and China, Bahamas, Cyprus, Singapore, Russian
Federation, Malta, Greece
- Reference category: Others, which includes Saint Vincent and the Grenadines; China; Marshall
Islands; Norway; Korea, Republic of; Philippines; Antigua and Barbuda; Malaysia; Isle of Man (UK);
India; Netherlands; Japan; Thailand; United Kingdom (UK); Turkey; Korea, Democratic People's
Republic; Denmark; Italy; Taiwan, China; Azerbaijan; Bermuda (UK); Vanuatu; Germany; Cayman
Islands (UK); Iran; Cambodia; Indonesia; France; Sweden; Bangladesh; Belize; United Arab Emirates
(UAE); Sri Lanka; Papua New Guinea; Saudi Arabia; Vietnam; Egypt; Croatia; Georgia; Switzerland;
Myanmar; Comoros; Kuwait; Netherlands Antilles; Tonga; Jordan; Qatar; Belgium; Syrian Arab
Republic; Gibraltar (UK); Turkmenistan; Mongolia; Ethiopia; Pakistan; Bolivia; Lebanon; United
States of America; São Tomé and Príncipe; New Zealand; Bahrain; Ukraine; Dominica; Saint Kitts
and Nevis; Honduras; Algeria; Sudan; Barbados; Luxembourg; Mauritius; Ireland; Portugal; Samoa;
Seychelles; Ghana; Sierra Leone; Slovakia; Bulgaria; Maldives; Fiji; Eritrea; Brazil; Morocco;
Tuvalu; Jamaica; South Africa; Tunisia; Spain; Lithuania; Chile; Colombia; Cook Islands; Tanzania;
Dominican Republic; Kiribati; Namibia; Somalia; Costa Rica; and Nigeria. This category also
includes vessels listed as being registered under unspecified “other” flags.
Type of ship:
- Ten categories: Bulk carrier, General cargo/multi-purpose ship, Oil tanker, Containership, Chemical
tanker, Vehicle carrier, Woodchip carrier, Refrigerated cargo carrier, Ro-ro cargo ship, Gas carrier
- Reference category: Others, which includes livestock carrier; offshore service vessel; combination
carrier; passenger ship; tugboat; NLS tanker; heavy load carrier; special purpose ship; ro-ro passenger
ship; MODU & FPSO; fishing vessel; high speed passenger craft; high speed cargo craft. This
category also includes vessels listed under unspecified “other types of ship”.
Classification societies (recognized organizations):
- Nine categories: Nippon Kaiji Kyokai, Lloyd’s Register, Det Norske Veritas, American Bureau of
Shipping, Germanischer Lloyd, Bureau Veritas, Russian Maritime Register of Shipping, China
Classification Society, Korean Register of Shipping
- Reference category: Others, which lincludes Registro Italiano Navale; Indian Register of Shipping;
China Corporation Register of Shipping; International Register of Shipping; Korea Classification
Society; International Naval Survey Bureau; Hellenic Register of Shipping; Polski Rejestr Statkow;
Croatian Register of Shipping; Biro Klasifikasi Indonesia; Turkish Lloyd; Viet Nam Register of
Shipping; Register of Shipping, Albania; Isthmus Bureau of Shipping; Honduras International
Surveying and Inspection Bureau; Panama Register Corporation; Panama Maritime Documentation
Services; Panama Shipping Registrar Inc.; Global Marine Bureau; Panama Maritime Surveyors
Bureau Inc; RINAVE Portuguesa; Bulgarski Koraben Registar; Shipping Register of Ukraine;
INCLAMAR; Honduras Maritime Inspection; Panama Bureau of Shipping; Belize Register
Corporation; Ceskoslovensky Lodin Register; Seefartsaht Helsinki; Honduras Bureau of Shipping;
Russian River Register; Marconi International Marine Company Ltd; Registro Internacional Naval
S.A.; Compania Nacional de Registro e Inspeccion de Naves. This category also includes vessels
listed under “Other,” “No Class,” and “Class Withdrawn”.

References
Alderton T. and N. Winchester (2002): ‘Flag states and safety: 1997-1999’, Maritime Policy
and Management, 29(2), 151-162.
Bimco, Intercargo, International Chamber of Shipping, International Shipping Federation,
Intertanko (2007): Shipping Industry Guidelines on Flag State Performance. Retrieved from
http://www.marisec.org/flag-performance/
Greene W. H. (2008): Econometric analysis, 6th Edn. NJ: Prentice Hall.
Heckman J.J. (1981): ‘The Incidental Parameters Problem and the Problem of Initial
Conditions in Estimating a Discrete Time - Discrete Data Stochastic Process’, in Manski C.F.
and D. McFadden. (eds.). Structural Analysis of Discrete Data with Econometric
Applications, Cambridge, MIT Press.
Hoffman J., R.J. Sanchez and W.K. Talley (2005): ‘Determinants of vessel flag’. in Cullinane
K. (eds) Research in Transportation Economics 12, ch. 6, 173-219, Elsevier.
http://www.parismou.org/
Knapp S. (2007): The econometrics of maritime safety – recommendation to enhance safety at
sea. Doctoral Thesis, Erasmus University, Rotterdam.
Li K.X. and J. Wonham (1999): ‘Who is safe and who is at risk: A study of 20-year-record on
accident total loss indifferent flags’, Maritime Policy and management, 26(2), 137-144.
OECD (2001): The cost to users of substandard shipping, SSY Consultancy & Research.
Retrieved from http://ntl.bts.gov/lib/24000/24400/24466/1827388.pdf
OECE (1996): Competitive advantages obtained by some shipowners as a result of non-
observance of applicable international rules and standards. OECD/GD(96)4.
Robert S. and P.B. Marlow (2002): ‘Casualties in dry bulk shipping (1963-1996)’, Marine
Policy, 26, 437-450.
Talley W. (1999): ‘Determinants of ship accident seaworthiness’, International Journal of
Maritime Economics, 1(2), 1-14.
Wooldridge J. (2005): ‘Simple Solutions to the Initial Conditions Problem in Dynamic,
Nonlinear Panel Data Models with Unobserved Heterogeneity’, Journal of Applied
Econometrics, 20, 39-54.