do primary care physicians treating minority patients report greater problems delivering quality...
TRANSCRIPT

Do Primary Care Physicians Treating Minority Patients Report Greater Problems Delivering Quality Care?1
A New Perspective on Racial and Ethnic Disparities
James D. Reschovsky, Ph.D.Ann S. O’Malley, M.D.
Center for Studying Health System Change
1 Results based in part on James D. Reschovsky and Ann S. O’Malley, “Do Primary Care PhysiciansTreating Minority Patients Report Problems Delivering High-Quality Care,” Health Affairs 26(3):w222–w231 (published online Apr. 22, 2008).

Summary
Racial and ethnic disparities in primary health care likely reflect the aggregate socioeconomic composition of the physician’s patient panels as much as they do differences in individual patient characteristics. Physicians in high-minority practices depend more on low-paying Medicaid, receive lower private insurance reimbursements, and have lower incomes. These resource constraints help explain greater difficulties reported by these physicians with care processes—such as coordination of care, ability to spend adequate time with patients during office visits, and ability to obtain specialty referrals. Efforts to increase resources flowing to physicians treating many low-income minority patients—for instance by raising Medicaid reimbursements—would reduce racial and ethnic healthcare disparities.

Primary care for minorities is concentrated among a small proportion of physicians.
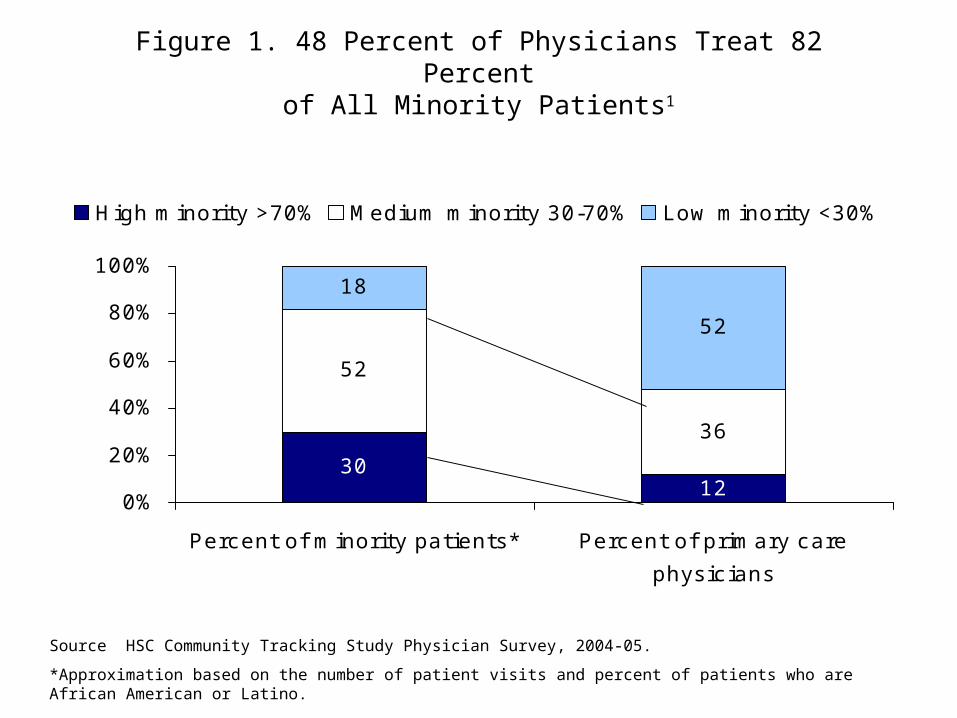
Figure 1. 48 Percent of Physicians Treat 82 Percentof All Minority Patients1
Source HSC Community Tracking Study Physician Survey, 2004-05.
*Approximation based on the number of patient visits and percent of patients who are African American or Latino.
12
52
36
18
52
30
0%
20%
40%
60%
80%
100%
Percent of minority patients* Percent of primary care
physic ians
High minority >70% Medium minority 30-70% Low minority <30%
Personal and practice characteristics of primarycare physicians in low-, medium-, and high-minoritypractices often differ.
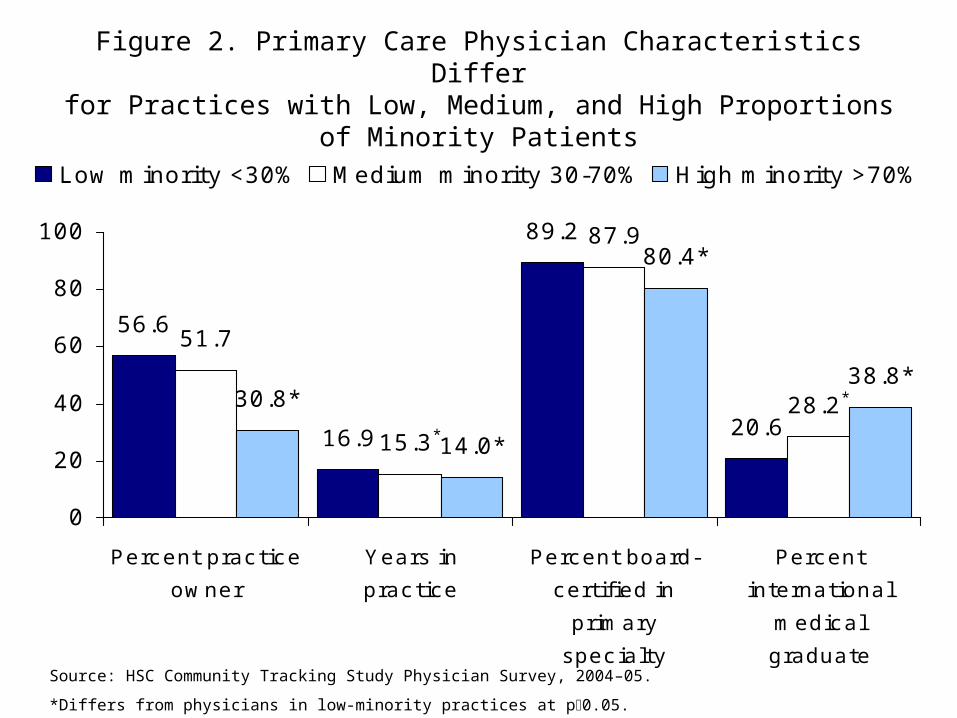
Figure 2. Primary Care Physician Characteristics Differfor Practices with Low, Medium, and High Proportions
of Minority Patients
20.6
89.2
16.9
56.6
28.2*
87.9
15.3*
51.7
38.8*
80.4*
14.0*
30.8*
0
20
40
60
80
100
Percent practice
owner
Y ears in
practice
Percent board-
certified in
primary
spec ialty
Percent
international
medical
graduate
Low minority <30% Medium minority 30-70% High minority >70%
Source: HSC Community Tracking Study Physician Survey, 2004–05.
*Differs from physicians in low-minority practices at p0.05.
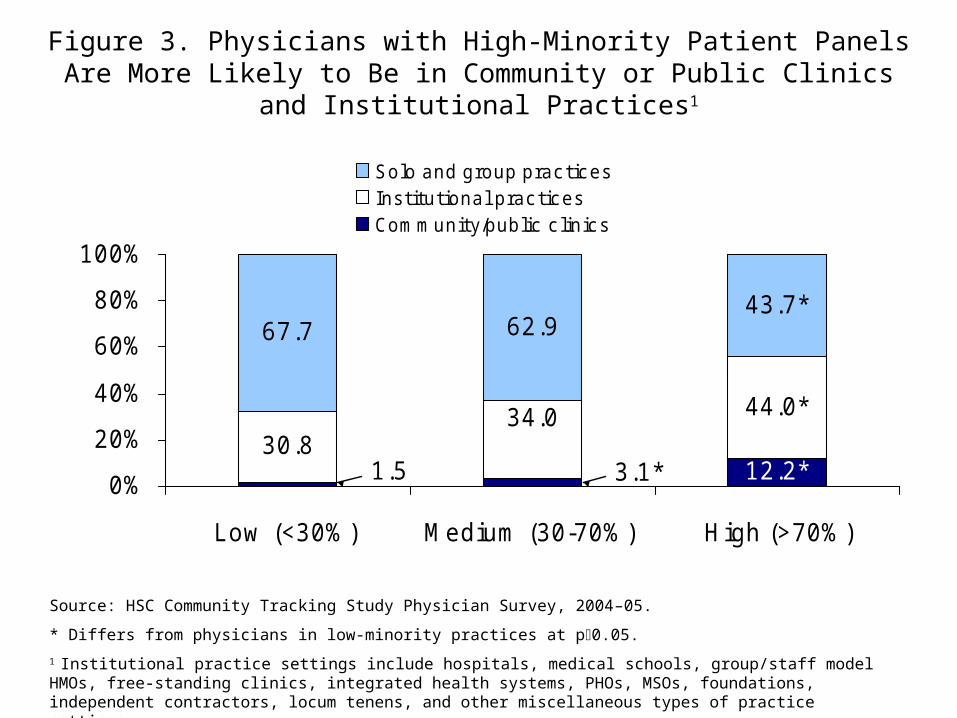
Figure 3. Physicians with High-Minority Patient PanelsAre More Likely to Be in Community or Public Clinics
and Institutional Practices1
30.8
67.7 62.9
12.2*3.1*1.5
44.0*34.0
43.7*
0%
20%
40%
60%
80%
100%
Low (<30%) Medium (30-70%) High (>70%)
Solo and group practicesInstitutional practicesCommunity/public c linics
Source: HSC Community Tracking Study Physician Survey, 2004–05.
* Differs from physicians in low-minority practices at p0.05.
1 Institutional practice settings include hospitals, medical schools, group/staff model HMOs, free-standing clinics, integrated health systems, PHOs, MSOs, foundations, independent contractors, locum tenens, and other miscellaneous types of practice settings.

Figure 4. Physicians with More Minority PatientsHave Same Level of Health Information Technology (IT)
Adoption as Those Treating Fewer Minority Patients
4.1 4.34.0
0
1
2
3
4
5
Number of Clinically Related Functions That
Practice IT Systems Perform
Low minority <30% Medium minority 30-70% High minority >70%
Source: HSC Community Tracking Study Physician Survey, 2004–05.
* Differs from physicians in low minority practices at p0.05.
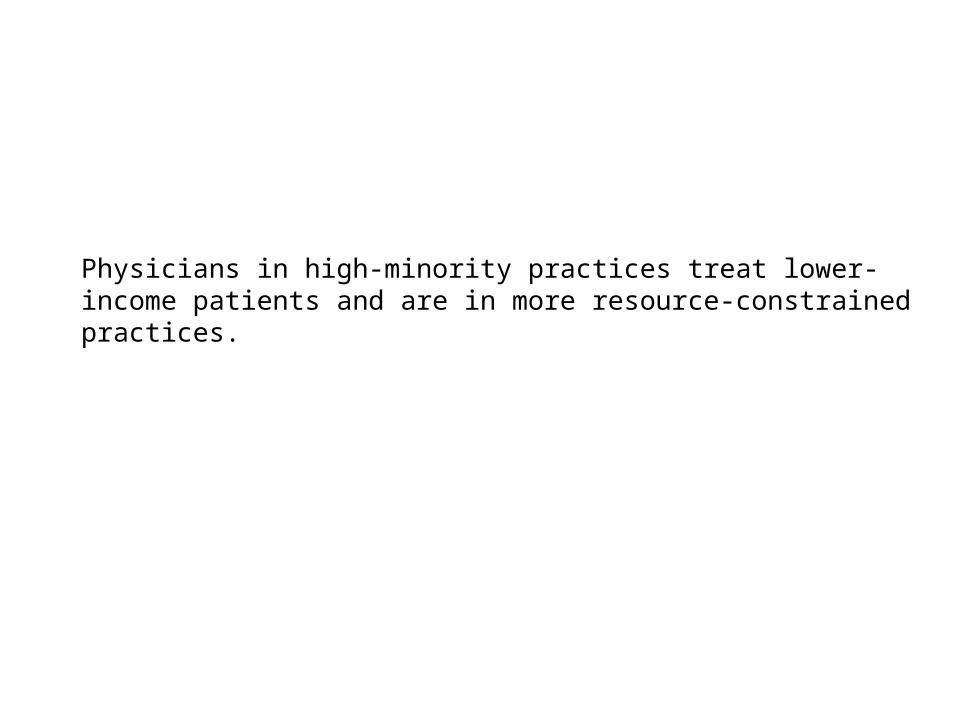
Physicians in high-minority practices treat lower-income patients and are in more resource-constrained practices.

Figure 5. High-Minority Physician Practices Are inCommunities with Lower Patient Income and More Uninsured
48,364
43,049*
35,346*
$0
$20,000
$40,000
$60,000
Median Household
Income in Practice Zip
Code
12.4
15.3*16.9*
0%
5%
10%
15%
20%
Percent Uninsured in
County
Source: HSC Community Tracking Study Physician Survey, 2004–05.
* Differs from physicians in low-minority practices at p0.05.
Low (<30%) Medium (30–70%) High (>70%)

Figure 6. Primary Care Practices with More MinoritiesAre More Reliant on Medicaid Revenue, Less Reliant
on Private Insurance
55.4
13.1
31.7 52.528.2*
19.3*
42.5*
33.7*
24.4*
Low Minority Medium Minority High Minority (<30%) (30–70%) (>70%)
Source: HSC Community Tracking Study Physician Survey, 2004–05.
* Differs from physicians in low-minority practices at p0.05.
Private Medicaid Medicare

Figure 7. Physicians in High-Minority Practices Are in Communities with Lower Private and Medicaid
Payment Rates1 to Physicians
93.2 92.6 89.2*
0
20
40
60
80
100
Private insurance
payment index
Paym
ent
Index
71.2 75.066.6*
0
20
40
60
80
100
Ratio of Medicaid to
Medicare payments
Rati
o
Source: HSC Community Tracking Study Physician Survey, 2004–05.
1 Private insurances payment index developed by GAO based on Federal Employee Health Benefits Program PPO plans; Medicaid to Medicare payment index from Menges, et al., 2001.
* Differs from physicians in low-minority practices at p0.05.
Low minority, <30% Medium minority, 30–70% High minority, >70%
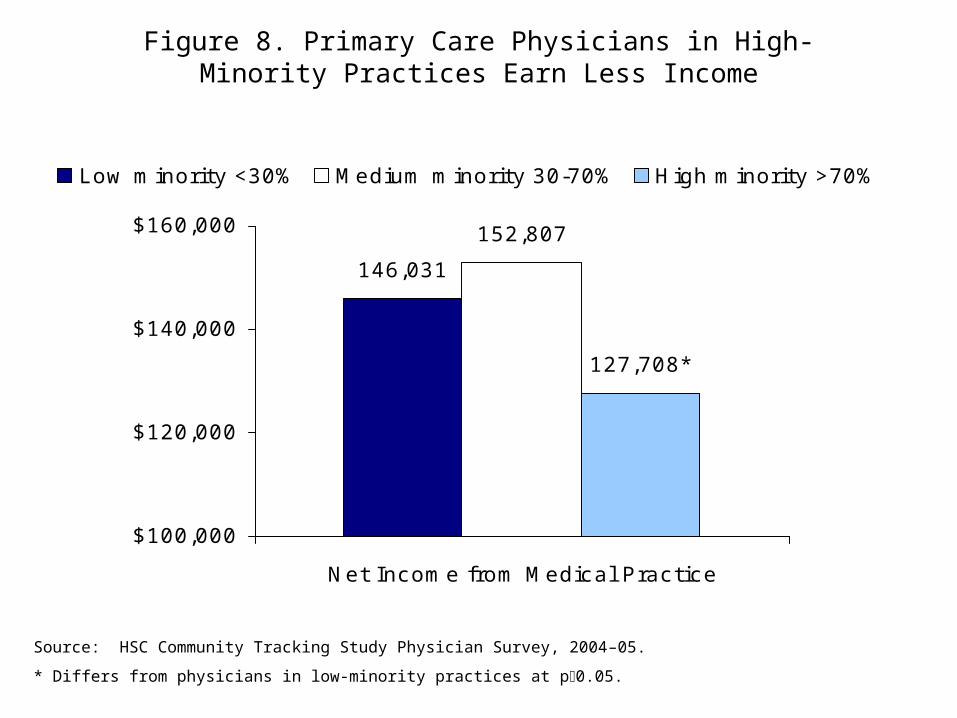
Figure 8. Primary Care Physicians in High-Minority Practices Earn Less Income
146,031
152,807
127,708*
$100,000
$120,000
$140,000
$160,000
Net Income from Medical Practice
Low minority <30% Medium minority 30-70% High minority >70%
Source: HSC Community Tracking Study Physician Survey, 2004–05.
* Differs from physicians in low-minority practices at p0.05.

Primary care physicians in high-minority practices are more likely to report they are unable to provide high-quality care to all of their patients—a pattern in part reflecting lower resources flowing to their practices.

Figure 9. Physicians in Higher-Minority PracticesReport Greater Difficulty Providing Quality Care to Patients,1
in Part Explained by Lower Resource Levels
21.7 23.225.9*
21.7*
16.1 16.7
0.0
5.0
10.0
15.0
20.0
25.0
30.0
Low Minority,
<30%
Medium
Minority, 30-
70%
High Minority,
>70%
Unadjusted percent Adjusted percent
Source: HSC Community Tracking Study Physician Survey, 2004–05.
1 Based on disagreement with the statement, “It is possible to provide high-quality care to all my patients.”
2 Adjusted for practice resource levels (payer mix, reimbursement levels, and interactions between the two).
* Differs from physicians in low-minority practices at p0.05.
2
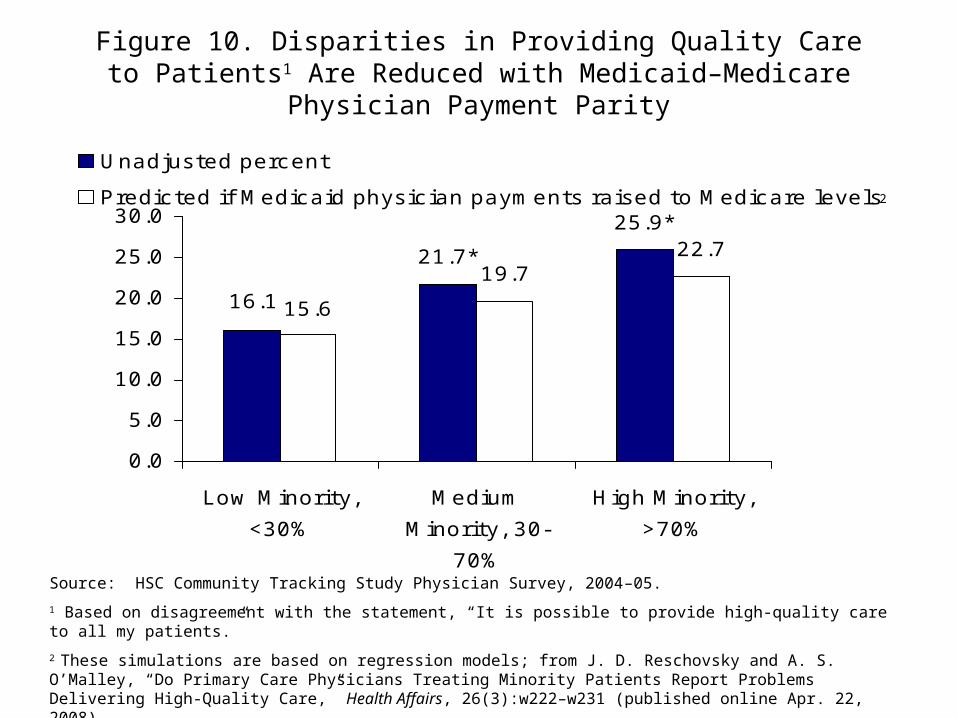
Figure 10. Disparities in Providing Quality Careto Patients1 Are Reduced with Medicaid–Medicare Physician
Payment Parity
19.722.7
25.9*
21.7*
16.1 15.6
0.0
5.0
10.0
15.0
20.0
25.0
30.0
Low Minority,
<30%
Medium
Minority, 30-
70%
High Minority,
>70%
Unadjusted percent
Predicted if Medicaid physic ian payments raised to Medicare levels
Source: HSC Community Tracking Study Physician Survey, 2004–05.
1 Based on disagreement with the statement, “It is possible to provide high-quality care to all my patients.”
2 These simulations are based on regression models; from J. D. Reschovsky and A. S. O’Malley, “Do Primary Care Physicians Treating Minority Patients Report Problems Delivering High-Quality Care,” Health Affairs, 26(3):w222–w231 (published online Apr. 22, 2008).
* Differs from physicians in low-minority practices at p0.05. No significance tests for simulated values provided.
2
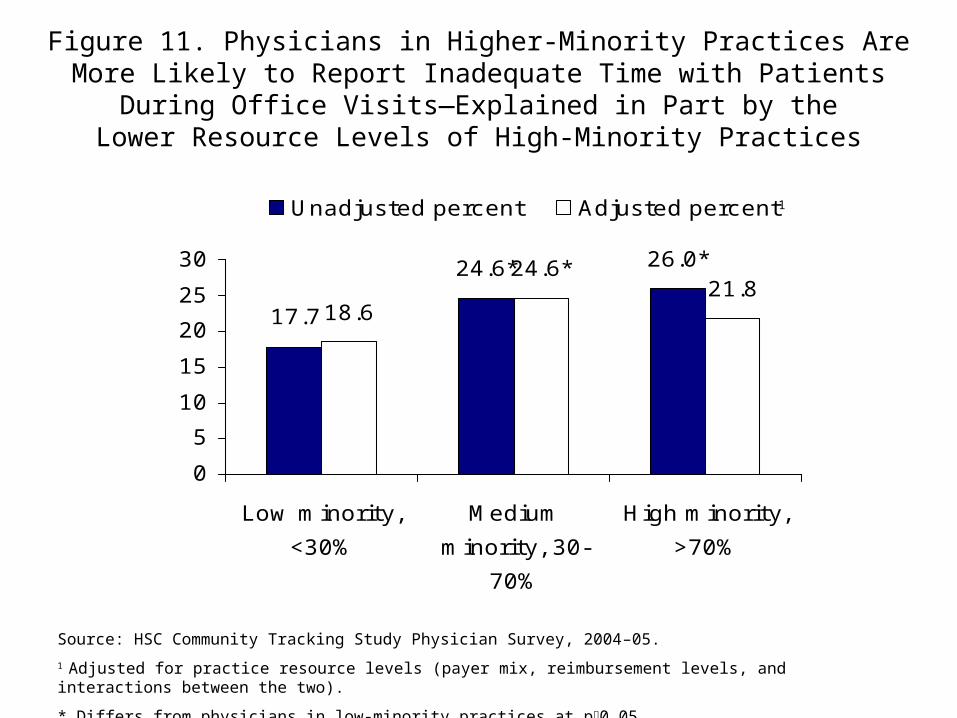
Figure 11. Physicians in Higher-Minority Practices AreMore Likely to Report Inadequate Time with Patients
During Office Visits—Explained in Part by theLower Resource Levels of High-Minority Practices
21.817.7
24.6* 26.0*
18.6
24.6*
0
5
10
15
20
25
30
Low minority,
<30%
Medium
minority, 30-
70%
High minority,
>70%
Unadjusted percent Adjusted percent
Source: HSC Community Tracking Study Physician Survey, 2004–05.
1 Adjusted for practice resource levels (payer mix, reimbursement levels, and interactions between the two).
* Differs from physicians in low-minority practices at p0.05.
1
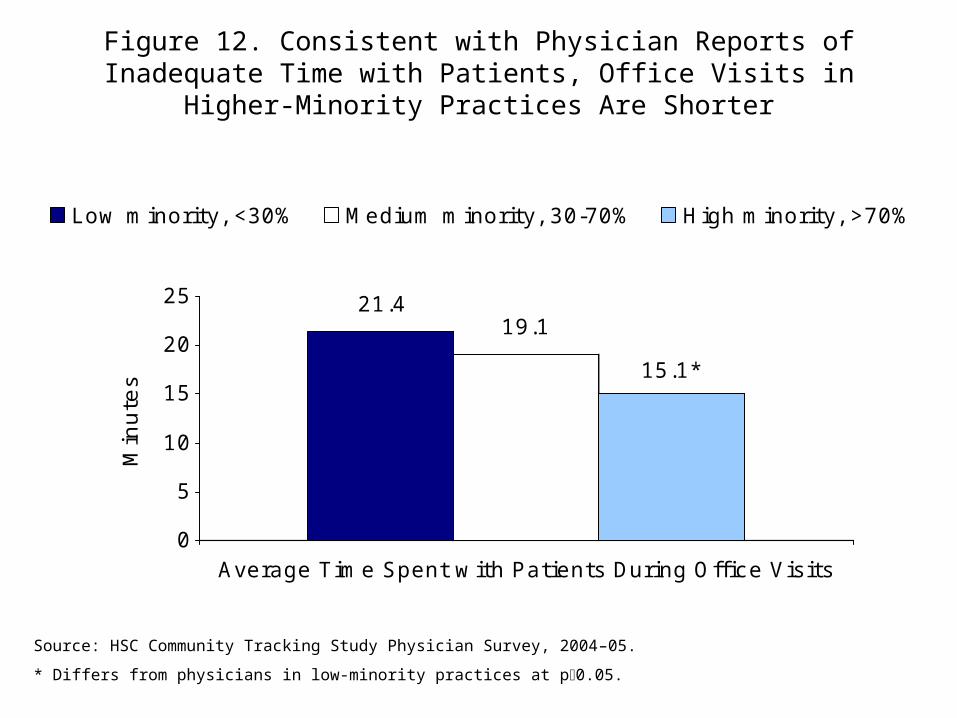
Figure 12. Consistent with Physician Reports of Inadequate Time with Patients, Office Visits in
Higher-Minority Practices Are Shorter
21.419.1
15.1*
0
5
10
15
20
25
Min
ute
s
Average Time Spent w ith Patients During Office Visits
Low minority, <30% Medium minority, 30-70% High minority, >70%
Source: HSC Community Tracking Study Physician Survey, 2004–05.
* Differs from physicians in low-minority practices at p0.05.
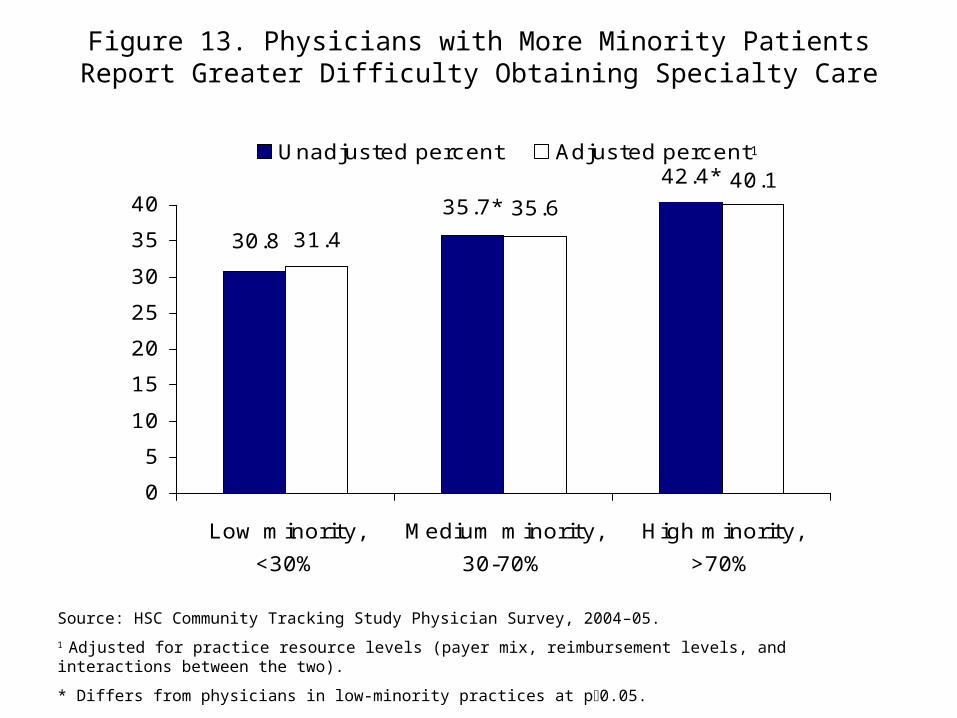
Figure 13. Physicians with More Minority PatientsReport Greater Difficulty Obtaining Specialty Care
42.4*
35.7*
30.8
40.135.6
31.4
0
5
10
15
20
25
30
35
40
Low minority,
<30%
Medium minority,
30-70%
High minority,
>70%
Unadjusted percent Adjusted percent
Source: HSC Community Tracking Study Physician Survey, 2004–05.
1 Adjusted for practice resource levels (payer mix, reimbursement levels, and interactions between the two).
* Differs from physicians in low-minority practices at p0.05.
1

Figure 14. Physicians with More Minority PatientsAre More Likely to Report That the Scope of Care
They Are Expected to Treat Without Referral Is Too Broad
28.4*
22.5*
18.1
25.222.6
18.7
0%
10%
20%
30%
Low minority,
<30%
Medium minority,
30-70%
High minority,
>70%
Unadjusted percent Adjusted percent
Source: HSC Community Tracking Study Physician Survey, 2004–05.
1 Adjusted for practice resource levels (payer mix, reimbursement levels, and interactions between the two).
* Differs from physicians in low-minority practices at p0.05.
1

Figure 15. Physicians in High-Minority Practices Face a Greater Challenge Coordinating Care1 Than Those Treating Fewer Minorities—
in Part Attributable to Lower Practice Resources
24.1*
14.5*
11.0
21.2*
14.6*
11.5
0
5
10
15
20
25
Low minority,
<30%
Medium minority,
30-70%
High minority,
>70%
Unadjusted percent Adjusted percent
Source: HSC Community Tracking Study Physician Survey, 2004–05.
1 As indicated by the percent reporting not getting timely reports from other providers is a major problem affecting quality.
2 Adjusted for practice resource levels (payer mix, reimbursement levels, and interactions between the two).
* Differs from physicians in low-minority practices at p0.05.
2

Figure 16. Physicians in High-Minority Practices Do Not Report Greater Difficulties Maintaining Continuity of Care with Patients Than
Those Treating Fewer Minority Patients1
18.317.815.7 16.3
17.316.5
0
5
10
15
20
25
Low minority,
<30%
Medium minority,
30-70%
High minority,
>70%
Unadjusted percent Adjusted percent
Source: HSC Community Tracking Study Physician Survey, 2004–05.
1 As indicated by the percent disagreeing with the statement “It is possible to maintain the kind of continuing relationship with patients over time that promote the delivery of high quality care.”
2 Adjusted for practice resource levels (payer mix, reimbursement levels, and interactions between the two).
* Differs from physicians in low-minority practices at p0.05.
2

High-minority practices have better access tooutpatient mental health services.

Figure 17. There Are Fewer Reports of Difficulties Obtaining Outpatient Mental Health Services in
High-Minority Practices
68.360.5*
49.3*
0%
20%
40%
60%
80%
Percent Reporting Problems Obtaining Outpatient
Mental Health Services for Patients
Low minority <30% Medium minority 30-70% High minority >70%
Source: HSC Community Tracking Study Physician Survey, 2004–05.
* Differs from physicians in low-minority practices at p0.05.
The percent of minority patients in a practice isnot associated with reports of difficulties accessing other types of services for patients.
Indicators of practice resources (payer mix and reimbursement levels) have little impact onthese reports.
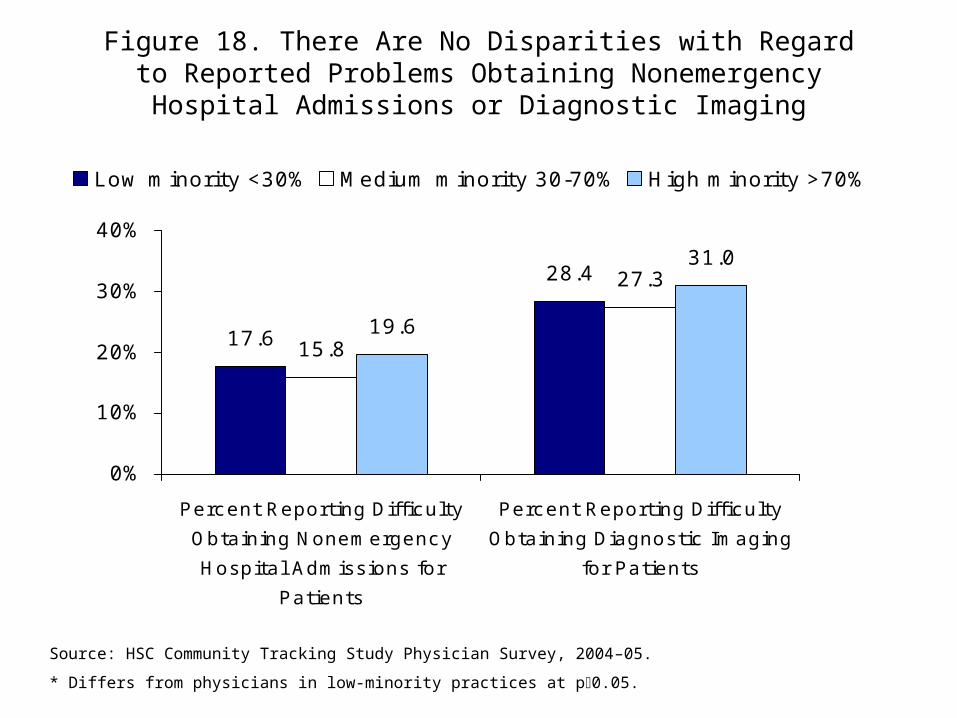
Figure 18. There Are No Disparities with Regardto Reported Problems Obtaining Nonemergency
Hospital Admissions or Diagnostic Imaging
17.6
28.4
15.8
27.3
19.6
31.0
0%
10%
20%
30%
40%
Percent Reporting Difficulty
Obtaining Nonemergency
Hospital Admissions for
Patients
Percent Reporting Difficulty
Obtaining Diagnostic Imaging
for Patients
Low minority <30% Medium minority 30-70% High minority >70%
Source: HSC Community Tracking Study Physician Survey, 2004–05.
* Differs from physicians in low-minority practices at p0.05.

Conclusions
• The care of minority patients is concentrated in practices whose physicians treat many other minority patients.
• High-minority practices appear to have less adequate resources, as indicated by their payer mix, reimbursements, and incomes.
• Primary care physicians’ ability to effectively function as their patients medical homes—coordinating care, obtaining specialty referrals, spending adequate time with patients—is more difficult in higher-minority practices. For those physicians with predominantly minority patients, resource levels appear to explain some of this association.

Policy Remedies
• Increase resources for physician practices that predominantly treat low-income/high-minority populations through:
– Health insurance coverage expansions
– Greater subsidies to encourage physicians (including specialists) to serve in low-income, high-minority areas
– Increased Medicaid payments to physicians
– Practice supports for medical home functions.