do school lunches contribute to childhood obesity?the role of school food environments in addressing...
TRANSCRIPT

Do School Lunches Contribute toChildhood Obesity?
Diane Whitmore Schanzenbach
a b s t r a c t
This paper assesses whether school lunches contribute to childhood obesity. Iemploy two methods to isolate the causal impact of school lunches onobesity. First, using panel data, I find that children who consume schoollunches are more likely to be obese than those who brown bag their luncheseven though they enter kindergarten with the same obesity rates. Second, Ileverage the sharp discontinuity in eligibility for reduced-price lunch tocompare children just above and just below the eligibility cutoff. Students aremore likely to be obese, and weigh more if they are income-eligible forreduced price school lunches.
Introduction
Obesity is a pressing national health problem. Recent statistics indi-cate that 30 percent of adults are obese, and another 35 percent are overweight. Obe-sity is also common among children: Sixteen percent of children aged 6–19 years oldare obese (NCHS 2004a; NCHS 2004b).1 To date, few policy levers have been foundthat have much promise to impact obesity. Because children spend a substantial por-tion of their waking hours in school, and consume one-third to one-half of their dailycalories there, school policies seem to be a promising place to look to implement
Diane Whitmore Schanzenbach is a professor at the Harris School of Public Policy, University ofChicago. She thanks Kristin Butcher, David Card, John Cawley, Daniel Eisenberg, Art Goldsmith,Hilary Hoynes, Sarah Reber, two anonymous referees, and numerous seminar participants, especiallythe annual meeting of the Scholars in Health Policy Research meeting for helpful comments. Generousfinancial support from the Robert Wood Johnson Foundation and the Center for Human Potential andPublic Policy is gratefully acknowledged. The data used in this article can be obtained beginningJanuary 2010 through December 2013 from Diane Schanzenbach; Harris School of Public Policy; 1155E. 60th Street; Chicago, IL 60637; [email protected].½Submitted October 2005; Accepted April 2008�ISSN 022-166X E-ISSN 1548-8004 � 2009 by the Board of Regents of the University of Wisconsin System
THE JOURNAL OF HUMAN RESOURCES d 44 d 3
1. Child obesity is defined as a body mass index (BMI, the ratio of weight in kg to height in meterssquared) that surpasses the 95th percentile of a fixed distribution for a child’s age and gender. For elemen-tary school age students, the cutoff is around a BMI of 20.

public health strategies aimed at reducing obesity (see for example Haskins, Paxson,and Donohue 2006; Surgeon General of the United States 2001).
The National School Lunch Program (NSLP) serves lunch to almost 30 millionstudents—60 percent of the total student population (ERS 2007). Almost all publicschools offer the NSLP, which annually provides $6.1 billion in total cash paymentsto local schools2 and an additional $4.7 billion in in-kind surplus food commoditiessuch as fruit juices and peanut butter. Although a large fraction of school lunch par-ticipants get their lunch free (48 percent) or at a reduced price (9 percent), a substan-tial share (43 percent) is from nonpoor families and pay full price for lunch. As aresult, if school lunches play a contributing role in the child obesity epidemic, mak-ing them healthier has the potential to impact a large number of children across so-cioeconomic status, race, and geographic boundaries.
In this paper, I attempt to isolate the causal impact of school lunches on childhoodobesity, by using two different approaches to address the identification problem, includ-ing looking at changes in obesity over time and using a regression-discontinuity ap-proach. These approaches – which employ very different identification strategies andcover students from different parts of the income distribution – suggest that schoollunch eaters gain more weight after starting school than do students who do not con-sume school lunch, who I call ‘‘brown baggers.’’3 I then present calculations from di-etary recall data that indicate that children who eat school lunches consume an extra 60or so calories per day, and that a calorie increase of this magnitude is large enough tocause a substantial increase in obesity rates among children. This suggests that a policyintervention to make school lunches less caloric might reduce the childhood obesityrate – at least among the elementary school-aged children studied here.
II. History, Previous Research, and Policy Context
Economists have relatively recently come to be interested in the studyof obesity and overweight. In a recent paper, Cutler, Glaeser, and Shapiro (2003) studythe doubling of obesity rates among adults over the past 20 years. They estimate that theincrease in obesity can be accounted for by a calorie imbalance of 100 to 150 caloriesper day, and find that the recent increase is likely due to eating more calories (opposedto burning fewer calories through activity).4 Comparing recent food dietary recall datato those collected in the early 1980s, they find that the increase in calorie intake appearsto come from the consumption of more meals and snacks per day, and not from ‘‘super-sizing’’— that is, eating a larger number of calories per meal.
2. For comparison, Title I provided $9.8 billion in 2002. In 2003, the government reimbursed schools $2.14for every free lunch served, $1.74 for each reduced price lunch, and $0.20 for each full price lunch (FNS2005).3. Brown baggers could be misleading here if children eat foods not from home but from other outlets suchas vending machines or a la carte options. Because the data are for young children between kindergartenand grade 3, there are fewer nonschool lunch food options. For example, 15 percent of elementary schoolssell foods a la carte (compared to 69 percent of high schools). (Source: Author’s calculations from theSchool Nutrition and Dietary Analysis–II data set).4. Lakdawalla and Philipson (2002) find that much of the increase in body weight over the past century isdue to decreased physical activity – largely from workers moving away from physically demanding jobsand toward sedentary ones.
Schanzenbach 685

Even less work has been done by economists to examine overweight among chil-dren. Anderson, Butcher, and Levine (2003) use the National Longitudinal Survey ofYouth to follow children over time, and measure the effects of increased maternalemployment rates over the past 30 years—including all the attendant changes inchildren’s lives that come when mothers become employed, such as eating morepre-prepared meals and potentially playing outside less. Altogether, increased mater-nal employment only can explain less than one percentage point of the nine percent-age point increase in overweight. Anderson and Butcher (2005) investigate theimpact of vending machines and find that a ten percentage point increase in accessto vending machines is associated with a 2.2 percentage point increase in the bodymass index of students who have overweight parents.5
The role of school food environments in addressing children’s overweight has got-ten increased policy attention. In 1995, after research showed that many schoollunches failed to meet nutrition requirements, Congress passed the ‘‘School MealsInitiative for Healthy Children.’’ The new policy required food served to meetone-third of the child recommended daily allowance (RDA) of calories, protein, cal-cium, iron, and vitamins A and C, and for no more than 30 percent of calories tocome from fat.6 In addition, schools were to restrict foods of ‘‘minimal nutritionalvalue,’’ such as soda. In a subsequent survey, two-thirds of cafeteria plannersreported that the new guidelines had at least somewhat changed their school menus.7
Recently there has also been substantial policy activity restricting student access tovending machines. While vending machines are governed by state law and are not di-rectly related to the Federal School Lunch Program, changes in vending machineavailability certainly can play a role in the overall school-food climate. Researchby Anderson and Butcher (2006) suggests that the introduction (or removal) ofvending machines may have some impact on obesity rates among high school students,but since relatively few elementary school students have access to vending machines,the policies have a more limited scope to affect the younger children studied in thispaper.
Predecessors to the National School Lunch Program (NSLP) date back to the GreatDepression, when the government began to distribute surplus farm commodities toschools with large populations of malnourished students. In 1946 Congress passedthe National School Lunch Act (Gunderson 1971). The act’s statement of purpose indi-cates that a nonprofit school lunch program should be established ‘‘as a measure of na-tional security’’ with the dual purposes ‘‘to safeguard the health and well-being of theNation’s children and to encourage the domestic consumption of nutritious agriculturalcommodities and other food.’’ A very nice recent historic evaluation of the impact ofthe NSLP in the 1960s found that the introduction of the program improved educationalattainment of students exposed to the program, but did not appear to have long-termhealth impacts (Hinrichs 2007). The number of students participating in the NSLP
5. Vending machines are much more prevalent in high schools. Almost 90 percent of high schools havevending machines or otherwise sell food not associated with the National School Lunch Program, whileonly 33 percent of elementary schools do (Centers for Disease Control 2006).6. Saturated fat was to account for fewer than 12 percent of calories.7. Fewer than 4 percent of schools meet all of the guidelines outlined in the Healthy Children Initiative(Source: Author’s calculation from the School Nutrition Dietary Assessment—II data set).
686 The Journal of Human Resources

has grown from 7.1 million in 1946 to 28.4 million in 2003, and the USDA estimatesthat 187 billion lunches have been served under the program.
To date, most research on the National School Lunch Program has been focused onhow the program impacts intake of calories and various nutrients. Most research hasfound that NSLP participants consume more vitamins and minerals at lunch thannonparticipants, and that the 24-hour effect is smaller but still statistically significant(Fraker 1987; Devaney, Gordon, and Burghardt 1995; Gleason and Suitor 2001,2003).8 Gleason and Suitor (2001) also find that NSLP participants consume morecalories in a typical day than nonparticipants, but that all the additional calories comeat lunch time, although in followup work (Gleason and Suitor 2003) they control forindividual fixed effects and find no difference in energy intake comparing across daysthat students do and do not receive a school lunch. As public health priorities areshifting from combating malnutrition to addressing the epidemic of childhood obe-sity, it seems worthwhile to investigate the potential of the NSLP to contribute tochildhood obesity.9
III. Description of the ECLS-K Data
The data used in this study come from the Early Childhood LongitudinalStudy – Kindergarten Cohort (ECLS-K), a panel data set collected by the United StatesDepartment of Education following children in the kindergarten class of 1998-99 fromkindergarten through (eventually) eighth grade. The data set covers approximately15,000 students in 1000 different schools and collected a wide range of information onchildren, their families, and their schools. Summary statistics are presented in Table 1.
Children’s heights and weights were directly measured by the survey collectors atthe beginning and end of kindergarten, and at the end of first, third, and fifth grades.10
From these data, I calculate children’s Body Mass Index (BMI, a scaled weight-for-height measure calculated as one’s weight in kilograms divided by their heightin meters squared) and their obesity, overweight, and underweight status (calculatedas whether the child’s BMI is above the standard Centers for Disease Control sex-andage-in-months-specific threshold).
Information on a student’s school lunch participation status was collected from thechild’s parents. The survey question I use as the main measure of lunch participationasks whether the child ‘‘usually’’ receives a complete school lunch offered at school(and not brought from home). The participation rate calculated using this measure ofschool lunch is 75.6 percent, which is comparable to the 67 percent average partic-ipation rate in elementary schools reported by Fox et al. (2001). Parents also areasked whether their school participates in the school lunch program, and whether
8. An important recent paper by Bhattacharya, Currie, and Haider (2004) finds that the National SchoolBreakfast Program improves the nutritional quality of food consumed, but does not increase the numberof calories consumed.9. An interesting paper by Figlio and Winicki (2005) finds that Virginia schools facing accountability sanc-tions increase the caloric content of their school lunches during test week by over 100 calories per day, in aprobable attempt to boost students’ short-term cognitive performance.10. Data were collected on a small subset of the respondents at the beginning of 1st grade as well.
Schanzenbach 687

Table 1Sample Characteristics
BagLunch
SchoolLunch
P-value ofdifference
P-value ofdifference,conditionalon school
fixed effects
(1) (2) (3) (4)
Obese (Fall K) 0.106 0.102 0.664 0.366Obese (Spring grade 1) 0.107 0.118 0.288 0.019Underweight (Fall kindergarten) 0.048 0.041 0.231 0.354Underweight (Spring grade 1) 0.041 0.035 0.289 0.158
White 0.762 0.801 0.002 0.060Black 0.039 0.043 0.486 0.033Hispanic 0.110 0.075 0.000 0.599Female 0.486 0.498 0.269 0.104Age at Fall K assessment (months) 67.3 68.0 0.000 0.561Birth weight (ounces) 119.7 119.8 0.911 0.915Child born premature 0.175 0.164 0.196 0.319
Math score (Fall K) 0.331 0.272 0.041 0.150Math score (Spring grade 1) 0.275 0.293 0.505 0.443
Teen mom at first birth 0.120 0.146 0.017 0.434Mom 30+ at first birth 0.262 0.191 0.000 0.037Mom HS exactly 0.236 0.287 0.000 0.136Mom College degree or more 0.381 0.307 0.000 0.054Mom worked before child entered K 0.671 0.747 0.000 0.004Father in home 0.911 0.908 0.729 0.964Dad high school exactly 0.235 0.280 0.001 0.169Dad college degree or more 0.394 0.316 0.000 0.140Currently in any nonparental care 0.464 0.533 0.000 0.000Hours/week in nonparental care if >0 19.1 18.5 0.304 0.414Number of siblings 1.34 1.26 0.004 0.000Only child 0.14 0.17 0.004 0.007
SES (quintiles) 3.85 3.72 0.000 0.338Number kid books in house 98.6 90.4 0.000 0.000N 1,546 3,295
Notes: Students ineligible for free lunch only.
688 The Journal of Human Resources

their child receives the lunch at free or reduced price.11 Similar questions are askedabout school breakfast.
IV. Measuring the Impact of School Lunches
In a simple look at the data, students who eat school lunches aremore likely to be overweight than their classmates who brown bag their lunch.For example, at the end of first grade 14 percent of school lunch eaters are obesewhile 11 percent of brown baggers are obese. This simple correlation might not re-flect anything causal about the impact of school lunches on obesity, but could insteadreflect the impacts of other characteristics that influence both the probability of beingobese and the probability of eating school lunch since (of course) children are notrandomly assigned into school lunch and brown bag treatments. There are all sortsof observable and unobservable factors that predict the likelihood that a child willeat a school lunch – for example, low-income, African American, and Hispanic chil-dren are substantially more likely to eat school lunch – and many of these same ob-servable and unobservable factors also are associated with being overweight. As aresult, a naı̈ve regression of school lunch on overweight may overstate the causal im-pact of lunch if all other related factors are not perfectly controlled.
A. Approach One: Changes Over Time
One way to isolate the effect of school lunches is to compare a cohort of childrenover time starting at school entry. The idea behind this approach is that the effectsof unobservable family background characteristics that differ by a student’s schoollunch status can be captured by differences in obesity by the time a student startsschool—that is, prior to being exposed to the school lunches. If those unobservablecharacteristics remain constant over time, then they can be differenced out by study-ing changes in obesity over time. Below I find that there is no difference in obesityrates by (future) lunch status at the time students enter kindergarten, and present sev-eral specification checks aimed at addressing the possibility that unobservable familycharacteristics might change over time in ways that correlate to school lunch status.
Table 1 shows selected characteristics by school lunch status. The sample is lim-ited in this section to only students who are ineligible for free or reduced-price lunchand who attend schools that participate in the school lunch program. Column 1 showsmean characteristics for students who brown bag their lunch in first grade, and Col-umn 2 shows characteristics for students who buy a school lunch. Column 3 showsthe p-value on the difference between brown baggers and school lunch eaters. Acrossthe entire sample, brown baggers are from families that we might think of as morelikely to invest in children’s health. For example, brown baggers are more likely tohave college educated parents, have higher baseline test scores, more children’sbooks in the home, and higher measured socioeconomic status than school luncheaters.
11. I limit the sample to include only schools that offer school lunch, and define the school’s status basedon the modal parent’s response to whether the school offers school lunch.
Schanzenbach 689

Many of the differences in background characteristics, though, reflect differentschool lunch participation rates across schools drawing from student populationswith different background characteristics. In order to control for characteristics thatmight vary at the school or neighborhood level—for example, differences in theavailability of fast food restaurants, or spaces to play, or regional differences in foodpreferences—I present most results below conditional on school-level fixed effects.Column 4 shows the p-value on a test of whether each characteristic differs by lunchstatus conditional on school-level fixed effects. When students are compared withinschools, some of the differences in background characteristics go away; nonetheless,the background characteristics are controlled directly in the results that follow.
Table 2 shows regression-adjusted results of the following equation:
obeseis ¼ lunchis + Xisb + ms+eisð1Þ
where i indexes the child and s indexes schools. The dependent variable, obese, isequal to one if the child’s body mass index (BMI) is above an age- and gender-spe-cific threshold.12 X is only included in some of the specifications, and is a vector ofstudent-level covariates such as race, gender, family characteristics, and programparticipation.13 The term ms is a school fixed effect, and eis is the usual error term.As shown in Columns 1–4, the type of school lunch that children will go on toeat in kindergarten and first grade is not associated with any differences in obesityrates at the time students enter kindergarten, whether or not covariates are controlled.This suggests that any unobservable differences between brown baggers and NSLPparticipants have not materialized into obesity differences by kindergarten entry.By the end of first grade, however, school lunch eaters are 2.4 percentage points morelikely to be overweight, controlling for observable characteristics and school fixedeffects. When baseline obesity is included as an explanatory variable, the differencein obesity rates edges down slightly, to about two percentage points. In either case,after two years of exposure to school lunches children are about two percentagepoints (on a base of 9 percent) more likely to be overweight than their classmateswho brown bag their lunch.
A major cause of concern in interpreting these results is that unobservable familycharacteristics may be the true underlying cause of an increase in body weight. Ifthose unobservable characteristics are correlated with school lunch eating status, thenwe might inappropriately assign causality to school lunches when in fact other char-acteristics are the driving force behind the increase in body weight. It is important tonote, however, that because the lunch buyers and brown baggers enter kindergartenwith the same level of overweight, the potentially confounding unobservable charac-teristics would have to be affecting change in body weight over time, and not just the
12. The threshold was set as the 95th percentile of the age- and gender-specific BMI distribution of a na-tionally representative group of children in the early 1970s, and is the standard measure for obesity in chil-dren aged 2-18. BMI is calculated as a child’s weight in kilograms divided by its squared height, in meters.13. The covariates included are categories of mother’s education level, mother’s employment status, pres-ence of a father, language spoken at home, categories of numbers of children’s books in the home, previousprogram participation in WIC, Food Stamps, AFDC and Head Start, and child’s age, gender, birth weight,and indicator for premature birth. Results are similar if these covariates are not controlled, or if an evenmore saturated model is run.
690 The Journal of Human Resources

Ta
ble
2D
iffe
ren
ces
inO
bes
ity
Ra
tes
by
Typ
eo
fL
un
chE
ate
n
Dep
enden
tV
aria
ble
:O
bes
eat
Kin
der
gar
ten
Entr
yD
epen
den
tV
aria
ble
:O
bes
eat
1st
Gra
de
Spri
ng
(1)
(2)
(3)
(4)
(5)
(6)
(7)
(8)
(9)
(10
)(1
1)
(12
)
Eat
sch
ool
lun
ch(1
stg
rad
e)
20
.004
0.0
08
0.0
080
.00
40
.010
0.0
270
.02
70
.02
40
.013
0.0
200
.02
00
.02
0(0
.00
9)(0
.01
1)
(0.0
11)
(0.0
11
)(0
.01
0)(0
.01
2)(0
.01
2)(0
.01
2)
(0.0
07)
(0.0
10)
(0.0
10
)(0
.01
0)
Ob
ese
atK
inde
rgar
ten
entr
y
0.7
130
.703
0.7
03
0.6
98
(0.0
21)
(0.0
22)
(0.0
22
)(0
.02
2)
Bla
ck0
.013
0.0
15
0.0
02
20
.001
20
.006
20
.008
(0.0
29)
(0.0
29
)(0
.02
9)(0
.03
0)
(0.0
24
)(0
.02
5)
His
pan
ic0
.005
0.0
03
0.0
50
0.0
43
0.0
41
0.0
36
(0.0
21)
(0.0
20
)(0
.02
2)(0
.02
1)
(0.0
18
)(0
.01
7)
Asi
an0
.009
0.0
27
0.0
18
0.0
32
0.0
07
0.0
08
(0.0
28)
(0.0
27
)(0
.02
7)(0
.02
7)
(0.0
22
)(0
.02
3)
Oth
erra
ce2
0.0
392
0.0
412
0.0
412
0.0
432
0.0
192
0.0
20(0
.02
0)(0
.02
0)
(0.0
22)
(0.0
22
)(0
.01
7)
(0.0
17
)In
clu
deco
vari
ates
No
No
No
Yes
No
No
No
Yes
No
No
No
Yes
Sch
ool
fixe
def
fect
s
No
Yes
Yes
Yes
No
Yes
Yes
Yes
No
Yes
Yes
Yes
Ad
just
edR
-sq
uar
ed0
.000
0.1
45
0.1
450
.15
80
.000
0.1
840
.18
50
.19
80
.233
0.5
530
.55
40
.55
6
Note
s:S
ample
size
is4,8
41.
Lin
ear
pro
bab
ilit
ym
odel
s.In
cludes
only
studen
tsin
elig
ible
for
free
lunch
.R
obust
stan
dar
der
rors
that
allo
wfo
rco
rrel
ated
resi
dual
sac
ross
studen
tsin
the
sam
esc
hool
inpar
enth
eses
.C
ova
riat
esin
clude
moth
er’s
educa
tion
and
emplo
ym
ent,
languag
esp
oken
and
num
ber
of
chil
dre
n’s
books
inth
ehom
e,ch
ild
age,
gen
der
,bir
thw
eight,
pre
mat
ure
bir
thin
dic
ator,
par
tici
pat
ion
inin
com
esu
pport
pro
gra
ms,
Hea
dS
tart
par
tici
pat
ion,
inco
me
cate
gory
,an
dpre
sence
of
afa
ther
.
Schanzenbach 691
level. That said, even though brown baggers and lunch eaters come into school withthe same rates of overweight, there might be other unobservable changes in thechild’s family that would contribute to changes in obesity and also would be corre-lated with lunch status.
Theories about potential confounding effects here can typically be divided into twocategories. First, some changes may occur at the same time as school enrollment thatimpact a child’s food and activity environment differentially by school lunch status.For example, a school lunch eater’s mother might start a new job when the child startskindergarten, and might then have less time to prepare healthy meals or supervise out-door play. A divergence between the lunch eater’s obesity status and an otherwise sim-ilar brown bagger might then be caused by the change in home environment associatedwith the mother’s new employment, but if that change is not accounted for then theincrease in obesity may be erroneously attributed to school lunches. Second, theremay be underlying differences between brown bag and school lunch families thatare not measurable until a child is slightly older. For example, parents who care moreabout health may be more likely both brown bag their child’s lunches and to enrolltheir children in sports teams. But if the opportunity to enroll in sports teams doesnot open up until after a child is old enough to also start school, the impact that sportshave on reducing overweight may not kick in until after kindergarten enrollment, andmay be erroneously attributed to school lunches in this case.
Table 3 presents some robustness checks. Columns 1–4 attempt to address poten-tial confounding effects caused by unobservable family-level changes that coincidewith kindergarten enrollment and might be proxied by observable characteristics.To eliminate the potential bias from mothers who change their employment statuswhen a child starts school, Columns 1 and 2 limit the sample to only children whosemothers did not change employment status between their child’s entry into kinder-garten and the end of first grade; the impact of school lunch on obesity remains aboutthe same at two percentage points.14
Another potential measure exploits the presence of younger siblings, since thehome meal preparation and activity environment may be more stable if the kinder-garten entrant is not the last child to enter school. Columns 3 and 4 show that thepattern continues to hold among these arguably more stable home environments:There is no difference in obesity rate at kindergarten entry, but by the end of firstgrade differences in obesity rates have appeared.
To address the second category of potentially confounding effects—that is, thatthere is something about families of lunch buyers that changes their investment intheir child’s food or exercise environment once school starts—I investigated proxyvariables that might signal willingness to invest in child health. The ECLS data col-lected limited information about after-school activities such as participation in sportsand dance, and also parental assessment of a child’s activity level and amount ofweekly aerobic activity. While measures of activity are themselves directly relatedto overweight—for example, children who are ‘‘less active than other children’’are 13 points more likely to be obese—the activity measures are not related to a
14. Results are nearly identical if covariates are left uncontrolled.
692 The Journal of Human Resources

Ta
ble
3O
bes
ity
Ra
tes
by
Typ
eo
fL
un
chE
ate
n,
Alt
ern
ate
Sp
ecifi
cati
on
s
No
Chan
ge
inM
oth
er’s
Em
plo
ym
ent
Gra
des
Kto
1S
tud
ents
wit
hY
ou
ng
erS
ibli
ng
sF
ull
Day
Kin
der
gar
ten
Hal
fD
ayK
ind
erg
arte
n
Kin
der
gar
ten
entr
yE
nd
of
1st
gra
de
Kin
der
gar
ten
entr
yE
nd
of
1st
gra
de
En
do
fK
ind
erg
arte
nE
nd
of
1st
gra
de
En
do
fK
ind
erg
arte
nE
nd
of
1st
gra
de
(1)
(2)
(3)
(4)
(5)
(6)
(7)
(8)
Eat
sch
oo
llu
nch
(1st
gra
de)
20
.00
50
.02
40
.00
50
.03
30
.03
60
.04
52
0.0
10
0.0
10
(0.0
14
)(0
.01
5)
(0.0
18
)(0
.01
9)
(0.0
18
)(0
.01
9)
(0.0
16
)(0
.01
7)
Oth
erco
vari
ates
Yes
Yes
Yes
Yes
Yes
Yes
Yes
Yes
Sch
oo
lfi
xed
effe
cts
Yes
Yes
Yes
Yes
Yes
Yes
Yes
Yes
N3
,33
63
,33
61
,57
41
,57
41
,95
71
,95
72
,55
52
,55
5
Note
s:L
inea
rpro
bab
ilit
ym
odel
s.In
cludes
only
studen
tin
elig
ible
for
subsi
diz
edlu
nch
.R
obust
stan
dar
der
rors
that
allo
wfo
rco
rrel
ated
resi
dual
sac
ross
studen
tsin
the
sam
esc
hool
inpar
enth
eses
.
Schanzenbach 693

child’s school lunch status.15 Further expanding the set of proxy variables to includevariables that generally signal a ‘‘high-quality’’ home environment—such as trips tomuseums, whether a parent reads to the child, and TV viewing habits—showed nosystematic difference between lunch buyer and brown bagger families. This suggeststhat at least along a wide variety of measurable dimensions the families are reportingsimilar investment behaviors in their children.
Up to this point, this study has concentrated on the impact of additional caloriesconsumed at lunch on a child’s weight. But a person’s body weight is a function ofboth calorie intake and calorie outflow, and it may be the case that children whobrown bag their lunches also are for some reason more active and that is the true un-derlying cause of the weight disparity. While we cannot test the activity level of chil-dren directly, there are some indirect tests that can be conducted to shed light onwhether differences in calorie expenditures could be driving the results. First, it isimportant to note that all results thus far have been estimated conditional on schoolfixed effects, so we would not expect differences in school-time physical activity tobe driving the results—that is, since comparisons are made within school, all treat-ment and control students are likely subject to the same physical education require-ments, regardless of school lunch status.16 But there may be important differences innonschool activity levels that are correlated with lunch status. As noted above, how-ever, the limited information on physical activities such as participation in sports anddance revealed no systematic difference between lunch eaters and brown baggers.
Another potential robustness check compares students who attend full- and half-day kindergarten. If school lunches were causing an increase in obesity, then thegap between school lunch buyers and brown baggers should not open up during kin-dergarten for half-day kindergarten students who do not yet eat lunch at school. InColumns 5–8 of Table 3, students are separated by whether their kindergarten wasfull- or half-day, and lunch status is assigned based on first grade behavior for allstudents. School lunch eaters from full-day kindergartens (Column 5) are more likelythan their schoolmates to be obese at the end of kindergarten, while half-day kinder-gartners (Column 7) have the same obesity rates as their classmates. The coefficienton school lunch is larger for both groups at the end of first grade (see Columns 6 and8), though the differences are only suggestive and not statistically significant.
The effect is also similar when child weight status is measured differently, asshown in Table 4. Measuring BMI in levels or logs (Columns 1–6) produces quali-tatively similar results, and suggests that school lunch eating causes a 1 percent in-crease in BMI. Redefining the outcome of interest from ‘‘obese’’ to ‘‘overweight’’(which is defined by the Centers for Disease Control as the 85th percentile of a fixeddistribution of BMI conditional on age and gender, instead of the 95th percentilewhich is the cutoff for obesity) shows similar results (Columns 7–9), and indicatesthat school lunch increases the probability of a student being overweight by abouttwo percentile points. Limiting the sample only to obesity ‘‘movers’’—that is, onlyincluding those who move from obesity in kindergarten to nonobese by the end of
15. One serious drawback of these measures is that they are measured at the end of kindergarten and not atbaseline.16. Although, students who buy their lunch may have to wait in line, and this may cut into their after-lunchrecess time. No direct measure of this is available in the data.
694 The Journal of Human Resources

Ta
ble
4R
obu
stnes
sC
hec
ks:
Alt
ernate
Dep
enden
tV
ari
able
s,E
nd
of
Fir
stG
rade
BM
IL
evel
Lo
g(B
MI)
Ove
rwei
gh
t¼
1O
bes
ity
‘‘M
over
s’’
Kin
der
-g
arte
nen
try
En
do
f1
stg
rad
eK
ind
er-
gar
ten
entr
y
En
do
f1
stg
rad
eK
ind
er-
gar
ten
entr
y
En
do
f1
stg
rad
eE
nd
of
1st
gra
de
(1)
(2)
(3)
(4)
(5)
(6)
(7)
(8)
(9)
(10
)
Eat
sch
oo
llu
nch
(1st
gra
de)
0.0
58
0.2
37
0.1
67
0.0
03
0.0
13
0.0
10
0.0
08
0.0
25
0.0
22
0.2
99
(0.0
72
)(0
.09
5)
(0.0
60
)(0
.00
4)
(0.0
05
)(0
.00
3)
(0.0
17
)(0
.01
7)
(0.0
13
)(0
.16
5)
Sam
ew
eig
ht
mea
sure
atk
ind
erg
arte
nen
try
——
1.0
45
——
0.9
51
——
0.6
44
—(0
.02
0)
(0.0
22
)(0
.01
7)
N4
,47
44
,47
44
,47
44
,47
44
,47
44
,47
44
,47
44
,47
44
,47
42
70
Note
s:A
llsp
ecifi
cati
ons
incl
ude
full
cova
riat
esan
dsc
hool
fixe
def
fect
s.S
ample
consi
sts
of
all
studen
tsin
elig
ible
for
free
lunch
.R
obu
stst
andar
der
rors
that
allo
wfo
rco
rrel
ated
resi
dual
sac
ross
studen
tsin
the
sam
esc
hool
inpar
enth
eses
.
Schanzenbach 695

first grade, and vice versa – reveals that school lunch eaters are much more likely tomove into obesity (see Column 10).17
Another potential problem is that the measure of school lunch participation mightproxy for participation in the School Breakfast Program (SBP), and the resultingmeasured effect might confound the impact of both programs. The correlation be-tween school breakfast and lunch is much more severe among students eligiblefor free- or reduced-price lunches (and this is addressed in more detail below) thanit is among the noneligibles included in this section of the analysis. About 10 per-cent of the children in this sample eat a school breakfast, and 75 percent of themattend a school that offers the SBP. School lunch participants are six percentagepoints more likely to participate in the SBP than brown baggers. To separate theimpacts of SBP from the lunch program, I take two approaches: first, I control di-rectly for SBP participation, and second I exclude all students who participate inthe SBP. The effects of school lunch on obesity are essentially unchanged by theserobustness checks.
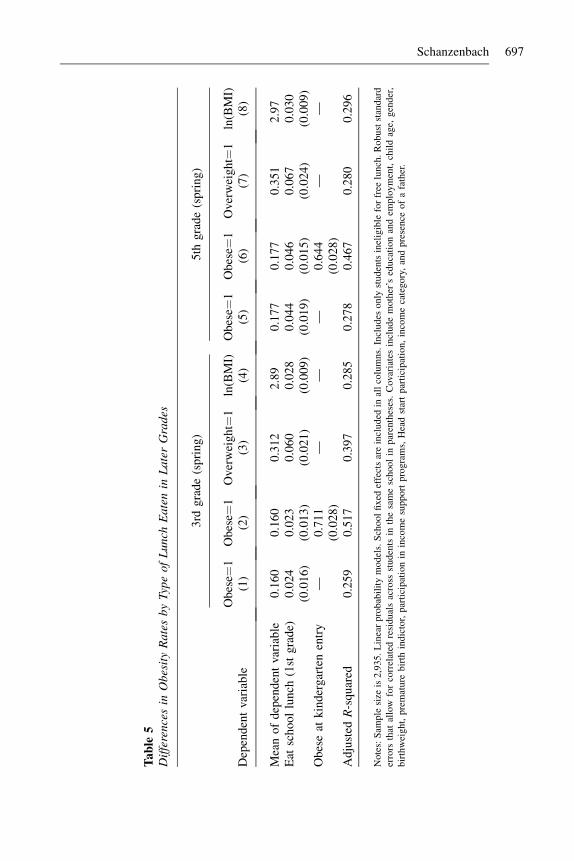
Table 5 extends the analysis through fifth grade. Columns 1–4 show that by theend of third grade lunch eaters are 2.3 percentage points more likely to be obese,are six percentage points more likely to be overweight, and have a 2.8 percent higherBMI. The results are similar or a bit larger by the end of fifth grade (Columns 5–8),with lunch eaters’ obesity rates about 4.5 percentage points higher than brown bag-gers, and rates of overweight 6.7 points higher. The effect on mean BMI is 3 percent.Note that here (for comparability to earlier tables) the treatment is still defined asschool lunch participation in first grade, but participation is very highly correlatedover time. If treatment is defined instead by current-year lunch participation, theresults look quite similar.
B. Approach Two: Regression Discontinuity
Another approach to isolating the causal impact of school lunches on obesity is toleverage the (theoretically) sharp eligibility cutoff for school lunch subsidies. By therules of the program, if a student’s family has income less than 130 percent of theFederal Poverty Line (FPL) the student is entitled to receive school lunch withoutcost. Students with incomes between 130 percent and 185 percent of the FPL areeligible for a reduced price lunch. The reduced-price charged varies somewhat byschool, with an average price charged of 38 cents and a maximum allowable priceof 40 cents (Fox et al. 2001). Above 185 percent of the poverty limit the pricereverts to ‘‘full’’ price, on average $1.66 per lunch for elementary schools (SchoolNutrition Association 2007). This means that students at 184 percent of the povertylimit face a dramatically different price for lunch than students at 186 percent of thepoverty limit. This large difference in lunch prices faced by students who have sim-ilar levels of family income suggests a regression-discontinuity (RD) design (see forexample Hahn, Todd, and van der Klaauw 2001; Lee 2005; DiNardo and Lee 2004;McCrary and Royer 2005; Angrist and Lavy 1999; Matsudaira 2005).
17. I also tested to make sure that there was no difference, on average, in the height or age of children byschool lunch status.
696 The Journal of Human Resources
Ta
ble
5D
iffe
ren
ces
inO
bes
ity
Ra
tes
by
Typ
eo
fL
un
chE
ate
nin
La
ter
Gra
des
3rd
gra
de
(sp
rin
g)
5th
gra
de
(sp
rin
g)
Ob
ese¼
1O
bes
e¼1
Ove
rwei
gh
t¼1
ln(B
MI)
Ob
ese¼
1O
bes
e¼1
Ove
rwei
gh
t¼1
ln(B
MI)
Dep
end
ent
vari
able
(1)
(2)
(3)
(4)
(5)
(6)
(7)
(8)
Mea
no
fd
epen
den
tva
riab
le0
.16
00
.16
00
.31
22
.89
0.1
77
0.1
77
0.3
51
2.9
7E
atsc
hool
lunch
(1st
gra
de)
0.0
24
0.0
23
0.0
60
0.0
28
0.0
44
0.0
46
0.0
67
0.0
30
(0.0
16
)(0
.01
3)
(0.0
21
)(0
.00
9)
(0.0
19
)(0
.01
5)
(0.0
24
)(0
.00
9)
Ob
ese
atk
ind
erg
arte
nen
try
—0
.71
1—
——
0.6
44
——
(0.0
28
)(0
.02
8)
Ad
just
edR
-squar
ed0.2
59
0.5
17
0.3
97
0.2
85
0.2
78
0.4
67
0.2
80
0.2
96
Note
s:S
ample
size
is2,9
35.
Lin
ear
pro
bab
ilit
ym
odel
s.S
chool
fixed
effe
cts
are
incl
uded
inal
lco
lum
ns.
Incl
udes
only
studen
tsin
elig
ible
for
free
lunch
.R
obust
stan
dar
der
rors
that
allo
wfo
rco
rrel
ated
resi
dual
sac
ross
studen
tsin
the
sam
esc
hool
inpar
enth
eses
.C
ovar
iate
sin
clude
moth
er’s
educa
tion
and
emplo
ym
ent,
chil
dag
e,gen
der
,bir
thw
eight,
pre
mat
ure
bir
thin
dic
tor,
par
tici
pat
ion
inin
com
esu
pport
pro
gra
ms,
Hea
dst
art
par
tici
pat
ion,
inco
me
cate
gory
,an
dpre
sence
of
afa
ther
.
Schanzenbach 697

To clarify the proposed framework, suppose that the relationship between a child’sweight and school lunch eating can be modeled using a constant treatment effectsmodel:
yi ¼ Diu + f ðRiÞ + við2Þ
where yi is a measure of the student’s weight or obesity status, Di is an indicator vari-able for whether the student eats school lunch, Ri is the student’s family income mea-sured as income-to-poverty ratio, and vi is a vector of other covariates that influencechild obesity. The key to the approach is that students are discontinuously likely toparticipate in the school lunch program as their family income moves above the sub-sidy threshold, R0, of 185 percent of the FPL. This case is often called a ‘‘fuzzy’’regression discontinuity, because the probability of treatment varies discontinuouslyaround rule, but the rule is not deterministic (that is, not all children below the cutoffare forced to eat a school lunch, and those above the cutoff are allowed to eat aschool lunch). The treatment in this case is a price reduction, but students ineligiblefor the subsidy may still purchase the exact same lunch for a higher price. The im-pact of the subsidy rule on lunch participation is therefore given by
g ¼ limR[0 E½DijRi ¼ R0�2limRY0 E½DijRi ¼ R0�:ð3Þ
Similarly, the impact of the lunch subsidy on a child’s obesity status is given as
u ¼ limR[0 E½yijRi ¼ R0�2limRY0 E½yijRi ¼ R0�:ð4Þ
Therefore, in order to uncover the estimated impact of school lunch on obesity rates,one must ‘‘scale up’’ the impact on obesity by the change in lunch eating ratesaround the subsidy cutoff using the Wald estimator u ¼ u/g.
To implement this approach, I regress various dependent variables on a 4th orderpolynomial in Ri, an indicator variable Si for whether the child is income-eligible forthe lunch subsidy (that is, Ri < R0), and in order to improve precision I include a vec-tor of covariates including age, race, and gender.18
Results are shown in Table 6, and graphically in Figure 1. Results for the end offirst grade are shown in Panel A of the Table. Using the RD approach, students justeligible for a school lunch subsidy are two percentage points more likely to be obesethan students just on the other side of the income cutoff. For a sense of the magnitudeof this finding, Column 3 displays the mean obesity rate of children near the cutoff;lunch eaters are about 16 percent more likely to be obese. Using log(BMI) as the de-pendent variable, the impact of school lunches is about a 1 percent increase inweight. Income-eligible students are much more likely to report receiving the lunchsubsidy, but only about five percentage points more likely to report eating a schoollunch. The lunch-eating rate among low income students is universally very high,with 82 percent of students from families with incomes just above the threshold par-ticipating in the school lunch program. There is a statistically significant
18. The results are similar if higher-order terms of R are included, if the covariates are omitted, or if S andR are fully interacted.
698 The Journal of Human Resources

Table 6Regression Discontinuity Results at Reduced-Price Cutoff
Coefficient(Standard
error) P-value
MeanDepVar,
185-205%FPL
Falsification:Cutoff¼
200% FPL
(1) (2) (3) (4)
Panel A: End of first gradeObesity indicator 0.020 0.102 0.125 20.010
(0.012) (0.020)log(BMI) 0.006 0.279 2.82 0.013
(0.005) (0.008)Receive free or reduced price lunch 0.276 0.000 0.418 0.103
(0.016) (0.039)Eat school lunch 0.047 0.001 0.815 20.021
(0.013) (0.031)Panel B: End of fifth grade
Obesity indicator 0.012 0.528 0.279 0.032(0.018) (0.037)
log(BMI) 0.012 0.202 3.02 0.005(0.009) (0.016)
Receive free or reduced price lunch 0.220 0.000 0.325 20.047(0.019) (0.046)
Eat school lunch 0.041 0.025 0.788 20.026(0.018) (0.042)
Panel C: Pre-determined CovariatesObesity at kindergarten entry 0.016 0.177 0.108 0.003
(0.012) (0.029)ln(BMI) at kindergarten entry 0.006 0.227 2.78 20.004
(0.005) (0.011)Math score 0.031 0.608 20.088 20.050
(0.061) (0.080)Hispanic 0.030 0.217 0.185 0.042
(0.025) (0.031)Black 0.006 0.779 0.145 0.024
(0.022) (0.030)Has insurance 20.008 0.763 0.738 20.065
(0.027) (0.036)Two-parent family 0.024 0.365 0.722 20.053
(0.028) (0.036)
Notes: Each row represents a separate regression. Huber/White standard errors in parenthesis.N¼11,541.
Schanzenbach 699

discontinuity at the lunch cutoff in both lunch eating and in weight measures. Col-umn 4 reports a falsification exercise, using a fictional cutoff threshold of 200 percentof the FPL, which is not actually associated with any change in lunch eligibility.There are no observed discontinuities in weight measures or lunch-eating measures,or on predetermined characteristics, when this fictional cutoff is used.19
Panel B repeats the exercise with body weight measures and lunch participationinformation measured at the end of fifth grade. Because the income-to-poverty ratiois measured based on the family’s income when the student was in kindergarten, theresults are noisier as the student’s grade level increases. Overall, students near thesubsidy cutoff are much more likely to be obese by fifth grade (27.9 percent vs.12.5 percent in first grade), but there is no longer a sharp difference in obesity rateson either side of the subsidy cutoff. There is still a jump in log(BMI) associated withthe lunch subsidy threshold of a similar magnitude to the one found at the end of firstgrade, though the precision declined somewhat.
Figure 1Differences in Students’ Body Weight at Baseline and End of First Grade, by Subsi-dized Lunch Eligibility
19. There is a small discontinuity in percent reporting getting subsidized lunches, but that does not trans-late into a difference in reported rates of eating lunches. Results of this falsification exercise are similar forfictional thresholds of 150 percent and 230 percent of FPL.
700 The Journal of Human Resources

The identification strategy employed here hinges on the notion that once the im-pact of income is controlled in a smooth manner, the remaining discontinuity in var-iables located at the lunch subsidy threshold is caused by the lunch subsidy. Iffamilies that particularly value the school lunch subsidy can alter their incomes(or reported incomes) to fall just below the threshold, though, the strategy wouldbe invalid. To test the validity of the approach, I present several pieces of evidencethat there is no obvious sorting into the subsidy around the neighborhood of thethreshold.
As a test of the RD design, Panel C repeats the exercise for several pre-deter-mined variables. If the design is legitimate, the pre-determined characteristicsshould not show discontinuities around the threshold. On the other hand, if certaintypes of families were more likely to fall just below the cutoff then there may besomething else causing the discontinuity the income level equal to 185 percentof the FPL, such as sorting into the program or other programs with the same in-come eligibility cutoff. For example, some Medicaid/SCHIP programs have eligi-bility cutoffs at 185 percent of the poverty line, and one may be concerned thatthis approach may be picking up the effect of those other programs.20 As shownin Panel C, there is no measured discontinuity at the subsidy cutoff along a widevariety of measures: race, test scores, family structure, or reported insurance status.Importantly, as shown in Figure 1, there is no difference in baseline (that is, Kin-dergarten entry) obesity and weight, but the difference appears by the end of firstgrade. This suggests that the treatment identified in the RD approach is adminis-tered after school entry. Unfortunately, the treatment identified here might encom-pass more than school lunch and may also include school breakfast, as discussedfurther below.
Another test of the approach’s validity is whether the density of R is discontinuousaround the subsidy threshold, which might indicate self-selection to below the cut-off. There is some evidence in other studies that children from income-ineligiblefamilies receive the subsidy at surprisingly high rates – possibly as a result of fam-ilies purposely under-reporting their income in order to qualify under lax eligibilityrules. To qualify for the lunch subsidy, parents report their income and family size(or their TANF or food stamp case number) to their school at the beginning of theyear. No documentation of income is required, though a random subset of eligibles isselected to provide followup at a later time in the school year (Burghardt et al.2004). A recent Department of Agriculture report (FNS 2003) found that after chil-dren receiving subsidies provided income verification, almost 20 percent were re-ceiving a subsidy more generous than their eligibility implied.21 The potential forthis to be a problem in the data used here is smaller, since incomes are being
20. Only a few states use 185 percent of the poverty line as the income cutoff for insurance for children inthe ECLS cohort. States with 185 percent cutoff lines for seven-year-olds in the year 2000 are: CO, IL, IA,NE, OK, VA, and WI.21. This could be due to inaccurate reporting when they qualified for lunches, or could represent variationin income over the school year between when they originally qualified and when the followup was done(Dahl and Scholz 2005).
Schanzenbach 701

reported to an independent survey and there is little incentive to misreport one’s in-come level to appear eligible for any programs. In fact, 34 percent of students withreported income between 185-230 percent of the FPL report receiving a subsidizedlunch.22 There is no apparent discontinuity in the measured income distributionaround the subsidy threshold.23
As described above, to account for the ‘‘fuzzy’’ nature of this discontinuity, theprogram impact is measured as the ratio of the impact on weight outcomes to the in-crease in lunch participation. The resulting point estimate of the impact at the endof first grade is too large to be credible – that is, for the obesity indicator the estimateis 0.020/0.047 ¼ 0.426, implying that school lunches increase the likelihood of obe-sity by 43 percent. The standard errors on these estimates are large, though, implyinga 95 percent confidence interval between -14 percent and 100 percent. The results forBMI are similarly large but imprecise, the point estimates imply a 13 (12) and 29(27) percent increase in body mass index by the end of first and fifth grades, respec-tively (standard errors of the Wald estimates in parentheses).
There are several reasons why the RD may overstate the true causal impact of theschool lunch program. For one, students eligible for free or reduced price lunch aremuch more likely to eat a school breakfast. Using the same RD setup, students justunder 185 percent of the poverty line are 12 percentage points more likely to eatschool breakfast (on a base rate of almost 50 percent among students near the eligi-bility threshold), and school breakfast has been shown to substantially increase thecaloric intake of children at breakfast (Devaney and Stuart 1998). As a result, theRD results are almost certainly capturing the effects of both school lunches andschool breakfasts.
In addition, if there are reporting errors in the measure of lunch consumption, thedifference in lunch eating rates on either side of the subsidy threshold could be un-derstated. One potential approach to address this is to calculate the Wald estimatorusing the mean difference in lunch eating rates on either side of the subsidy cutoff,instead of using the RD to identify the difference. Using observations with incomesbetween 85 and 285 percent of the Federal Poverty Line, the difference in lunch eat-ing rates more than doubles to 9.5 percentage points, but the difference in obesityrates or log(BMI) is little changed from the RD approach. Calculating the Wald es-timator using this approach brings down the estimate to a more reasonable (but stilllarge) 20 percent increase in the obesity rate at the end of first grade. With the caveatsthat the results may be conflating the effects of breakfast and lunch, and that the
22. This could also be explained by the fact that school lunch eligibility is based on monthly income, andthe measure reported in the ECLS-K is annual income. It is also worth noting that the income distribution isslightly lumpy, because most family incomes are reported in round numbers.23. Another promising RD approach that did not pan out was to look for a similar discontinuity betweenthe free-lunch and reduced-price lunch threshold, at 130 percent of the poverty line. Unfortunately, the datado not distinguish free lunch from reduced price lunch, so I could not directly test whether students discon-tinuously report receiving free lunch below that threshold. Nonetheless, lunch consumption is reported butthere was no observable change in reported participation in the lunch program around that threshold, de-spite the theoretically sharp change in price charged. This lack of finding could be caused by noise in in-come measures around that cutoff, near universal lunch participation (93 percent of students just above 130percent family income report eating lunch), or program errors that make the cutoff less sharp. Just as thereis no discontinuity in lunch eating at the free-lunch threshold, there is also no jump in obesity rates or childweight there.
702 The Journal of Human Resources
standard errors on these estimates are large, it seems that overall the RD approachsupports the hypothesis that school lunches have a positive, causal impact on stu-dents’ body weight.
V. Are the Impacts Plausible?
The overall finding of this paper is that children who eat a school lunch are substan-tially more likely to be obese. In this section, I examine evidence on the plausibilityof this finding by comparing reported calorie consumption at lunch by lunch status,and simulating the potential effect of extra calories consumed on child weight. I findthat, on average, students eating a school lunch consume an extra 40 calories per day –all at lunch – and holding all else constant, that increase could account for a weightgain consistent with the results presented earlier.
A. Measuring Calories in School Lunches
In order to measure the difference in average calories consumed by brown baggersand school lunch eaters, I present results from a dietary recall survey collected as partof the NHANES III data set, a nationally representative health data set collected bythe Centers for Disease Control spanning the years 1988-1994. Using dietary recalldata is often problematic because food consumption is notoriously underreported(though it may actually be over-reported for young children).24 Furthermore, the veryact of recording it is known to alter one’s food intake. These problems may be atten-uated in this case because I am measuring the difference in calories. If calories areunderreported by the same amount by both groups of children, for example, the dif-ference in calories would still be accurate.25
Table 7 presents regression results where the first dependent variable is the numberof calories consumed at lunch, and the second is all nonlunch calories consumed.The sample is limited to weekdays not during the summer.26 Students report – andI use as the school lunch variable – whether they eat school lunch ‘‘every day’’ or‘‘most days;’’ there is no direct information about whether they ate the school lunchon the particular days that the food diary was collected. In addition, defining what is‘‘lunch’’ is nontrivial, so I take several approaches. The food diaries collect informa-tion on what is eaten, when, where, and how the eater would categorize it (for exam-ple, breakfast, snack, etc.). One measure of ‘‘lunch,’’ of course, is everything eatenthat the respondent categorizes as ‘‘lunch.’’ One problem arises with this definitionbecause there are multiple words in Spanish for lunch – some children report thenoontime meal as ‘‘almuerzo’’ while others report it as ‘‘comida.’’ Unfortunately,‘‘comida’’ can also be used to describe other meals, so a definition that incorporatesthese three categories (lunch, almuerzo, and comida) as ‘‘lunch’’ will also contain an
24. For example, Cutler, Glaeser, and Shapiro (2003) simulate that if American men were really consumingthe number of calories reported in NHANES food diaries, they would have an average weight of a mere 108pounds.25. It is possible that school lunches are more accurately reported if, for example, the family has a schoollunch menu that they use as an aid when reporting the child’s intake. On the other hand, if a parent packedthe child’s brown bag lunch then they may have a similarly good recollection of the child’s intake.26. There is no direct measure of whether the diary day is a ‘‘school day,’’ though the location of the con-sumption (for example, ‘‘at school’’) is reported.
Schanzenbach 703

Ta
ble
7C
alo
ries
Co
nsu
med
inN
HA
NE
S
Kid
s<
Ag
e1
2A
llK
ids
5-1
6
Lu
nch
Cal
ori
esN
on
lun
chca
lori
esL
un
chC
alo
ries
No
nlu
nch
calo
ries
Lu
nch
Cal
ori
esN
on
lun
chca
lori
esL
un
chC
alo
ries
No
nlu
nch
calo
ries
(1)
(2)
(3)
(4)
(5)
(6)
(7)
(8)
Sch
oo
llu
nch¼
15
1.9
21
.94
6.0
27
.96
1.3
38
.24
0.7
25
.9(2
2.8
)(3
7.5
)(2
3.4
)(3
8.2
)(2
6.1
)(4
2.2
)(2
6.9
)(4
2.6
)C
on
stan
t6
01
.91
25
7.0
38
0.6
12
66
.25
93
.91
22
2.9
49
7.3
15
88
.7(2
1.1
)(3
4.7
)(7
4.8
)(1
22.
3)
(24
.2)
(39
.2)
(69
.0)
(10
9.6
)C
ovar
iate
sN
oN
oY
esY
esN
oN
oY
esY
esN
2,3
18
2,3
18
2,3
18
2,3
18
3,4
30
3,4
30
3,4
30
3,4
30
Note
s:S
ourc
e:N
HA
NE
SII
I.A
llco
lum
ns
incl
ude
age
Xgen
der
fixed
effe
cts.
Cova
riat
esin
clude
race
,day
of
report
ing,
par
ents
’B
MI,
fam
ily
size
,an
dre
port
sof
whet
her
consu
mpti
on
is‘‘
typic
al.’’
704 The Journal of Human Resources
evening meal in many cases. To address this problem, one can instead define‘‘lunch’’ as anything eaten around noontime, regardless of the name of the meal.It turns out that because of tight school and cafeteria schedules, some students eatlunch as early as 10 AM.27 As a result, defining ‘‘lunch’’ as anything eaten between10 AM (after breakfast for the most part, but early enough to catch early lunch times)and 1:30 PM (before after-school snacks, but late enough for late lunch shifts)appears to be a reasonable definition, and is my preferred method.28
As shown in Table 7, students in the NHANES who eat a school lunch daily ap-pear to consume 46 more calories at lunch than those who regularly brown bag theirlunch, but consume the same number of calories at other times of the day. That is,controlling for observable characteristics such as age, race, gender, parents’ BMIand family size, school lunch eaters consume about 46 extra calories per day, but thisadditional consumption comes entirely at lunch.29 These estimates are rather impre-cisely estimated, but are broadly consistent with USDA evaluations of the NationalSchool Lunch Program. For example, Gleason and Suitor (2001) find (using a differ-ent dietary recall data set, the Continuing Survey of Food Intakes by Individuals, orCSFII, 1994-96) that school lunch participants consume up to an extra 120 caloriesper day at lunch.
B. Measuring the Potential Effect of Additional Calories
Are as few as 40 extra calories per day enough to cause a measurable difference inobesity rates in children? Following the approach in Schofield, Schofield, and James(1985), I simulate the potential impacts of additional calories for first graders, basedon the following equation30:
K ¼ a + ðB + EÞ �W + 0:1Kð5Þ
where K is caloric intake in kilocalories, and W is weight in kilograms. The constants aand B represent the Basal Metabolic Rate for females and males ages 3-10, and varyonly by gender in the current simulation. E is the energy expenditure constant, whichrepresents the amount of physical activity the children engage in; calories burnedthrough physical activity depend both on E and on the child’s weight.31 The final term
27. Many of the students who eat lunch early in the day (reasonably!) report the meal as a ‘‘snack’’ andreport eating ‘‘lunch’’ either after school is over or not at all, so the category-based definition of lunchwould have excluded these students’ participation in the school lunch program.28. Another method that seems reasonable at first glance is to separate all food consumed at ‘‘school’’ andat ‘‘nonschool.’’ but this inadvertently includes school breakfasts and any after-school snacks eaten atschool during after-school programs or sports events.29. It is worth noting that this does not imply that brown baggers themselves eat a ‘‘healthier’’ lunch, justthat they eat fewer calories than NSLP participants. The number of calories consumed does not indicatewhether the food packed is largely prepackaged or is a homemade sandwich and fruit, and in fact evalua-tions of the school lunch program (for example, Gleason and Suitor, 2001) often find that nutrient intakesare higher among school lunch participants.30. This is similar to the simulations in Cutler, Glaeser, and Shapiro (2003).31. In the simulation, I hold constant the amount of physical activity when more calories and weight areadded. In reality, children may be less active if they weigh more, and this method would therefore under-state the increase in obesity from extra calories.
Schanzenbach 705

in the equation represents the thermic effect of food—that is, the calories burned fromeating and digesting food. The equation takes into account the fact that when oneweighs more, one also expends more calories to maintain that weight, so a sustainedincrease in calorie consumption can lead to a new (heavier) equilibrium weight.
Results from the simulation are presented in Table 8. If a typical first grader con-sumes just an additional 40 calories per day, then the rate of obesity will increase by1.7 percentage points in equilibrium. As a result, if the magnitudes of calorie differ-ences calculated in Table 7 are correct, we could easily expect to observe schoollunch eaters’ obesity rates to be about two percentage points higher than brownbaggers’ rates, all else equal. If the number of additional calories consumed in re-sponse to school meals is as large as 120 per day, the difference in obesity rates couldbe as high as seven percentage points. In either case, the seemingly small differencein calories—if consumed every day —could lead to a measurable increase in over-weight.32
VI. Potential Impacts on Hunger
It appears that school lunches substantially increase the probabilitythat a child is obese, and this suggests that making school lunches less caloric mightbe a possible policy intervention to reduce childhood obesity. But since the schoollunch program’s mission (at least historically) is primarily to combat hunger, it is im-portant to also consider the potential impact of any policy changes on the underfed.For example, reducing calories served by 40 across the board increases the simulatedrate of underweight by 0.5 percentage points—from 1.4 to 1.9.
One potential method to address hunger is through the school breakfast program.Fifteen percent of children who are underweight and from low-income families at-tend schools that do not offer the school breakfast program, even though they partic-ipate in the school lunch program. In addition, underweight students who do attendschools with a breakfast program are less likely to participate in the program thantheir classmates who are not underweight. Encouraging eligible students to enrollin the school breakfast program (and encouraging schools to offer the program)could be one route to offsetting any increase in underweight or hunger associatedwith reducing calories in school lunches.
It also appears to be the case that – as shown in Table 9 – schools with a higherfraction of low-income students already serve lunches that are lower in calories andhigher in nutrients.33 On average, schools from the lowest quartile of low-incomestudents serve lunches with about 80 more calories than schools in the highest quar-tile. Other nutrition measures – such as meeting the standards for iron, calcium andvitamins, or keeping the percentage of calories from fat below 30 percent – are eitherflat or improve as the fraction of low-income students increases. This implies that an
32. To put the calorie increase in context, a can of cola has about 145 calories and one ‘‘fun-size’’ candybar has about 70 calories.33. The underlying data in this table come from the SNDA-II, a survey of school and district food serviceswith a sample size of about 1,700.
706 The Journal of Human Resources
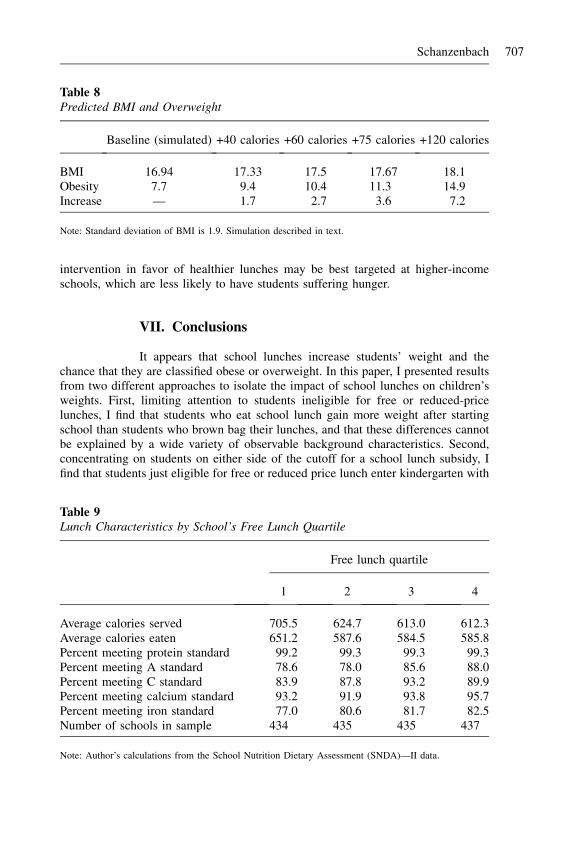
intervention in favor of healthier lunches may be best targeted at higher-incomeschools, which are less likely to have students suffering hunger.
VII. Conclusions
It appears that school lunches increase students’ weight and thechance that they are classified obese or overweight. In this paper, I presented resultsfrom two different approaches to isolate the impact of school lunches on children’sweights. First, limiting attention to students ineligible for free or reduced-pricelunches, I find that students who eat school lunch gain more weight after startingschool than students who brown bag their lunches, and that these differences cannotbe explained by a wide variety of observable background characteristics. Second,concentrating on students on either side of the cutoff for a school lunch subsidy, Ifind that students just eligible for free or reduced price lunch enter kindergarten with
Table 8Predicted BMI and Overweight
Baseline (simulated) +40 calories +60 calories +75 calories +120 calories
BMI 16.94 17.33 17.5 17.67 18.1Obesity 7.7 9.4 10.4 11.3 14.9Increase — 1.7 2.7 3.6 7.2
Note: Standard deviation of BMI is 1.9. Simulation described in text.
Table 9Lunch Characteristics by School’s Free Lunch Quartile
Free lunch quartile
1 2 3 4
Average calories served 705.5 624.7 613.0 612.3Average calories eaten 651.2 587.6 584.5 585.8Percent meeting protein standard 99.2 99.3 99.3 99.3Percent meeting A standard 78.6 78.0 85.6 88.0Percent meeting C standard 83.9 87.8 93.2 89.9Percent meeting calcium standard 93.2 91.9 93.8 95.7Percent meeting iron standard 77.0 80.6 81.7 82.5Number of schools in sample 434 435 435 437
Note: Author’s calculations from the School Nutrition Dietary Assessment (SNDA)—II data.
Schanzenbach 707

the same BMI and obesity rates as those who are just ineligible for the subsidy, butthat at the end of first grade they are significantly heavier. Analysis of food dietaryrecall data suggests that school lunch eaters consume more calories at lunch thanbrown baggers, and a simulation of the relationship between weight and caloric in-take indicates that as few as 40 additional calories per day could lead to a two per-centage point difference in obesity rates among children.
School lunches can explain only a small part of the overall obesity rate, and are nota strong candidate for describing the cause of the large and rapid increase in the obe-sity rate over the last three decades. In addition, the results should be interpreted withcaution, as they are estimated based on a group of young elementary school studentswho likely have less autonomy over their food choices than older students and mightnot be easily generalized to an older population. Nonetheless, these results suggest apotential role for public policy to address childhood obesity by encouraging or po-tentially mandating changes in school lunches.
References
Anderson, Patricia M., and Kristin F. Butcher. 2006. ‘‘Reading, Writing, and Refreshments:Are School Finances Contributing to Children’s Obesity?’’ Journal of Human Resources41(3):467–94.
Anderson, Patricia M., Kristin F. Butcher, and Philip B. Levine. 2003. ‘‘MaternalEmployment and Overweight Children.’’ Journal of Health Economics 22(3):477–504.
Angrist, Joshua, and Victor Lavy. 1998. ‘‘Using Maimondies’ Rule to Estimate the Effect ofClass Size on Scholastic Achievement.’’ Quarterly Journal of Economics 114(2):533–75.
Bhattacharya, Jayanta, Janet Currie, and Steven Haider. 2004. ‘‘Breakfast of Champions? TheSchool Breakfast Program and the Nutrition of Children and Families.’’ Journal of HumanResources 41(3):445–66.
Burghardt, John, Philip Gleason, Michael Sinclair, Rhoda Cohen, Lara Hulsey, and JulitaMilliner-Waddell. 2004. ‘‘Evaluation of the National School Lunch Program Application/Verification Pilot Projects.’’ Special Nutrition Program Report Series, No. CN-04-AV1.Washington, D. C.: U. S. Department of Agriculture.
Centers for Disease Control. 2006. ‘‘Foods and Beverages Sold Outside of the School MealsPrograms.’’ SHPPS 2006 Fact Sheets. Available at: www.cdc.gov.
Cutler, David M., Edward L. Glaeser, and Jesse M. Shapiro. 2003. ‘‘Why Have AmericansBecome More Obese?’’ Journal of Economic Perspectives 17(3):93–118.
Dahl, Molly W., and John Karl Scholz. 2005. ‘‘The National School Lunch Program andSchool Breakfast Program: New Evidence on Participation and Noncompliance.’’University of Wisconsin–Madison. Unpublished
Devaney, Barbara L., Anne Gordon, and John Burghardt. 1995. ‘‘Dietary Intakes ofStudents.’’ American Journal of Clinical Nutrition, 61(1 Suppl):205S–212S.
Devaney, Barbara L., and Elizabeth A. Stuart. 1998. ‘‘Eating Breakfast: Effects of the SchoolBreakfast Program.’’ Family Economics and Nutrition Review 11(4):60–62.
DiNardo, John, and David S. Lee. 2004. ‘‘Economic Impacts of Unionization on PrivateSector Employers: 1984-2001.’’ Quarterly Journal of Economics 119(4):1383–1441.
Economic Research Service. 2007. ‘‘Child Nutrition Programs: National School LunchProgram.’’ In Briefing Room. Available at www.ers.usda.gov. Accessed 12/1/07.
Figlio, David, and Joshua Winicki. 2005. ‘‘Food for Thought: The Effects of SchoolAccountability Plans on School Nutrition.’’ Journal of Public Economics, 89(2–3): 381–94.
708 The Journal of Human Resources

Food and Nutrition Service. 2003. ‘‘School Food Authority Administration of NationalSchool Lunch Program Free and Reduced Price Eligibility Determination.’’ SpecialNutrition Program Report Series, No. CN-03-AV. Washington, D.C.: U.S. Department ofAgriculture.
———. 2005. ‘‘National School Lunch Program Fact Sheet.’’ Available at: www.fns.usda.gov.
Fox, Mary Kay, Mary Kay Crepinsek, Patty Connor, and Michael Battaglia. 2001. SchoolNutrition Dietary Assessment Study—II: Final Report. Special Nutrition Program ReportSeries, Report No. CN-01-SNDAIIFR. Washington, D. C.: U. S. Department ofAgriculture.
Fraker, Thomas. 1987. The Sodium and Macronutrient Content of USDA School Lunches.Washington, D. C.: U. S. Department of Agriculture.
Gleason, Philip, and Carol W. Suitor. 2001. Children’s Diets in the Mid-1990s: Dietary Intakeand Its Relationship with School Meal Participation. USDA Food and Nutrition Service,Report Number CN-01-CD1. Washington, D. C.: U. S. Department of Agriculture.
———. 2003. ‘‘Eating at School: How the National School Lunch Program AffectsChildren’s Diets.’’ American Journal of Agricultural Economics 85(4):1047–61.
Gunderson, Gordon W. 1971. The National School Lunch Program: Background andDevelopment. Washington, D. C.: U. S. Department of Agriculture.
Hahn, Jinyong, Petra Todd, and Wilbert Van der Klaauw. 2001. ‘‘Identification and Estimationof Treatment Effects with a Regression-Discontinuity Design.’’ Econometrica 69(1):201-209.
Haskins, Ron, Christina Paxson, and Elisabeth Donahue. 2006. ‘‘Fighting Obesity in thePublic Schools.’’ The Future of Children Policy Brief. Spring.
Hinrichs, Peter. 2007. ‘‘The Effects of the National School Lunch Program on Education andHealth.’’ Georgetown University. Unpublished.
Institute of Medicine of the National Academies. 2005. Preventing Childhood Obesity:Health in the Balance. Washington, D.C.: The National Academies Press.
Lakdawalla, Darius, and Thomas Philipson. 2002. ‘‘The Growth of Obesity and TechnologicalChange: A Theoretical and Empirical Examination.’’ Working Paper No. 8946. Cambridge,Mass.: National Bureau of Economic Research.
Lee, David S. 2008. ‘‘Randomized Experiments from Nonrandom Selection in U.S. HouseElections.’’ Journal of Econometrics 142(2):675–97.
Matsudaira, Jordan D. 2005. ‘‘Sinking or Swimming? Evaluating the Impact of EnglishImmersion versus Bilingual Education on Student Achievement.’’ Cornell University.Unpublished.
McCrary, Justin, and Heather N. Royer. 2005. ‘‘The Effect of Maternal Education on Fertilityand Infant Health: Evidence from School Entry Policies Using Exact Date of Birth.’’University of Michigan. Unpublished.
National Center for Health Statistics. 2004a. ‘‘Prevalence of Overweight and Obesity AmongAdults: United States, 1999-2002.’’ Washington, D.C.: Centers for Disease Control.
———. 2004b. ‘‘Prevalence of Overweight Among Children and Adolescents: United States,1999-2002.’’ Washington, D.C.: Centers for Disease Control.
Schofield, W. N., C. Schofield, and W. P. T. James. 1985. ‘‘Basal Metabolic Rate: Review andPrediction Together with Annotated Bibliography of Source Material.’’ Human Nutrition:Clinical Nutrition 39C(Supplement 1):5–96.
School Nutrition Association. 2007. ‘‘School Lunch Prices Rise.’’ Available online at http://www.schoolnutrition.org/Index.aspx?id¼2439. Accessed March 3, 2008.
Surgeon General of the United States. 2001. The Surgeon General’s Call to Action to Preventand Decrease Overweight and Obesity. Rockville, MD: U.S. Department of Health andHuman Services, Public Health Service, Office of the Surgeon General.
Schanzenbach 709