do social media tools impact the development phase? an ... · do social media tools impact the...
TRANSCRIPT

Do Social Media Tools Impact the Development Phase?
An Exploratory Study*
Tucker J. Marion,
Gloria Barczak,
Erik Jan Hultink
ABSTRACT
Over the past two decades, firms have increasingly adopted information technology (IT) tools and services to improve
the new product development (NPD) process. Recently, social media tools and/or tools that include social networking
features are being utilized to allow users both inside and outside the organization to easily communicate and
collaboratively design, manage, and launch new products and services. Unfortunately, there is little empirical evidence
to suggest what influence these new IT tools have on NPD performance. Through a project-level, exploratory, empirical
study, the impact of these new IT tools on the development phase of the NPD process is investigated. We find that the
use of these new tools is significantly lower than the adoption of traditional IT tools such as e-mail and
computeraided-design. Traditional tools have a significant, positive impact on NPD outcomes, including team
collaboration, the concepts/prototypes generated, and management evaluation. Interestingly, new media tools such as
project wikis and shared collaboration spaces also have a significant, positive impact on concepts/prototypes
generated, and management evaluation. Surprisingly, social networking tools like weblogs and Twitter negatively
impact management evaluation while having no impact on NPD team collaboration and concepts/prototypes
generated. These results suggest that social networking tools in their current guise are not helpful to the NPD team and
may in fact be distracting to innovation management during the development phase.
Address corresponding to: Tucker J. Marion, 304 Hayden Hall, 360 Huntington Avenue, Northeastern University, Boston, MA 02115. E-mail:
[email protected]. Tel: 617-373-2241. * The authors would like to thank PTC Corporation for their support in helping in conduct the research. Editor’s Note: It is customary in high-quality journals that the Editor not be allowed to publish in the journal during his/her tenure. This article was
submitted to the previous Editor of JPIM, C. Anthony Di Benedetto, who handled the entire review process.

Introduction
Over the past two decades, firms have increasingly adopted information technology (IT) tools and services to improve
the new product development (NPD) process. The tasks that IT tools touch upon during NPD include aspects of planning,
engineering and design, implementation, and program management (Song, Berends, Van der Bij, and Weggemen, 2007).
This space is dynamic and has seen IT migrate from basic communication (e-mail), desktop applications (word
processing), and computer-aided design packages (CAD) to include tools and services that impact nearly all aspects of the
design and commercialization process (Marion, Fixson, and Meyer, 2012; Ozer, 2003; Pavlou and El Sawy, 2006).
New tools are launched with the aim to improve project and organizational performance. A recent trend is to
incorporate social media and social networking features into existing IT products. For example, PTC’s latest CAD
program CREO® includes social networking features to allow comments and collaboration directly to the CAD file.
Whether stand-alone or embedded into current IT tools, these new social media applications are designed to allow users
both inside and outside an organization to easily communicate and collaboratively design, manage, and launch new
products and services. Examples of such tools include project wikis, comment/ blog sections within software packages,
cloud-based tools such as Google Docs and social networking applications like Facebook.
Kenly and Poston (2010) found in a recent survey of 90 product and service organizations that companies are using
social media tools (e.g., blogs, wikis, shared workspaces, microblogging, and social media sites) throughout the NPD
process. Additionally, Carlson (2012) discovered that firms are increasingly evaluating various automated and
commercially available innovation management software tools and solutions as a way to improve NPD performance.
These trends suggest that there is both practical and academic value to examining the impact of social media tools on
NPD outcomes. Social media tools are designed to increase communication, knowledge flow, and knowledge
management both inside and outside the corporation. For instance, Nonaka and Takeuchi (1995) noted the importance of
this knowledge flow and its impact on corporate innovation. Carlile (2002) also noted the difficulty of knowledge
management within the NPD organization, particularly when sharing that knowledge across different NPD functions.
However, recent research on the relationship between IT and NPD performance has shown mixed results. Durmusoglu,
Calantone, and Sambamurthy (2006) found no relationship between IT tools and NPD outcomes such as speed, cost,
and flexibility. In addition, Barczak, Sultan, and Hultink (2007) found that IT usage impacted the performance of the
new product in the marketplace, but it did not influence speed-to-market. Yet, in the most recent Comparative
Performance Assessment Study (CPAS) (Markham and Lee, 2012), the results showed that the best performing firms
used a variety of IT tools to speed time-to-market of their new products.
For this reason, the present research will focus on the impact of more traditional IT tools and newer social media tools
on outcomes of the development phase of the NPD process. As a result, the contributions of our study will be threefold.
First, Terwiesch, Loch, and Meyer (2002) suggested that the role of IT in NPD needs to be further examined. By
emphasizing the usage of social media tools for NPD, this research adds to the emerging research stream on this topic
(cf. Roberts and Candi, 2012) and will provide more guidance to firms as to the significance of such tools in the
development phase of the NPD process. Second, investigating the effect of social media tools on various NPD outcomes
will provide a deeper understanding of which tools act as levers that can be managed to yield particular NPD project
objectives. Recent research has called for examining the performance impact of IT usage (Sun, Bhattacherjee, and Ma,
2009) and for expanding the definition of the business value of IT (i.e., looking at other measures besides financial
measures) (Kohli and Grover, 2008). In this study, development phase outcomes that include NPD team collaboration,
concepts/prototypes generated, and management evaluation are examined. These outcomes were selected based on
previous research (Cooper, 2001; Krishnan and Ulrich, 2001; Perks, Cooper, and Jones, 2005; Ulrich and Eppinger,
2011), which indicates that they are appropriate performance metrics for the development phase. Finally, from a
theoretical perspective, this research will help to show the importance of building IT assets to develop a firm’s NPD and
knowledge management capabilities. More specifically, our results suggest that by utilizing particular IT tools in the
development phase, knowledge acquisition and sharing can lead to greater NPD team collaboration, more concepts/
prototypes generated, and faster management evaluation.

Theoretical Background and Research Questions
Resource-Based Theory
Resource-based theory suggests that firms have different resources (i.e., assets and capabilities) and that performance
depends on those particular resources and how they are used (Wade and Hulland, 2004; Wernerfelt, 1984). Moreover,
higher performance is maintained when resources are relatively scarce and cannot be imitated or substituted (Rumelt,
1987). According to this resource-based perspective, a firm’s resources can include IT (Barney, 1991). In fact, the IT
literature argues that assets include such things as physical IT assets, technical platforms, databases, architectures, and
standards (Ross, Beath, and Goodhue, 1996). These technology assets are believed to be of high value to firms, to have
high appropriability, and low substitutability thereby helping firms to create a competitive advantage (Wade and
Hulland, 2004). Thus, the resource-based view of the firm supports the focus of the present research to examine the
impact of IT on NPD performance.
The knowledge-based view argues that knowledge is also a resource and the firm’s ability to integrate different
knowledge areas and apply that knowledge to the development of new products can enhance performance (Grant, 1996;
Kogut and Zander, 1992; Nonaka, 1994; Spender, 1996). Prior research supports the successful use of IT for knowledge
gathering, dissemination, analysis, and implementation in NPD (Boutellier, Gassman, Macho, and Roux, 1998; Malhotra
and Majchrzak, 2004; Ozer, 2000, 2003; Song et al., 2007). This, in turn, enhances the quality of NPD decision-making
(Ozer, 2000; Teo and Choo, 2001) resulting, potentially, in more successful products. Thus, the knowledge-based theory
of the firm provides a fundamental theoretical explanation as to why the use of various IT tools in the NPD process may
increase performance.
BIOGRAPHICAL SKETCHES
Dr. Tucker J. Marion is an associate professor in Northeastern’s D’Amore-McKim School and Business,
Entrepreneurship & Innovation Group, co-director of the Institute for Global Innovation Management, and the
Samuel Altschuler Research Professor. Dr. Marion’s interdisciplinary research is concentrated on product
development, innovation, and entrepreneurship. Specifically, he looks at how innovation efforts can be made more
efficient and effective through the use of collaborative IT, digital design, rapid prototyping, outsourcing, and
product architecture. His work has appeared in books and journals including Journal of Product Innovation
Management, R&D Management, Sloan Management Review, Research-Technology Management, Design Studies,
International Journal of Production Research, and others.
Dr. Gloria Barczak is a professor of marketing, co-director of the Institute for Global Innovation Management, and
the 2010 Robert D. Klein University Lecturer in the D’Amore-McKim School of Business at Northeastern
University. She has been ranked twice in the Top 20 Innovation Management Scholars in the world. Dr. Barczak’s
current research focuses on the role of information technology, including social networking tools, on new product
performance and collaboration efforts.
Dr. Erik Jan Hultink is a professor of new product marketing and head of the Department of Product Innovation
Management (PIM) at the Faculty of Industrial Design Engineering, Delft University of Technology, Delft, the
Netherlands. He is also a part-time professor in new product marketing at the Business School of the University of
Portsmouth in the U.K. He received his MSc in economics from the University of Amsterdam and his PhD from
Delft University of Technology, both in the Netherlands. His research investigates means for measuring and
improving the process of new product development and launch. He has published on these topics in such journals
as Journal of the Academy of Marketing Science, International Journal of Research in Marketing, Industrial
Marketing Management, R&D Management, IEEE Transactions on Engineering Management, Design
Management Review, and in Journal of Product Innovation Management. He ranks consistently among the
World’s Top Innovation Management scholars.


Focus on the Development Phase
The current study focuses on the development phase of the NPD process, which includes detailed engineering and design,
cost engineering, prototyping, and product testing. This particular phase was chosen for several reasons. First, firms
spend most research and development (R&D) resources in the development phase (Meredith and Mantel, 2006). In
looking at the typical NPD project lifecycle, as a development project progresses from planning to execution, the
number of person-hours dedicated to the project increases dramatically during the development stage. Second, IT tools
have historically focused on this phase of the NPD process since their inception in the early 1960s. This focus began with
the development of CAD and progressed through communication and enterprise tools that migrated to both upstream and
downstream stages of NPD (Marion et al., 2012). With the rise of social media tools, starting in the development phase to
investigate the impact of such IT tools is appropriate. Third, extant research shows that different tools are used in each
phase, and these tools have different effects on NPD outcomes across stages (Boutellier et al., 1998; Durmusoglu and
Barczak, 2011; Malhotra and Majchrzak, 2004). Moreover, there has been a call for research on understanding the role of
IT tools across distinct phases of the NPD process (Banker, Bardhan, and Asdemir, 2006). Finally, tasks that need to be
accomplished in the development phase of the NPD process demand that members of diverse functional areas such as
marketing, manufacturing, and engineering work cooperatively, share information, and jointly solve project-related
problems. In fact, collaboration among NPD team members is most intense in this phase (Thamhain and Wilemon, 1975).
The development phase may also involve communication and collaboration with external partners such as suppliers,
distributors, and customers (Ozer, 2000). Thus, the use of diverse types of IT tools that facilitate information sharing and
problem solving among core and extended team members are likely to be useful.
Research Questions
Kaplan and Haenlein (2010) define social media as “a group of Internet-based applications that build on the ideological
and technological foundations of Web 2.0, and that allow the creation and exchange of user generated content” (p. 61).
Within this, they include wikis, weblogs, social networking sites, and file-sharing sites. This definition is used in this
study.
Research has begun to show the proliferation of social media tools in the NPD process (Kenly and Poston, 2010). In
a recent global survey conducted by Sloan Management Review and Deloitte, it was found that 63% of all firms view
that social software will be important to their firm in the next three years (Kiron, Palmer, Phillips, and Kruschwitz,
2012). Eighteen percent of respondents rated social media as important to their business today.
What is not yet sufficiently understood is the impact of traditional and new social media IT tools on NPD performance.
This exploratory study seeks to shed some light on the extent of usage of such tools and the influence of these
traditional and newer IT tools on several development phase outcomes: NPD team collaboration, concepts/prototypes
generated, and management evaluation. These outcomes were selected based on previous research (Cooper, 2001;
Krishnan and Ulrich, 2001; Perks et al., 2005; Ulrich and Eppinger, 2011), and support for each is provided in the
paragraphs below.
NPD Team Collaboration
NPD team collaboration is defined as an affective process in which two or more individuals or units work together, have
mutual understanding, share resources, and achieve collective goals (Appley and Winder, 1977; Kahn, 1996; Schrage,
1990). For example, Cooper (2001), in his discussion of the development stage, argues that it requires cross-functional
collaboration as parallel actions are occurring that involve engineering, design, marketing, and
operations/manufacturing. In addition, this stage requires information acquisition and dissemination that necessitates
team collaboration (Cooper, 2001). In a study on the role of design in the NPD process, Perks et al. (2005) found that the
design and development phase includes design sketches, prototype designs, development of prototypes, and product
testing. In addition, design personnel need to integrate and negotiate with other functions in this phase. Similarly,
Krishnan and Ulrich (2001) indicate that during the design and development phase, decisions need to be made about
issues such as the design parameters, detailed design, and the prototype plan. Yet they also emphasize that these
decisions require input from various functional areas as the decisions have interdependent effects.
In other research, Souder (1977, 1987) found that harmony between departments (i.e., greater collaboration) led to more
successful NPD projects. Similarly, Kahn (1996) indicated that collaboration rather than simply interaction is a primary
factor for NPD success. More recently, Nakata and Im (2010) provided evidence that cross-functional integration of NPD
team members has a positive impact on new product performance. In other words, combining the skills, knowledge, and
efforts of various functional team members leads to higher performing new products. Thus, the literature suggests that
NPD team collaboration is an appropriate outcome measure in the development phase because of the interdependent and
multiple activities going on and the evidence that collaboration leads to NPD success. As a result, our study examines if
traditional and social media IT tools improve collaboration among NPD team members. Our expectation is that both
types of tools will enhance NPD team collaboration.
Concepts/Prototypes Generated
The NPD process is one in which knowledge (both explicit and tacit) is discovered, reviewed, and enhanced by team
members working on a particular problem (Nonaka, 1994). Designers, engineers, marketing, and manufacturing
personnel absorb and transfer this knowledge to themselves and to other team members to inform the design and product
development tasks. This process ultimately results in iterations of the design concept and prototype solution. For
example, Ulrich and Eppinger (2011) note that teams make better decisions when they make several iterations rather than
agonizing over just a few iterations. Similarly, Cooper (2001) notes that in the development stage, activities such as
prototype development and testing are iterative in nature. Thus, the degree to which design concepts and product
prototypes are generated is a suitable outcome measure for the development phase. Therefore, the present study examines
the impact of traditional and social media IT tools on concepts/prototypes generated during the development phase.
Management Evaluation
Both horizontal and vertical knowledge flow and management within a firm is a conduit for learning and sharing
(Meyer and Zack, 1996; Zack, 1999). Vertical knowledge sharing is particularly important in the NPD process as
management needs to make decisions about such issues as the NPD portfolio, allocation of resources (financial, human,
equipment/materials), the technology platforms for development and manufacturing, and the product road map (Kester,
Griffin, Hultink, and Lauche, 2011). Additionally, after each phase of the process, management should engage in a gate
review of each project and make a decision as to whether or not the project moves forward (Cooper, 2001). Progressive
companies are automating their NPD processes, including the gate reviews, to ensure that management has the
information they need to make quality decisions (Cooper, 2006). Thus, exploring management evaluation is an
appropriate outcome metric for the development phase of the NPD process. As a result, this study investigates the effect
of traditional and social media IT tools on management evaluation.
Research Method
For this exploratory research, we collaborated with PTC Corporation, a global leader in NPD software. An electronic
survey was developed and distributed to 644 NPD employees representing customers of PTC’s products. The
confidential and anonymous survey asked respondents about the extent of usage of various IT tools and the outcomes of
the development phase of the NPD process. Two follow-up reminder e-mails were sent to the mailing list. As an
incentive, respondents who completed the survey were entered into a contest to win a new mobile device. After
accounting for incomplete surveys, the final sample consisted of 198 respondents from 193 firms, resulting in a 30.7%
response rate. Post survey closure, representative firms were contacted for in-depth interviews.
Table 1 presents the sample characteristics of the survey respondents. The industries represented include aerospace
systems, automobiles, computers, and consumer electronics. The firms in our sample are predominantly established
(89% are at least 20 years old) and multinational (85%). They are primarily large in size, with 58% of respondents
indicating that their firm has at least 1000 employees. However, there is variation in firm size with 42% reporting that
their firm has less than 1000 employees. The respondents are primarily engineers (83%) working in NPD or R&D (9%).
Because this study examines the development phase at the project level, this sample is representative of departments and
organizations tasked with detailed design, engineering, prototype development, and testing.

Table 1. Respondent Sample Characteristics
Firm Type
%
Firm Size (Number
of Employees)
%
Firm Age (Years)
%
Respondent
Functional Area
%
U.S. Only 15 Fewer than 100 14 Fewer than 5 1 Sales 1
85 100–499 19 5–9 2 Marketing 1
500–999 9 10–19 8 Engineering 83
1000–4999 16 20–49 35 Manufacturing 3
5000–9999 10 Greater than 50 54 Research and development 9
Greater than 10,000 32 Other 3
Nonresponse bias was assessed by performing t-tests on response means for the independent, dependent, and control
variables separated by response time (early—first quartile versus late—last quartile as per Armstrong and Overton, 1977).
Based on an analysis of variance comparison of study variables, no differences were found indicating that nonresponse
bias is not a major issue.
The unit of analysis for the study is the project level. Because our lens is aimed on what tools are used during the
development phase, a project-level analysis is preferred for determining the impact of these tools (Barczak et al., 2007;
Devaraj and Kohli, 2003). Additionally, most IT tool use for NPD occurs at the project level (McGrath and Iansiti, 1998).
Measures
Measures for the study were drawn from existing studies or adapted where necessary. The survey was developed over a
period of several months, with versions evaluated by both academic colleagues and our research partner, PTC
Corporation. After beta-testing several draft iterations of the instrument, we finalized the questions and ordering. The
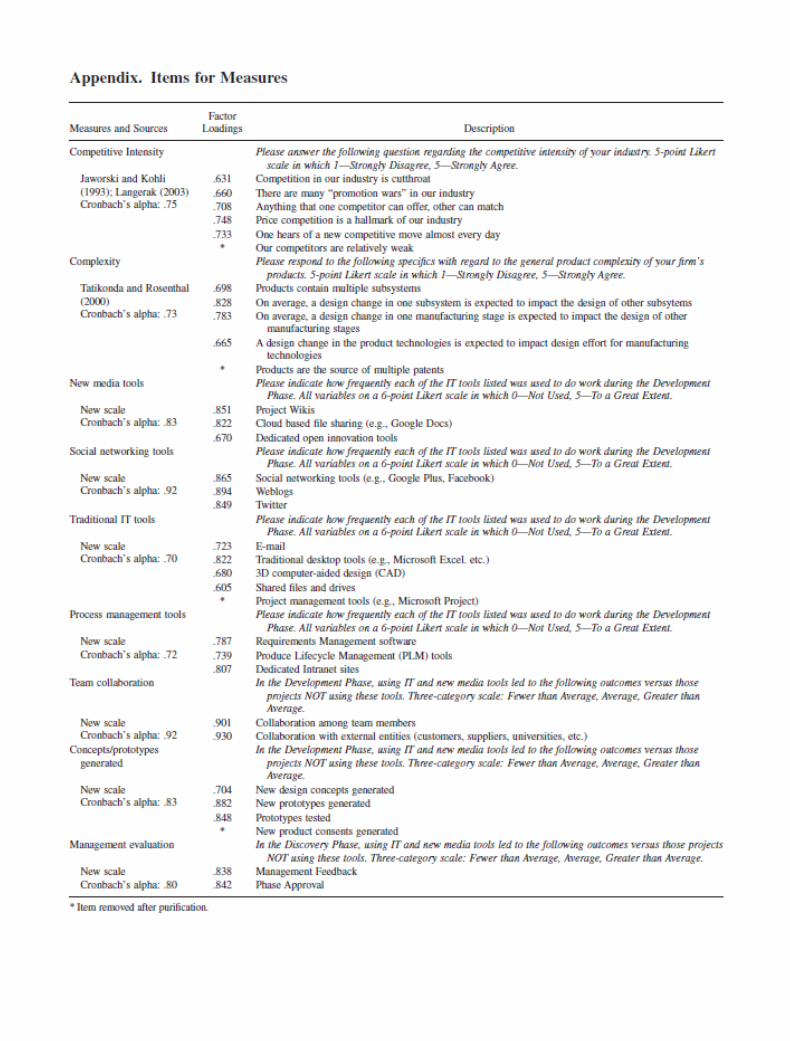
Appendix provides all measures along with their sources and factor loadings.
To measure the impact of project-level IT tool usage on the development phase of NPD, we worked with PTC
Corporation’s advanced technology group to identify appropriate categories and examples of traditional and new IT
tools. The work of Barczak et al. (2007), and Durmusoglu and Barczak (2011) was also evaluated to identify
appropriate IT tools used in NPD. A final list of 17 tools was developed. These IT tools include the use of e-mail, wikis,
fax, video-conferencing, project management tools such as Microsoft Project, traditional desktop tools such as
Microsoft Office, cloud-based file-sharing, shared drives and files, requirements management (RM) software, CAD,
design simulation tools, product lifecycle management (PLM) systems, dedicated company intranet tools, weblogs,
micro blogging (i.e., Twitter), social networking sites (e.g., Facebook), and dedicated open innovation tools.
Respondents were asked to indicate the extent of use of these tools within the development phase using a six-point
Likert-type scale (0 = not used, 5 = used to a great extent). Previous research suggests that self-reported usage measures
correlate well with actual usage (Barczak et al., 2007; Taylor and Todd, 1995).
Principal components and cluster analysis was performed on the 14 IT tools yielding four distinct IT tool categories:
(1) new media tools (e.g., project wikis and cloud-based file sharing), (2) social networking tools (e.g., Facebook,
weblogs, and Twitter), (3) traditional IT tools (e.g., e-mail and CAD), and (4) process management tools (e.g., PLM
systems and dedicated intranet sites). During this process, three tools were removed for outlying cluster proximity.
These included the use of video, simulation tools, and fax.
To measure development phase outcomes, respondents were asked to indicate on a three-item scale whether the IT tools
affected eight specific outcomes (fewer/slower, average, or greater/faster than average) relative to projects that did not
use these tools. The outcome scales (see the Appendix) were based on previous research (Cooper, 2001; Krishnan and
Ulrich, 2001; Perks et al., 2005; Ulrich and Eppinger, 2011), which suggested that these items represented appropriate
metrics for the development phase. A principal components analysis was performed on the eight outcome items,
yielding the three development outcome measures—NPD team collaboration, concepts/prototypes generated, and
management evaluation.

Two control variables were included in the study: competitive intensity and complexity. The competitive intensity measure
was based on Jaworski and Kohli (1993), and Langerak (2003), and was added because highly competitive industries such
as automobiles and computers tend to have an internal focus on developing a world-class NPD process. Because of this,
their adoption and use of tools are dynamic and pervasive. The complexity measure was based on Tatikonda and
Rosenthal (2000), and asked respondents to evaluate the general complexity of their firm’s products. This control
variable was added because the complexity of a new product can have a direct influence on the importance and type of IT
tools used to design a firm’s products. For example, an aerospace firm designing an airliner will have much different needs
in terms of RM, design control, and lifecycle management than a firm designing a simple consumer product. Product
complexity has also been shown to impact development times and resources used during NPD (Griffin, 1997; Larson and
Gobeli, 1989; Meyer and Utterback, 1993).
Reliability and validity.
Scale reliability and validity were assessed following the suggestions of Anderson and Gerbing (1991). As a first step in
the process, item correlations were evaluated one scale at a time. Then, principal components analyses were performed
on the independent and dependent variables separately (see above). The reliability of each scale was then calculated,
eliminating items that decreased scale reliability below .70. During the factor analysis purification process, four items
were removed: an item on competitive intensity, an item on patents in complexity, a project management IT item in
traditional IT tools, and an item on new product concepts generated in the concept-/prototype-generated outcome scale.
Analysis of the final, revised scales showed no significant cross-loading of the items, with all corresponding measures
having acceptable factor loadings, ranging from .63 to .93 (significant at the < .5 level). As such, discriminant validity is
deemed to be sufficient. Finally, a confirmatory factor analysis (CFA) model was run on the items pertaining to all
independent and dependent variables separately. For the independent variables, the final CFA model showed an adequate
fit to the data (χ2 = 184.32; df = 62, goodness of fit index [GFI] = .89; normed fit index [NFI] = .85; comparative fit
index [CFI] = .90). The final dependent variable CFA model included the seven items measuring the three outcome
categories and produced an adequate fit to the data (χ2 = 40.93; df = 11; GFI = .95; NFI = .95; CFI = .96).
Table 2 presents the means, standard deviations, average variance extracted, correlation coefficients, and their
associated p-values for all constructs. To test for potential multicollinearity problems, variance inflation factors (VIFs)
were calculated for each regression model. VIFs in all cases were found to be below 3.0, indicating that
multicollinearity is not a major issue in the data (Hines, Montgomery, Goldman, and Borror, 2003). Table 3 presents
the VIF values for each model.
Table 2. Correlation Matrix and Descriptive Statistics of Measures
Variables 1 2 3 4 5 6 7 8 9
(1) Competitive intensity .75 (2) Complexity .246** .73 (3) New media tools .227** .231** .83 (4) Social networking tools .235** .058 .745** .92 (5) Traditional IT tools −.126 .096 .009 −.113 .70 (6) Process management tools .151* .268** .570** .412** .322** .72 (7) Team collaboration −.036 .144* .175* .033 .352** .279** .92 (8) Concepts/prototypes generated −.029 .136 .216** .071 .300** .233** .732** .83 (9) Management evaluation .061 .055 .135 −.012 .258** .171* .590** .556** .80
Mean 3.095 3.692 1.399 .998 4.328 2.549 2.141 2.125 1.985
Standard deviation .63 .636 1.264 1.166 .947 1.481 .594 .578 .625
AEV .48 .56 .66 .86 .63 .66 .87 .75 .83
Number of Items 5 4 3 3 4 3 2 3 2
* p < 0.05.
** p < 0.01. Diagonal elements in bold are composite reliabilities. AEV, average extracted variance.

Table 3. Regression Results
Regression Models
Model 1 Model 2 Model 3
Team Collaboration Concepts/Prototypes Generated Management Evaluation
(Standardized Betas) (Standardized Betas) (Standardized Betas)
Competitive intensity −.039 −.021 .093
Complexity .009 .025 −.098
New media tools .201* .293** .280**
Social networking tools −.129 −.118 −.233**
Traditional IT tools .290*** .276*** .238***
Process management tools .127 .013 .034
R2 .171 .143 .113
Adjusted R2 .145 .116 .085
F-value 6.546 5.32 4.048
SS 11.86 9.424 8.68
df 6 6 6
N 198 198 198
Max VIF 2.84 2.84 2.88
* p < .1. ** p < .05.
*** p < .01. SS, sum of squares; VIF, variance inflation factor.
Results and Discussion
This exploratory research was tested using a series of regressions. Regression model 1 investigated the influence of the
four categories of IT tools on NPD team collaboration during the development phase (p = .000, adjusted R2 = .145).
Regression model 2 investigated the impact of the four categories of IT tools on concepts/ prototypes generated (p = .000, adjusted R2 = .116). Lastly, regression model 3 investigated the influence of the four categories of IT tools on
management evaluation during the development phase (p = .001, adjusted R2 = .085). A summary of the regression results
are shown in Table 3.
The results indicate that new media tools such as project wikis and cloud-based file sharing have a positive, although not
significant, relationship with NPD team collaboration (beta = .20, p < .1). This result makes sense, as tools such as Google
Docs, Microsoft Sharepoint®, and project wikis such as Basecamp® are designed to improve communication and
knowledge flow across team members. Information can be pushed and pulled to the team in an increasing fashion.
However, new media tool use is not pervasive in the sample with a mean usage frequency of 1.399 (see Table 2).
However, new media tools had a significant, positive impact on concepts/ prototypes generated (beta = .29, p < .05). New
media tools such as project wikis and file-sharing sites are specifically designed to share design and prototype iterations
more efficiently. Therefore, it is simply easier to modify and exchange designs using these new tools. Lastly, the results
show a strong, positive impact of new media tools (beta = .28, p < .05) on management evaluation. These tools appear to
allow management to provide feedback and undertake approvals faster than previously. For example, upper-level
management may be included on a project-level wiki or file-sharing site and be notified via e-mail of design updates. For
those firms that do heavily use new media tools, their influence on the process can be strong. A technology firm in our
depth interviews notes: “We have moved all our processes, procedures and total file storage to a cloud-based service. We
love it.” This firm coordinates between facilities in several countries and time zones. Although it took over a year for the
migration and usage to permeate the organization, employees and management praise its impact.
In our study, social networking tools (e.g., Facebook, blogs, Twitter) were not heavily used during development (mean = .99, see Table 2). Although such tools may increase communication among team members, they do not appear to
improve collaboration or the intensity of design iterations among team members. No significance on outcomes was
found in regression model 1 or 2 regarding the use of social networking tools during development. One reason for this
may be the newness of these media for use in NPD. In a recent survey, only 40% of respondents indicated that they
were using social media for the development and launch stages (Kenly and Poston, 2010). In an interview, a project

manager commented on the testing of a social networking communication and notification tool: “We tried [software
service name withheld], but after several days we stopped using it because it was annoying. The constant alerts and
notifications were a bit much.” Surprisingly, the results showed that social networking tools had a significant, negative
impact on management evaluation (beta = −.23, p < .05). In other words, social networking leads to slower
management feedback and phase approval. One rationale for this finding is that social networking tools may not be
considered as a useful or appropriate medium for management to evaluate design concepts and prototypes. An
engineering manager at a defense firm noted that: “We need to keep management at arm’s length. once management
has visibility into the project, everyone thinks they are an engineer.” As the name implies, social networking tools are
social and tend to be used primarily to network with entities outside of the organization. Evidence also shows that social
networking tools are primarily being used in the idea generation phase of the NPD process (Kenly and Poston, 2010;
Markham and Lee, 2012). Thus, their limited use in the development phase may be why they do not show a significant
impact on outcome measures.
Traditional IT tools such as e-mail and CAD have a strong, significant impact on NPD team collaboration (beta = .29, p < .01). Traditional IT tools are most frequently used in the development phase, with a mean usage of 4.33 (see Table 2)
compared with a low average use of social networking tools (mean = .99). Traditional IT tools also had a significant,
positive impact on concepts/prototypes generated and management evaluation (beta = .28, p < .01; beta = .24, p < .01,
respectively). Again, these results are understandable, as many of the traditional IT tools have been in active use for over
20 years in most firms. This finding suggests that there is an innate comfort and ease-of-use factor. In addition, the
increase in bandwidth and transfer of large files such as CAD models allows designs to be e-mailed and shared
repeatedly with team members. A design and engineering firm noted the reliance and integration of CAD into their
process, starting with up-front ideation. A mechanical engineer at the firm noted: “We go right to CAD and start
sketching, iterating very early conceptual models, and sharing them with the team.” Another design engineer noted:
“Many of our clients want to see hand drawn concepts, so we often take our CAD files, print them, and hand sketch
elements to make them look like freehand drawings.” These comments show the embeddedness of these tools in the
current NPD process.
In this study, process management tools (e.g., PLM, RM) showed no significant relationships with outcomes. The lack
of influence of process management tools on NPD team collaboration may also be due to their overall low frequency of
usage in the development phase. As shown in Table 2, the mean for process management tools was 2.5. However, it is
interesting that new media tools have a lower mean of 1.4, yet these tools have a significant impact on NPD team
collaboration. A possible explanation may be that the process management tools are not used effectively during the
development process. Tools like RM or PLM systems require disciplined input, maintenance, and updating to be used
properly. Their usefulness declines when not maintained. Similarly, with regard to process management tools, their low
usage, and lack of influence on the number of concepts and prototypes generated may also be caused by a lack of
effective management of these tools. PLM systems act as knowledge repositories. These systems can store design files
for later use, in theory speeding development efforts by having design teams access prior designs. However, reality and
the lack of maintenance reduce their value. In our follow-up interviews, a lead engineer from a large aerospace firm
noted: “We have 27,000 CAD files stored in a messy vault (PLM) system. Instead of searching for prior designs, the
engineering manager noted that teams just start from scratch.” Process management tools also had no effect on
management evaluation suggesting that these tools may not be accessible to management and/or that the information and
knowledge they store may not be timely or relevant for management decision-making. The aim of these tools is to
increase knowledge management for NPD. However, our results indicate that real-world influence of these systems is
less than hoped for.
Theoretical and Managerial Implications
Research has shown that knowledge management is a key component of a firm’s NPD process (Nonaka and Takeuchi,
1995). Thus, the transfer and flow of information among the members of the NPD team and with management are
critical to NPD performance. Over the last 30 years, knowledge flow and management during NPD has migrated to
computer-based tools and software packages. These tools began as digital substitutes for traditional engineering design
workflow (i.e., CAD replaced draftsmen). This shift in team workflow— enabled by digital design tools—occurred at
the same time as the rise of e-mail, corporate intranets, and the Internet. These electronic files could now be e-mailed and

stored on corporate data vaults—allowing distributed teams the ability to easily modify and change designs during the
course of the project (Fixson and Marion, 2012). Over the last 10 years, a new generation of tools has emerged to
further improve the information flow and access to team members and management. These tools allow both active and
passive information sharing among a distributed network of users. This study focused on these new tools to assess their
impact relative to more standard IT tools on three different performance outcomes of the development phase.
It has been argued that IT assets by themselves do not create value for the firm, rather they need to be combined with
other non-IT resources (Kohli and Grover, 2008). The results of the present study show that at least in the case of NPD,
IT tools have a direct impact on NPD phase performance. In other words, IT creates value for the firm through influencing
NPD outcomes.
This study also finds that traditional IT tools are well entrenched in NPD teams during development. E-mail, CAD, and
traditional desktop tools are ubiquitous and effective. The use of these tools has a positive influence on NPD team
collaboration, concepts/prototypes generated, and management evaluation. After 30 years of active deployment and
refinement, users are at ease with their features and usefulness. Thus, it would be wise for NPD teams to continue to
utilize these tools.
Social networking tools have changed how we collect and exchange information. They allow for not only active push
communication to a community but also pull information and feedback from that same community. Additionally, these
new tools are available 24/7, are mobile, and are in real-time. The results show that new media tools (i.e., wikis, cloud-
based file-sharing), although less widely used than traditional tools in our sample, have a significant positive impact on
our three outcome measures of the development phase: NPD team collaboration, concepts/prototypes generated, and
management evaluation. For example, project wikis and cloud-based file sharing allow one place for project-specific
information and permit multiple users to add to project updates anytime they wish. This provides direct value to the NPD
team in that the project can be worked on around the clock, all team members have access to the same information, and
the number of design concepts and prototypes generated can be increased. In addition, the team can get faster feedback
and review decisions from management. Thus, for NPD teams that use new media tools, continued utilization is
recommended. For those NPD projects that have not yet incorporated these tools, our results provide validation for their
implementation during the development phase.
On the other hand, the findings indicate that social networking tools have no impact on NPD team collaboration or
concepts/prototypes generated, and they have a negative influence on management evaluation. Our follow-up interviews
point to several potential reasons for these results. One reason is that tools like Facebook, Twitter, and blogs may not be
useful when managers need to make engineering, design, and manufacturing decisions. In fact, such tools may be a
distraction as they take team members away from doing their work. Several respondents noted that they stopped using
particular IT tools out of frustration or lack of perceived value. Because social networking tools are relatively new, they
may not be effective in their current guise. As these tools are early in their technology life cycle, a few dominant
applications have emerged (e.g., Twitter and Facebook); however, none seem to have become a standard in terms of
being integrated into the NPD process. As managers and NPD teams look to include social networking tools into their
NPD process, they need to be cognizant of tool/application churn. Additionally, NPD personnel need to determine
whether or not social networking tools provide value and in which stage of the NPD process.
Finally, our results indicate that process management tools have no effect on any of the development phase outcomes.
Although there are indications that PLM tools are increasingly being evaluated by firms (Carlson, 2012), their usage is
still relatively low. The same seems to be true for dedicated intranet sites and RM software. In our follow-up interviews,
several respondents noted that effective use of these tools requires a disciplined focus on including them and maintaining
them during the NPD process. A common frustration is the initial high expectations given to these tools only to be
followed by strong dissatisfaction as the integrity of the system erodes, ultimately becoming a cumbersome collection of
outdated information. Managers and NPD teams need to be conscious of the commitment needed to effectively
implement these tools and willing to exert the effort necessary to sustain the information and knowledge within each
tool over time.

Limitations and Future Research
There are several limitations in this research. First, our sample represents the customers of one major NPD software
vendor (recent data suggest that PTC owns more than 50% of the digital design tools installed base). Additionally, the
respondents are primarily engineers as they are the primary users of PTC’s software products. Thus, it may be that
these respondents use IT for NPD to a greater extent than NPD personnel from other functions and from firms that
are noncustomers of PTC. Second, the sample consists mostly of large, U.S. multinational firms. Future research should
explore the use of traditional, new media, and social networking tools in countries other than the United States, and in
small and medium enterprises to ascertain if there are differences in adoption by culture and size of firm. Third, this
current study is centered on one phase of NPD, the development phase. As there has been a call for research on
understanding the role of IT across distinct phases of the NPD process (Banker et al., 2006), future research should
investigate the use and impact of various IT tools on the discovery and commercialization phases of the NPD process.
Because social media tools are being used in the discovery phase for customer involvement and in the
commercialization phase for marketing and launch, differences in usage efficacy between these phases represents an
interesting opportunity for further investigation.
References
Anderson, J. C., and D. W. Gerbing. 1991. Predicting the performance of measures in a confirmatory factor analysis with a pretest assessment of their substantive validities. Journal of Applied Psychology 76 (5): 732– 40.
Appley, D. G., and A. E. Winder. 1977. An evolving definition of collaboration and some implications for the world of work. Journal of Applied Behavioral Science 13: 279–91.
Armstrong, J. S., and T. S. Overton. 1977. Estimating non-response bias in mail surveys. Journal of Marketing Research 14: 396–402.
Banker, R., I. Bardhan, and O. Asdemir. 2006. Understanding the impact of collaboration software on product design and development. Information Systems Research 17 (4): 352–73.
Barczak, G., F. Sultan, and E. Hultink. 2007. Determinants of IT usage and new product performance. Journal of Product Innovation Management 24 (6): 600–13.
Barney, J. 1991. Firm resources and sustained competitive advantage.
Journal of Management 17 (1): 99–120.
Boutellier, R., O. Gassman, H. Macho, and M. Roux. 1998. Management of dispersed product development teams: The role of information technologies. R&D Management 28 (1): 13–25.
Carlile, P. R. 2002. A pragmatic view of knowledge and boundaries: Boundary objects in new product development. Organization Science 13 (4): 442–55.
Carlson, M. 2012. Powering the next generation. PDMA Visions 3: 27–29. Cooper, R. G. 2001. Winning at new products.
New York: Perseus
Publishing.
Cooper, R. G. 2006. Formula for success. Marketing Management March/ April: 18–24.
Devaraj, S., and R. Kohli. 2003. Performance impacts of information technology: Is actual usage the missing link? Management Science 49 (3): 273–89.
Durmusoglu, S., R. J. Calantone, and V. Sambamurthy. 2006. Is more information technology better for new product development? Journal of Product & Brand Management 15 (7): 435–41.
Durmusoglu, S. S., and G. Barczak. 2011. The use of information technology tools in new product development phases: Analysis of effects on new product innovativeness, quality, and market performance. Industrial Marketing Management 40: 321–30.
Fixson, S. K., and T. J. Marion. 2012. Back-loading: A potential side effect of employing digital design tools in new product development. Journal of Product Innovation Management 29: 140–56.
Grant, R. M. 1996. Toward a knowledge-based theory of the firm. Strategic Management Journal 17 (Winter Special Issue): 109–22.
Griffin, A. 1997. The effect of project and process characteristics on product development cycle time. Journal of Marketing Research 34 (1): 24–35.
Hines, W., C. Montgomery, D. Goldman, and C. Borror. 2003. Probability and statistics in engineering (4th ed.). Hoboken, NJ: John Wiley & Sons, Inc.

Jaworski, B. J., and A. K. Kohli. 1993. Market orientation: Antecedents and consequences. The Journal of Marketing 57 (3): 53–70.
Kahn, K. B. 1996. Interdepartmental integration: A definition with implications for product development performance. Journal of Product Innovation Management 13 (2): 137–51.
Kaplan, A., and M. Haenlein. 2010. Users of the world unite! The challenges and opportunities of social media. Business Horizons 53: 59–68.
Kenly, A., and B. Poston. 2010. Social media and product innovation. Kalypso White Paper. Available at: www.kalypso.com. Accessed July 29, 2013.
Kester, L., A. Griffin, E. J. Hultink, and K. Lauche. 2011. Exploring portfolio decision-making processes. Journal of Product Innovation Management 28 (5): 641–61.
Kiron, D., D. Palmer, A. H. Phillips, and N. Kruschwitz. 2012. What managers really think about social business. Sloan Management Review 53 (4): 51–60.
Kogut, B., and U. Zander. 1992. Knowledge of the firm, combinative capabilities and the replication of technology. Organization Science 3 (3): 383–97.
Kohli, R., and V. Grover. 2008. Business value of IT: An essay on expanding research directions to keep up with the times. Journal of the Association for Information Systems 9 (1): 23–39.
Krishnan, V., and K. Ulrich. 2001. Product development decisions: A review of the literature. Management Science 47 (1): 1–21.
Langerak, F. 2003. An appraisal of research on the predictive power of market orientation. European Management Journal 21 (4): 447–64.
Larson, E. W., and D. H. Gobeli. 1989. Significance of project management structure on development success. IEEE Transactions on Engineering Management 36 (2): 119–25.
McGrath, M., and M. Iansiti. 1998. Envisioning IT-enabled product development. PRTM Insight Magazine (Fall–Winter): 1–12.
Malhotra, A., and A. Majchrzak. 2004. Enabling knowledge creation in far-flung teams: Best practices for IT support and knowledge sharing. Journal of Knowledge Management 8 (4): 75–89.
Marion, T. J., S. K. Fixson, and M. H. Meyer. 2012. The problem with digital design. Sloan Management Review 53 (4): 63–68.
Markham, S., and H. Lee. 2012. Winning at NPD: Success drivers from the 2012 CPAS study. Presentation at the 2012 Product Innovation Management Conference, Orlando, FL.
Meredith, J. R., and S. J. Mantel. 2006. Project management: A managerial approach (6th ed.). Hoboken, NJ: John Wiley & Sons, Inc.
Meyer, M. H., and J. Utterback. 1993. The product family and the dynamics of core capability. Sloan Management Review 34 (3): 39–47.
Meyer, M. H., and M. H. Zack. 1996. The design of information products.
Sloan Management Review 37 (3): 43–59.
Nakata, C., and S. Im. 2010. Spurring cross-functional integration for higher new product performance: A group effectiveness perspective. Journal of Product Innovation Management 27: 554–71.
Nonaka, I. 1994. A dynamic theory of organizational knowledge creation.
Organization Science 5 (1): 14–37.
Nonaka, I., and H. Takeuchi. 1995. The knowledge creating company: How Japanese companies create the dynamics of innovation. New York: Oxford University Press.
Ozer, M. 2000. Information technology and new product development.
Industrial Marketing Management 29 (5): 387–96.
Ozer, M. 2003. Process implications of the use of the internet in new product development: A conceptual analysis. Industrial Marketing Management 32 (6): 517–30.
Pavlou, P., and O. El Sawy. 2006. From IT leveraging competence to competitive advantage in turbulent environments: The case of new product development. Information Systems Research 17 (3): 198–227.
Perks, H., R. Cooper, and C. Jones. 2005. Characterizing the role of design in new product development: An empirically derived taxonomy. Journal of Product Innovation Management 22: 111–27.
Roberts, D., and M. Candi. 2012. Using social media as part of product launch. Proceedings of the 2012 PDMA Research Forum.
Ross, J. W., C. M. Beath, and D. L. Goodhue. 1996. Develop long-term competitiveness through IT assets. Sloan Management Review 38 (1): 31–42.
Rumelt, R. P. 1987. Theory, strategy and entrepreneurship. In The competitive challenge, ed. D. Teece, 137–58. Cambridge,

MA: Ballinger.
Schrage, M. 1990. Shared minds: The new technologies of collaboration.
New York: Random House.
Song, M. X., H. Berends, H. Van der Bij, and M. Weggemen. 2007. The effect of IT and co-location on knowledge dissemination. Journal of Product Innovation Management 24 (1): 52–68.
Souder, W. E. 1977. Effectiveness of nominal and interacting group decision processes for integrating R&D and marketing. Management Science 23 (6): 595–605.
Souder, W. E. 1987. Managing new product innovations. Lexington, MA: Lexington Books.
Spender, J. C. 1996. Making knowledge the basis of a dynamic theory of the firm. Strategic Management Journal 17 (Special Issue): 45–62.
Sun, Y., A. Bhattacherjee, and Q. Ma. 2009. Extending technology usage to work settings: The role of perceived work compatibility in ERP implementation. Information and Management 46: 351–56.
Tatikonda, M. V., and S. R. Rosenthal. 2000. Technology novelty, project complexity, and product development project execution success: A deeper look at task uncertainty in product innovation. IEEE Transactions on Engineering Management 47 (1): 74–87.
Taylor, S., and P. Todd. 1995. Understanding information technology usage: A test of competing models. Information Systems Research 6 (2): 144–76.
Teo, T. S., and W. Y. Choo. 2001. Assessing the impact of using the internet for competitive intelligence. Information and Management 39 (1): 67–83.
Terwiesch, T., C. Loch, and A. E. Meyer. 2002. Exchanging preliminary information in concurrent engineering. Organization Science 13 (4): 402–19.
Thamhain, H. J., and D. L. Wilemon. 1975. Conflict management in project lifecycles. Sloan Management Review (Summer): 31–50.
Ulrich, K., and S. Eppinger. 2011. Product design and development (5th ed.). McGraw-Hill: Irwim.
Wade, M., and J. Hulland. 2004. The resource-based view and information systems research: Review, extension and suggestions for future research. MIS Quarterly 28 (1): 107–42.
Wernerfelt, B. 1984. A resource-based view of the firm. Strategic Management Journal 5 (2): 171–80.
Zack, M. 1999. Developing a knowledge strategy. California Management Review 41 (3): 125–45.