do social preferences increase productivity? field experimental
TRANSCRIPT

DO SOCIAL PREFERENCES INCREASE PRODUCTIVITY? FIELDEXPERIMENTAL EVIDENCE FROM FISHERMEN IN TOYAMA BAY
JEFFREY CARPENTER and ERIKA SEKI∗
In addition to showing that student measures of social preference, a concern foroutcomes achieved by other reference agents, are quite different from those obtainedin the field with participants who face social dilemmas in their daily lives, we find linksbetween the social preferences of our field participants and their productivity at work.We also find that the field stock of social preferences evolves endogenously with respectto how widely team production is utilized. Because the link between productivity andsocial preference is strong, we provide a reason for the wider economics profession totake notice of social preferences. (JEL C93, D21, D24, H41, J24, M52, Z13)
I. INTRODUCTION
Laboratory experiments in economics haveprovided overwhelming evidence that manystudent participants exhibit social preferences:they care about the outcomes achieved by ref-erence agents in addition to their own out-comes. These preferences include conditionalcooperation (Fischbacher, Gaechter, and Fehr2001) and the propensity to punish free rid-ers (Fehr and Gaechter 2000) and have beenshown to transform various social dilemmaslike team production into coordination prob-lems in which participants often achieve Paretoefficient outcomes. However, the laboratorydata suffer two shortcomings. One problemthat has resulted in many recent field exper-iments, is that it is hard to know how wellstudent responses in the lab generalize to otherimportant populations—the representativenessproblem. A second related problem is thatexperimentalists have provided little reason forother economists to care about social pref-erences—the external validity problem.1 That
*The authors thank Kiyoshi Yokoo for research assis-tance and the National Science Foundation (CAREER0092953) for financial support.Carpenter: Associate Professor, Department of Economics,
Middlebury College, 601 Warner Hall, Middlebury, VT05753. Phone 802-443-3241, Fax 802-443-2185, [email protected]
Seki: Lecturer, Department of Economics, University ofAberdeen, S64 Edward Wright Building, Dunbar Street,Old Aberdeen, Scotland AB24 3QY. Phone 01224273134, Fax 01224 272181, E-mail [email protected]
1. Noteworthy exceptions include Frey and Meier(2004) and Bandiera, Barankay, and Rasul (2005).
is, showing that non-students exhibit socialpreferences is not the same as showing thatsocial preferences have an impact on economicoutcomes.2 Until experiments establish directlinks in relevant populations between experi-mental measures of social preference and eco-nomic outcomes, these ideas will continue tohave limited impact.
Although there are a growing number offield experiments to examine how well theresults of student lab experiments generalize todifferent populations, there are very few exper-iments that (convincingly) link behavioral mea-sures from experiments to economic outcomes,and, to the best of our knowledge, none thataccomplish both goals. Harrison and List (2004)review the recent literature on economic fieldexperiments but are mostly silent on the topicof social preferences. In other specific experi-ments, Henrich (2000) showed that one wouldhave to travel to Amazonia to find partici-pants who look remotely like the self-interestedagent that much of traditional economic the-ory is built around and Cardenas, Stranlund,and Willis (2000) demonstrated how institutionscan crowd out social preferences for coopera-tion among rural farmers in Colombia. More
2. This idea overlaps with the Smith (1982) notion ofparallelism. Given this issue, Fehr and Fischbacher (2002),however, do provide convincing reasons why the professionshould take lab experiments with students seriously.
ABBREVIATIONSFCAs: Fishery Cooperative AssociationsVCM: Voluntary Contribution Mechanism
612
Economic Inquiry(ISSN 0095-2583)Vol. 49, No. 2, April 2011, 612–630
doi:10.1111/j.1465-7295.2009.00268.xOnline Early publication March 11, 2010© 2010 Western Economic Association International

CARPENTER & SEKI: DO SOCIAL PREFERENCES INCREASE PRODUCTIVITY? 613
recently, Henrich et al. (2001) extend the earlierexperiments to 15 different cultures; Carpenter,Burks, and Verhoogen (2005) show importantdifferences exist between blue collar workersand students in distribution experiments; andList (2004) finds similar differences using thevoluntary contribution mechanism.
With respect to the link between social pref-erences and economic outcomes, Karlan (2005)has shown that those participants who weremore trustworthy in an experiment were morelikely to repay their loans 1 yr later. Carterand Castillo (2002) conduct trust and distribu-tion games in South Africa and find that theirexperimental measures of altruism and trust arepositively associated with household expendi-tures. Cardenas and Carpenter (2005) conduct asimilar analysis of the links between experimen-tal measures of cooperation from public goodsgames played by urban slum dwellers in Viet-nam and Thailand and household expendituresand find that more cooperative players werebetter off in Thailand but not Vietnam. Lastly,and more relevant for our purposes, Barr andSerneels (2009) find that individual experimen-tal measures of trustworthiness are positivelyassociated with the wages of Ghanaian manu-facturing workers; however, any link to produc-tivity is only inferential.
The experiment that we report on in thispaper is unique because it addresses both short-comings simultaneously and therefore is the firstresearch to directly link standard social prefer-ences that have been identified in hundreds oflab experiments with topics that are at the coreof economic theory. To accomplish this goal,we conducted a series of experiments in ToyamaPrefecture, Japan. Our participants belonged toone of two groups; they were either local col-lege students or fishermen who catch shrimp inthe bay. The comparison of these two groupsprovides us with a link to the social preferenceliterature based on traditional lab experimentsand allows us to explore the representativenessof student social preferences. We also collectedproductivity data from our fishermen that allowus to examine whether social preferences, mea-sured with our experiment, have an impact onfishing productivity.
The fishermen we study are particularly wellsuited for this sort of research because theyengage in team production and they have orga-nized themselves into two distinct groups basedon whether or not they pool their catch at theend of the day. The first factor implies that these
fishermen face social dilemma incentives eachday at work and therefore may rely on socialpreferences to attenuate shirking. In other words,there is some reason to hypothesize that socialpreferences will affect the productivity of ourfishermen. The second factor (that some fisher-men pool their catch) implies that the incentivesfor the two groups of fishermen are different.Although each boat, pooler or not, must con-tend with shirking among the crew members,this problem is compounded for the poolersbecause each pooling boat also confronts theincentive to free ride on the fishing effort of theother boats. This suggests that social preferencesmight develop to a different degree aboard pool-ing boats and might have a differential effect ontheir productivity.
We discuss the details of fishing in ToyamaBay in the next section. In Section III, wedescribe our experiment. In Section IV, we sum-marize the demographic characteristics of ourparticipants and discuss the differences in over-all experimental behavior among students, pool-ers, and non-poolers. In Section V, we presentour methodology for constructing measures ofsocial preference from the experimental data. InSection VI, we ask whether the distributions ofsocial preference differ based on whether ourfishermen pool or not and whether these dif-ferences can be attributed to a treatment effectof pooling on fishermen preferences. In SectionVII, we present our main results that link socialpreferences to fishing productivity and we offera few concluding remarks in Section VIII.
II. SHIROEBI FISHING IN TOYAMA PREFECTURE
The fishermen we study are located inToyama Prefecture, on the west coast of theHonsyu (main) island of Japan. Toyama Bay,opening into the Sea of Japan, is known for alarge variety of highly valued fish species result-ing from the complex structure of the sea bottomand a mixture of warm and cold currents flowinginto the bay.
Coastal fisheries in Japan are managed byFishery Cooperative Associations (FCAs). LocalFCAs do not only implement and enforcenational and prefectural legislation, they alsodevise complementary regulations that aredesigned specifically to deal with evolving localconditions. Within each FCA, fishermen aregrouped according to the species they targetand/or the fishing technologies that they use.The fishermen that we study belong to the

614 ECONOMIC INQUIRY
ebi self-managing group that specializes inshrimp fishing.
The fishermen who catch shiroebi (Japaneseglass shrimp) in the bay near Shinminato areorganized into two groups. The members ofthe two groups live in Shinminato, belong to thesame local FCA, use the same harbor facilities,and operate in the same fishery. However, thereis one major difference between these groups:whether or not they pool their catch. Onegroup, consisting of 7 boats and 30 fishermen(7 skippers, 21 crew members, and 2 onshorehelpers) whom we call poolers, have sharedboth income and operating expenses since thebeginning of the 1960s.3 The second group,which we call the non-poolers, consists of 5fishing boats and 30 fishermen (5 skippers and25 crewmen). Members of this second group donot pool income or expenses.
According to the senior and retired fishermen,the pooling arrangement had originally comeabout as a response to various economic con-ditions that the fishermen were facing in the1960s. Since the motorization of fishing boatsin the early 1930s, competition among fishingunits for access to the shiroebi stock has becomea chronic problem. Many anecdotal stories tes-tify to heavy congestion in the most favorablefishing spots, over-extraction, and frequent inter-personal conflicts. During the early 1960s, theadoption of sophisticated and highly effectivetechnical equipment by an ever larger numberof competing fishermen led to more conflictsover the limited fishing spots. As a result, thecatch per unit of effort (i.e., the kilograms caughtper trip into the bay) started to decline and theproblem of net damage worsened because thenew synthetic materials made nets larger andmore prone to collision, entanglement, and seri-ous damage. If these problems were not enough,during the same period fishermen in ToyamaBay increasingly suffered from active collu-sion among the fish merchants and middlemen.Ample opportunities existed for the merchantsto force fishermen to sell their catch at the low-est possible prices. To protest and to increasetheir market power, the fishermen boycotted thetraders’ cartels in 1961 and pressured the FCA toorganize fish auctions with the hope of increas-ing merchant competition. This demand was metand resulted in the demise of the merchant cartel.
3. More specifically, poolers share both income andoperating expenses, but in terms of capital investments, onlythe costs of nets are borne by the whole group; boats andother equipment are individually financed.
It was immediately after the success of thiscollective protest that all the shiroebi fishermenin Shinminato adopted the pooling system thathas been maintained until now. For 30 yr, thepoolers were the only shiroebi fishers operatingin Shinminato. This arrangement ended with theentrance of the non-poolers in 1992. However,previous to 1992, the non-poolers fished a differ-ent type of shrimp during the shiroebi season. Infact, the average member of the two groups hasabout the same amount of shrimp fishing expe-rience. Since the mid-1980s, shiroebi fishinghas become more lucrative compared with theother types of shrimping because of the growingdemand for fresh products and advancementsin refrigerated transportation to the urban cen-ters. These events prompted the non-poolers torequest permission from the local FCA to beginfishing shiroebi. After 6 yr of negotiation withthe poolers under the auspices of the local FCA,an arrangement was settled on under which thenon-poolers were allowed to fish shiroebi onTuesdays, Thursdays, and Saturdays while thepoolers limited themselves to fishing on Mon-days, Wednesdays, and Fridays.
The pooling arrangement provides the firstgroup of fishermen with an incentive to shareinformation and fish cooperatively. Indeed, pool-ers exhibit more cooperation in terms of workcoordination, effort regulation, and the sharingof information and expertise (Platteau and Seki2001). Work coordination includes concertedsearches for stock, a set rotation for access tofishing spots, and collective net maintenance(including the search for lost nets). Collectiveeffort regulation prevents individual fishermenfrom unprofitable overproduction. In addition,sharing information and expertise among thepoolers enables them to take advantage of indi-vidual research on innovative fishing techniques.
It is important to note that the poolers’ coor-dination seems to yield productivity gains. Interms of their fishing effectiveness, poolers tendto catch more than non-poolers. This differencewas first recognized in Platteau and Seki (2001)and was confirmed almost 5 yr later during ourstay in Shinminato. We collected data on indi-vidual hauls from 115 trips into the bay. Ourestimation of the fishing production function dis-cussed in more detail in Section VII suggeststhat poolers typically catch 0.4 standard devia-tions more than non-poolers do and this differ-ence is significant at the 1% level.

CARPENTER & SEKI: DO SOCIAL PREFERENCES INCREASE PRODUCTIVITY? 615
Although we suspect that pooler teamwork atthe boat level accounts for much of the differ-ence in productivity, we also wondered whethersocial preferences could explain the differential.The poolers face different incentives: on the onehand poolers are provided with incentives tocooperate and avoid wasteful competition. Onthe other hand, however, pooling compoundsthe effort problems faced by all our fishermen:while each crew member on every boat has anincentive to shirk because they each receive afixed share of the revenue, each pooling boat asa unit has the further incentive to free ride offthe efforts of the other boats. It is not evidenta priori why the latter incentive effect does notdominate and this suggests that social prefer-ences may have evolved to deal with the strongincentives to free ride.
Our extensive interviews with skippers andcrewmen further provide the foundation forour social preference hypothesis. In these inter-views, the fishermen spoke freely about theirprofessional lives and their interactions withthe other fishermen. They expressed opinionsnot only regarding technical and environmen-tal aspects of their work but also regarding thesocial and economic aspects of their experienceswith pooling. As a matter of fact, a numberof statements made by the fishermen indicatethe emergence of interpersonal comparisons ofproductivity and social preferences for coopera-tive behavior among the poolers.4 With theseinterviews in mind, and informed by Bowles(1998), we hypothesized that cooperative socialpreferences (e.g., the propensities to cooperate,punish free riding, and respond prosocially topunishment) might evolve to a greater extenton the pooling boats and that these preferencesmight contribute to higher productivity perhapson their own or perhaps by laying the foundationfor the cooperative activities mentioned above.To test this hypothesis, we conducted a fieldexperiment to measure the social preferences ofthe fishermen.
4. A few of the statements purporting the emergence ofcooperative preferences include: “Because we pool landings,I always feel under pressure to having good catches”; “Itis out of the question to become lazy because we shareincome. On the contrary, income pooling prompts me towork more thoughtfully”; “Fishers with higher catches willbe indifferent about (i.e., will not disapprove of) those withlower catches. On the contrary, the former will help the latterto improve by teaching them where the better spots to fishare”; “We (poolers) have team spirit to perform better as awhole.” For a more detailed discussion of these interviewssee Platteau and Seki (2001).
III. OUR FIELD EXPERIMENTAL DESIGN
As we described in the previous section, ourfishermen rely on teamwork to catch shrimpand therefore may face the problem of shirk-ing. To increase the external validity of ourresults, and perhaps the saliency of the proto-col for our participants, we chose an experimentthat simulated the incentives that these partic-ipants face on their boats. This motivation ledus to use the experiment first discussed in Car-penter, Daniere, and Takahashi (2004a, 2004b)which combines a standard, hand-run, versionof the familiar repeated voluntary contributionmechanism (VCM) with a modification in whichparticipants can pay to show their disapproval ofthe contribution behavior of the other membersof the group. Because theorists have shown thatthis sort of disapproval and the resulting shamecan attenuate the incentive to shirk in teams(e.g., Kandel and Lazear 1992), we decided thatthe “social disapproval” game best suited ourpurposes. The game allowed us to gather dataon the willingness of team members to showtheir disapproval and their responsiveness to dis-played disapproval, in addition to the contribu-tion data that is typically collected in the VCM.
In our version of the social disapprovalexperiment, participants were divided into fourperson groups that maintained the same mem-bership for ten rounds. Each group member wasendowed with ten 50 yen coins and was askedto privately contribute as many coins as (s)hewanted to a public good. At the time we con-ducted the experiments (August and September,2003), the per-round endowment was equal to$4.30 which was a substantial sum for our par-ticipants.5 Once all the participants had madetheir contribution decisions, the total contribu-tion was calculated for each group, each grouptotal was doubled, and then the proceeds weredistributed equally to the group members. Thisimplies that the marginal per capita return fromthe public good was 0.5: each coin contributedwas doubled by the experimenters and thendivided four ways. Because the marginal returnto contributing a coin is lower than the payoffto keeping the coin, and this calculus does notdepend on the level of group contributions, thedominant strategy is to contribute nothing eventhough the team members double their moneywhen they all contribute fully.
5. In fact, the experiment typically lasted less than anhour and our participants earned $73.19, on average.
616 ECONOMIC INQUIRY
The first five rounds of the experiment repli-cated the VCM and then in the last five roundswe instituted the social disapproval protocol.When the first round began, the participantswere unaware of how the protocol would changeafter round 5. We chose this design feature sothat behavior in the first five rounds would notbe confounded by the anticipation of the rulechange. The first five rounds followed a hand-run protocol that is now standard in the literature(see Ledyard 1995 and the instructions for bothsegments that appear in Appendix A), but thesocial disapproval institution is an innovationthat is important to discuss in some detail.
During the social disapproval rounds, the firsthalf of the protocol proceeded exactly as in thestandard VCM. Participants decided how muchof their endowment to contribute and then wereinformed of the group total contribution (andshown the individual contributions in randomorder) and their payoff from the public good.After being shown the distribution of contribu-tions and the group total contribution, partici-pants were asked if they wanted to anonymouslysend a signal to the rest of the group. This signal,an unhappy face (which has a similar connota-tion in Japanese culture) cost 10 yen and wasdisplayed for everyone in the group to see at thebeginning of the next round. Therefore, at thebeginning of rounds 7 through 10, each groupmember saw between zero and four unhappyfaces that signaled the number of group mem-bers who were unhappy with the level of thepublic good or the distribution of individual con-tributions provided in the previous round.
Although the social disapproval protocolhas the flavor of the punishment experimentsdescribed in Fehr and Gaechter (2000) and Car-penter (2007), for example, it is substantiallydifferent because punishment carries no materialpenalty (a la Masclet et al. 2003) and it is notdirected at individuals (which would be hard toimplement by hand in the field for more than oneround).6 At the same time, the simplicity of the
6. There is an important difference between our socialdisapproval protocol and the Masclet et al. (2003) experi-ment. In Masclet et al., it was free to send signals whichimplies that there are many equilibria in which punishmentis a component. By imposing a cost, the social disapprovalprotocol assures that the only subgame perfect equilibriumof the underlying game is the same as in the VCM. Specif-ically, the cost associated with sending a signal motivatesparticipants to free ride off any disapproval done by theother group members and, as a result, no signals should besent. In addition, social disapproval imposes no monetarypenalty which implies egoistic participants should ignore it.
protocol is elegant because the stark incentivesmake it clear that there are no strategic reasonsto send a signal and if people do send signals(and respond to them) then we have particularlycompelling measures of social preference.
We conducted four sessions of the experimentwith 53 participants. To provide a link to thestandard experimental literature, 26 of theseparticipants were students recruited from nearbyuniversities.7 The two fishermen sessions (onefor the poolers and one for the non-poolers) tookplace in a large meeting room at the fishing coopand the two student sessions were conductedin a large conference room that we rentedat a local hotel. The procedures were singleblind anonymous and our participants made theirdecisions privately behind portable blinds thatwe constructed.8 At the beginning of each round,participants were given envelopes with ten 50yen coins inside. We decided to use endowmentsof real money to make the choices as salient aspossible. The first decision for each individualwas to transfer as many of the coins as hewanted from the small endowment envelope toa large opaque envelope. When everyone wasfinished, the experimenters collected the smallenvelopes and computed the distribution ofcontributions and the group total contributions.On slips of paper, the experimenters wrote, inrandom order, the individual contributions tothe public good, the group total contribution,and the individual payout from the public good.These slips were distributed to the participantsas feedback. Although the participants weremaking their decisions, the third experimenterentered the data into a laptop so that it wouldbe fast and easy to calculate each participant’sfinal payoff at the end of the experiment.9
Combined, these incentives suggest the dominant strategy isto free ride at both opportunities.
7. Neither 53 nor 26 is evenly divisible by four. Inthree cases, we did not want to turn away participantsfrom our limited subject pools because we did not haveenough people to form another group of four. Instead, werelied on the fact that participants could not know whothe other members of their group were and formed groupswith “shadow members.” These randomly chosen shadowmembers contributed to their own group but their behaviorwas also counted in another group to get the total up to fourpersons.
8. We owe a large debt of gratitude to our insightfulresearch assistant, Kiyoshi Yokoo who not only helped usstreamline our procedures but was also rock-solid during theexperiments.
9. The opportunity cost of fisherman time is extremelyhigh and therefore we settled on procedures that made theexperiment run as quickly as possible.

CARPENTER & SEKI: DO SOCIAL PREFERENCES INCREASE PRODUCTIVITY? 617
At the end of round 5, the experiment wasinterrupted and the social disapproval protocolwas explained. Participants made their contri-bution decisions and received feedback on thebehavior of their group as before, but then theywere given slips of paper on which they indi-cated whether they wanted to send a signal (ata cost of 10 yen) to the group or not. To displaythe signals, we stamped between zero and fourunhappy faces on the front of the smaller endow-ment envelopes at the beginning of the nextround. Therefore, at time t , each participant sawn signals that indicated that n members of thegroup were unhappy with how much the groupcontributed in period t − 1.
IV. A SUMMARY OF OUR PARTICIPANTS ANDTHEIR GROUP-LEVEL BEHAVIOR
After the experiment was completed andwhile we calculated the final payoffs, the par-ticipants completed a demographic and attitudi-nal survey. The top panel of Table 1 presentssummary statistics from this survey. We gath-ered information on family size, fishing expe-rience, two personality measures, two measuresof our fishermen’s attitudes toward each other,and a measure of the fishermen’s competitive-ness. Non-poolers come from significantly largerfamilies than poolers (pt = 0.02) but the meanfamily size of the fishermen, taken together, isnot significantly different from that of the stu-dents (pt = 0.56). Although the poolers havebeen fishing for shiroebi longer than the non-poolers, the average total fishing experience ofthe two groups is not significantly different(pt = 0.35).10
The cooperation scale is composed of fourstatements to which respondents either agreed,disagreed, or offered no response. The scale gen-erates a score between −4 and 4, and those par-ticipants with more cooperative predispositions(e.g., they believe cooperation and reciprocityare virtuous) have higher scores. The Rotterscore is based on the general scale first devel-oped in Rotter (1966) which was constructed tocapture individual differences in “locus of con-trol.” Individuals with an internal orientation,or locus of control, tend to believe that theycreate opportunities and that their own agencydetermines their fate. On the other hand, indi-viduals with an external orientation believe in
10. All the pt -values presented in our discussion ofsummary statistics come from two-tailed t-tests.
fate and that they are simply a small cog in somelarger machine. In our implementation, respon-dents with higher Rotter scores are more inter-nally oriented. The exact statements for eachpersonality scale appear in Appendix B. As weanticipated, poolers have more cooperative per-sonalities than non-poolers but the difference isonly marginally significant (pt = 0.08) and thestudents are neither more nor less cooperativelyoriented than the fishermen (pt = 0.23). Like-wise, although the poolers tend to be more inter-nally oriented than the non-poolers, we foundno significant pair-wise difference in locus ofcontrol when comparing poolers or non-poolers(pt = 0.14) or when comparing students andfishermen (pt = 0.54).
We also asked our fishermen about their con-versations with other fishermen. Respondentscould indicate an intimacy of discussion thatranged from rarely speaking to other fishermento an active exchange of opinions. Most fish-ermen responded that they had frequent activeexchanges with other fishermen and there wereno significant differences between poolers andnon-poolers (pt = 0.29). The second attitudinalquestion we asked the fishermen was how theyconsidered the other fishermen. They could cate-gorize other fishermen as competitors, strangers,friends, or like family. Here we do find highlysignificant differences that make sense. Mostpoolers consider other fishermen friends andmost non-poolers consider them competitors.The mean attitude is different at better than the1% level. Lastly, we were curious about howcompetitive the fishermen were toward eachother. Therefore, we asked them how interestedthey were in the productivity of the other boats.It was no surprise to find that both groups werevery interested and there was no significant dif-ference in their mean interest (pt = 0.38).
The lower panel of Table 1 lists summarystatistics from the experiment. Combining allten periods (i.e., ignoring the panel nature ofthe data for the moment), poolers do cooper-ate slightly more than non-poolers (pt = 0.10)and, taken together, the fishermen cooperatemuch more than the students (pt < 0.01). Forthat matter, pooled student reactions are signif-icantly different in each of the four compar-isons of experimental behavior at better thanthe 1% level indicating that there may beproblems generalizing from student behavior tofield behavior. Much of the difference in con-tributions between poolers and non-poolers isthe result of the social disapproval treatment.

618 ECONOMIC INQUIRY
TABLE 1Participant Summary Statistics
Pooler (N = 14) Non-pooler (N = 13) Student (N = 26)
Demographics, personality, and attitudesFamily size 3.78 (1.37) 5.61 (2.26) 4.92 (0.98)Fishing experience 21.86 (20.56) 28.15 (10.72) —Cooperation scale 1.07 (0.83) 0.38 (1.12) 0.38 (1.13)Rotter score 0.78 (1.62) −0.23 (1.88) 0.61 (2.02)Meet other fishermen (quality of
conversation)2.57 (0.65) 2.25 (0.87)
Consider other fishermen (−1: Competitor,0: Stranger, 1: Friend, 2: Family)
0.71 (0.99) −0.58 (0.79) —
Interest in other’s catch (0: None to 3:Much)
2.23 (0.44) 2.00 (0.82) —
BehaviorOverall contribution 5.14 (1.67) 4.59 (2.02) 3.15 (1.40)Pre-disapproval contribution 5.07 (1.74) 4.80 (2.24) 3.33 (1.71)Post-disapproval contribution 5.21 (2.11) 4.38 (1.94) 2.96 (1.57)Social disapproval 0.12 (0.19) 0.31 (0.34) 0.42 (0.98)
Note: Numbers inside the parentheses are the standard deviations.
A test of the pre-disapproval contributionsshows no significant difference (pt = 0.25), butthe post-disapproval contributions are highlysignificantly different (pt < 0.01) which sug-gests that poolers were more sensitive to socialdisapproval than non-poolers were. Concerningsocial disapproval, we find that our participantswere willing to pay to show their disapproval,despite there being no material incentive to doso. Students show more disapproval than fish-ermen (pt < 0.01) and non-poolers show disap-proval more frequently than poolers (pt = 0.02),but these differences are confounded by the factthat poolers contribute more than non-poolersand fishermen contribute more than students.
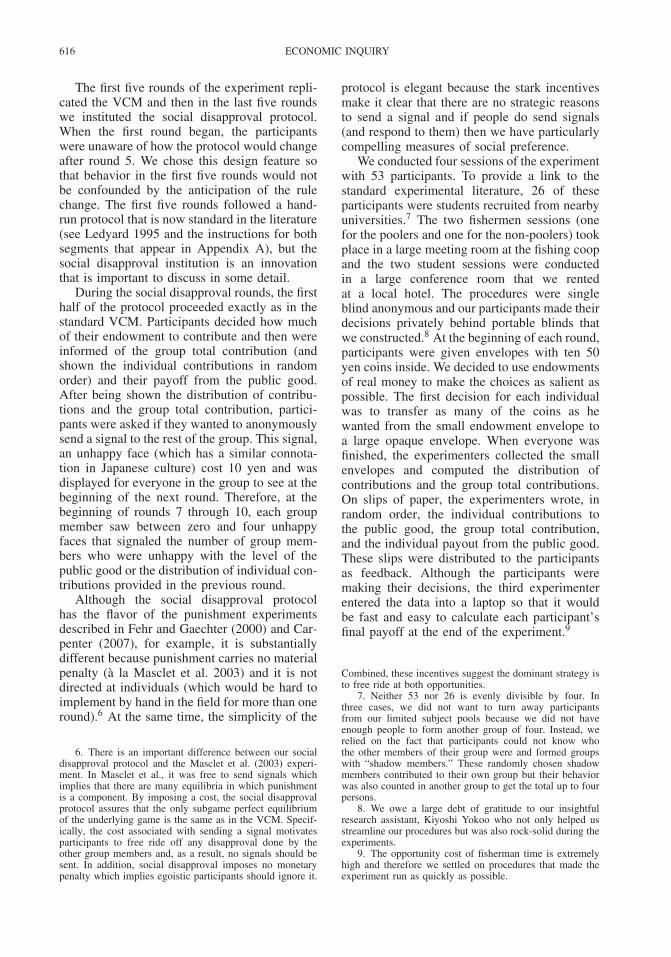
To give the reader a sense of the dynamicsof the experimental behavior, Figure 1 plots themean contribution by round in panel (A) and thefrequency of social disapproval in panel (B). Ashinted at Table 1, the contribution levels of thepoolers and non-poolers are similar for the firstfive periods but start to bifurcate after social dis-approval is instituted. Starting in round 7, poolercontribution levels begin to increase and inround 8 the non-pooler contribution levels dropdramatically. By comparison, the student con-tribution levels are relatively low but flat overthe course of the entire experiment; however,they do show a large endgame effect. We seethat the student frequency of disapproval fallsslightly over time, perhaps because it is obvi-ous that it is not having an effect. Initially, thenon-poolers frequency of disapproval increaseswith free riding, but then the non-poolers seem
to also give up in round 8. Meanwhile, the pool-ers disapprove steadily between 10% and 20%of the time.
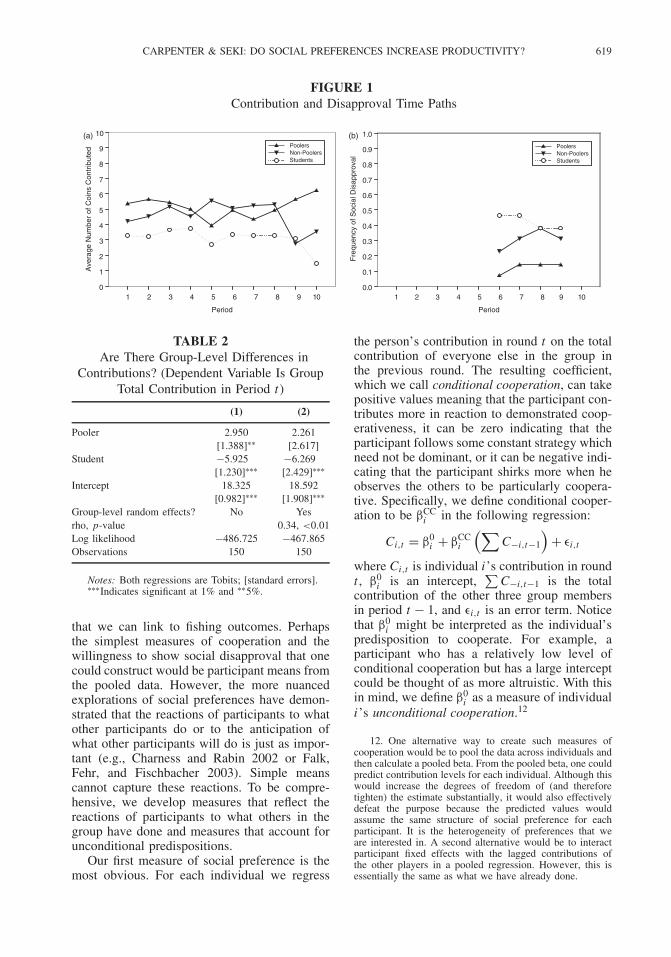
Table 2 provides a more structured test fordifferences in contributions at the group level.In column (1), we regress the group’s totalcontribution in round t on indicator variables forpooling and being a student and find evidence ofsignificant differences in both cases. However,column (1) does not account for the panel natureof the contributions data. In column (2), weadd group-level random effects which increasesthe standard error on the pooler point estimateto the point where the coefficient is no longersignificantly different from zero. Further, therandom effects account for 34% of the overallvariation in group contributions and the chi-squared test of whether the panel estimate isdifferent from the pooled estimate is significantat the 1% level. In summary, pooler groups donot robustly contribute more, but student groupsdo contribute 6.269 coins less than the omittedcategory, the fishermen who do not pool.11
V. CONSTRUCTING MEASURES OF SOCIALPREFERENCE
Our goal is to use the data from our experi-ment to construct measures of social preference
11. The differences we find between student behaviorand the behavior of non-students resemble other VCMresults discussed in List (2004) and Carpenter et al. (2004a)and echo the sentiment that student social preference resultsmay only provide a lower bound for the general population.
CARPENTER & SEKI: DO SOCIAL PREFERENCES INCREASE PRODUCTIVITY? 619
FIGURE 1Contribution and Disapproval Time Paths
1 2 3 4 5 6 7 8 9 10
Period
0
1
2
3
4
5
6
7
8
9
10
Ave
rage
Num
ber
of C
oins
Con
trib
uted
PoolersNon-PoolersStudents
1 2 3 4 5 6 7 8 9 10
Period
0.0
0.1
0.2
0.3
0.4
0.5
0.6
0.7
0.8
0.9
1.0
Fre
quen
cy o
f Soc
ial D
isap
prov
al
PoolersNon-PoolersStudents
(a) (b)
TABLE 2Are There Group-Level Differences in
Contributions? (Dependent Variable Is GroupTotal Contribution in Period t)
(1) (2)
Pooler 2.950 2.261[1.388]∗∗ [2.617]
Student −5.925 −6.269[1.230]∗∗∗ [2.429]∗∗∗
Intercept 18.325 18.592[0.982]∗∗∗ [1.908]∗∗∗
Group-level random effects? No Yesrho, p-value 0.34, <0.01Log likelihood −486.725 −467.865Observations 150 150
Notes: Both regressions are Tobits; [standard errors].∗∗∗Indicates significant at 1% and ∗∗5%.
that we can link to fishing outcomes. Perhapsthe simplest measures of cooperation and thewillingness to show social disapproval that onecould construct would be participant means fromthe pooled data. However, the more nuancedexplorations of social preferences have demon-strated that the reactions of participants to whatother participants do or to the anticipation ofwhat other participants will do is just as impor-tant (e.g., Charness and Rabin 2002 or Falk,Fehr, and Fischbacher 2003). Simple meanscannot capture these reactions. To be compre-hensive, we develop measures that reflect thereactions of participants to what others in thegroup have done and measures that account forunconditional predispositions.
Our first measure of social preference is themost obvious. For each individual we regress
the person’s contribution in round t on the totalcontribution of everyone else in the group inthe previous round. The resulting coefficient,which we call conditional cooperation, can takepositive values meaning that the participant con-tributes more in reaction to demonstrated coop-erativeness, it can be zero indicating that theparticipant follows some constant strategy whichneed not be dominant, or it can be negative indi-cating that the participant shirks more when heobserves the others to be particularly coopera-tive. Specifically, we define conditional cooper-ation to be βCC
i in the following regression:
Ci,t = β0i + βCC
i
(∑C−i,t−1
)+ εi,t
where Ci,t is individual i’s contribution in roundt , β0
i is an intercept,∑
C−i,t−1 is the totalcontribution of the other three group membersin period t − 1, and εi,t is an error term. Noticethat β0
i might be interpreted as the individual’spredisposition to cooperate. For example, aparticipant who has a relatively low level ofconditional cooperation but has a large interceptcould be thought of as more altruistic. With thisin mind, we define β0
i as a measure of individuali’s unconditional cooperation.12
12. One alternative way to create such measures ofcooperation would be to pool the data across individuals andthen calculate a pooled beta. From the pooled beta, one couldpredict contribution levels for each individual. Although thiswould increase the degrees of freedom of (and thereforetighten) the estimate substantially, it would also effectivelydefeat the purpose because the predicted values wouldassume the same structure of social preference for eachparticipant. It is the heterogeneity of preferences that weare interested in. A second alternative would be to interactparticipant fixed effects with the lagged contributions ofthe other players in a pooled regression. However, this isessentially the same as what we have already done.

620 ECONOMIC INQUIRY
The second measure of social preference thatwe consider is the propensity of each partici-pant to show disapproval of the amount that theother three group members kept for themselves.To construct this measure, we regress whetheror not participant i buys an unhappy face inround t on the total number of coins that therest of the group kept in round t . A positivecoefficient on the amount kept by the rest of thegroup indicates that participant i is more likelyto disapprove when the others keep more, azero coefficient indicates the participant does notcondition his disapproval on the allocation deci-sions of the others, and a negative coefficientindicates that the participant is less likely toshow disapproval when the amount kept is high.The resulting linear probability model takes thefollowing form:
Di,t = α0i + αPTD
i
(30 −
∑C−i,t
)+ δi,t
where Di,t is an indicator variable that takesthe value of 1 when participant i purchases anunhappy face, α0
i is an intercept, αPTDi is indi-
vidual i’s propensity to show disapproval, andthe last item is another error term.13
For our third measure of social preference,we redid our conditional cooperation regressionswith an additional regressor, the total numberof unhappy faces which the participant i sawin the previous round. We call the coefficienton the new regressor, participant i’s response todisapproval. This measure is interesting becauseparticipants can react pro- or anti-socially to col-lective shunning. A positive coefficient suggeststhat participant i contributes more when thegroup has been shunned and a negative coeffi-cient indicates that participant i reacts spitefullyto disapproval. To create our measures of i’sresponse to social disapproval, we ran the fol-lowing at the individual level:
Ci,t = b0i + bCC
i
(∑C−i,t−1
)
+βRTDi
(∑Di,t−1
)+ ui,t
where the first three terms replicate the condi-tional cooperation regression and βRTD
i is ourmeasure of i’s response to the total number
13. In this case, the intercept only really mattered whenan individual’s propensity to disapprove was zero whichindicated that the participant either never disapproved oralways disapproved. In the few cases, where the participantalways disapproved, we recoded the participant’s propensityas one.
of unhappy faces he saw at the beginningof the round,
∑Di,t−1.14 As with the condi-
tional cooperation measure, the intercept in theabove regression is informative and thereforewe call b0
i participant i’s unconditional coop-eration controlling for one’s reaction to disap-proval, which we abbreviate to i’s unconditionalresponse.
The five panels of Figure 2 illustrate thecumulative distributions (cdfs) of the five socialpreference measures. To foster comparisons, weinclude cdfs for poolers, non-poolers, and stu-dents. Beginning with conditional cooperationin panel (A), it appears that students and non-poolers are more conditionally cooperative thanpoolers, which presents a puzzle because weexpected the poolers to be more cooperative.The puzzle is “solved,” however, when oneconsiders the unconditional cooperation cdfsin panel (B). The poolers have higher levelsof unconditional cooperation than either non-poolers or students.
Panel (C) indicates that close to 40% ofeach population never showed disapproval, butconsidering only positive propensities to disap-prove, it appears that students are more likely todisapprove than non-poolers or poolers when therest of the group increases the amount of coinsthat they keep. Recall that we suggested that thedifferences in the frequency of disapproval illus-trated in panel (B) of Figure 1 could be due todifferences in contribution rates. It seems thatthis explanation is not the full story because thesame differences arise when we control for theamount of free riding in the group. Consider-ing only the negative propensities, we find thatapproximately 20% of students and non-poolersare actually more likely to show disapprovalwhen others contribute a lot. By contrast, fewerthan 10% of poolers engage in such behavior.
To a large extent we can use the social prefer-ence cdfs in Figure 2 to explain the contributiondynamics in Figure 1. One reason for the lowcontributions in the student groups (again, recallFigure 1) is that many of the students did notrespond prosocially to disapproval. As one cansee in panel (D) of Figure 2, more than half ofthe students had zero response to disapprovalcoefficients. The incidence of zeros is far lower
14. The reason we did not simply use the coefficient onthe lagged contributions of the other group members fromthis contribution regression (i.e., bCC
i ) as our measure ofconditional cooperation is that this regression does not utilizethe data from the first five rounds of the experiment.

CARPENTER & SEKI: DO SOCIAL PREFERENCES INCREASE PRODUCTIVITY? 621
FIGURE 2Cumulative Distribution of Social Preferences
among the fishermen. Only 10% of the pool-ers and 15% of the non-poolers do not respond.However, of more interest is the fact that mostof the poolers have positive response to punish-ment coefficients while 70% of the non-poolershave negative reactions to social disapproval.
This suggests that the reason that contributionsfall among non-poolers and rise among poolersis that non-poolers respond spitefully to socialdisapproval while poolers take it as a signalto contribute more. As is the case when onecompares panels (A) and (B), the constants in

622 ECONOMIC INQUIRY
the response to disapproval regressions (panel(E)) are mirror images of the coefficients on thelagged disapproval cdfs in panel (D).15
VI. IS THERE A TREATMENT EFFECT OF POOLINGON SOCIAL PREFERENCES?
Before addressing our main hypothesis thatsocial preferences can partially explain the vari-ation in fishing productivity, we will discussa related issue motivated by the discussion ofendogenous preferences in Bowles (1998): areany of the differences that we saw in the distri-butions of social preference due to exposure tothe pooling institution? Although the treatmenteffect of pooling on social preferences mightbe confounded by people differentially select-ing onto boats based on their social preferences,there are strong institutional factors that wouldminimize any selection effects. The poolers andtheir predecessors have been fishing for shi-roebi since the eighteenth century. The poolingarrangement, which was spurred by the victoryover the wholesalers, came about in the 1960sas a best response to the economic conditionsof fishing at the time. Specifically, the pool-ing arrangement allowed the fishermen to pricediscriminate among the buyers and thereforepooling arose as an economic choice of all thepeople fishing in the 1960s, rather than someprocess of differential selection into (or awayfrom) pooling by some due to their social pref-erences. Hence, there should be no differentialselection into pooling by the fishmen active inthe 1960s (many of whom are still active today).
We also do not have to worry about differ-ential selection onto non-pooling boats becausepooling is very uncommon and most fishermendo not have a choice of whether to pool ornot—they are forced to be non-poolers. Thismeans that we really only have to account forthe fishermen who entered the pooling groupsince the 1970s (i.e., those with less than 30yr of experience). As it turns out, simple non-parametric tests (specifically, Wilcoxon ranksum tests) indicate that there are no significantdifferences in the social preferences of theseeight fishermen when compared with the rest.In short, selection could only be an issue for afraction of our sample and these few fishermen
15. We do not report test statistics for differences inthe social preference cdfs. Controlled (parametric) tests areperformed in the next section and indicate that all thedifferences we discussed above are statistically significant.
who may have had a choice do not exhibit socialpreferences that are different from the rest of thegroup.16
Without much cause to worry about selection,we can take advantage of our survey to conducta very straightforward test for treatment effects.Specifically, if social preferences are acquired(or maintained) differentially on pooling boatsthan on non-pooling boats, then we should seea correlation between years of experience withpooling and the levels of social preference.
Table 3 reports the results of our treatmentanalysis for each of the five social preferencemeasures. Because the scales of the social pref-erence measures vary so much we report stan-dardized regression coefficients. 17 Overall, wesee that controlling for experience, whether ornot the individual is a boat skipper, our two per-sonality measures which should further assuagereaders concerned with selection, and our twomeasures of associations, there are significantdifferences in the levels of social preferencebetween poolers and non-poolers. As hinted atFigure 2, poolers are less conditionally coopera-tive (p < .05), but more unconditionally cooper-ative (p < .05); poolers have lower propensitiesto punish (p < .001), respond significantly moreprosocially to social disapproval (p < .10), andhave lower unconditional responses to disap-proval (p < .05).
We also find that experience is correlatedwith three of the five social preference mea-sures. The baseline effect of experience is toreduce conditional cooperation, increase uncon-ditional cooperation, and reduce one’s propen-sity to show disapproval, but experience doesnot appear to affect one’s reaction to socialdisapproval. In general, two of the reactivemeasures of social preference, conditional coop-eration and the propensity to disapprove, seem todecay with experience. At the same time, how-ever, we also find significant treatment effectsof pooling that counteract the overall decay ofthese two reactive measures of social prefer-ence. The differential effect of pooling on con-ditional cooperation is positive (p < .05), the
16. Most importantly, the possibility of selection willnot undermine our main results in the next section. Regard-less of whether selection has some small role or no role atall in the distribution of preferences by boat type, it is stillthe case that there is a strong link between productivity andsocial preference.
17. That is, the interpretation of the coefficients inTable 3 (and Table 4) is the number of standard deviationsthat the dependent variable changes when the independentvariable increases by one standard deviation.

CARPENTER & SEKI: DO SOCIAL PREFERENCES INCREASE PRODUCTIVITY? 623
TABLE 3The Effect of Experience on Social Preference
ConditionalCooperation
UnconditionalCooperation
Propensity toDisapprove
Response toDisapproval
UnconditionalResponse
Pooler −1.169 1.086 −1.862 1.323 −1.260[0.483]∗∗ [0.460]∗∗ [0.446]∗∗∗ [0.653]∗ [0.598]∗∗
Fishing experience −1.416 1.437 −2.209 1.268 −0.798[0.577]∗∗ [0.549]∗∗ [0.533]∗∗∗ [0.780] [0.712]
Pooler × experience 1.306 −1.270 2.172 −0.971 0.883[0.608]∗∗ [0.579]∗∗ [0.562]∗∗∗ [0.822] [0.752]
Skipper 0.571 −0.482 0.860 −0.551 0.259[0.214]∗∗ [0.204]∗∗ [0.198]∗∗∗ [0.290]∗ [0.265]
Rotter score −0.388 0.204 0.585 −0.303 0.672[0.190]∗ [0.181] [0.176]∗∗∗ [0.257] [0.235]∗∗∗
Cooperation scale 0.007 0.001 −0.072 0.080 0.038[0.167] [0.159] [0.154] [0.226] [0.207]
Consider fishermen −0.068 0.226 −0.127 −0.293 0.188[0.183] [0.174] [0.169] [0.247] [0.226]
Meet fishermen 0.090 −0.100 −0.614 0.011 0.135[0.183] [0.175] [0.169]∗∗∗ [0.248] [0.227]
Adjusted R2 0.42 0.32 0.57 0.03 0.28Observations 25 25 25 25 25
Notes: All regressions are OLS; Standardized regression coefficients reported; [standard errors].∗∗∗Indicates significant at 1%, ∗∗5%, and ∗10%.
effect on unconditional cooperation is negative(p < .05), the effect on the propensity to disap-prove is positive (p < .01), and the coefficientson these interactions almost completely counter-act the baseline effects. In other words, we haveuncovered evidence that social preferences areendogenous: the pooling institution attenuatesthe natural erosion of two of our three reactivemeasures of social preference.
There are two other interesting facts that arisefrom our examination of treatment effects. First,we find that boat skippers are different in inter-esting ways. Skippers are more conditionallycooperative (0.57 SD more than crew members),less unconditionally cooperative (0.48 SD less),show higher propensities to disapprove (0.86 SDhigher), and are less responsive to disapproval(0.55 SD less). In other words, boat captainsare more willing to cooperate when their crewdoes, are not hesitant to inform the crew thatfree riding will not be tolerated, but react morespitefully when they are publicly shamed.
The second ancillary finding uncovered inTable 3 is that the Rotter score is correlated withour social preference measures. Those fisher-men who are most internally oriented are lessconditionally cooperative, have higher propen-sities to disapprove, and are more uncondi-tionally responsive to social disapproval. These
correlations will become more useful in ouranalysis of fishing productivity.
VII. DO SOCIAL PREFERENCES BELONG IN THEPRODUCTION FUNCTION?
In this section, we examine the links betweensocial preferences and fishing productivity. First,we seek to make a general methodological pointby demonstrating that social preferences have adirect effect on worker productivity. This con-nection will provide a link between the exten-sive laboratory literature on social preferencesand the economic mainstream. Our second, moremodest, goal is to test if the productivity gainsaccruing to poolers are due partially to the dif-ferential effect of social preferences on the workeffort of pooling fishermen.
As mentioned briefly in Section II, we gath-ered haul data from 115 trips into the bay bythe 12 boats in the two groups. There is consid-erable variation in the amount of shiroebi thatboats return to harbor with. For example, wewitnessed eight instances where the boats caughtnothing. Overall however, the mean catch perunit effort is 89.94 kg with a standard deviationof 75.54 kg.
We estimated a series of fishing produc-tion functions and report the results in Table 4.

624 ECONOMIC INQUIRY
TA
BL
E4
The
Det
erm
inan
tsof
Fish
ing
Prod
uctiv
ity(D
epen
dent
Var
iabl
eIs
Stan
dard
ized
Num
ber
ofK
ilogr
ams
Cau
ght
Per
Tri
pin
toth
eB
ay)
(1)
(2)
(3)
(4)
(5)
(6)
(7)
Pro
duct
ion
Fun
ctio
nP
rodu
ctio
nF
unct
ion
and
Soci
alP
refe
renc
esP
rodu
ctio
nF
unct
ion
and
Inst
rum
ente
dSo
cial
Pre
fere
nces
Skip
per’
sex
peri
ence
(yea
rsas
skip
per)
0.97
32.
390
2.14
71.
663
2.85
52.
990
1.89
5[0
.438
]∗∗[0
.632
]∗∗∗
[0.5
72]∗∗
∗[0
.800
]∗∗[0
.691
]∗∗∗
[0.9
87]∗∗
∗[0
.695
]∗∗∗
Skip
per
expe
rien
ce2
−0.8
30−1
.931
−1.5
77−1
.391
−2.2
41−2
.339
−1.6
06[0
.455
]∗[0
.549
]∗∗∗
[0.4
83]∗
∗∗[0
.748
]∗[0
.588
]∗∗∗
[0.8
21]∗
∗∗[0
.658
]∗∗
Cre
wex
peri
ence
(boa
tm
ean)
0.13
80.
252
−0.2
850.
370
−0.2
81−0
.347
0.31
9[0
.119
][0
.228
][0
.241
][0
.253
][0
.372
][0
.266
][0
.205
]+B
oat
hors
epo
wer
0.38
41.
100
0.47
30.
566
0.98
60.
602
0.55
7[0
.144
]∗∗∗
[0.2
78]∗∗
∗[0
.162
]∗∗∗
[0.1
60]∗∗
∗[0
.268
]∗∗∗
[0.2
11]∗∗
∗[0
.161
]∗∗∗
Pool
reve
nues
0.40
40.
403
0.25
80.
366
−0.5
100.
225
0.39
5[0
.151
]∗∗∗
[0.4
19]
[0.2
09]
[0.2
38]
[0.7
32]
[0.2
24]
[0.2
36]∗
Con
diti
onal
coop
erat
ion
(boa
tm
ean)
0.62
50.
676
[0.2
92]∗
∗[0
.265
]∗∗∗
Unc
ondi
tion
alco
oper
atio
n(b
oat
mea
n)0.
172
0.38
3[0
.289
][0
.248
]+Pr
open
sity
todi
sapp
rove
(boa
tm
ean)
0.34
00.
359
[0.1
07]∗
∗∗[0
.117
]∗∗∗
Res
pons
eto
soci
aldi
sapp
rova
l(b
oat
mea
n)−0
.276
−0.2
94[0
.154
]∗[0
.151
]∗∗
Unc
ondi
tion
alre
spon
se(b
oat
mea
n)−2
.207
−2.1
27[0
.935
]∗∗[0
.921
]∗∗Po
ol×
cond
itio
nal
coop
erat
ion
0.56
90.
819
[0.3
50]+
[0.4
45]∗
Pool
×un
cond
itio
nal
coop
erat
ion
0.81
81.
623
[0.5
17]+
[0.8
19]∗
∗Po
ol×
prop
ensi
tyto
disa
ppro
val
0.43
50.
685
[0.2
42]∗
[0.3
78]∗
Pool
×re
spon
seto
disa
ppro
val
0.25
50.
329
[0.2
15]
[0.1
82]∗
Pool
×un
cond
itio
nal
resp
onse
todi
sapp
rova
l1.
870
1.84
0[0
.918
]∗∗
[0.8
83]∗
∗In
clud
esfis
hing
wee
kfix
edef
fect
s:Y
esY
esY
esY
esY
esY
esY
esL
ogli
keli
hood
−157
.342
−149
.359
−150
.860
−149
.882
−149
.285
−140
.955
−149
.963
Hau
sman
test
p-v
alue
0.01
0.49
0.05
Obs
erva
tion
s11
511
511
511
511
511
511
5
Not
es:
Stan
dard
ized
regr
essi
onco
effic
ient
sre
port
ed;
all
regr
essi
ons
are
Tobi
ts.
∗∗∗ I
ndic
ates
sign
ifica
ntat
1%,
∗∗5%
,∗ 1
0%,
and
+ 15%
.

CARPENTER & SEKI: DO SOCIAL PREFERENCES INCREASE PRODUCTIVITY? 625
Included in our estimates are all the importantfactors of production (informed by our discus-sion with skippers and our experience aboarda number of the boats) that actually vary sig-nificantly between poolers and non-poolers.18
First, we include the boat skipper’s years ofexperience as a skipper. It takes many years tolearn the seabed, where the best fishing spotsare (something that can vary by season), andhow best to manage your crew. Therefore, weanticipated that boats with skippers who haveconsiderable experience would be more produc-tive. At the same time, young skippers may bemore amenable to, and adept at, taking advan-tage of new technologies, even though they maynot be as skilled in the basics as the older skip-pers. With both of these rationales in mind, wehypothesized that the effect of the Skipper’sExperience might be concave which caused usto include Skipper Experience2. For the samereasons, we expected that the average experienceof the crew would matter.19 The horse power ofthe boat’s engine is important because it deter-mines the size of the net that can be used, thespeed of trawling, the extent of the search, andthe speed back to port. To capture the structuralfactors that may make poolers more produc-tive, we included the indicator variable, PoolRevenues.
All our estimates utilize the Tobit estimatorbecause some boats return to port without anyfish. Since our social preferences are measuredon such different scales (see Figure 2), we reportstandardized regression coefficients throughoutto make our point estimates more comparable.To control for unmodeled weather or demandfactors, we included fishing week fixed effectsin each regression.20 We also explored includingboat random effects but did not add thembecause the panel variance component in thebasic production function was not important(i.e., 5% of the total).
18. For example, both poolers and non-poolers use thesame sort of net and therefore this factor is controlled fornaturally.
19. This intuition did not seem to be correct, as one cansee from Table 4, the coefficient on mean crew experienceis significantly different from zero only once and when wetried the squared term it added nothing to the analysis.
20. We cannot use fishing day fixed effects becausepoolers and non-poolers alternate fishing days and thereforethe fixed effects would be perfectly correlated with ourpooling indicator variable. We also cannot use boat fixedeffects because our vector of controls does not change overthe period of observation and therefore boat fixed effectswould be highly correlated with these unchanging boatcharacteristics.
As one can see from column (1) of Table 4,fishing productivity does appearto be concave inskipper experience (p < .05 for the linear termand p < .10 for the squared term). In fact, usingthe non-standardized coefficients, our estimatesuggests that skippers with 36 yr of experienceare the most productive captains. The mean crewexperience, on the other hand, does not seem tomatter significantly, although the coefficient ispositive.21 As expected, the horse power of theboat is positively associated with the amountof fish caught (p < .01). Finally, controllingfor all the other important factors of produc-tion, we see that poolers tend to catch 0.404standard deviations (or 30 kg) more than non-poolers (p < .01).
In columns (2) through (4), we add the boatmean values of our social preferences to thebasic production function. We add our reactivemeasures one at a time since they are highlycorrelated with each other. We also add ourtwo unconditional measures at the same time astheir respective reactive measures because weare interested in whether the reactive measurespredict when we control for unconditional pre-dispositions. Overall, we see that adding socialpreferences improves the estimates (i.e., the loglikelihoods are noticeably higher), the directeffect of each social preference on productivityis significant, and the interactions of social pref-erence and pooling soak up some of the variancein productivity that had been attributed to thepooling indicator variable in column (1). Thislast fact suggests that part of the reason pool-ing boats are more productive is because socialpreferences matter.
More specifically, in column (2) we see thatthe baseline effect of conditional cooperationon all boats is associated with a 0.625 standarddeviation increase in productivity (p < .01) anda further 0.569 standard deviation increase forpoolers (p = .12); however, the interaction termis not significant at conventional levels. At thesame time, unconditional cooperation does notappear to be robustly related to productivityeven though the interaction term is large andclose to being significant. It is also interest-ing that the pooling indicator variable is nolonger significantly different from zero althoughthe point estimate has not changed. This sug-gests that the differential effect of conditional
21. We also tried using the standard deviation of thecrew experience, but it did not predict any better.

626 ECONOMIC INQUIRY
cooperation partially explains why poolers aremore productive.
The results listed in column (3) indicate thatthe propensity to show disapproval when theothers shirk is associated with a 0.340 standarddeviation increase in productivity (p < .01) anda further increase of 0.435 standard deviationsthat accrues only to poolers (p < .10). In thiscase, the addition of social preference causes thepooling indicator to lose both significance andmagnitude. This is further evidence that socialpreferences matter in general, and in particularfor poolers.
The baseline effect of one’s response to socialdisapproval (column (4)) is actually negativeindicating that those boats with participants whoresponded more prosocially to disapproval actu-ally produce less (p < .10). However, this resultmust be tempered by the fact that the poolinginteraction coefficient is positive and of the samemagnitude indicating that the effect is attenu-ated for poolers. The results are very similarfor one’s unconditional response to disapproval.Further, the pooling indicator again loses signif-icance and shrinks somewhat.
The results in columns (1) through (4) arevery encouraging, but how robust are they?For example what if we do not assume thatsocial preferences are exogenous. In the previ-ous section, we argued that social preferenceschange as the fishermen gain both general expe-rience and specific experience with pooling. Ittherefore cannot be too hard to think of scenar-ios in which there is feedback, for example, fromproductivity to social preference. In columns(5) through (7), we control for this possibil-ity by instrumenting for our social preferencemeasures.
Luckily our survey provided us with a num-ber of variables that are highly correlated withsocial preference but should be exogenous withrespect to productivity. One measure, high-lighted in the previous section, is the Rotterscore. The Rotter score (or its components) is(are) highly correlated with all our social pref-erence measures (although it only shows up sig-nificantly in three of the regressions in Table 3)and therefore it must also be correlated with pro-ductivity. However, many previous studies havefound no link between locus of control and pro-ductivity (e.g., Blau 1993; Guion and Gibson1965; Hollenbeck and Whitener 1988; Johnson,Luthans, and Hennessey 1984; Szilagyi, Sims,and Keller 1976). This suggests that the locus ofcontrol works through social preference in our
implementation.22 We also used other variableslisted in Table 1 such as family size as instru-ments. Most of these variables are not too hardto defend as instruments. For example, it is notobvious why family size would affect produc-tivity directly if one realizes that the fishermendo not actually consume any of the fish that theycatch nor is it clear that fishing productivity willhave a large effect on one’s family size, espe-cially for those unmarried crew members whostill live at home or those who have adoptedfishing in retirement.23
The instrumented production function esti-mates in columns (5) through (7) actually reflecta stronger case for the importance of socialpreferences. Now all the baseline effects ofsocial preference and all the pooling interac-tions effects are statistically significant. In col-umn (5), we see that conditional cooperationimproves efficiency overall, but poolers bene-fit 0.819 standard deviations more than non-poolers, and unconditional cooperation has asignificant positive effect on productivity, butonly for poolers. Column (6) is very simi-lar to column (3) in that it indicates that thepropensity to disapprove is associated with pro-ductivity gains, but now the differential effecton poolers has increased from 0.435 standarddeviations to 0.685 standard deviations. Fur-ther, in column (7), we see that the response todisapprove remains negatively associated withproductivity among non-poolers, but the newestimate of the coefficient on the pooling inter-action is significant and positive. In fact, thesum of the baseline and differential effects sug-gest that the response to punishment is, indeed,positively associated with productivity for thepoolers.
It is also important to note that each ofthe pooling indicator variables in regressions(5) through (7) lose statistical significance andmagnitude when the instrumented social pref-erence measures are included. Therefore, we
22. In addition, because the test–retest reliability of theRotter scale is relatively high we can assume this personalitymeasure is relatively stable.
23. An example of the first stage regressions should beillustrative. The instruments that we used for conditionalcooperation in column (5) of Table 4 were family size, theRotter score, and one of the Rotter responses: “I makedecisions and move on.” The raw correlations between theinstruments and conditional cooperation are high 0.54 (p <.01), −0.70 (p < .01), and −0.55 (p < .01), respectively,and the adjusted R2 on the first stage regression is 0.84.In most cases we used more instruments than endogenousvariables; however, in each case we failed to reject the nullhypothesis that the over-identifying restrictions were valid.

CARPENTER & SEKI: DO SOCIAL PREFERENCES INCREASE PRODUCTIVITY? 627
continue to see that the differential impact ofsocial preferences on the pooling boats accountsfor a substantial amount of their productiv-ity advantage. Lastly, in the bottom panel ofTable 4, we report the Hausman test p-valuesfrom the comparisons of the coefficients in theinstrumented and uninstrumented models. Thesep-values suggest that endogeneity might havebeen a problem in two of the three cases: con-ditional cooperation and the response to socialdisapproval.
VIII. CONCLUDING REMARKS
To summarize our results, we find that stu-dent behavior in our voluntary contributionexperiment is significantly less cooperative thanour second subject pool, fishermen who face thesort of social dilemma modeled by our experi-mental protocol in their daily work lives. Thissort of result—students being less pro-socialthan field participants—has become a “styl-ized fact” of the field experimental literature.Our second significant finding is that three ofour five experimental measures of social pref-erence (conditional and unconditional cooper-ation, and response to social disapproval) areendogenous to the adoption of a cooperativeinstitution, under which boats pool their fishingefforts. We find that pooling experience atten-uates a general decay of social preference thataffects all fishermen. Our third result is the mostimportant: we find that experimental measuresof social preference can be directly linked tofishing productivity. Those crews that exhibitgreater degrees of conditional cooperation andthe propensity to disapprove of shirking aremore productive. However, the baseline affectof being more responsive to the disapproval ofothers appears to be a drag on productivity.Lastly, we have found that social preferencescontribute significantly to explaining why pool-ing boats are more productive than their non-pooling competitors. The poolers catch more,not only because of institutionalized coopera-tive fishing techniques, they catch more becausetheir stock of social preferences has a differen-tial effect on their efforts.
Our results can also be viewed as one ofthe few clean tests of Rotemberg’s hypothesisthat altruism should evolve under team pro-duction and increase productivity (Rotemberg1994, p. 688). Recall our measure of uncondi-tional cooperation, β0
i , measures how much one
would contribute even if all the other partici-pants contributed zero. In the context of teamproduction, this is clearly the sort of altruismmodeled by Rotemberg. Indeed, Figure 2b andTable 3 (column 2) confirm this hypothesis. Ourpoolers, who are exposed to a second level ofteam production, are significantly more altruis-tic toward each other than the non-poolers are.Further, Table 4 indicates that the poolers aremore productive, largely because of their socialpreferences, including altruism.
Not only do our results jibe with the micro-foundations offered by Rotemberg (1994), wecan conjecture about the real mechanisms bywhich social preferences may affect productiv-ity on these boats. As we mentioned early on,pooling boats engage in a number of coopera-tive acts that non-poolers avoid. Pooling boatsoften fish in pairs, pooling captains share infor-mation, and members of pooling crews help eachother with maintenance. Shared maintenance isa good example of cooperation because nets, inparticular, are difficult and time consuming torepair. Without social preferences, these actionswould be hard to support because the fishermenhave the incentive to free ride. Together thisimplies that one plausible explanation for whyour poolers do better and why their productivityadvantage can be linked to the social preferenceswe elicited in the field lab is because the pro-social preferences acquired on the pooling boatsmay provide the foundation for productivity-enhancing actions like shared maintenance andpair-fishing.
Although simply finding a link betweensocial preferences and productivity goes a longway to bridging the gap between experimentsand the economics mainstream, it is also impor-tant to assess the magnitude of the social pref-erence effects. Recall that the mean catch perunit of effort among the fishermen is approxi-mately 90 kg. Poolers typically catch 0.4 stan-dard deviations, or 30 kg, more. The base lineeffect of a standard deviation increase in condi-tional cooperation is to increase the catch of allboats by 47 kg. However, the differential effectof conditional cooperation on poolers is an addi-tional 43 kg. Similar results for the other socialpreference measures can be calculated from thestandardized regression coefficients in Table 4.The point, however, is that social preferencesdo not only matter for the productivity of ourfishermen, they matter a lot.
628 ECONOMIC INQUIRY
APPENDIX A
Experiment Instructions (Back Translations from Japanese)
Thank you very much for participating in the experimenttoday. You will be asked to repeat the exercise ten times.After that we request that you fill out a brief questionnaire.
In the experiment, you will earn money. The amount youwill earn depends on the decisions you and everyone elsemake during the experiment. This experiment aims to studyindividual behavior when money is at stake, thus we willuse real money during the experiment. You will keep anymoney that you earn during the experiment.
Any decisions you make in the exercises or responsesyou give in the questionnaire will be strictly confidential. Wewill never tell anyone your responses or choices. To assureyour responses are confidential, we ask you to not speak toeach other until the entire experiment is completed.
Rules of the exercise:Please check if you have the following items in front of
you: A pencil, instructions (this paper), and a large brownenvelope.
The exercise will be repeated ten times but a new rulewill be applied for the last five rounds. We will explain thenew rule before the sixth round.
You are a member of a group of four people: there arethree other people in the group with you. You will all stayin the same group for each of the ten rounds.
To understand the exercise, imagine yourself in a situ-ation where you have to decide how to allocate resourcesintended for fishing. You may allocate your money to buynew fishing equipment or to build a lighthouse. If you buynew equipment, you will be able to increase your catch andincome. If a lighthouse is built, it will increase the safetyand seaworthiness of every boat regardless of whether theyallocate money for building the lighthouse or not.
In the exercise, you will be asked to decide how muchof your money to keep and how much to allocate toward agroup project.
At the beginning of each round, we will give you awhite envelope with ten 50 yen coins inside. Each person inthe group will then decide privately how many of these tencoins to allocate to the group project and how many to keepfor him- or herself. Everyone in the group benefits equallyfrom the money allocated to the group project, but only youbenefit from the money you keep. Please put the money youwould like to keep in the brown envelope and return the restthat you would like to allocate to the group project in thewhite envelope. We will collect the white envelope. Pleasekeep the brown envelope with you during the experiment.
When all four members of the group have decided howmany coins to allocate to the group project, we will add upall the money from the four group members. When we knowthe total, we will double it. Each person will then receive anequal share of the doubled amount. Each person also keepswhatever money he or she puts in the large brown envelope.
Here is an example to illustrate how the experimentworks. Each person decides how much to allocate to thegroup project privately, so you will not know what anyoneelse has decided when you make your choice. Suppose thatin the first round everyone in your group, including yourself,allocate all ten coins to the group project. In total there are10 + 10 + 10 + 10 = 40 coins in the group project.The group project will double this amount which makes thetotal 80 coins. Each of you then receives an equal share, thatis, 20 coins.
To continue the example, let us now suppose in thesecond round everyone in the group receives another tencoins at the beginning of the round. Imagine that this timeeveryone in the group contributes no money to the groupproject. In total there are 0 + 0 + 0 + 0 = 0 coin inthe group project. Because nobody contributes to the groupproject, nobody receives anything from the group project.Each person’s earnings for round 2 are just the ten coinsthat each person kept.
Let us continue the example for one more round. Nowsay that you allocate nothing to the group project and theother three people in the same group allocate everything tothe group project. The group project will receive a total of0 + 10 + 10 + 10 = 30 coins. We double this amountwhich makes the total of 60 coins. Each person receives anequal share of the 60 coins, that is, 15 coins from the groupproject.
In the round 3, you would earn a total of 25 coins (15from the group project plus the 10 you kept), while the othermembers will earn 15 coins from the project.
After each round, you will be provided with a report thatcontains all four members’ allocations to the group projectin random order, the total number of coins allocated to theproject, and your share of income from the group project.Please note that group members’ allocations are written inrandom order so that it is impossible to identify what anyindividual allocated to the project.
The above is only an example. You will play five roundsand each of you will decide, on your own, how to allocatethe ten coins that you receive at the beginning of each round.
Are there any questions about how the experiment willproceed?
Rules for exercise 2 (only to be handed out after exercise1 has been completed)
Exercise 2 is very similar to exercise 1, but there willbe one difference in the procedures.
The first part of each decision-making round will beexactly the same as exercise 1. There will be five decision-making rounds and you will each receive ten coins at thebeginning of each round. You will decide privately howmuch money to allocate to the group project and how muchto keep. When everyone in the group has made this decision,we will calculate the total contribution. We will then doublethe total contribution. Each person will receive an equalshare of the doubled amount.
The only difference between exercise 1 and exercise 2is that you will have the possibility to send a message to therest of your group. This is the message you can send:
show “unhappy face”
You will be asked to fill out an order form for an“unhappy face” after each round. We will collect the orderforms and count the number of “unhappy faces” ordered ineach group. At the beginning of the next round, the whiteenvelope that you receive will have as many unhappy facemarks as the total number of marks ordered by all yourgroup members.
Please note that ordering the “unhappy mark” will costyou 10 yen. When you see stamps on your envelope, youknow that some of the group members have spent 10yen each to let the rest of the group know that they areunhappy with the amount that was allocated to the groupproject. Anyone who decides to send this message will doso anonymously. Nobody will know who sent the messages.
Are there any questions about how the exercise willproceed?

CARPENTER & SEKI: DO SOCIAL PREFERENCES INCREASE PRODUCTIVITY? 629
APPENDIX B
Data Definitions
The Cooperation scale statements were: (1) “It is virtu-ous to compete”; (2) “It is virtuous to cooperate”; (3) “Onemust reciprocate kindness”; (4) “People should revengewrongs done to them.” One’s score increased by one foragreeing with 2 and 3 and for disagreeing with 1 and 4.One’s score decreased by one for agreeing with 1 and 4 anddisagreeing with 2 and 3.
The Rotter score statements were: (1) “I believe my suc-cess depends on ability rather than luck”; (2) “I dislike takingresponsibility for making decisions”; (3) “I make decisionsand move on”; (4) “I believe that unfortunate events occurbecause of bad luck”; (5) “I like to take responsibility formaking decisions”; and (6) “I tend to analyze situations toomuch and therefore miss opportunities.” Agreeing with state-ments 1, 3, and 5, and disagreeing with 2, 4, and 6 increasedone’s score by one point. Agreeing with statements 2, 4, and6, and disagreeing with 1, 3, and 5 reduced one’s score byone point.
Meet Other Fishermen is a Likert scale response to thequestion “What do you do when you meet your fellowfishers?” Responses to this question include: (1) “I oftenspeak about myself”; (2) “I tend to listen to them”; (3)“I actively exchange opinions with them”; and (4) “Irarely have conversations with them.” Scores of 03 wereassigned to the statements 4, 1, 2, and 3, respectively.
Consider Other Fishermen is a Likert scale response tothe question “How do you consider your fellow fishers?”Alternative responses to this questions were: (1) “I considermy fellow fishers as family members”; (2) “I consider themas friends”; (3) “I consider them as strangers”; and (4) “Iconsider them as competitors.” Scores of 2, 1, 0, and 1 wereassigned to the statements 1, 2, 3, and 4, respectively.
Interest in Other’s Catch is one’s responses to thequestion, “At the end of a fishing day, how keen are you toknow how much the other fishers catch?” The responses aremeasured on a Likert scale: scores of 3, 2, 1, and 0 wereassigned to the responses, “very much”; “a little”; “not verymuch”; “not at all,” respectively.
REFERENCES
Bandiera, O., I. Barankay, and I. Rasul. “Social Preferencesand the Response to Incentives: Evidence from Per-sonnel Data.” Quarterly Journal of Economics, 120(3),2005, 917–62.
Barr, A., and P. Serneels. “Reciprocity in the Workplace.”Experimental Economics, 12(1), 2009, 99–112.
Blau, G. “Testing the Relationship of Locus of Control toDifferent Performance Dimensions.” Journal of Occu-pational and Organizational Psychology, 66, 1993,125–38.
Bowles, S. “Endogenous Preferences: The Cultural Con-sequences of Markets and Other Economic Institu-tions.” Journal of Economic Literature, 36 March,1998, 75–111.
Cardenas, J. C., and J. Carpenter. “Three Themes on FieldExperiments and Economic Development,” in FieldExperiments in Economics, edited by J. Carpenter,J. List, and G. Harrison. Greenwich: JAI Press, 2005.
Cardenas, J. C., J. Stranlund, and C. Willis. “Local Envi-ronmental Control and Institutional Crowding-Out.”World Development, 28(10), 2000, 1719–33.
Carpenter, J. “Punishing Free-Riders: How Group SizeAffects Mutual Monitoring and the Provision of Public
Goods.” Games and Economic Behavior, 60(1), 2007,31–51.
Carpenter, J., S. Burks, and E. Verhoogen. “ComparingStudents to Workers: The Effects of Social Framing onBehavior in Distribution Games,” in Field Experimentsin Economics, edited by J. Carpenter, G. Harrison, andJ. List. Greenwich and London: JAI/Elsevier, 2005.
Carpenter, J., A. Daniere, and L. Takahashi. “Cooperation,Trust, and Social Capital in Southeast Asian UrbanSlums.” Journal of Economic Behavior and Organiza-tion, 55(4), 2004a, 533–51.
. “Social Capital and Trust in Southeast AsianCities.” Urban Studies, 41(4), 2004b, 853–74.
Carter, M., and M. Castillo. “The Economic Impacts ofAltruism, Trust and Reciprocity: An ExperimentalApproach to Social Capital,” in AAE Staff Papers,University of Wisconsin-Madison, 2002.
Charness, G., and M. Rabin. “Understanding Social Prefer-ences with Simple Tests.” Quarterly Journal of Eco-nomics, 117(3), 2002, 817–70.
Falk, A., E. Fehr, and U. Fischbacher. “On the Nature ofFair Behavior.” Economic Inquiry, 41(1), 2003, 20–26.
Fehr, E., and U. Fischbacher. “Why Social Preferences Mat-ter—The Impact of Non-Selfish Motives on Competi-tion, Cooperation and Incentives.” Economic Journal,112 March, 2002, 1–33.
Fehr, E., and S. Gaechter. “Cooperation and Punishmentin Public Goods Experiments.” American EconomicReview, 90(4), 2000, 980–94.
Fischbacher, U., S. Gaechter, and E. Fehr. “Are People Con-ditionally Cooperative? Evidence from a Public GoodsExperiment.” Economic Letters, 71, 2001, 397–404.
Frey, B. S., and S. Meier. “Social Comparisons and Pro-social Behavior: Testing ‘Conditional Cooperation’in a Field Experiment.” American Economic Review,94(5), 2004, 1717–22.
Guion, R., and W. Gibson. “Validity of Personality Mea-sures in Personnel Selection.” Personnel Psychology,18, 1965, 135–64.
Harrison, G., and J. List. “Field Experiments.” Journal ofEconomic Literature, 42 December, 2004, 1009–55.
Henrich, J. “Does Culture Matter in Economic Behavior?Ultimatum Game Bargaining Among the MachiguengaIndians of the Peruvian Amazon.” American EconomicReview, 90 September, 2000, 973–79.
Henrich, J., R. Boyd, S. Bowles, C. Camerer, E. Fehr,H. Gintis, and R. McElreath. “In Search of HomoEconomics: Behavioral Experiments in 15 Small-ScaleSocieties.” American Economic Review, 91(2), 2001,73–78.
Hollenbeck, J., and E. Whitener. “Reclaiming PersonalityTraits for Personnel Selection: Self-esteem as anIllustrative Case.” Journal of Management, 14, 1988,81–91.
Johnson, A., F. Luthans, and H. Hennessey. “The Roleof Locus of Control in Leader Influence Behavior.”Personnel Psychology, 37, 1984, 61–75.
Kandel, E., and E. Lazear. “Peer Pressure and Partnerships.”Journal of Political Economy, 100(4), 1992, 801–17.
Karlan, D. “Using Experimental Economics to MeasureSocial Capital and Predict Financial Decisions.”American Economic Review, 95(5), 2005, 1688–99.
Ledyard, J. “Public Goods: A Survey of ExperimentalResearch,” in The Handbook of Experimental Eco-nomics, edited by J. Kagel and A. Roth. Princeton:Princeton University Press, 1995.
List, J. “Young, Selfish and Male: Field Evidence of SocialPreferences.” The Economic Journal, 114 January,2004, 121–49.
Masclet, D., C. Noussair, S. Tucker, and M.-C. Villeval.“Monetary and Nonmonetary Punishment in the

630 ECONOMIC INQUIRY
Voluntary Contributions Mechanism.” AmericanEconomic Review, 93(1), 2003, 366–80.
Platteau, J.-P., and E. Seki. “Community Arrangementsto Overcome Market Failure: Pooling Groups inJapanese Fisheries,” in Communities and Marketin Economic Development, edited by M. Aoki andY. Hayami. Oxford: Oxford University Press, 2001,344–402.
Rotemberg, J. J. “Human Relations in the Workplace.”Journal of Political Economy, 102(4), 1994, 684–717.
Rotter, J. B. “Generalized Expectancies for Internal VersusExternal Control of Reinforcement.” PsychologicalMonographs; General and Applied, 80(1), 1966,1–28.
Smith, V. “Microeconomic Systems as an ExperimentalScience.” American Economic Review, 72(5), 1982,923–55.
Szilagyi, A., H. Sims, and R. Keller. “Role Dynamics,Locus of Control, and Employee Attitudes andBehaviors.” Academy of Management Journal, 19,1976, 259–76.