do the math program evaluation final - clear creek
TRANSCRIPT

Do the Math
Program Evaluation
2010-11 to 2014-15
Office of Assessment and Evaluation
Clear Creek Independent School District


Office of Assessment and Evaluation
Do the Math Program Evaluation
Presented to Board of Trustees on March 7, 2016
Ms. Rachel Powell
Signature Date
Dr. Robert Bayard:
Signature Date
Dr. Steven Ebell:
Signature Date
Dr. Gregory Smith:
Signature Date
2015-16 Board of Trustees Program Evaluation Team Laura DuPont, Ph.D., President Page Rander, Vice President Charles Pond, Secretary Win Weber, Member Ken Baliker, Member Ann Hammond, Member Jay Cunningham, Member Greg Smith, Ph.D., Superintendent
Steven Ebell, Ed.D., Deputy Superintendent, Curriculum & Instruction Rachel Powell, Elementary Math Coordinator, Curriculum & Instruction Laura Gaffey, Data Analyst, Assessment and Evaluation Pat McKenna, Data Analyst, Assessment and Evaluation Robert Bayard, Ed.D., Executive Director, Assessment and Evaluation


Do the Math Program Evaluation 2010-11 to 2014-15
Page | 2
Background Information on Do the Math
The purpose of evaluating programs in the Clear Creek Independent School District (CCISD) shall be multi-faceted and shall result in findings, recommendations, and/or conclusions that:
Ensure program alignment with the District strategic plan;
Assess strengths and weaknesses of the program;
Measure the success of the program in meeting its expressed goals; and/or
Result in improvements in, revisions to, or discontinuation of the program.
As part of CCISD’s program evaluation process, the Office of Assessment and Evaluation has completed a program evaluation for the Do the Math program encompassing the five year period from the 2010-11 school year through the 2014-15 school year. Although Do the Math is not designated as a program, it is a resource used for intervention and supplementary materials at the elementary level.
CCISD’s Strategic Plan includes the following seven strategies, and Do the Math aligns with each strategy as detailed below:
I. We will inspire learning through an array of personalized opportunities and experiences.
Students have daily opportunities to engage in educational math games in order to enrich and extend their learning during each lesson with the guidance of the teacher. Each lesson builds on the previous lesson, so the progression of learning supports competency-based instruction. Through frequent formative and summative assessments, teachers and students are able to measure their strengths and deficits in math concepts.
II. We will provide student support to meet the needs and aspirations of each student.
Campuses conduct Students Success Team (SST) meetings in order to meet the needs of students. Based on recommendations from those meetings, students then participate in skills-based learning based on their math pre-assessment results.
III. We will ensure safe and nurturing learning environments.
Students who participate in Do the Math have opportunities for additional daily small group instruction, which provides purposeful, productive, and focused lessons specifically designed to address students’ academic needs in math. Furthermore, teachers new to the grade level or content area are given Do the Math resources to assist them with specific content knowledge.
IV. We will ensure each student understands and assumes his or her role as a productive
citizen.
Throughout students’ experiences in Do the Math, they understand their role in the group, which is to not only provide support for other students, but to also be intrinsically motivated and to celebrate their academic successes and those of their peers.
V. We will broaden and strengthen connections within our communities.
CCISD has eighteen math coaches who support teachers on eighteen elementary campuses.
VI. We will ensure mutual understanding and support through effective communication.
Campus staff members communicate about meeting students’ needs though a collaborative effort, which occurs in an SST meeting and is based on students’ deficits in math through AMC administration, formative and summative assessments, teacher observations, student grades, and review of students’ cumulative records.

Do the Math Program Evaluation 2010-11 to 2014-15
Page | 3
Background Information on Do the Math
VII. We will build capacity for organizational change. Math coaches continue to support teachers through the instructional use of Do the Math materials. Upcoming professional learning opportunities exist for math teachers and math coaches in order for organizational change to occur in the future.

Do the Math Program Evaluation 2010-11 to 2014-15
Page | 4
Background Information on Do the Math
Do the Math Do the Math is a research-based math intervention program, which was created in 2007 in a collaborative effort between Scholastic and Marilyn Burns, designed for students in grades 1-5 who are struggling with foundational math concepts. Do the Math contains thirteen modules, each of which contain thirty 30-minute lessons, centered on four math categories (addition and subtraction; multiplication; division; and fractions) that allow teachers to scaffold instruction by building on students’ math skills.
Addition & Subtraction Multiplication Division Fractions
Number Core Multiplication A: Basic Concepts
Division A: Basic Concepts
Fractions A: Basic Concepts
Addition and Subtraction A:
Addition With Sums up to 100
Multiplication B: Facts Through 12 x 12
Division B: Facts Through 100 ÷10
Fractions B: Equivalence and
Comparison
Addition and Subtraction B:
Addition With Numbers up to 100
Multiplication C: Factors Greater Than
12
Division C: Dividends to 1,000
Fractions C: Addition and Subtraction
Addition and Subtraction C:
Numbers Greater Than 100
“Do The Math was designed to support teachers in understanding and delivering effective math instruction” (Scholastic, 2015a). Each module features objectives, and the materials are organized to provide teachers with support and guidance. Each of the modules include the following:
Teacher bookcase-for quick and easy storage
Teacher guide-includes preparation materials, lesson summaries and teaching instructions, and support for monitoring students’ progress
Annotated Workspace-replica of the student version, which shows answers to assist with efficient monitoring
Read Alouds-literacy is included in each module to engage students in each lesson
Teacher Demonstration Materials
Interactive Whiteboard Tools
TeacherSpace-organizational binder with professional resources
Teaching Arithmetic-professional resource

Do the Math Program Evaluation 2010-11 to 2014-15
Page | 5
Background Information on Do the Math
In addition to the teacher materials included in Do the Math, student resources include the following:
WorkSpace-place for students to demonstrate their thinking as they solve problems
Student Pair Materials-hands-on materials to support students’ thinking
Games-games are included in each module to allow for additional practice or enrichment
Do the Math also includes formative and summative assessments as well as options for differentiated instruction to meet students’ needs. Embedded lessons are included daily, and each fifth lesson includes “Show What You Know Lessons,” which provide feedback to teachers regarding students’ understanding. ProgressSpace is an online assessment tool for students, teachers, and administrators, which helps teachers make instructional decisions and measure success; however, paper-based assessment are also available in the teacher guides (Scholastic, 2015b).
Research-based instructional practices for Do the Math include the following eight elements, according to Scholastic (2008):
Scaffolded instruction--analysis of the content and breaking it up into smaller chunks in order to facilitate students’ learning
Explicit instruction--demonstration and modeling of how to solve a particular skill, or set of skills; guidance for understanding; opportunities for practice with feedback; encouragement to verbalize thought processes; and creating connections between math experiences and concepts.
Multiple strategies--using a variety of instructional strategies to ensure learning for all students occurs
Gradual method of release--“the focus of instruction is on the level of responsibility that the teacher maintains to ensure that students understand and can complete a particular task on their own”(Scholastic, 2008)
Student interaction—encouraging students to verbalize their thought processes helps to extend and deepen their understanding, while synthesizing and evaluating their own thought processes as well as those of their peers
Meaningful application--conceptual understanding which is built on students’ schema, or background knowledge and previously learned content
Content-specific vocabulary--Teaching students correct mathematical language gives them the tools to articulate their mathematical thinking coherently and precisely. Research shows that explicit instruction in mathematics vocabulary supports success with math problem solving.
Assessment and differentiation options—differentiation must occur in order for all students to learn. Formative assessments must occur to identify students who need further support and differentiation options.
Do the Math Program Evaluation 2010-11 to 2014-15
Page | 6
Background Information on Do the Math
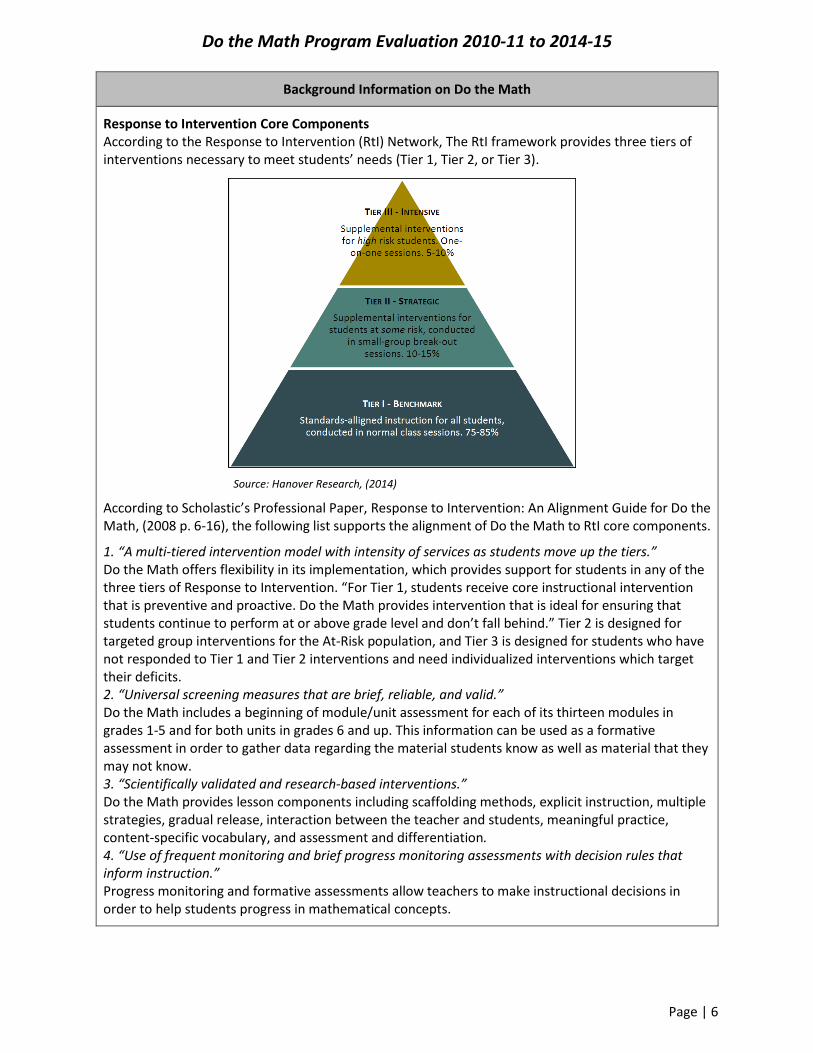
Response to Intervention Core Components According to the Response to Intervention (RtI) Network, The RtI framework provides three tiers of interventions necessary to meet students’ needs (Tier 1, Tier 2, or Tier 3).
Source: Hanover Research, (2014)
According to Scholastic’s Professional Paper, Response to Intervention: An Alignment Guide for Do the Math, (2008 p. 6-16), the following list supports the alignment of Do the Math to RtI core components.
1. “A multi-tiered intervention model with intensity of services as students move up the tiers.” Do the Math offers flexibility in its implementation, which provides support for students in any of the three tiers of Response to Intervention. “For Tier 1, students receive core instructional intervention that is preventive and proactive. Do the Math provides intervention that is ideal for ensuring that students continue to perform at or above grade level and don’t fall behind.” Tier 2 is designed for targeted group interventions for the At-Risk population, and Tier 3 is designed for students who have not responded to Tier 1 and Tier 2 interventions and need individualized interventions which target their deficits. 2. “Universal screening measures that are brief, reliable, and valid.” Do the Math includes a beginning of module/unit assessment for each of its thirteen modules in grades 1-5 and for both units in grades 6 and up. This information can be used as a formative assessment in order to gather data regarding the material students know as well as material that they may not know. 3. “Scientifically validated and research-based interventions.” Do the Math provides lesson components including scaffolding methods, explicit instruction, multiple strategies, gradual release, interaction between the teacher and students, meaningful practice, content-specific vocabulary, and assessment and differentiation. 4. “Use of frequent monitoring and brief progress monitoring assessments with decision rules that inform instruction.” Progress monitoring and formative assessments allow teachers to make instructional decisions in order to help students progress in mathematical concepts.

Do the Math Program Evaluation 2010-11 to 2014-15
Page | 7
Background Information on Do the Math
Response to Intervention Core Components (continued) 5. “Data-based decision-making.” Data can be tracked through the Objectives Tracker, which is on the back of each modules’ Teacher Guide. 6. “Supplemental instructional materials, where appropriate, to strengthen the efficacy of a comprehensive core curriculum and support student learning.” Do the Math materials support the lessons through the teacher resources through student enrichment opportunities. 7. “Instructional strategies specific to the needs of the English Language Learners.” ELL students are supported through consistent instructional strategies, visual cues, and an emphasis on language development. 8. “A strong professional development plan to support teachers implementing RtI.” Do the Math provides a variety of professional learning opportunities, including embedded professional learning as well as Math Solutions Professional Development and Scholastic’s professional learning workshops. 9. “Individuals with Disabilities Act (IDEA) RtI funding in coordination with activities funded by, and carried out under, the Every Student Succeeds Act (ESSA).” School districts may purchase intervention resources through federal funding, such as Title 1 and 21st Century Community Learning Centers.
Research According to Hanover Research (2014), the National Council of Teachers of Mathematics (NCTM) suggests that math interventions should follow the following recommendations:
Small group of up to six students
Address skill sets that apply to the unit of study
Be systematic and explicit
Require students to think aloud as they problem solve
Balance skills “on basic whole-number or rational number operations with strategies for solving problems that are more complex”

Do the Math Program Evaluation 2010-11 to 2014-15
Page | 8
Program Evaluation Questions
The following questions were determined by this program evaluation team to evaluate Do the Math:
1. How is Do the Math designed to be used?
2. How is Do the Math used in practice in CCISD?
3. How is success from students’ participation in Do the Math measured?
4. What type of professional learning opportunities exist for Do the Math teachers?
5. What is the cost of Do the Math?

Do the Math Program Evaluation 2010-11 to 2014-15
Page | 9
1. How is Do the Math designed to be used?
Do the Math Do the Math allows teachers, instructional coaches, intervention teachers, paraprofessionals, Special Education teachers, and student teachers to implement the intervention through a variety of settings, such as:
a resource, or pull out, type of program
in a classroom setting through whole or small group instruction
during tutoring sessions
during extended day programs (during summer or after school)
Each of the thirteen modules include 30-minute lessons, and students are assessed every fifth lesson. The lesson structure consists of a duration of 30-minute lessons, five days per week, for a total of 30 days.
The program is designed to assist students who need more instructional math support within their grade level as well as those who are struggling with math concepts and are a year or more below grade level.
“Do The Math is used to supplement core instructional programs, providing students with essential support to build a strong mathematical foundation. Do The Math is also used as targeted intervention, based on formal assessments, teacher observations, and Do The Math module pretests” (Scholastic, 2015a).
Developing Number Concepts Developing Number Concepts, or DNC, is a series which was developed by Kathy Richardson, author of many math publications including Developing Number Concepts and Assessing Math Concepts. The series consists of a K-2 curriculum for number operations which are key for foundational development of math concepts. The series of publications includes three books, each of which focus on different foundational concepts, such as counting, comparing, patterns, addition, subtraction, place value, multiplication, and division. The fourth resource in the series is a planning guide, which accompanies the lessons previously mentioned and provides comprehensive teaching plans.
CCISD teachers use the Assessing Math Concepts (AMC) as a formative assessment to measure mathematical growth of students in grades K-2. In CCISD, AMC is often used interchangeably with DNC.
In CCISD, AMC is administered three times each year in grades K-2: beginning of the year, mid-year, and end of year. After each AMC administration, teachers enter students’ data into Aware, then use assessment results to inform and guide instruction. Overall levels are determined and notated as Below, On, or Above level. Additionally, each individual portion of the assessment also has an individual level, which is listed below.
Instructional (I) Still needs teacher
help/instruction
Practicing (P) Has some skill development
but is still solidifying/practicing
Applies (A) Mastery of the skill has
occurred. Student is ready to apply in problem solving
situations or ready to move on to the next skill

Do the Math Program Evaluation 2010-11 to 2014-15
Page | 10
1. How is Do the Math designed to be used?
Do the Math Research on Implementation at Miami-Dade County Public Schools A study was conducted in the spring of 2012 at Miami-Dade County Public Schools in Miami, Florida in grades 3-5. Assessments used included observations by Scholastic staff members and district advisors. Staff interviews, surveys, Scholastic Math Inventory (SMI), and Florida’s Comprehensive Assessment Test (FCAT).
According to Scholastic’s Research Update entitled Students Reveal Significant Improvements in Performance on the FCAT after Participation in Do the Math, “Scholastic Math Inventory is a computer-adaptive assessment that measures students’ readiness for math instruction for grade 2 through Algebra I. It can be used as a universal screener, to monitor progress, and to inform instruction. Students receive a score on the Quantile Framework that shows their current level of math achievement and readiness. These scores also correspond to performance levels for each grade. The performance levels are Below Basic, Basic, Proficient, and Advanced” (2013).
Florida’s Comprehensive Assessment Test is a state assessment for students in grades 3-10, which occurs over a two day span each April. For grade 3 students, the FCAT consists of multiple choice questions; for grade 4 and 5 students, the FCAT consists of multiple choice and open-ended responses that require students to grid responses. Level 3 indicates satisfactory performance.
According to Scholastic’s Research Update entitled Students Reveal Significant Improvements in Performance on the FCAT after Participation in Do the Math, “Miami-Dade County is the fourth largest district in the nation, serving approximately 345,000 students in 410 schools.” In 2012, the district demographics were comprised of 62% Hispanic, 26% Black, and 9% White. 46% of students were Economically Disadvantaged; 15% of students received special education services; and 11% were English Language Learners (ELL).
The study included 695 students in grades 3-5 at 11 elementary schools. 9 out of the 11 campuses taught Do the Math as a pull-out program, which supplemented classroom instruction while the other 2 campuses taught Do the Math as after school programs. 43 Miami-Dade County Public School staff members, which consisted of teachers, math coaches, and principals, received one day of professional learning, taught by Scholastic staff members. Scholastic staff members visited classrooms three times during the spring of 2012, provided ongoing professional learning, and in-class coaching during Do the Math implementation.
Although demographic data was not available for 17 students, the demographics of the remaining 678 students who received instruction through Do the Math differed slightly than those of the district. 54% were Black, 44% were Hispanic, and 1% were White. 14% of students received Special Education services; 27% were English Language Learners, and 98% were Economically Disadvantaged.
2011-12 N* Hispanic Black White Eco ELL Sped
Participants in Grades 3-5 678 44.4% 54.1% 0.7% 97.6% 27.1% 13.6%
District Demographics 345,000 62% 26% 9% 46% 11% 15%
*Represents the number of students who had available demographic data

Do the Math Program Evaluation 2010-11 to 2014-15
Page | 11
1. How is Do the Math designed to be used?
634 students out of the 695 who participated in the Do the Math study had pre- and post-SMI assessment scores.
Grade N* Winter 2012 Spring 2012
Quantile Percentile Quantile Percentile
3 207 255 11 334 20
4 191 328 9 431 20
5 236 451 14 516 22
Total 634
*Represents the number of students who had pre- and post- assessment scores
The pre-and post- SMI assessment data for the 634 students is shown in the chart below.
Graph from Scholastic’s Research Update entitled Students Reveal Significant Improvements in Performance on the FCAT after Participation in Do the Math (2013)
354 students, or 56%, were considered to be Below Basic according to the SMI winter pre-test prior to their instruction in Do the Math. Following their instruction in Do the Math and according to their SMI spring post-test, 240 students, or 38%, were considered to be Below Basic, which is a difference of 18% who progressed onto another level (Basic, Proficient, or Advanced).

Do the Math Program Evaluation 2010-11 to 2014-15
Page | 12
1. How is Do the Math designed to be used?
Scholastic developed the following conclusions based on their study:
Do the Math students demonstrated significant improvements on SMI assessments, “with increased percentile rankings and a greater proportion of students performing in the Proficient and Advanced ranges of the test” (Scholastic, 2013).
“Do The Math students were more likely than their counterparts at the same schools to demonstrate growth on the 2012 math FCAT. While all of the students were enrolled in the same regular core mathematics program, the Do The Math students showed greater gains with the addition of the intervention math program midway through the school year” (2013).
According to Scholastic, “overwhelmingly, teachers, principals, and math coaches reported that Do The Math had a positive impact on their students’ confidence and understanding of mathematics. However, teachers did report that the implementation of Do The Math midway through the school year made for a less perfect implementation. While the significant growth observed with the midyear implementation of Do The Math was impressive, it is likely that the results would have been even greater with a full year of implementation.”
In CCISD, between the initial purchase in 2008 through 2012, which was when the revised math Texas Essential Knowledge and Skills (TEKS) were adopted (TEA, 2016), Do the Math was used as designed per Scholastic’s intentions as an intervention; however, CCISD math teachers and coaches feel that the district has outgrown Do the Math due to the implementation of the revised TEKS during the 2014-15 school year, which resulted in deeper instruction of higher level problem-solving skills.

Do the Math Program Evaluation 2010-11 to 2014-15
Page | 13
2. How is Do the Math used in practice in CCISD?
According to survey results obtained from elementary campuses in the fall of 2015, the majority of campuses indicated that they plan to utilize Do the Math this school year and currently have various Do the Math modules on their campus.
Survey response rate=96.1% (25 out of 26 campuses responded to the survey)
Will your campus be utilizing Do the Math this school year?
Yes No
64.0% 36.0%
Did your campus utilize Do the Math last school year (2014-15)?
Yes No
64.0% 36.0%
Of the 16 campuses that utilized Do the Math modules during the 2014-15 school year, 87.5% of those campuses (14 campuses) are utilizing Do the Math during the 2015-16 school year.
The remaining survey data is based on the 16 campuses that are utilizing Do the Math during the 2015-16 school year. (Two of the campuses that are utilizing Do the Math modules during the 2015-16 school year did not utilize Do the Math modules during the 2014-15 school year).
How many, if any, Do the Math modules do you have on your campus?
Number of Modules
0 1 2 3 4 5 6 7 8 9 10
Small group
modules
Addition & Subtraction Modules
N 3 6
2 1
2 1
1
% 18.8% 37.5% 12.5% 6.3% 12.5% 6.3% 6.3%
Multiplication Modules
N 3 6
3 1
2
1
% 18.8% 37.5% 18.8% 6.3% 12.5% 6.3%
Division Modules
N 3 6
3 1
2
1
% 18.8% 37.5% 18.8% 6.3% 12.5% 6.3%
Fraction Modules
N 3 6
2 1
2 1
1
% 18.8% 37.5% 12.5% 6.3% 12.5% 6.3% 6.3%
Whole class
modules
Addition & Subtraction Modules
N 9 6
1
% 56.3% 37.5% 6.3%
Multiplication Modules
N 10 5
1
% 62.5% 31.3% 6.3%
Division Modules
N 10 5
1
% 62.5% 31.3% 6.3%
Fraction Modules
N 10 5
1
% 62.5% 31.3% 6.3%
According to survey results, McWhirter, League City Elementary, Stewart, Hyde, and Ross reported having the greatest numbers of modules, which average 26.4 modules per campus.

Do the Math Program Evaluation 2010-11 to 2014-15
Page | 14
2. How is Do the Math used in practice in CCISD?
What is the role of the person/people who utilize Do the Math to support students through direct instruction? (Select all that apply).
Full-time
Parent/Volunteer Special Education
teacher Classroom
teacher
0.0% 57.1% 78.6%
Intervention teacher
(certified)
Intervention teacher (non-certified)
Instructional (Math) Coach
7.1% 0.0% 21.4%
Paraprofessional ELL Certified teacher
0.0% 7.1%
Part-time
Parent/Volunteer Intervention teacher
(certified)
Intervention teacher
(non-certified)
0.0% 42.9% 7.1%
Substitute (certified)
Substitute (non-certified)
Other
0.0% 0.0% 0.0%
Survey results indicated that nearly 80% of campuses’ classroom teachers use Do the Math modules, while 57.1% of the campuses utilize Special Education teachers; 42.9% use certified part-time intervention teachers; 21.4% of campuses utilize their instructional math coach; and 7.1% of campuses utilize certified full-time intervention teachers, ELL teachers, and/or non-certified part-time intervention teachers to teach Do the Math lessons.
Which students are candidates for Do the Math? (Select all that apply).
Students who have been through SST and
are being served through Tier 1 or 2 in
the RtI process
Identified students receiving ELL services
53.8% 15.4%
Identified students receiving Special
Education services
Low performing students
46.2% 69.2%
Students who have been on the cusp of meeting standard on
STAAR
Other*
42.9% 6.3%
*Do the Math Pre-test and teacher observation
Campuses use various criteria to determine which students are serviced through Do the Math. The criteria includes assessment scores (AMC, CBA, benchmark, STAAR, and learning checkpoints). The majority (69.2%) of campuses feel that low performing students are candidates for Do the Math.

Do the Math Program Evaluation 2010-11 to 2014-15
Page | 15
2. How is Do the Math used in practice in CCISD?
What grade level(s) of students are primarily served? (Select all that apply).
Kindergarten 1st grade 2nd grade
0.0% 0.0% 35.7%
3rd grade 4th grade 5th grade
78.6% 85.7% 71.4%
Approximately how many students are typically served on your campus each school year through Do the Math?
<10 10-20 21-30
0.0% 25.0% 6.3%
31-40 41-50 51-60
12.5% 12.5% 12.5%
61-70 71-80 81-90
0.0% 0.0% 0.0%
>100 No
Response
12.5% 18.8%
The majority of students served include students in grades 3 and 4 (78.6% and 85.7%, respectively) followed by students in grade 5 (71.4%). 35.7% of campuses indicated that students in grade 2 are served through Do the Math, and 0.0% of students in grades kindergarten and 1 participate in Do the Math.
How many students are served in a single elementary (grades K-5) Do the Math group?
No Response
0 1 2 3 4 More than 4
25.0% 6.3% 0.0% 0.0% 18.8% 37.5% 12.5%
How long do students typically remain in a Do the Math group?
No Response
Less than 3 weeks
3-4 weeks
5-6 weeks
43.8% 0.0% 6.3% 12.5%
7-8 weeks
9-10 weeks
More than 10 weeks
18.8% 0.0% 18.8%
Typically, for campuses who utilize Do the Math as an intervention, 3-4 students are served in a single elementary Do the Math group (56.3%). Some campuses indicated that teachers use Do the Math resources as a supplement to classroom lessons since it is referenced in the CCISD math curriculum. For intervention purposes, 37.6% of campuses stated that students remain in a Do the Math intervention group for 7 weeks or more, while 43.8% did not respond since the majority use Do the Math as a resource.

Do the Math Program Evaluation 2010-11 to 2014-15
Page | 16
2. How is Do the Math used in practice in CCISD?
How many times per week do Do the Math groups meet?
1 2 3
0.0% 25.0% 18.8%
4 5 No
Response
18.8% 0.0% 37.5%
According to campus survey results, Do the Math intervention groups meet, on average, 2-4 times per week. Classroom teachers use Do the Math more as a resource within their classrooms, as opposed to a consistent type of intervention.
Including this year, how many years has your campus been using Do the Math?
1 2 3 4 5 6 No
Response
0.0% 12.5% 0.0% 31.3% 12.5% 6.3% 37.5%
On a scale of 1-4, in your opinion, please rate the effectiveness of Do the Math.
1 2 3 4 No
Response
0.0% 25.0% 37.5% 6.3% 31.3%
(1=Ineffective; 2=Effective; 3=Mostly Effective; 4=Very Effective)
The following survey questions were open-ended, and the most common responses are listed in order of frequency:
To what do you attribute the effectiveness or ineffectiveness of Do the Math?
For those campuses that rated Do the Math’s effectiveness a 3 or 4, the responses are summarized below:
Consistency of implementation and monitoring the fidelity to the program
Scaffolded lessons and time to process
Building of basic computational skills
For those campuses that rated Do the Math’s effectiveness a 2, the responses are summarized below:
Lack of rigor and need for problem solving methods
Time constraints
Lack of intervention support staff for proper implementation as a pull out intervention
How is student progress tracked/documented as a result of Do the Math?
Formative assessments and AMC scores
Teacher observation
SST meetings
LaserFocus
What criteria does your campus use to determine which students utilize Do the Math modules?
Formative assessment data (AMC, CBAs, learning checkpoints)
Summative assessment data (benchmark and STAAR scores)
Teachers’ and campus instructional coaches’ recommendations
Student grades
Do the Math Program Evaluation 2010-11 to 2014-15
Page | 17
2. How is Do the Math used in practice in CCISD?
What professional learning has the Do the Math teacher(s) received, and when did the PL occur?
Initial professional learning in order to introduce and implement Do the Math modules
On-campus support provided by the math coach
Trainer of trainer model when Do the Math was initially purchased
Additional survey comments include the use of Do the Math module manipulatives and games as supplemental to classroom instruction, as opposed to solely an intervention. Typically, teachers share materials housed in a central location. For intervention use, consumable workbooks (WorkSpaces) are needed every year in order to have continued success with students, which are costly at $79.00 for a set of 8 (Math Solutions, 2015).
Focus Group The Office of Assessment and Evaluation conducted a focus group in January of 2016 with math coaches and teachers who have knowledge regarding Do the Math. While Do the Math is designed as an intervention and/or resource to be used in a small group or whole group setting, it is used in CCISD primarily as a resource for teachers. In particular, they felt that new teachers benefit from Do the Math lesson guides in order to gain content knowledge prior to teaching a math concept. In addition, while initially the timing of the Do the Math purchases seven years ago was feasible, they feel as though CCISD has outgrown Do the Math due to the rigor of the updated math curriculum and new math TEKS. Do the Math is focused solely on computation as opposed to problem-solving methods. A large majority of the Do the Math modules were purchased in the 2008-2009 school year.
While the modules are not being implemented specifically for intervention at the campuses from which the focus group attendees represented, the teachers do enjoy using the manipulatives and games that come with each module, such as magnetic fraction strips, tiles, die, and other hands-on materials. Do the Math is referenced in the math curriculum (grades 3 and 4) along with additional resources and websites, so teachers are aware that Do the Math is available for use.

Do the Math Program Evaluation 2010-11 to 2014-15
Page | 18
3. How is success from students’ participation in Do the Math measured?
2014-15 Assessing Math Concepts (AMC) Results
The Office of Assessment and Evaluation gathered data from one elementary campus who served 33 grade 2 students during the spring of 2015 through consistent Do the Math groups, 2 of whom were not enrolled on snapshot, for a total of 31 students. The data below is based on the control group of 71 students and the sample group of 31 students.
Control Group Data: The control group consisted of 71 grade 2 students at the same elementary campus as the sample group. These students did not participate in Do the Math and had beginning, mid-year, and end of year AMC scores.
Data source: CCISD database Instructional (I): Still needs teacher help/instruction Practicing (P): Has some skill development but is still solidifying/practicing Applies (A): Mastery of the skill has occurred. Student is ready to apply in problem solving situations or ready to move on to the next skill
Level
Addition Subtraction
BOY Adds with
strategies
Mid-year Adds with strategies
EOY Two- digit
addition using
symbols
BOY Subtracts
with strategies
Mid- year Subtracts
with strategies
EOY Two- digit
subtraction using symbols
I 23.9% 14.1% 19.7% 21.1% 15.5% 19.7%
P 19.7% 11.3% 8.5% 39.4% 18.3% 19.7%
A 56.3% 74.6% 71.8% 39.4% 66.2% 60.6%
N=71
For the addition portion of the AMC, 23.9% of students were on the instructional level at the beginning of the year, which decreased to 19.7% at the end of the year (a difference of 4.2%); for the application level, 56.3% began on this level at the beginning of the year, which increased by 15.5% by the end of the year to 71.8%.
For the subtraction portion of the AMC, 21.1% of students were on the instructional level at the beginning of the year, which decreased to 19.7% (a difference of 1.4%); for the application level, 39.4% began on this level at the beginning of the year, which increased by 21.2% by the end of the year to 60.6%.

Do the Math Program Evaluation 2010-11 to 2014-15
Page | 19
3. How is success from students’ participation in Do the Math measured?
Control Group Data (continued): Of the 17 students (23.9%) in the control group who were at a level I in the beginning of the year for Addition with Strategies, and the 15 students (21.1)%) who were at a level I in the begin of the year for Subtraction with Strategies, the following table shows their progress throughout the other two administrations of AMC.
Level
Addition Subtraction
BOY Adds with
strategies
Mid-year Adds with
strategies
EOY Two- digit
addition using
symbols
BOY Subtracts
with strategies
Mid- year Subtracts
with strategies
EOY Two- digit
subtraction using
symbols
I 100.0% 58.8% 76.5% 100.0% 66.7% 73.3%
P 0.0% 23.5% 11.8% 0.0% 20.0% 13.3%
A 0.0% 17.6% 11.8% 0.0% 13.3% 13.3%
N=17 N=15 Data source: CCISD database
Of the students who were on a level I on the addition portion of AMC at the beginning of the year, there was a decrease to 76.5% at the end of the year (for a difference of 23.5%); for the application level, 0.0% began on this level at the beginning of the year, which increased to 11.8% by the end of the year. Of the students who were on a level I on the subtraction portion of AMC at the beginning of the year there was a decrease to 73.3% at the end of the year (a difference of 26.7%); for the application level, 0.0% began on this level at the beginning of the year, which increased by to 13.3% by the end of the year.

Do the Math Program Evaluation 2010-11 to 2014-15
Page | 20
3. How is success from students’ participation in Do the Math measured?
Sample Group data: The sample group consisted of 31 grade 2 students at an elementary school in CCISD. These students participated in Do the Math during the spring of the 2014-15 school year and had beginning, mid-year, and end of year AMC scores.
Level
Addition Subtraction
BOY Adds with
strategies
Mid-year Adds with strategies
EOY Two- digit
addition using
symbols
BOY Subtracts
with strategies
Mid- year Subtracts
with strategies
EOY Two- digit
subtraction using
symbols
I 51.6% 9.7% 12.9% 54.8% 22.6% 16.1%
P 41.9% 51.6% 29.0% 32.3% 51.6% 61.3%
A 6.5% 38.7% 58.1% 12.9% 25.8% 22.6%
N=31
For the addition portion of the AMC, 51.6% of students were on the instructional level at the beginning of the year, which decreased to 12.9% at the end of the year (a difference of 38.7%); for the application level, 6.5% began on this level at the beginning of the year, which increased by 51.6% by the end of the year to 58.1%.
For the subtraction portion of the AMC, 54.8% of students were on the instructional level at the beginning of the year, which decreased to 16.1% (a difference of 38.7%); for the application level, 12.9% began on this level at the beginning of the year, which increased by 9.7% by the end of the year to 22.6%.
Of the 31 students (51.6%) in the control group who were at a level I in the beginning of the year for Addition with Strategies, and the 17 students (54.8)%) who were at a level I in the begin of the year for Subtraction with Strategies, the following table shows their progress throughout the other two administrations of AMC.
Level
Addition Subtraction
BOY Adds with
strategies
Mid-year Adds with strategies
EOY Two- digit
addition using
symbols
BOY Subtracts
with strategies
Mid- year Subtracts
with strategies
EOY Two- digit
subtraction using
symbols
I 100.0% 12.5% 12.5% 100.0% 29.4% 17.6%
P 0.0% 56.3% 31.3% 0.0% 58.8% 58.8%
A 0.0% 31.3% 56.3% 0.0% 11.8% 23.5%
N=16 N=17 Data source: CCISD database
Of the students who were on a level I on the addition portion of AMC at the beginning of the year, there was a decrease to 12.5% at the end of the year (for a difference of 87.5%); for the application level, 0.0% began on this level at the beginning of the year, which increased to 56.3% by the end of the year. Of the students who were on a level I on the subtraction portion of AMC at the beginning of the year there was a decrease to 17.6% at the end of the year (a difference of 82.4%); for the application level, 0.0% began on this level at the beginning of the year, which increased by to 23.5% by the end of the year.

Do the Math Program Evaluation 2010-11 to 2014-15
Page | 21
3. How is success from students’ participation in Do the Math measured?
The demographic information for the sample group of 31 students is shown in the table below.
School Year
N H AS BL WH ECO LEP SPED At-Risk
F M
2014-15 Grade 2
31 74.2% 0.0% 16.1% 9.7% 87.1% 64.5% 16.1% 71.0% 67.7% 32.3%
District Grade 2
2,874 29.7% 8.8% 7.4% 49.9% 30.6% 16.5% 9.8% 22.2% 48.7% 51.3%
District 40,812 28.7% 9.8% 8.1% 49.3% 26.9% 9.8% 9.7% 37.6% 48.8% 51.2%
*Based on snapshot 2014-15
While the sample group’s demographics differ than those of the district’s grade 2 population as well as the overall district demographics, a large percentage of students who participated in Do the Math were LEP, At-Risk, Hispanic, Female, and Economically Disadvantaged. In addition, the Special Education population in the sample group was substantially higher than the grade 2 district and overall district populations.

Do the Math Program Evaluation 2010-11 to 2014-15
Page | 22
4. What type of professional learning opportunities exist for Do the Math teachers?
According to survey results, district level professional learning was conducted shortly after the initial purchase of Do the Math modules in 2008; however, instructional math coaches continue to support teachers in the use supplemental materials. Some teachers who were initially trained seven years ago have trained other teachers on instructional uses of Do the Math between the initial purchase in 2008 and 2016; however, the CCISD elementary math coordinator has created professional learning opportunities for the use of Do the Math modules beginning in the 2016-17 school year.

Do the Math Program Evaluation 2010-11 to 2014-15
Page | 23
5. What is the cost of Do the Math?
Do the Math Costs Do the Math module purchases occurred shortly after its creation in 2007. According to CCISD’s Elementary Math Coordinator, CCISD purchased $6,000 worth of modules during the 2008-09 school year for each of the 24 elementary campuses (not including Parr and Mossman since they were not yet built). Since then, only one elementary campus has purchased Do the Math modules, according to Scholastic’s purchase history for CCISD. During the 2014-15 school year, one elementary campus purchased 13 modules for a total of $13,875, five of which were used for the sample group included in this program evaluation’s data. (The total cost of the five modules used for this particular sample group was $8,200). The remaining modules were used either as a resource for teachers or in other small groups for intervention.
This campus’ data was included in this program evaluation in order to measure success of the intervention. At this campus, 33 grade 2 students participated in small group intervention during the spring of 2015 and were instructed using the Addition & Subtraction Module, which is a cost per student of $248.48.
The total cost for all modules in 2008-09 was $144,000; however, the modules have continued to serve as a resource for elementary math teachers since the initial purchase. According to the survey results, approximately 620 students were impacted through Do the Math intervention instruction in the 2014-15 school year, for an approximate total of 4,340 students over the seven year period since it was purchased, which equates to an approximate cost per student of $33.18; however, since Do the Math is referenced in the grade 3 and 4 CCISD math curriculum, many more students have been impacted over the seven year period and will continue to be impacted as teachers continue to rely on the lessons, manipulatives, and games in Do the Math modules.
According to survey results, 75% of campuses indicated that CCISD has purchased Do the Math modules, while 25% of campuses have purchased modules.
Year Initial cost # of
Campuses Total Initial
cost
# of students annually (over 7
year period)
Total # of Students
Cost per student
2008-09 $6,000 24 $144,000 620 4,340 $33.18
Who has purchased Do the Math kits for your campus? (Select all that apply)
PTA Campus District CCEF
0.0% 25.0% 75.0% 0.0%

Do the Math Program Evaluation 2010-11 to 2014-15
Page | 24
Summary of Findings
Below is a summary of findings for each of the program evaluation questions:
1. How is Do the Math designed to be used?
Do the Math is designed to assist students who need more instructional math support within their grade level as well as those who are struggling with math concepts and are a year or more below grade level.
Do the Math allows teachers, instructional coaches, intervention teachers, paraprofessionals, Special Education teachers, and student teachers to implement the intervention through a variety of settings. Each of the thirteen modules include 30-minute lessons, and students are assessed every fifth lesson. The lesson structure consists of a duration of 30-minute lessons, five days per week, for a total of 30 days.
2. How is Do the Math used in practice in CCISD?
Of the 16 campuses that utilized Do the Math modules during the 2014-15 school year, 87.5% of those campuses (14 campuses) are utilizing Do the Math during the 2015-16 school year. Survey results indicated that nearly 80% of campuses’ classroom teachers use Do the Math modules, while 57.1% of the campuses utilize Special Education teachers; 42.9% use certified part-time intervention teachers; 21.4% of campuses utilize their instructional math coach; and 7.1% of campuses utilize certified full-time intervention teachers, ELL teachers, and/or non-certified part-time intervention teachers to teach Do the Math lessons.
Campuses use various criteria to determine which students are serviced through Do the Math. The criteria includes assessment scores (AMC, CBA, benchmark, STAAR, and learning checkpoints). The majority (69.2%) of campuses feel that low performing students are candidates for Do the Math. The majority of students served include students in grades 3 and 4 (78.6% and 85.7%, respectively), followed by students in grade 5 (71.4%). 35.7% of campuses indicated that students in grade 2 are served through Do the Math, and 0.0% of students in grades kindergarten and 1 participate in Do the Math.
Typically, 3-4 students are served in a single elementary Do the Math group (56.3%). Some
campuses indicated that teachers use Do the Math resources as a supplement to classroom
lessons since it is referenced in the CCISD math curriculum. According to campus survey
results, Do the Math groups meet, on average, 2-4 times per week. Approximately 50.1% of
campuses have utilized Do the Math modules for 4-6 years. 43.8% of campuses rated Do the
Math mostly or very effective.
While Do the Math is designed as an intervention and/or resource to be used in a small group or whole group setting, it is used primarily as a resource for teachers in CCISD.
3. How is success from students’ participation in Do the Math measured?
The Office of Assessment and Evaluation gathered data from one elementary campus who
served 33 grade 2 students during the spring of 2015 through consistent Do the Math
groups, 2 of whom were not enrolled on snapshot, for a total of 31 students.

Do the Math Program Evaluation 2010-11 to 2014-15
Page | 25
Summary of Findings
AMC measures various math concepts, and in grade 2, students in the sample group were
assessed on the concepts listed below:
Beginning of Year-Adds with strategies
Mid-year-Adds with strategies
End of Year-Two-digit addition using symbols
Beginning of Year-Subtracts with strategies
Mid-year-Subtracts with strategies
End of Year-Two-digit subtraction using symbols
For the beginning of the year AMC addition assessment, nearly 52% of the students in the
sample group were on an instructional level (I); mid-year, nearly 52% were on a processing
level (P); and at the end of the year, 58% were on an application level (A).
For the beginning of the year AMC subtraction assessment, nearly 55% of the students in the
sample group were on an instructional level (I); mid-year, nearly 52% were on a processing
level (P); and at the end of the year, approximately 23%% were on an application level (A);
however, 61% were on a processing level.
4. What type of professional learning opportunities exist for Do the Math teachers?
According to survey results, district level professional learning was conducted seven years
ago after the initial purchase of Do the Math modules; however, instructional math coaches
continue to support teachers in the use supplemental materials. Some teachers who were
initially trained seven years ago have trained other teachers throughout the years.
5. What is the cost of Do the Math?
During the 2014-15 school year, one elementary campus purchased 13 modules for a total of $13,875, five of which were used for the sample group included in this program evaluation’s data. (The total cost of the five modules used for this particular sample group was $8,200). The remaining modules were used either as a resource for teachers or in other small groups for intervention.
The total cost for all modules in 2008-09 was $144,000; however, the modules have continued to serve as a resource for elementary math teachers since the initial purchase. According to the survey results, approximately 620 students were impacted through Do the Math intervention instruction in the 2014-15 school year, for an approximate total of 4,340 students over the seven year period since it was purchased, which equates to an approximate cost per student of $33.18; however, since Do the Math is referenced in the grade 3 and 4 CCISD math curriculum, many more students have been impacted over the seven year period and will continue to be impacted as teachers continue to rely on the lessons, manipulatives, and games in Do the Math modules.

Do the Math Program Evaluation 2010-11 to 2014-15
Page | 26
Appendix A
Do the Math Modules
Do the Math Module
Small Group Modules Whole-Class Modules
Serves 1 teacher and 8 students
Serves 1 teacher and 24 students
Addition & Subtraction Modules: Number Core A, B, C
Addition & Subtraction Number Core $650.00 $1,150.00
Addition & Subtraction A: Addition with sums up to 100 $675.00 $1,175.00
Addition & Subtraction B: Subtraction with numbers up to 100 $575.00 $875.00
Addition & Subtraction C: Numbers greater than 100 $575.00 $975.00
Multiplication Modules A, B, C
Multiplication A: Basic Concepts $575.00 $975.00
Multiplication B: Facts through 12 x 12 $675.00 $1,275.00
Multiplication C: Factors greater than 12 $575.00 $1,025.00
Division Modules A, B, C
Division A: Basic Concepts $625.00 $1,125.00
Division B: Facts through 100 ÷ 10 $575.00 $975.00
Division C: Dividends to 1,000 $525.00 $825.00
Fraction Modules A, B, C
Fractions A: Basic Concepts $625.00 $1,125.00
Fractions B: Equivalence and Comparison $675.00 $1,275.00
Fractions C: Addition and Subtraction $675.00 $1,275.00
RTI Packages Individual Module Price RTI Package Price
Whole School Reform Package (All 13 Do The Math Modules) (Whole-class modules)
$14,050.00 $11,750.00
Classroom Intervention Package (All 13 Do The Math Modules) (Small group modules)
$8,000.00 $6,700.00
Do The Math Small-Group Packages
Tier 1 Intervention Packages
Grade 2: Addition & Subtraction A, Addition & Subtraction B, Addition & Subtraction C
$1,800.00 $1,600.00
Grade 3: Multiplication A, Division A, Fractions A $1,825.00 $1,625.00
Grade 4: Multiplication B, Division B, Fractions B $ $1,925.00 $1,725.00
Grade 5: Multiplication C, Division C, Fractions C $1,775.00 $1,600.00
Tier 2: Intervention Packages
Grade 3: Addition & Subtraction A, Addition & Subtraction B, Addition & Subtraction C
$1,800.00 $1,600.00
Grade 4: Multiplication A, Division A, Fractions A $1,825.00 $1,625.00
Grade 5: Multiplication B, Division B, Fractions B $1,925.00 $1,725.00
Grade 6: Multiplication C, Division C, Fractions C $1,775.00 $1,600.00
Tier 3: Intensive Intervention
Grade 3: Addition & Subtraction Number Core, Addition & Subtraction A, Addition & Subtraction B
$1,900.00 $1,700.00
Grades 4–5: Addition & Subtraction A, Addition & Subtraction B, Multiplication A, Multiplication B, Division A
$3,125.00 $2,675.00
Grade 6 & Up: Do The Math Now!: Multiplication & Division and Fraction Fundamentals
$3,225.00 $2,095.00
Source: Scholastic’s Do the Math Sale Order Form

Do the Math Program Evaluation 2010-11 to 2014-15
Page | 27
Appendix A
Do the Math Modules (continued)
Do The Math Whole-Whole Class Instruction Packages Individual Module Price RTI Package Price
Tier 1 Intervention Packages
Grade 2: Addition & Subtraction A, Addition & Subtraction B, Addition & Subtraction C
$3,025.00 $2,675.00
Grade 3: Multiplication A, Division A, Fractions A $3,225.00 $2,850.00
Grade 4: Multiplication B, Division B, Fractions B $3,525.00 $3,100.00
Grade 5: Multiplication C, Division C, Fractions C $3,125.00 $2,800.00
Tier 2: Intervention Packages
Grade 3: Addition & Subtraction A, Addition & Subtraction B, Addition & Subtraction C $3,025.00 $2,675.00
Grade 4: Multiplication A, Division A, Fractions A $3,225.00 $2,850.00
Grade 5: Multiplication B, Division B, Fractions B $3,525.00 $3,100.00
Grade 6: Multiplication C, Division C, Fractions C $3,125.00 $2,800.00
Tier 3: Intervention Packages
Grade 3: Addition & Subtraction Number Core, Addition & Subtraction A, Addition & Subtraction B $3,200.00 $2,850.00
Grades 4-5: Addition & Subtraction A, Addition & Subtraction B, Multiplication A, Multiplication B, Division A $5,425.00 $4,675.00
Add-On Materials (WorkSpace books, games, and manipulatives) available for $150-$300
Interactive Whiteboards (1 CD-Rom per topic)-1 teacher-$59.95 or comprehensive set includes all four topics-$215.95
Source: Scholastic’s Do the Math Sale Order Form (2012)

Do the Math Program Evaluation 2010-11 to 2014-15
Page | 28
Appendix B
Acronyms
AMC-Assessing Math Concepts
BOY-Beginning of Year
CBA-Curriculum Based Assessment
DNC-Developing Number Concepts
DTM-Do the Math
Eco-Economically Disadvantaged
ELL-English Language Learners
EOY-End of Year
ESSA-Every Student Succeeds Act
FCAT-Florida’s Comprehensive Assessment Test
IDEA-Individuals with Disabilities Act
LEP-Limited English Proficiency
NCTM-National Council of Teachers of Mathematics
RtI-Response to Intervention
SMI-Scholastic’s Math Inventory
SST-Student Success Team
TEA-Texas Education Agency
TEKS-Texas Essential Knowledge and Skills

Do the Math Program Evaluation 2010-11 to 2014-15
Page | 29
Resources
Hanover Research (2014). Best practices in math intervention. Washington, DC: Hanover Research.
Math Solutions (2015). Product list: Do the math. Sausalito, CA: Math Solutions.
Scholastic (2015a). Do the math overview. Houghton Mifflin. Harcourt. http://www.hmhco.com/products/do-the-math/do-the-math/experience.htm#overview
Scholastic (2015b). Do the math assessment. Houghton Mifflin. Harcourt. http://www.hmhco.com/products/do-the-math/do-the-math/support-materials.htm#assessment
Scholastic (2008). Research foundation paper. Do the math arithmetic intervention by Marilyn Burns: A summary of the research. New York, NY: Scholastic Inc.
Scholastic (2013). Research update: Students reveal significant improvements in performance on the FCAT after participation in Do the Math. New York, NY: Scholastic Inc.
Texas Education Agency (TEA) (2016). Mathematics Texas Essential Knowledge and Skills. http://tea.texas.gov/index2.aspx?id=2147499971

Do the Math Program Evaluation 2010-11 to 2014-15
Page | 30
Superintendent’s Recommendations
1. We will explore professional learning options for the supplemental use of Do the Math materials for elementary math teachers, coaches, and interventionists by August 2016.