do we need to worry about wireless substitution in public opinion
TRANSCRIPT

Results from the 2007 New Jersey Health Care Opinion Poll
Do we need to worry about wireless
substitution in public opinion polls
about health reform?
AcademyHealth Survey Methods Workshop
Washington, D.C.
June 9, 2008
Joel Cantor, Susan Brownlee, Cliff Zukin & John Boyle
Institute for Health, Health Care Policy
and Aging Research

2
Project Team
Rutgers
• Joel Cantor
• Susan Brownlee
• Cliff Zukin
• Margaret Koller
Schulman, Ronca, &
Bucuvalas, Inc.
• Al Ronca
• Jamie Munjack
• John Boyle
Financial support from
the Robert Wood Johnson Foundation

OUTLINE
• The problem of wireless substitution
– Not just households without landlines
• NJ Health Care Opinion Poll
– How the poll was conducted
– Measurement of “wireless mainly” population
• Extent of differences
– Landline, Wireless-only, Wireless-mainly
• 81 items, 14 domains
• Selected examples
– Effect of post-stratification
• Discussion

4
Potential for Sample Frame
Coverage Bias in Health Opinion Polls
• Opinion polls are traditionally based on Random Digit
Dial (RDD) samples using landlines
• A growing number of households rely on wireless
phones and do not have landlines (or don‟t use them
much)
• Potential for sample frame coverage bias varies by:
– Prevalence of wireless substitution
– Magnitude of wireless - landline differences

5
Wireless-Only PopulationPercent of adults with a wireless phone living in households without a landline.
0.0%
2.0%
4.0%
6.0%
8.0%
10.0%
12.0%
14.0%
16.0%
Jan-Jun
2003
July-
Dec
2003
Jan-Jun
2004
July-
Dec
2004
Jan-Jun
2005
July-
Dec
2005
Jan-Jun
2006
July-
Dec
2006
Jan-Jun
2007
July-
Dec
2007
Source: Blumberg and Luke, Wireless Substitution: Early Release of Estimates from the National Health Interview
Survey : July-December 2007. National Center for Health Statistics, May 13, 2008.

6
Estimated Population Distribution Wireless Only, Wireless Mostly, and Landline
Wireless Mostly,
14.0%
Landline, 71.6%
Wireless Only,
14.4%
Source: Blumberg and Luke, Wireless Substitution: Early Release of Estimates from the National Health Interview
Survey : July-December 2007. National Center for Health Statistics, May 13, 2008.

7
NJ Opinion Poll Design
• Purpose: gauge concerns about health care issues and support for reform in NJ
• Field period: June 1 to July 9, 2007
• Interviews: English and Spanish
• Calling design: up to 18 contact attempts
• Incentives: $10 for wireless respondents
• Length: 20.2 min (landline) & 22.8 min (wireless)
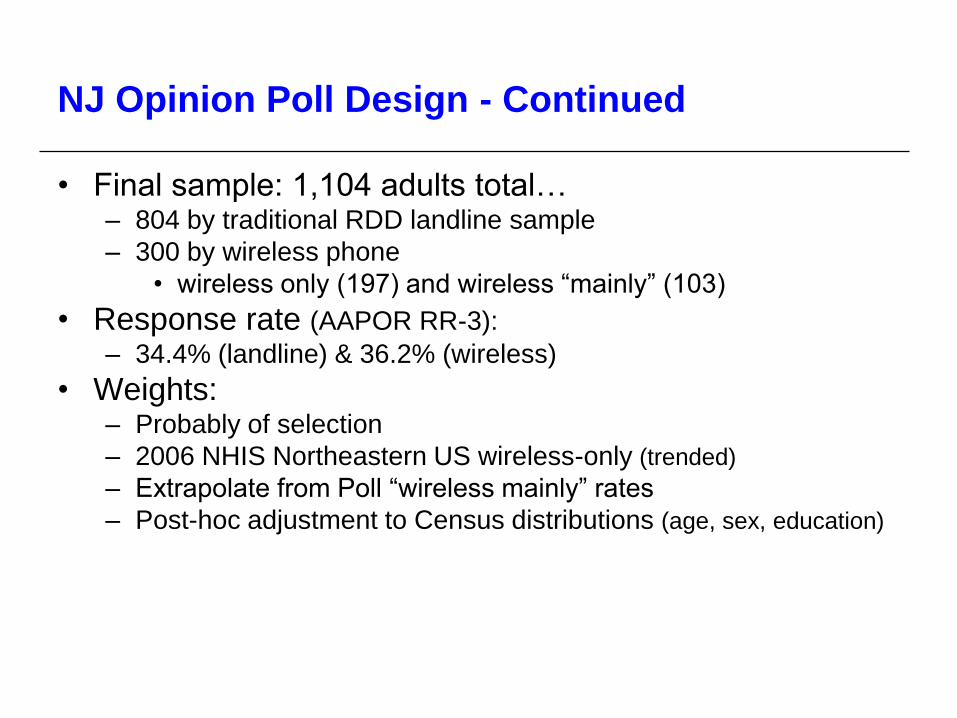
NJ Opinion Poll Design - Continued
• Final sample: 1,104 adults total…– 804 by traditional RDD landline sample
– 300 by wireless phone
• wireless only (197) and wireless “mainly” (103)
• Response rate (AAPOR RR-3):
– 34.4% (landline) & 36.2% (wireless)
• Weights:– Probably of selection
– 2006 NHIS Northeastern US wireless-only (trended)
– Extrapolate from Poll “wireless mainly” rates
– Post-hoc adjustment to Census distributions (age, sex, education)

Our Wireless Sample Screening
In addition to having a cell phone, do you also have at least one land
line phone in your house at which you or anyone else in the
household NORMALLY receive in-coming phone calls?
IF YES: Please do not include modem only lines, fax only lines, lines used just for a
home security system, beepers, pagers, or the cell phone.
(IF YES) Thinking just about the land line home phone, NOT your cell
phone, if that telephone rang, and someone was home, under
normal circumstances how likely would it be answered.
Would you say:
Extremely likely
Very likely
Somewhat likely
Somewhat unlikely
Not at all likely
9
Wireless Mainly Sample

10
Estimated Population Size by Wireless Status Difference between “mainly” and “mostly” concepts
77.5% 71.6%
14.4%
14.8%
14.0%7.7%
0%
20%
40%
60%
80%
100%
Rutgers CSHP NJ Poll
June-July '07
NHIS July-Dec '07*
Wireless Mainly/Mostly
Wireless Only
Landline
Wireless “Mainly”Somewhat Unlikely
or Not At All Likely
to Answer Landline
Wireless “Mostly”All or Most Calls
Received on
Cell Phones
*Blumberg and Luke, Wireless Substitution: Early Release of Estimates from the National Health Interview Survey :
July-December 2007. National Center for Health Statistics, May 13, 2008.

Significance of Differences Between Landline and
Wireless Responses by Survey Domain81Questions in 14 Conceptual Domains
0% 10% 20% 30% 40% 50% 60% 70% 80% 90% 100%
Demographics (11)
Own Health Status (2)
Own Health Care Cost (4)
Own Coverage (2)
Employment & Income (5)
Need for Reform (5)
General Worry (7)
Read or Heard About Reform (2)
Health Worry (7)
Priorities for NJ (9)
Coverage Reforms (12)
Responsibility for Covering Uninsured (5)
Public Health Reforms (5)
Regulatory Reforms (5)P<.001 P<.01 P<.05
Note: Data unweighted
Source: Rutgers Center for State Health Policy, New Jersey Health Care Opinion Poll, 2007 Rev. 7-08-08

12
Demographics:
Age Distribution
22.1%
4.9%
31.5%
14.3%
17.6%
38.1%
42.9%
49.0%
8.3%
42.9%
28.4%
0%
20%
40%
60%
80%
100%
Landline Wireless Only Wireless Mainly
18-29
30-49
50-64
65+
Sources: Rutgers Center for State Health Policy, New Jersey Health Care Opinion Poll, 2007
(P<0.001)

13
12.1%9.0%
22.5%
18.6%
23.3%
0.0%
10.0%
20.0%
30.0%
40.0%
50.0%
60.0%
Total Landline Total Wireless Wireless Only Wireless Mainly
Sources: Rutgers Center for State Health Policy, New Jersey Health Care Opinion Poll, 2007
Demographics:
Non-Citizen in Household
(P<0.001) (N.S.)

14
21.4%24.8%
10.0%13.1%
9.0%
0.0%
10.0%
20.0%
30.0%
40.0%
50.0%
60.0%
Total Landline Total Wireless Wireless Only Wireless Mainly
Sources: Rutgers Center for State Health Policy, New Jersey Health Care Opinion Poll, 2007
Own Health Status:
Three or More Prescription Drugs
(P<0.001) (N.S.)

15
28.5%26.1%
36.8%33.3%
38.2%
0.0%
10.0%
20.0%
30.0%
40.0%
50.0%
60.0%
Total Landline Total Wireless Wireless Only Wireless Mainly
Sources: Rutgers Center for State Health Policy, New Jersey Health Care Opinion Poll, 2007
Own Health Care Cost:
Great Difficulty Affording the Cost of Hospitals,
Doctors, or Other Health Care
(P<0.001) (N.S.)

16
13.9%
7.9%
34.1%
21.7%
38.1%
0.0%
10.0%
20.0%
30.0%
40.0%
50.0%
60.0%
Total Landline Total Wireless Wireless Only Wireless Mainly
Sources: Rutgers Center for State Health Policy, New Jersey Health Care Opinion Poll, 2007
Own Coverage:
Uninsured
(P<0.001) (P=0.019)

17
22.5%19.3%
33.1%
37.9%
18.0%
0.0%
10.0%
20.0%
30.0%
40.0%
50.0%
60.0%
Total Landline Total Wireless Wireless Only Wireless Mainly
Sources: Rutgers Center for State Health Policy, New Jersey Health Care Opinion Poll, 2007
Employment & Income:
Income Below $35,000
(P<0.001) (P=0.004)

18
33.0%36.0%
22.9%
28.1%
21.4%
0.0%
10.0%
20.0%
30.0%
40.0%
50.0%
60.0%
Total Landline Total Wireless Wireless Only Wireless Mainly
Sources: Rutgers Center for State Health Policy, New Jersey Health Care Opinion Poll, 2007
Need for Reform:
Prefer Current Health Insurance System over
Universal Insurance Program
(P<0.001) (N.S.)

19
0.0%
10.0%
20.0%
30.0%
40.0%
50.0%
60.0%
Total Landline Total Wireless Wireless Only Wireless
Mainly
Note: “not too worried” and “not at all worried” categories included in calculating significance, but not shown.
Sources: Rutgers Center for State Health Policy, New Jersey Health Care Opinion Poll, 2007
General Worry:
Being Able to Pay Rent or Mortgage
(P=0.002) (N.S.)
Somewhat
Worried
Very
Worried

20
7.3%
26.1%
7.1%
36.2%
18.0%
24.2%
28.4%
13.9%
22.5%
32.9%
12.0%
12.0%
0.0%
10.0%
20.0%
30.0%
40.0%
50.0%
60.0%
Non-Citizen in
Household
3+ Rx Drugs Difficulty
Affording Cost
Uninsured Low-Income Prefer Current
over Universal
System
Landline Only Combined Sample
*Statistically significant difference at p<0.05 level
Note: DK and REF treated as missing.
Sources: Rutgers Center for State Health Policy, New Jersey Health Care Opinion Poll, 2007
Effect of Weighting to Population DistributionsReweighted Landline-Only Compared to Combined Sample
* *

21
EMPIRICAL OBSERVATIONS
• Landline-Wireless response differences vary by domain
– Most significant differences are in demographics, health status,
coverage, health care cost, and employment & income
– Few differences in measures of support for specific policy reforms
– Post-hoc demographic (age, sex, education) weight adjustments reduce
but do not eliminate differences
• Wireless-only and -mainly responses generally similar, with
some exceptions:
– Estimate of percent uninsured among „mainly‟ respondents falls
between „only‟ and landline respondents
– Estimate of percent low-income among „mainly‟ respondents similar to
landline respondents
22
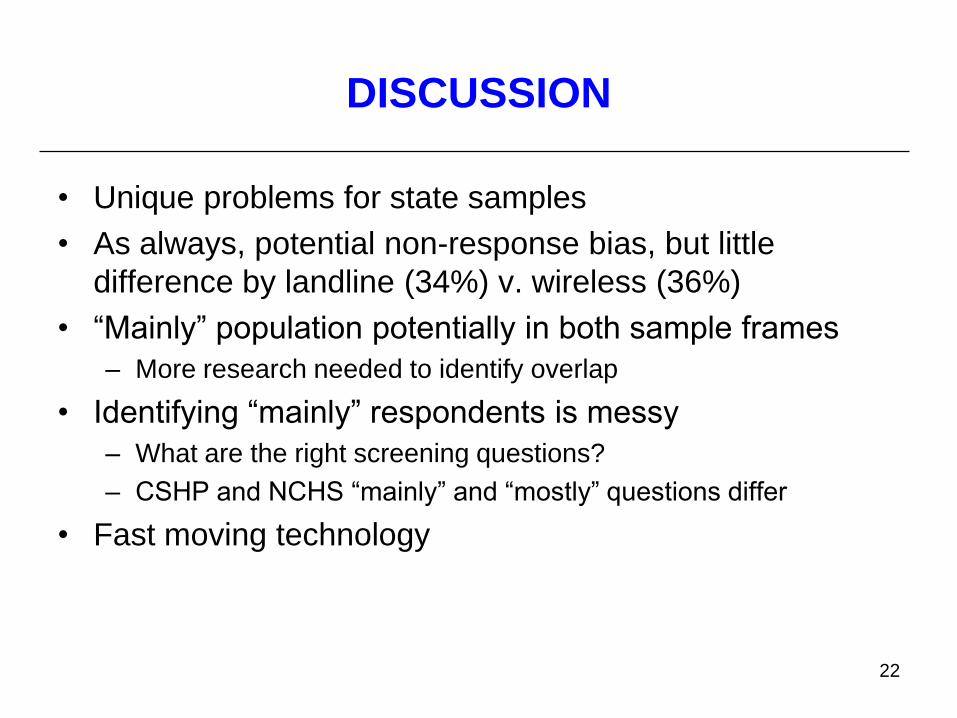
DISCUSSION
• Unique problems for state samples
• As always, potential non-response bias, but little
difference by landline (34%) v. wireless (36%)
• “Mainly” population potentially in both sample frames
– More research needed to identify overlap
• Identifying “mainly” respondents is messy
– What are the right screening questions?
– CSHP and NCHS “mainly” and “mostly” questions differ
• Fast moving technology