doag 2012 applications optimizing oracle e-business suite · pdf filedoag 2012 applications...
TRANSCRIPT

DOAG 2012 Applications Optimizing Oracle E-Business Suite
Using a KPI driven approach May 8, 2012
PwC
Agenda
1. Questions on C-Level
2. Example KPIs
3. Assessment of KPI Results
4. How to build KPIs

PwC
1. C- Level Questions on Business Processes
3
PwC
The importance of ERP to the business process
Enterprise Resource Planning systems have become the backbone of business administration tasks
Business processes are tightly “aliened” with the concepts and capabilities of the chosen ERP system in use.
As much as we pretend it would be the other way round.
So utilizing the ERP systems functions in an optimized fashion is a key success factor for corporations.
Optimizing Oracle EBS using KPIs Slide 4
May 10, 2012

PwC
What are the concerns of managment 0n ERP
Examples of Questions that C-level executives ask concerning their ERP supported business process:
I have my Financials and some Finance KPIs but,
• how are my (ERP based) business processes performing?
• how are my different entities / locations performing?
• are there hidden risks in my processes that might surface some day?
• how do other companies run their processes?
Optimizing Oracle EBS using KPIs Slide 5
May 10, 2012
PwC
How KPI`s can help managment
KPIs calculated from business process / configuration data can:
• Provide an aggregated view just right for C-level discussions
• Indicate potential for improvement
• Support / weaken arguments
• Help to monitor improvements / objectives
• Highlight unidentified or underestimated risks
During our audits we see that most companies have only implemented a rather basic use of KPIs.
Optimizing Oracle EBS using KPIs Slide 6
May 10, 2012
PwC
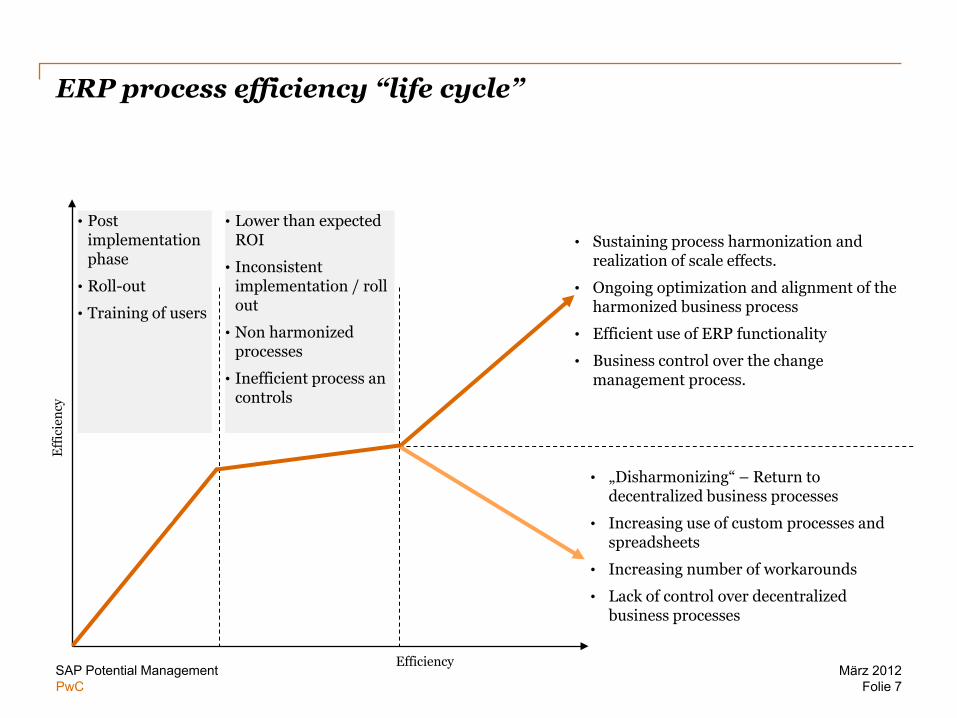
ERP process efficiency “life cycle”
• Post implementation phase
• Roll-out
• Training of users
Stab
ilitä
t und
Nut
zenr
ealis
ieru
ng
• Sustaining process harmonization and realization of scale effects.
• Ongoing optimization and alignment of the harmonized business process
• Efficient use of ERP functionality
• Business control over the change management process.
• „Disharmonizing“ – Return to decentralized business processes
• Increasing use of custom processes and spreadsheets
• Increasing number of workarounds
• Lack of control over decentralized business processes
• Lower than expected ROI
• Inconsistent implementation / roll out
• Non harmonized processes
• Inefficient process an controls
Folie 7 März 2012 SAP Potential Management
Eff
icie
ncy
Efficiency
PwC PwC
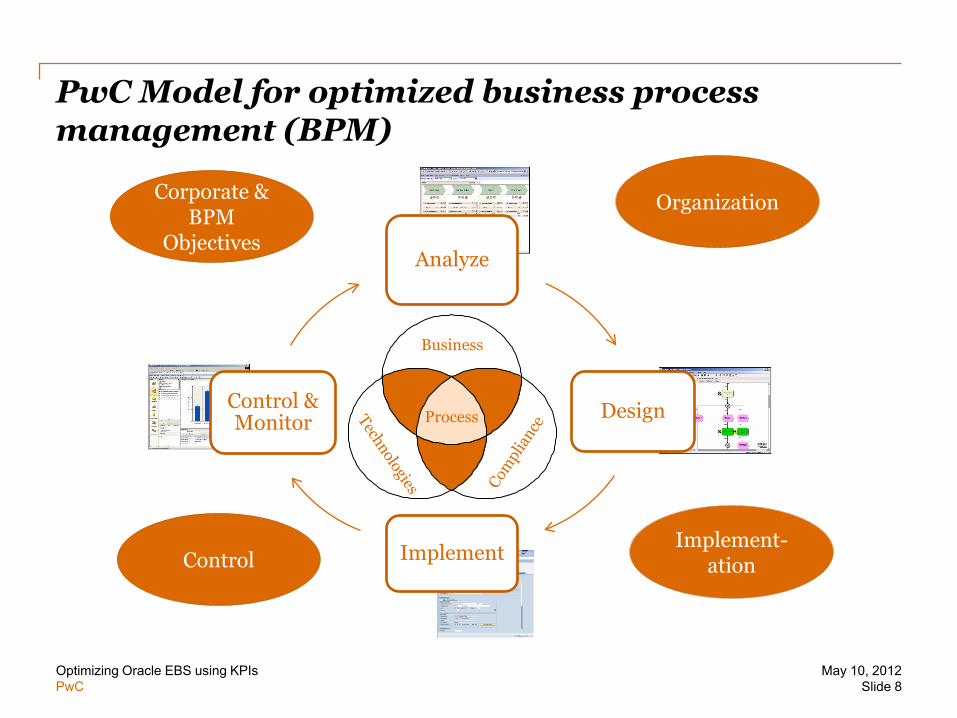
PwC Model for optimized business process management (BPM)
Process
Business
Corporate & BPM
Objectives
Organization
Implement-ation Control
Analyze
Design
Implement
Control & Monitor
Optimizing Oracle EBS using KPIs Slide 8
May 10, 2012

PwC
2. Examples of interesting KPIs
9

PwC
Example 1 - General Ledger
Metric Number of Days taken to close a period after period end This KPI measures how promptly a period is closed after the month end, where the closing date is the date when the GL period was closed.
Potential Impact and Root Cause
The number of days taken to close the General Ledger can be impacted by the following: • days taken to close the respective sub-ledger periods; • number of manual journals booked; and • lack of automation in closing activities (i.e., concurrent programs that must be manually initiated by the end user)
ATVI Comparison to other clients
5 days 38 days
Low High ATVI
34 days
10
PwC Experience:
PwC
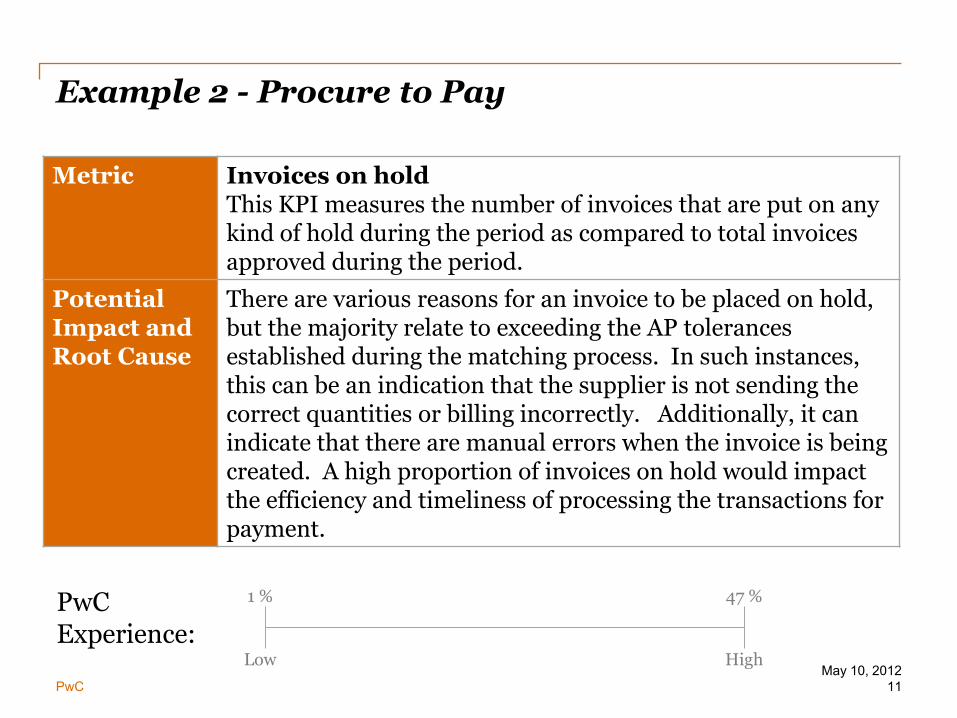
Example 2 - Procure to Pay
Metric Invoices on hold This KPI measures the number of invoices that are put on any kind of hold during the period as compared to total invoices approved during the period.
Potential Impact and Root Cause
There are various reasons for an invoice to be placed on hold, but the majority relate to exceeding the AP tolerances established during the matching process. In such instances, this can be an indication that the supplier is not sending the correct quantities or billing incorrectly. Additionally, it can indicate that there are manual errors when the invoice is being created. A high proportion of invoices on hold would impact the efficiency and timeliness of processing the transactions for payment.
1 % 47 %
Low High ATVI
14 %
11
PwC Experience:
May 10, 2012

PwC
Example 3 - Procure to Pay
Metric PTP - KPI 02-PO Approval Time This KPI measures the average time (in days) it takes for a PO to be approved after it has been created.
Potential Impact and Root Cause
This KPI gives an indication of the efficiency of the procurement process. If the PO is not approved, the system will prevent the PO from progressing in the procurement process, which in turn may impact the supply chain. A high proportion can be an indication that management has too stringent rules for PO approvals. For example: • Low valuePOs require approval; • There are several layers of approval; or • Limited individuals (e.g., small buyer group, one controller) have authority to approve, thereby creating backlog of POs.
1.6 days 38 days
Low High ATVI
7 days
12
PwC Experience:
May 10, 2012
PwC
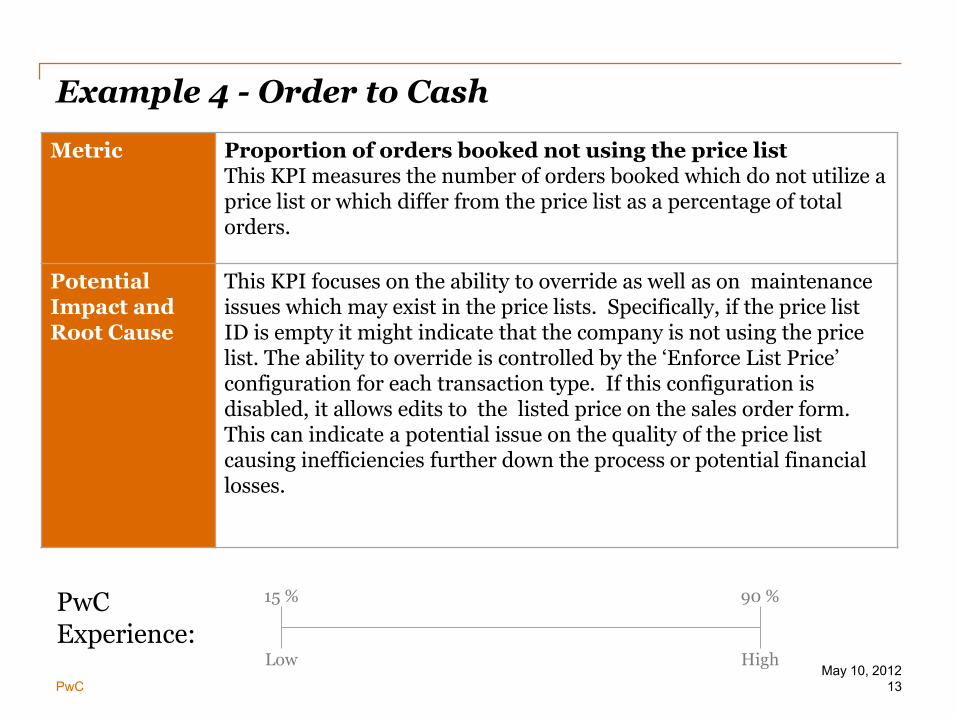
Example 4 - Order to Cash
Metric Proportion of orders booked not using the price list This KPI measures the number of orders booked which do not utilize a price list or which differ from the price list as a percentage of total orders.
Potential Impact and Root Cause
This KPI focuses on the ability to override as well as on maintenance issues which may exist in the price lists. Specifically, if the price list ID is empty it might indicate that the company is not using the price list. The ability to override is controlled by the ‘Enforce List Price’ configuration for each transaction type. If this configuration is disabled, it allows edits to the listed price on the sales order form. This can indicate a potential issue on the quality of the price list causing inefficiencies further down the process or potential financial losses.
15 % 90 % 82 %
Low High Average ATVI 13
PwC Experience:
May 10, 2012
PwC
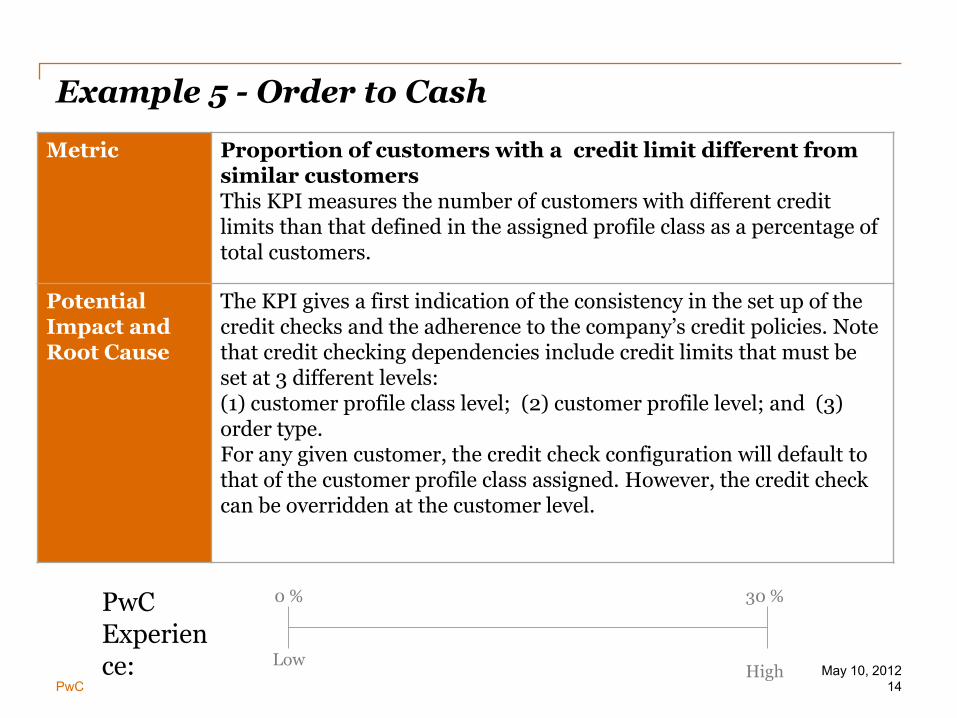
Example 5 - Order to Cash
Metric Proportion of customers with a credit limit different from similar customers This KPI measures the number of customers with different credit limits than that defined in the assigned profile class as a percentage of total customers.
Potential Impact and Root Cause
The KPI gives a first indication of the consistency in the set up of the credit checks and the adherence to the company’s credit policies. Note that credit checking dependencies include credit limits that must be set at 3 different levels: (1) customer profile class level; (2) customer profile level; and (3) order type. For any given customer, the credit check configuration will default to that of the customer profile class assigned. However, the credit check can be overridden at the customer level.
ATVI Comparison to other clients 0 % 33 %
Low High
ATVI 14 High
30 % PwC Experience: May 10, 2012
PwC
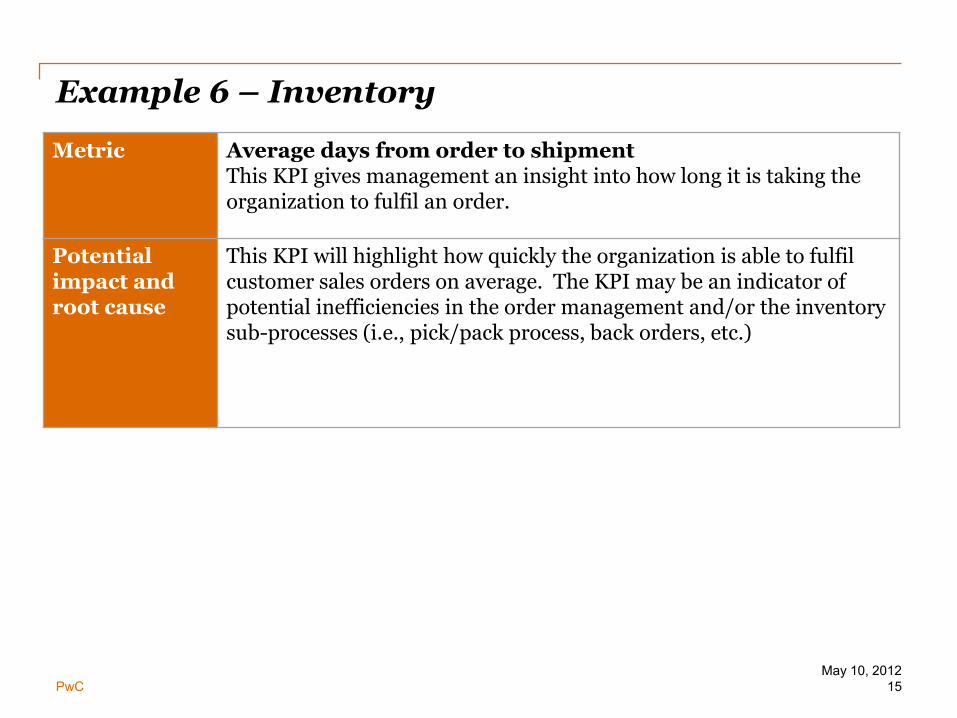
Example 6 – Inventory
Metric Average days from order to shipment This KPI gives management an insight into how long it is taking the organization to fulfil an order.
Potential impact and root cause
This KPI will highlight how quickly the organization is able to fulfil customer sales orders on average. The KPI may be an indicator of potential inefficiencies in the order management and/or the inventory sub-processes (i.e., pick/pack process, back orders, etc.)
15 May 10, 2012

PwC
Example 7 - Inventory
Metric Inventory organizations allowing negative balances This KPI gives management an insight into whether inventory organizations are allowed to have negative balances.
Potential Impact and Root Cause
This KPI will highlight the proportion of inventory organizations where the ‘Allow Negative Balances‘ configuration is enabled. Negative balances can be created if shipments are processed before receipts. A high KPI value indicates that the organization allows inventory items to become negative when there is not enough inventory on-hand.
0 % 26 %
Low High ATVI
13 %
16
PwC Experience: May 10, 2012

PwC
Example 8 - Fixed Assets
Metric The number of assets where the automatically calculated depreciation has been manually overridden This KPI measures the number of assets where the depreciation expense has been overridden through use of the Oracle "Depreciation Override" functionality.
Potential Impact and Root Cause
Oracle provides an option for end-users to correct errors or update financial information for a single asset or a group of assets. Users have the ability to override depreciation information for an asset while adding it using the "Detail Additions" process. A high number of manual depreciation overrides could be an indication of process inefficiencies that require manual interventions.
0 xx%
Low High ATVI
14
17
PwC Experience: May 10, 2012
PwC
3. Assessment of KPI results
18
PwC PwC
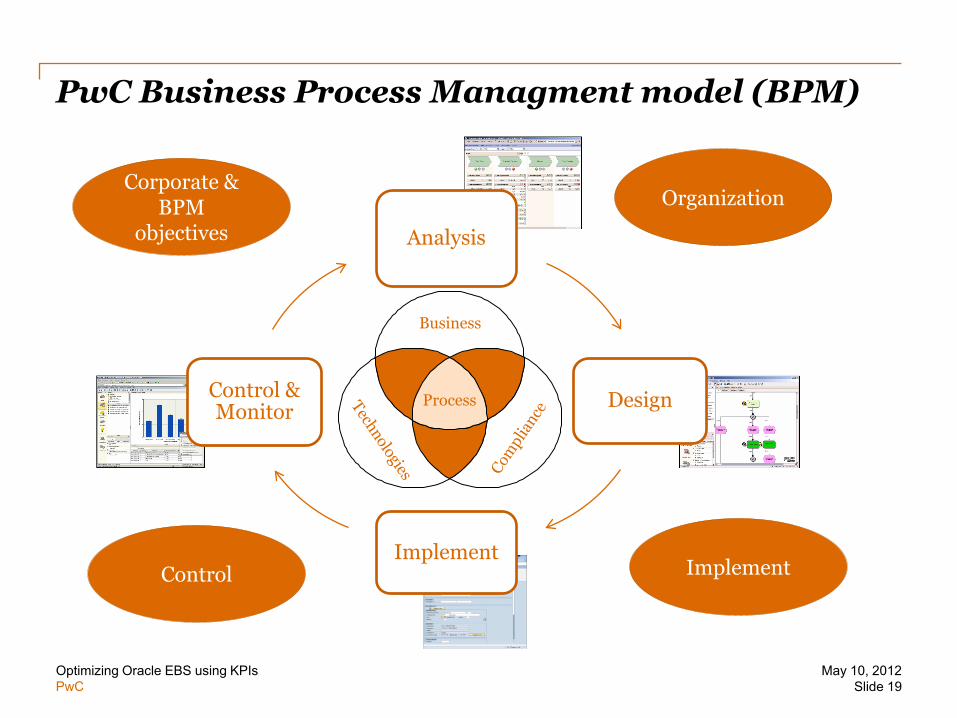
Analysis
Design
Implement
Control & Monitor
PwC Business Process Managment model (BPM)
Process
Business
Corporate & BPM
objectives
Organization
Implement Control
Optimizing Oracle EBS using KPIs Slide 19
May 10, 2012
PwC
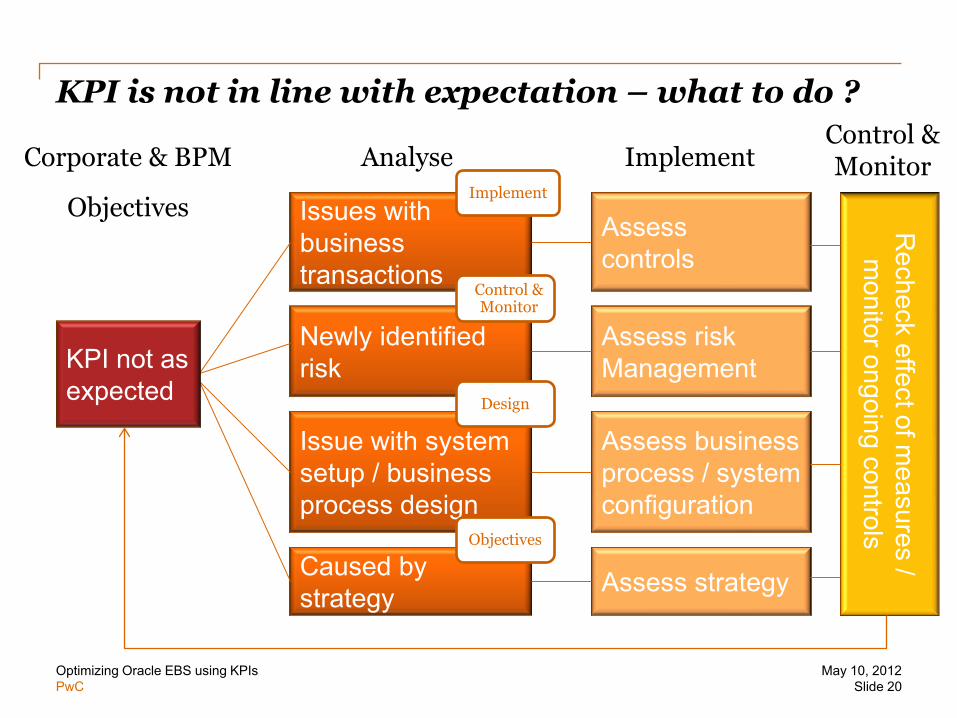
KPI is not in line with expectation – what to do ?
Optimizing Oracle EBS using KPIs Slide 20
May 10, 2012
Caused by strategy
Assess controls
Issue with system setup / business process design
Assess risk Management
Newly identified risk
Issues with business transactions
Analyse Implement
Assess business process / system configuration
Assess strategy
Control & Monitor
Recheck effect of m
easures / m
onitor ongoing controls
Corporate & BPM
Objectives
Control & Monitor
Implement
Design
Objectives
KPI not as expected
PwC
4. How to build KPIs
21
PwC
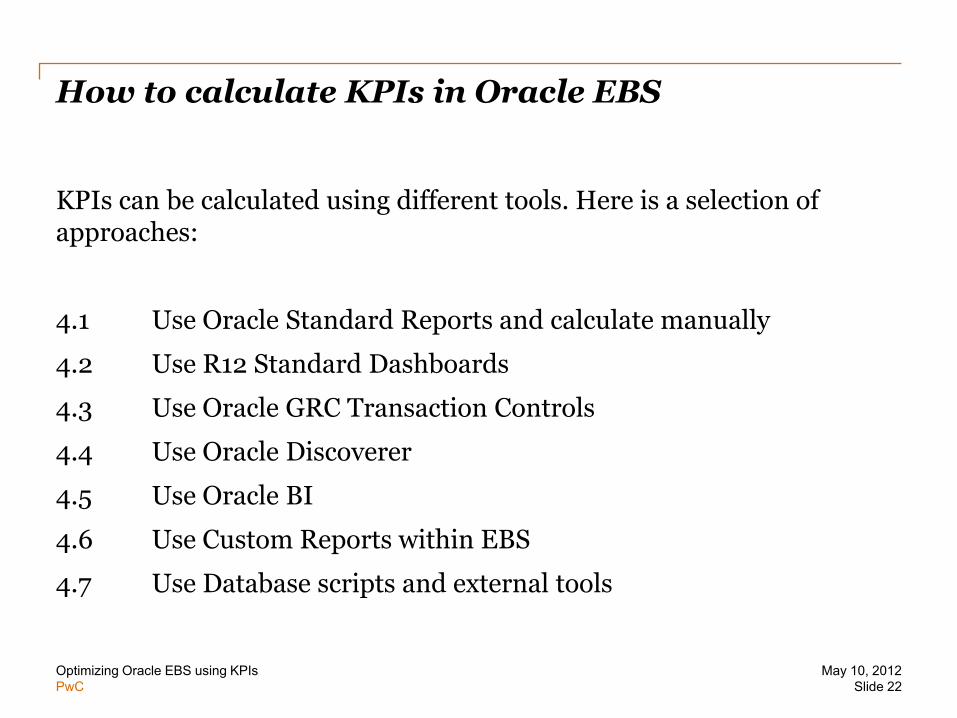
How to calculate KPIs in Oracle EBS
KPIs can be calculated using different tools. Here is a selection of approaches:
4.1 Use Oracle Standard Reports and calculate manually
4.2 Use R12 Standard Dashboards
4.3 Use Oracle GRC Transaction Controls
4.4 Use Oracle Discoverer
4.5 Use Oracle BI
4.6 Use Custom Reports within EBS
4.7 Use Database scripts and external tools
Optimizing Oracle EBS using KPIs Slide 22
May 10, 2012
PwC
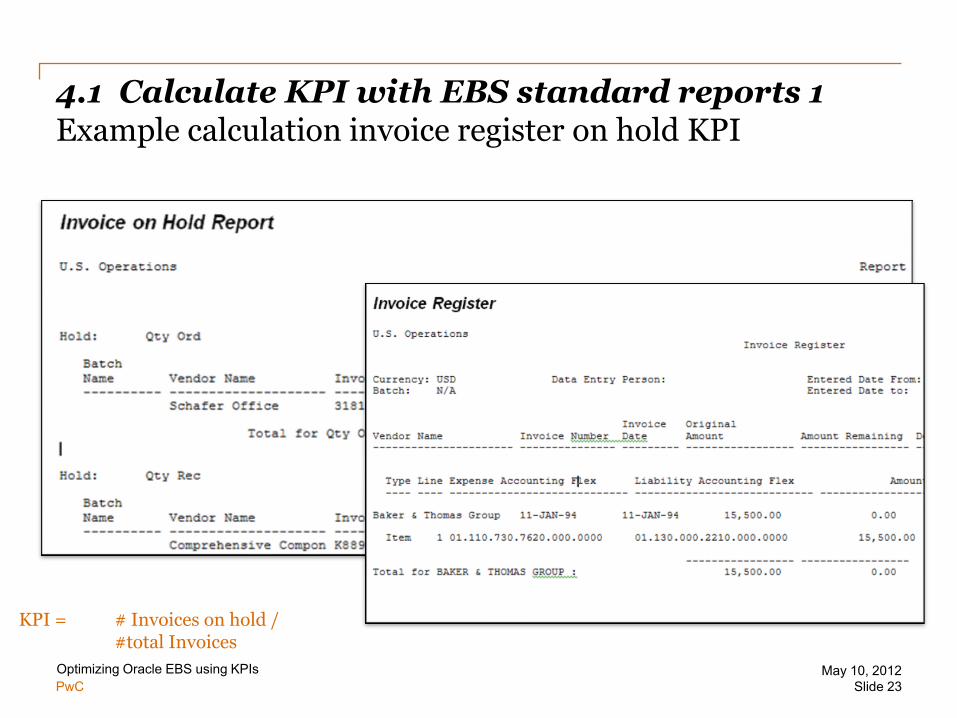
4.1 Calculate KPI with EBS standard reports 1 Example calculation invoice register on hold KPI
Optimizing Oracle EBS using KPIs Slide 23
May 10, 2012
KPI = # Invoices on hold / #total Invoices
PwC
4.1 Calculate KPIs with standard reports 2 Example calculate invoice register on hold KPI
Optimizing Oracle EBS using KPIs Slide 24
May 10, 2012
Advantages:
• End User can calculate KPIs easy and on their own
• Great variation in all business areas
Disadvantages:
• Time consuming
• Prone to errors
• Results not multi user accessible
This approach is a solution for (ad hoc) one time analysis of interesting or critical topics.
PwC
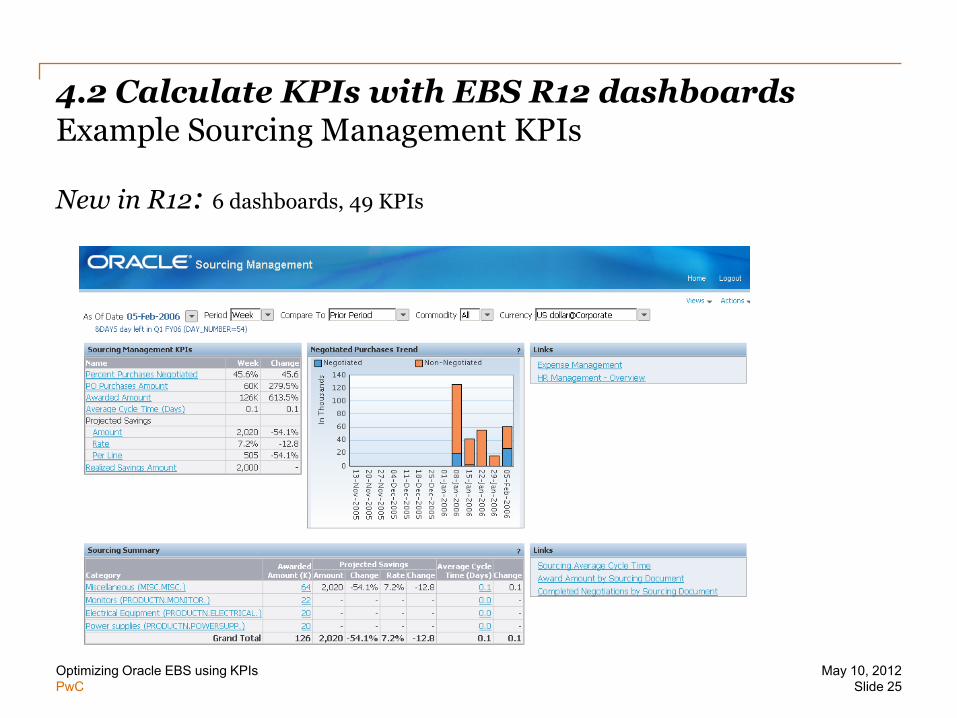
4.2 Calculate KPIs with EBS R12 dashboards Example Sourcing Management KPIs
New in R12: 6 dashboards, 49 KPIs
Optimizing Oracle EBS using KPIs Slide 25
May 10, 2012
PwC
4.2 Calculate KPIs with EBS R12 dashboards
Optimizing Oracle EBS using KPIs Slide 26
May 10, 2012
Advantages:
• Out of the Box
• Mostly done real time
• Multi-User Capable
Disadvantages:
• Not very flexible
This approach should be the first choice to be utilized because it comes out of the box with every Oracle EBS R12 installation.

PwC
4.3 Use Oracle Transaction Controls Governor
Optimizing Oracle EBS using KPIs Slide 27
May 10, 2012
The Oracle Transaction Controls Governor is a component of the „Oracle Governance Risk and Compliance Controls Solutions package“.

PwC
4.3 Use Oracle Governor Transaction Controls Miscellaneous payments
Optimizing Oracle EBS using KPIs Slide 28
May 10, 2012
The share of Miscellaneous payments can be calculated from the number of all payments / Miscellaneous payments
Advantage: You can choose from a library of controls and critical business objects.

PwC
4.3 Use Oracle Governor Transaction Controls Advantages / Disadvantages
Optimizing Oracle EBS using KPIs Slide 29
May 10, 2012
Advantages:
• Efficient analysis of transactions
• Flexible filters for transactions
• Library of transaction objects – objects can be custom-defined.
• GRC can do a lot more for you than just KPIs.
Disadvantages:
• Cannot calculate KPIs directly
• Not multi-user capable when speaking of KPIs as they have to be calculated manually.
This approach is the best solution for transactions that have been identified for monitoring, but also one-time manual KPI calculations are reasonable.
PwC
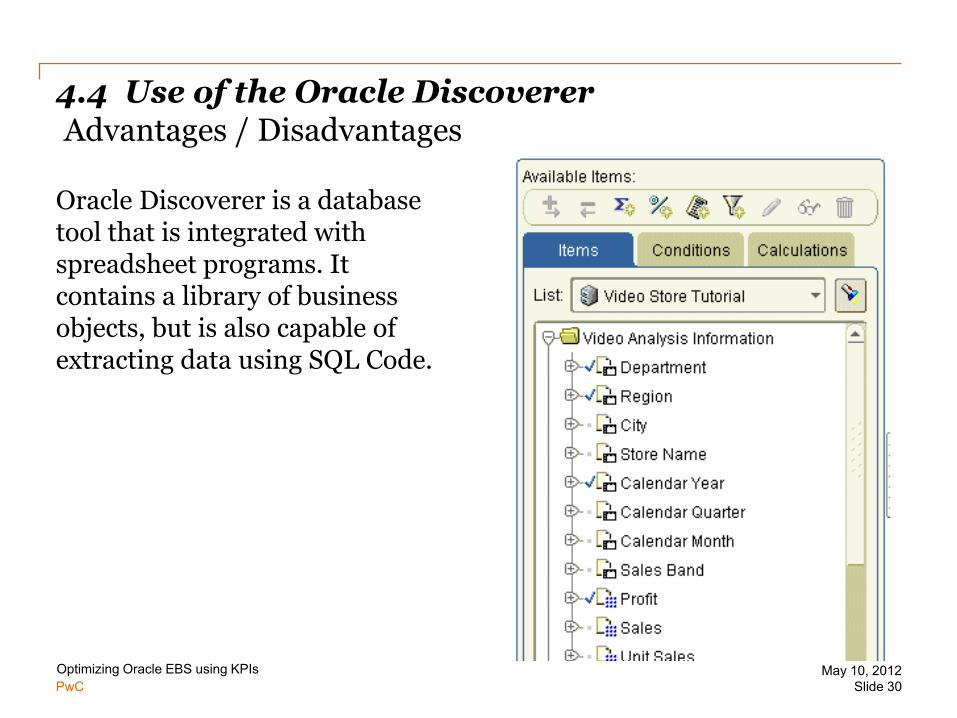
4.4 Use of the Oracle Discoverer Advantages / Disadvantages
Optimizing Oracle EBS using KPIs Slide 30
May 10, 2012
Oracle Discoverer is a database tool that is integrated with spreadsheet programs. It contains a library of business objects, but is also capable of extracting data using SQL Code.
PwC
4.4 Use of the Oracle Discoverer
Optimizing Oracle EBS using KPIs Slide 31
May 10, 2012
Advantages:
• Can calculate KPIs directly
• Fully flexible – SQL code can be used
• Predefined objects are available
• Multi-user capable
Disadvantages:
• High manual effort to set up KPI workbooks
• Can cause massive runtime on database of production environment
This approach is a good solution for ad-hoc testing of KPIs, data mining and development of new KPIs. From its nature Oracle Discoverer is rather a key user / developer tool.

PwC
4.5 Use of special BPM tools
Optimizing Oracle EBS using KPIs Slide 32
May 10, 2012
Tools like Oracle BI is the Business Intelligence (data warehouse) solution from Oracle, Hyperion Planning or Oracle Business Activity Monitoring (Oracle BAM) are available. The special tools provide featres like
- multidimensional reporting ,
- dashboard presentation of KPIs or even
- Simulation of Business processes.
Data from multiple sources can be uploaded and reported seamlessly.

PwC
4.5 Use special BPM tools Advantages / Disadvantages
Optimizing Oracle EBS using KPIs Slide 33
May 10, 2012
Advantages:
• Most professional solutions for KPI calculation and presentation
• High performance (fast)
• Multi user capable
• Flexible web reporting, dashboards etc...
Disadvantages:
• Considerable high IT investment and operation cost
• High investment in configuration ( e.g. ETL – Extraction Transformation Load process)
BI is the superior solution for the ongoing monitoring of KPIs identified as being business critical, e.g. KPIs form Balanced Scorecards etc ...
PwC
4.6 Use Custom EBS Reports to calculate KPIs
Optimizing Oracle EBS using KPIs Slide 34
May 10, 2012
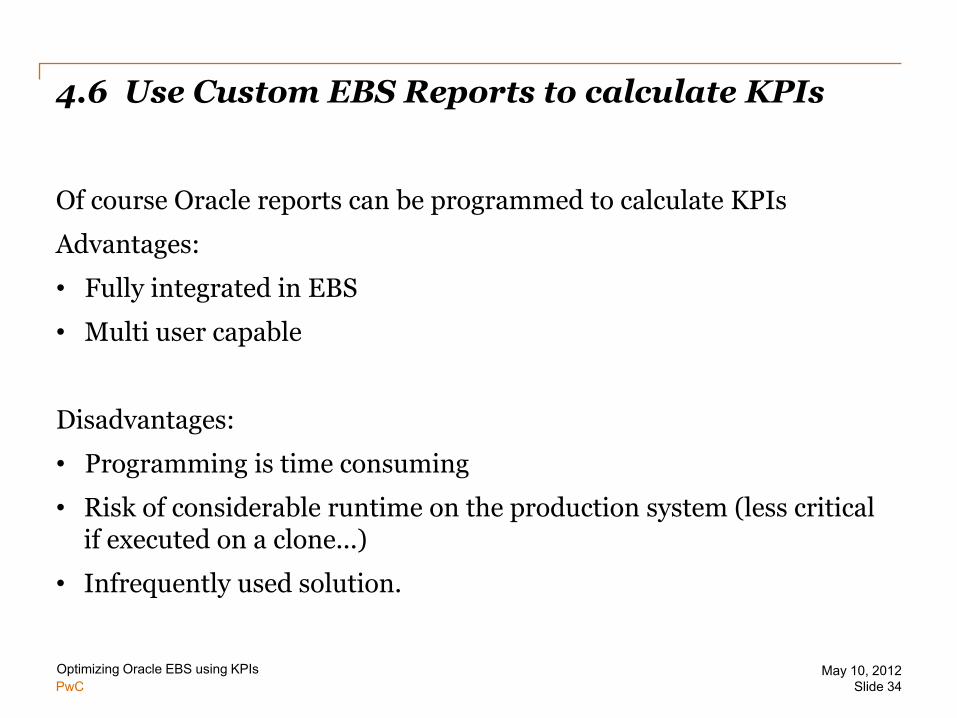
Of course Oracle reports can be programmed to calculate KPIs
Advantages:
• Fully integrated in EBS
• Multi user capable
Disadvantages:
• Programming is time consuming
• Risk of considerable runtime on the production system (less critical if executed on a clone...)
• Infrequently used solution.
PwC
4.7 Use of SQL scripts and external analysis tools
Optimizing Oracle EBS using KPIs Slide 35
May 10, 2012
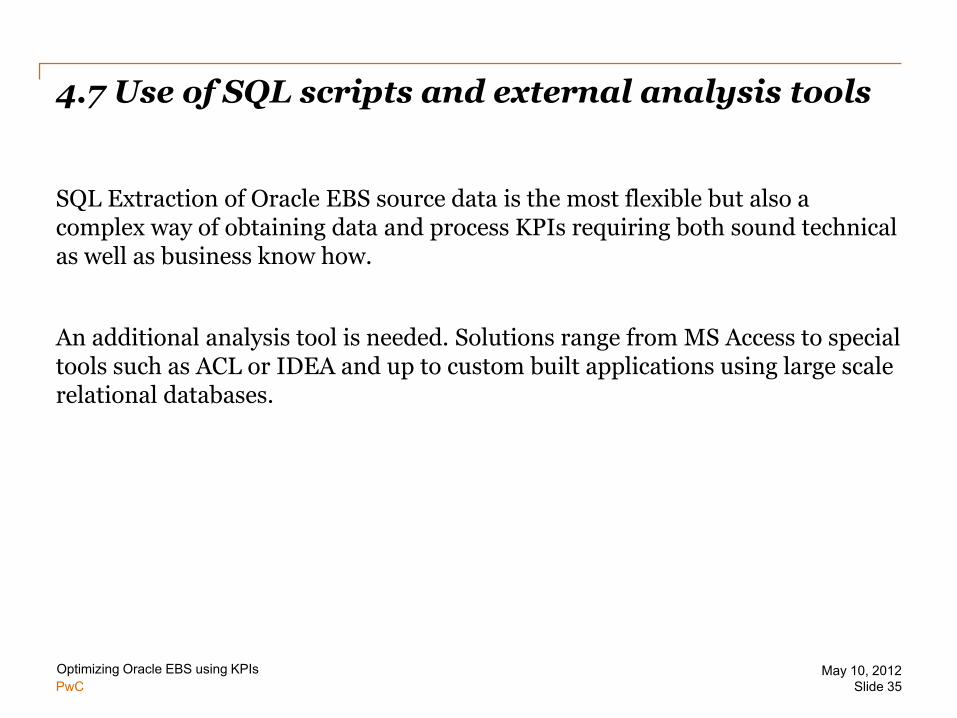
SQL Extraction of Oracle EBS source data is the most flexible but also a complex way of obtaining data and process KPIs requiring both sound technical as well as business know how.
An additional analysis tool is needed. Solutions range from MS Access to special tools such as ACL or IDEA and up to custom built applications using large scale relational databases.
PwC
4.7 Use SQL scripts and analysis tools Advantages / Disadvantages
Optimizing Oracle EBS using KPIs Slide 36
May 10, 2012
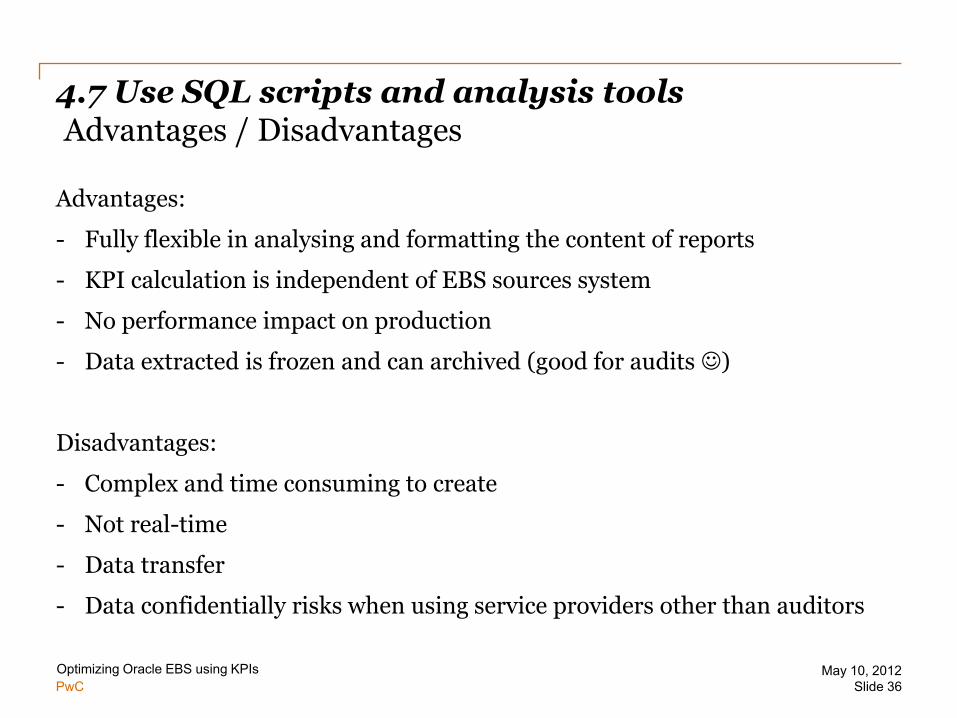
Advantages:
- Fully flexible in analysing and formatting the content of reports
- KPI calculation is independent of EBS sources system
- No performance impact on production
- Data extracted is frozen and can archived (good for audits )
Disadvantages:
- Complex and time consuming to create
- Not real-time
- Data transfer
- Data confidentially risks when using service providers other than auditors
PwC
4.7 Use SQL plus scripts and Analysis tools Example: PwC „Utilization“ for Oracle EBS
Optimizing Oracle EBS using KPIs Slide 37
May 10, 2012
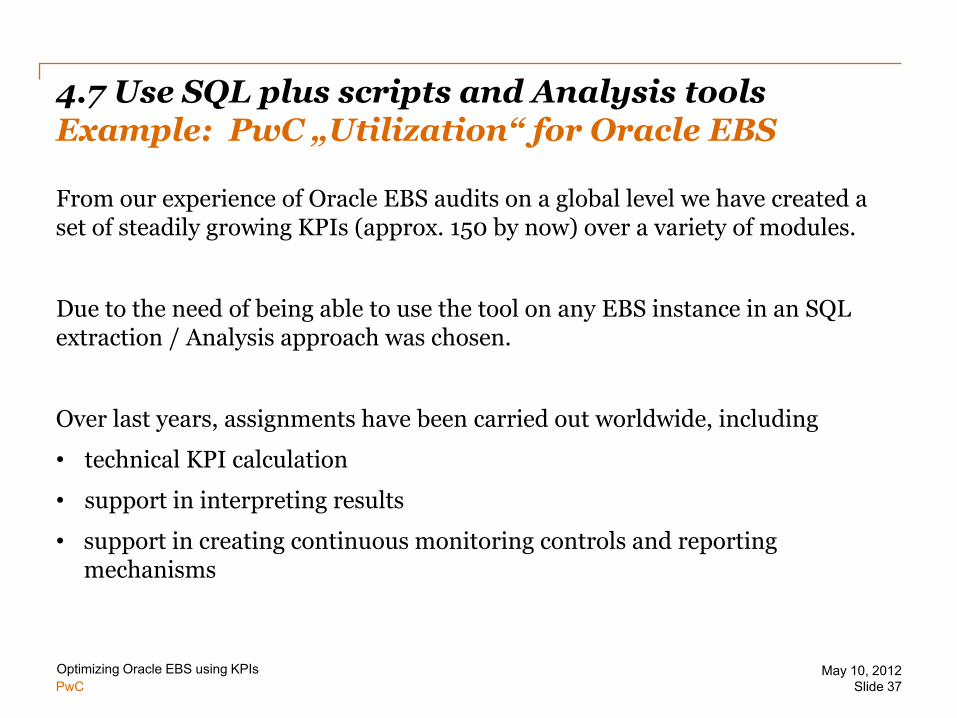
From our experience of Oracle EBS audits on a global level we have created a set of steadily growing KPIs (approx. 150 by now) over a variety of modules.
Due to the need of being able to use the tool on any EBS instance in an SQL extraction / Analysis approach was chosen.
Over last years, assignments have been carried out worldwide, including
• technical KPI calculation
• support in interpreting results
• support in creating continuous monitoring controls and reporting mechanisms

„If you stop getting better you stop being good”
© 2012 PricewaterhouseCoopers. All rights reserved. “PricewaterhouseCoopers” refers to the network of member firms of PricewaterhouseCoopers International Limited, each of which is a separate and independent legal entity.
Your PwC Oracle EBS contacts in Germany Daniela Geretshuber Senior Manager PricewaterhouseCoopers AG Wirtschaftsprüfungsgesellschaft Bernhard-Wicki-Str. 8 80636 Munich Phone +49 89.5790 5515 [email protected]
Alexander Götz Manager PricewaterhouseCoopers AG Wirtschaftsprüfungsgesellschaft Bernhard-Wicki-Str. 8 80636 Munich Phone + 49 89.5790 5655 [email protected]