doc.: ieee 802.11-03/0682-00-000k submission september 2003 brian johnson, nortel networks 802.11a...
TRANSCRIPT
September 2003
Brian Johnson, Nortel Networks
doc.: IEEE 802.11-03/0682-00-000k
Submission
802.11a Performance Over Various Channels
9 September 2003Presenter: Brian Johnson
Co-authors: Laura Huang, Brian Johnson, Dannielle Tadas, Moshe Stoler

September 2003
Brian Johnson, Nortel Networks
doc.: IEEE 802.11-03/0682-00-000k
Submission
Outline• Purpose
• Simulation Methodology
• PHY results, different channels
• Variation in SNR over fading channels
• Expected Throughput Defined
• Throughput vs. avg. SNR, different channels
• Summary/Recommendations
• References

September 2003
Brian Johnson, Nortel Networks
doc.: IEEE 802.11-03/0682-00-000k
Submission
• Background:– We had questions about the performance of .11a in both indoor and
outdoor environments at both link level and system level.– Through series of steps, have built a system level simulation
infrastructure for WLAN performance analysis.• This included extensive 802.11a PHY simulations using a
MATLAB PHY model.• Added flexible channel model code to implement SUI and
HYPERLAN/2 and other fading channel models.
• Present contribution will– Provide and overview of simulation results, observations, and
conclusions relating signal quality to performance.– Make recommendations on evaluation of useful signal quality
measurement and reporting methods.
Purpose

September 2003
Brian Johnson, Nortel Networks
doc.: IEEE 802.11-03/0682-00-000k
Submission
• Background:– Contribution IEEE 802.11-03/218r2 introduced PSNI concept and
suggested desired properties of such a signal quality measure.– Contribution IEEE 802.11-03/531 presented some results on EVM as
candidate PSNI measure. Conclusion drawn was negative on EVM and on PSNI concept due to apparent large variation in PER vs. EVM for different simulation conditions.
– Contribution 802.11-03/638 presented some results on EVM. Introduced std. deviation of EVM to correct for fading channel effects on EVM vs. BER for 6Mbs .11a receiver. Conclusion positive on modified EVM as candidate PSNI
• Present contribution will– Present OFDM FER vs Avg SNR for several data rates and channels.– Look at variation in short term SNR for fading channels.– Introduce concept of Expected Throughput and Maximum Expected
Throughput. Show variation in Max Expected Throughput over Avg SNR range for several channels.
Purpose

September 2003
Brian Johnson, Nortel Networks
doc.: IEEE 802.11-03/0682-00-000k
Submission
Outline• Purpose
• Simulation Methodology
• PHY results, different channels
• Variation in SNR over fading channels
• Expected Throughput Defined
• Throughput vs. avg. SNR, different channels
• Summary/Recommendations
• References

September 2003
Brian Johnson, Nortel Networks
doc.: IEEE 802.11-03/0682-00-000k
Submission
802.11a PHY Simulations
• 802.11a PHY model based on MATLAB code from: “OFDM Wireless LANs: A Theoretical and Practical Guide”, by J. Heiskala and J. Terry, ISBN 0-672-32157-2.
• Matlab code is modified to incorporate different fading channels
• Packet detection algorithm is tuned to improve packet detection probability
• No phase noise or frequency error injected in the signal. Phase and Frequency tracking loops are running in receiver.
• No antenna diversity used in simulation
• Fading coefficients are constant over each frame and are independent for each frame. No doppler in the channel model.
• Average SNR is set in channel simulator and is fixed for simulation run. Instantaneous SNR is measured exactly in the channel simulator for every frame at runtime.

September 2003
Brian Johnson, Nortel Networks
doc.: IEEE 802.11-03/0682-00-000k
Submission
802.11a PHY Simulations
AWGN channel Least challenging. Similar to pure line of sight (LOS).
HIPERLAN/2 Channel 1
(modified)
Multi-path 9-tap Raleigh fading model with delay spread up to the 0.4usec OFDM guard time. Challenging indoor office channel model (NLOS) with short delay spread.
802.16 SUI-1 Multi-path 3 tap mixed raleigh and LOS fading model. First tap has strong LOS component, others pure raleigh. Short delay spread up to 0.9usec. Models a good LOS outdoor channel. Some signal energy exceeds OFDM guard time.
802.16 SUI-5 Multi-path 3-tap rayleigh fading model with delay spread up to 10usec. This is challenging non-LOS outdoor channel. 10usec maximum delay spread exceeds 802.11a OFDM guard time significantly.
Other SISO channel models
Easy to implement other channel models. Define the taps, their relative powers, and distribution (fixed, raleigh, rician).

September 2003
Brian Johnson, Nortel Networks
doc.: IEEE 802.11-03/0682-00-000k
Submission
802.11a PHY SimulationsTable description of channel models usedDoppler speed for Hyp/2 ch1 is 3m/s or 6.7mi/hr (approximately 53Hz based on 5.3 GHz carrier frequency,
coherence time is 18.87ms roughly)
Doppler for SUI-1 and SUI-5 range up to 2.5 Hz (coherence time is 400ms roughly).
Largest IP packet size 1536 bytes transmitted at 6Mbps lasts about 2.048ms. Coherence time is much greater than the packet duration.
SUI-1 Channel
Delay (us) 0 0.4 0.9
Relative Power (dB) 0 -15 -20
Ricean K factor (linear) 4 0 0
SUI-5 Channel
Delay (us) 0 4 10
Relative Power (dB) 0 -5 -10
Ricean K factor (linear) 0 0 0
Modified HYPERLAN/2 Channel 1
Delay (us) 0 0.05 0.1 0.15 0.2 0.25 0.3 0.35 0.4
Relative Power (dB) 0 -4.3 -6.25 -8.17 -12.5 -14.56 -18.88 -23.26 -27.5
Ricean K factor (linear) 0 0 0 0 0 0 0 0 0

September 2003
Brian Johnson, Nortel Networks
doc.: IEEE 802.11-03/0682-00-000k
Submission
802.11a PHY Simulations
• List of simulation runs– AWGN channel
• Frame sizes 76 bytes, 1000 bytes, 1536 bytes• All 8 data rates• SNR ranges to generate 10e-1 to 0 FER• Collected Avg. FER, Avg. BER
– Fading channel• SUI-1, SUI-5 and HYP1 channel• Frame sizes 76 bytes, 1000 bytes, 1536 bytes• All 8 data rates• SNR ranges to generate 10e-1 to 10e-3 FER approximately• Collected Avg. FER, Avg. BER, SNR per Packet statistics.

September 2003
Brian Johnson, Nortel Networks
doc.: IEEE 802.11-03/0682-00-000k
Submission
Outline• Purpose
• Simulation Methodology
• PHY results, different channels
• Variation in SNR over fading channels
• Expected Throughput Defined
• Throughput vs. avg. SNR, different channels
• Summary/Recommendations
• References

September 2003
Brian Johnson, Nortel Networks
doc.: IEEE 802.11-03/0682-00-000k
Submission
6Mbps PHY perf over 4 channel models.Average FER vs. Average SNR, 1000 byte frame size
• All cases except HYP1 Perf ch. Are simulated with the full receiver algorithm running including channel estimation and tracking loops
• The exception case HYP1 Perf ch. is the same channel as HYPERLAN/2 CH1 except perfect channel estimation is used in the receiver

September 2003
Brian Johnson, Nortel Networks
doc.: IEEE 802.11-03/0682-00-000k
Submission
24Mbps PHY perf over 4 channel models.
Average FER vs. Average SNR, 1000 byte frame size
• All cases except HYP1 Perf ch. Are simulated with the full receiver algorithm running including channel estimation and tracking loops
• The exception case HYP1 Perf ch. is the same channel as HYPERLAN/2 CH1 except perfect channel estimation is used in the receiver

September 2003
Brian Johnson, Nortel Networks
doc.: IEEE 802.11-03/0682-00-000k
Submission
OBSERVATIONS:• In all cases except the very worst conditions, AWGN
shows better performance than fading channels. • Fading channel FER curves have a different slope than
AWGN curves• The SUI5 channel’s large delay spread causes the
performance of the .11a receiver to collapse. A good PSNI measure should capture this effect. Receiver SNR estimation after symbol detection should detect ISI as increased noise level. Need to confirm this for candidate SNR estimators using several channels w/maximum delay spread greater than the OFDM symbol guard time.
• The HYP1 perfect channel knowledge is uniformly better than using the channel estimation algorithms. This indicates the receiver channel estimation algorithms are introducing a roughly fixed amount of additional noise.

September 2003
Brian Johnson, Nortel Networks
doc.: IEEE 802.11-03/0682-00-000k
Submission
Outline• Purpose
• Simulation Methodology
• PHY results, different channels
• Variation in SNR over fading channels
• Expected Throughput Defined
• Throughput vs. avg. SNR, different channels
• Summary/Recommendations
• References

September 2003
Brian Johnson, Nortel Networks
doc.: IEEE 802.11-03/0682-00-000k
Submission
• So far, all data presented w.r.t Avg. SNR.
• For slow fading channels, the SNR changes in time, but is approximately constant over a single frame if the frame duration is less than the coherence time of the channel.
• For each simulated frame over a fading channel, an independent set of fading coefficients is generated in the channel model. This is valid for frames separated by more than the coherence time of the channel.
• For a fading channel with given Avg. SNR, what is the variation in the “Instantaneous SNR”, or the SNR for a given frame?
• For each simulation over a fading channel, we measured the exact SNR of each frame and captured a histogram.

September 2003
Brian Johnson, Nortel Networks
doc.: IEEE 802.11-03/0682-00-000k
Submission
Histogram of # of Packets with a given Instantaneous SNR.– Modified HYPERLAN/2 channel 1 with average SNR 4dB, 6Mbps– Instantaneous SNR ranges from -7.5dB to 10.6dB approximately– Note that this histogram includes packets with detection error, packet not
detectable if instantaneous SNR below 0dB.

September 2003
Brian Johnson, Nortel Networks
doc.: IEEE 802.11-03/0682-00-000k
Submission
Histogram of # of Packets with a given Instantaneous SNR.– Modified HYPERLAN/2 channel 1 with average SNR 16dB, 24Mbps– Instantaneous SNR ranges from 5.8dB to 22.6dB approximately

September 2003
Brian Johnson, Nortel Networks
doc.: IEEE 802.11-03/0682-00-000k
Submission
• Assuming a fading channel with fixed avg. SNR. Even if we could measure the SNR perfectly for each frame, there will still be significant variation in the Instantaneous SNR measured for each frame.
• Need average of several frames of measurement, spaced by more than the channel coherence time, to get different values for the fading coefficients and reduce variation in estimate of the Avg. SNR.
• There will always be a tradeoff between the accuracy of any Avg. SNR estimate and the total measurement time.
• In some cases, relying on a single frame measurement may be a case of “some information is better than none”.
• This variation will show up for any proposed PSNI measure.

September 2003
Brian Johnson, Nortel Networks
doc.: IEEE 802.11-03/0682-00-000k
Submission
Outline• Purpose
• Simulation Methodology
• PHY results, different channels
• Variation in SNR over fading channels
• Expected Throughput Defined
• Throughput vs. avg. SNR, different channels
• Summary/Recommendations
• References
September 2003
Brian Johnson, Nortel Networks
doc.: IEEE 802.11-03/0682-00-000k
Submission
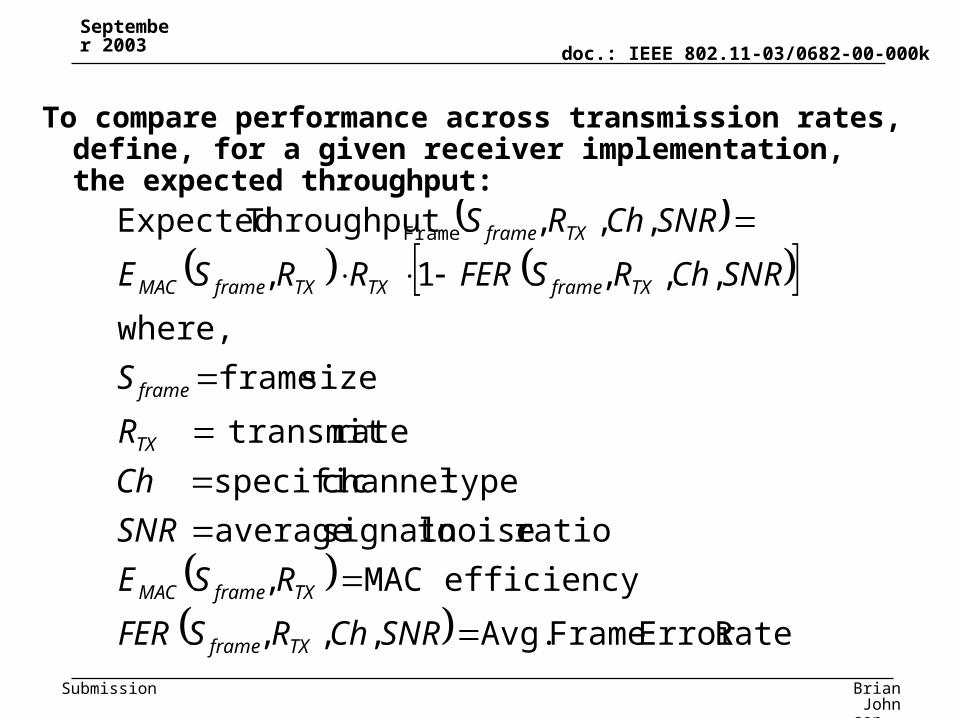
To compare performance across transmission rates, define, for a given receiver implementation, the expected throughput:
RateError Frame Avg. ,,,
efficiency MAC ,
ratio noise tosignal average
typechannel specific
rate transmit
size frame
where,
,,,1,
,,,Throughput Expected Frame
SNRChRSFER
RSE
SNR
Ch
R
S
SNRChRSFERRRSE
SNRChRS
TXframe
TXframeMAC
TX
frame
TXframeTXTXframeMAC
TXframe

September 2003
Brian Johnson, Nortel Networks
doc.: IEEE 802.11-03/0682-00-000k
Submission
An alternative definition eliminates frame size and MAC efficiency:
RateError Bit Data Avg. ,,
ratio noise tosignal average
typechannel specific
rate transmit
where,
,,1
,,Throughput Expected Bit
SNRChRBER
SNR
Ch
R
SNRChRBERR
SNRChR
TX
TX
TXTX
TX
Results to follow will be based on the first definition of Expected Throughput using 1k byte frame size.
September 2003
Brian Johnson, Nortel Networks
doc.: IEEE 802.11-03/0682-00-000k
Submission
Outline• Purpose
• Simulation Methodology
• PHY results, different channels
• Variation in SNR over fading channels
• Expected Throughput Defined
• Throughput vs. avg. SNR, different channels
• Summary/Recommendations
• References

September 2003
Brian Johnson, Nortel Networks
doc.: IEEE 802.11-03/0682-00-000k
Submission
Pure MAC efficiency vs. Data rate:
• No PHY impairments
• No channel contention, 1 TX, 1 RX
• Saturated input queue.
Data rate (Mbps) 6 9 12 18 24 36 48 54
Error free throughput (Mbps) 5.082 7.176 9.078 12.251 14.905 19.014 22.052 23.104
MAC broadcast efficiency 0.847 0.797 0.756 0.681 0.621 0.528 0.459 0.428
Table : Pure 802.11a MAC broadcast efficiency with no PHY impairments, 1kbyte packet size

September 2003
Brian Johnson, Nortel Networks
doc.: IEEE 802.11-03/0682-00-000k
Submission
Expected Throughput vs. Avg. SNR AWGN Channel, Frame size 1000 bytes
•Plot captures the receiver performance in terms that matter most for the user and the system, i.e. throughput over entire avg. SNR operating range.•For a given channel, and receiver implementation, precisely maps PHY property of increasing throughput vs. increasing SNR.
Throughput vs SNR (AWGN, pkt 1000)
0.000
5.000
10.000
15.000
20.000
25.000
0.0 5.0 10.0 15.0 20.0 25.0 30.0
SNR
MA
C T
hro
ug
hp
ut
(Mb
ps
) 6M
9M
12M
18M
24M
36M
48M
54M

September 2003
Brian Johnson, Nortel Networks
doc.: IEEE 802.11-03/0682-00-000k
Submission
Expected Throughput vs. Avg. SNR
SUI-1 Fading Channel, Frame size 1000 bytes
Compared to AWGN, throughput is lower and knee in each curve is much more shallow.
Throughput vs SNR (SUI-1, Pkt 1000)
0.000
5.000
10.000
15.000
20.000
25.000
0 5 10 15 20 25 30 35
SNR
Th
rou
gh
pu
t (M
bp
s)
6M
9M
12M
18M
24M
36M
48M
54M

September 2003
Brian Johnson, Nortel Networks
doc.: IEEE 802.11-03/0682-00-000k
Submission
Expected Throughput vs. avg. SNR
HIPERLAN/2 Ch 1 fading channel, frame size 1000 bytes
Compared to AWGN, throughput is lower and knee in each curve is much more shallow.
Throughput vs SNR (HYP-1, Pkt 1000)
0.000
5.000
10.000
15.000
20.000
25.000
0 5 10 15 20 25 30 35
SNR
Th
rou
gh
pu
t (M
bp
s)
6M
9M
12M
18M
24M
36M
48M
54M

September 2003
Brian Johnson, Nortel Networks
doc.: IEEE 802.11-03/0682-00-000k
Submission
For a given receiver implementation, channel type, and avg. SNR, define the best achievable throughput:
SNRChRS
SNRChS
TXframeR
frame
TX
,,,Throughput Expected max
,,Throughput ExpectedMax
For a given receiver implementation, perfect knowledge of the channel type and avg. SNR enables the selection of the transmit rate to achieve the maximum expected throughput:
Can we rely on a good avg. SNR estimate w/o additional knowledge of the channel type for channel quality?
Look at variation in Max Expected Throughput and Max Transmit Rate vs avg. SNR for different channel types.
SNRChRS
SNRChS
TXframeR
frame
TX
,,,Throughput Expected maxarg
,,RateTransmit Max
Optimal Expected Throughput

September 2003
Brian Johnson, Nortel Networks
doc.: IEEE 802.11-03/0682-00-000k
Submission
Expected Throughput vs Avg. SNR for 3 different channels, various Tx speeds.
Throughput vs SNR
0.000
5.000
10.000
15.000
20.000
25.000
0.0 5.0 10.0 15.0 20.0 25.0 30.0 35.0
SNR
MA
C T
hro
ug
hp
ut
(Mb
ps
) 6M AWGN
24M AWGN
54M AWGN
6M Hyp Ch1
24M Hyp Ch1
54M Hyp Ch1
6M SUI-1
24M SUI-1
54M SUI-1

September 2003
Brian Johnson, Nortel Networks
doc.: IEEE 802.11-03/0682-00-000k
Submission
• Note1: For each given rate, Expected throughput is similar for the higher avg. SNRs and the lower avg. SNRs.
• Note 2: For each speed, large difference in Expected Throughput for lower middle of operable avg. SNR range between AWGN and fading channels.
• Note 3: For each speed, not as large a difference in Expected Throughput for two fading channel types.
• Note 4: For 6M speed, expected throughput is similar at the lower edge of the operable avg. SNR range for all channel types.
• Conservative initial rate selection for a given avg. SNR will result in similar throughput across all channel types.

September 2003
Brian Johnson, Nortel Networks
doc.: IEEE 802.11-03/0682-00-000k
Submission
Max Expected Throughput vs SNR for 3 different channels.
Max Expected Throughput vs Avg. SNR for different channels, 1k byte packets
0.000
5.000
10.000
15.000
20.000
25.000
0.000 5.000 10.000 15.000 20.000 25.000 30.000 35.000
SNR (dB)
Da
ta r
ate
/Th
rou
gh
pu
t (M
bp
s)
AWGN data rate
HYP-1 data rate
SUI-1 data rate

September 2003
Brian Johnson, Nortel Networks
doc.: IEEE 802.11-03/0682-00-000k
Submission
• Notes:– For a given SNR, variation in Max Expected Throughput between AWGN and fading
channels is up to 6Mb/s– For a given SNR, variation in Max Expected Throughput between the two fading
channel types is up to 2Mb/s– For a given Max Expected Throughput, variation in SNR between AWGN and fading
channels is up to 9dB with typical variation of 5-6dB– For a given Max Expected Throughput, variation in SNR between the two fading
channels is up to 2.5dB.– For each channel, 1dB error in avg SNR estimation corresponds to about 1Mb/s in
Max Expected Throughput.
• When evaluating PSNI algorithms, observing Max Expected Throughput across all rates is better than FER for one rate.
• The variation in Max Expected Throughput vs Avg. SNR across different channel types, if neglected, is not a show stopper.
• A PSNI measurement that is a good estimate of the Avg. SNR will provide useful information to predict Max Expected Throughput without need to measure additional “channel type” information

September 2003
Brian Johnson, Nortel Networks
doc.: IEEE 802.11-03/0682-00-000k
Submission
Max Tx Rate vs Avg. SNR for 3 different channels
Optimum Datarate vs SNR for different channels, 1k byte packets
0
10
20
30
40
50
60
0.000 10.000 20.000 30.000 40.000
SNR (dB)
Da
ta r
ate
/Th
rou
gh
pu
t (M
bp
s)
AWGN data rate
HYP-1 data rate
SUI-1 data rate
September 2003
Brian Johnson, Nortel Networks
doc.: IEEE 802.11-03/0682-00-000k
Submission
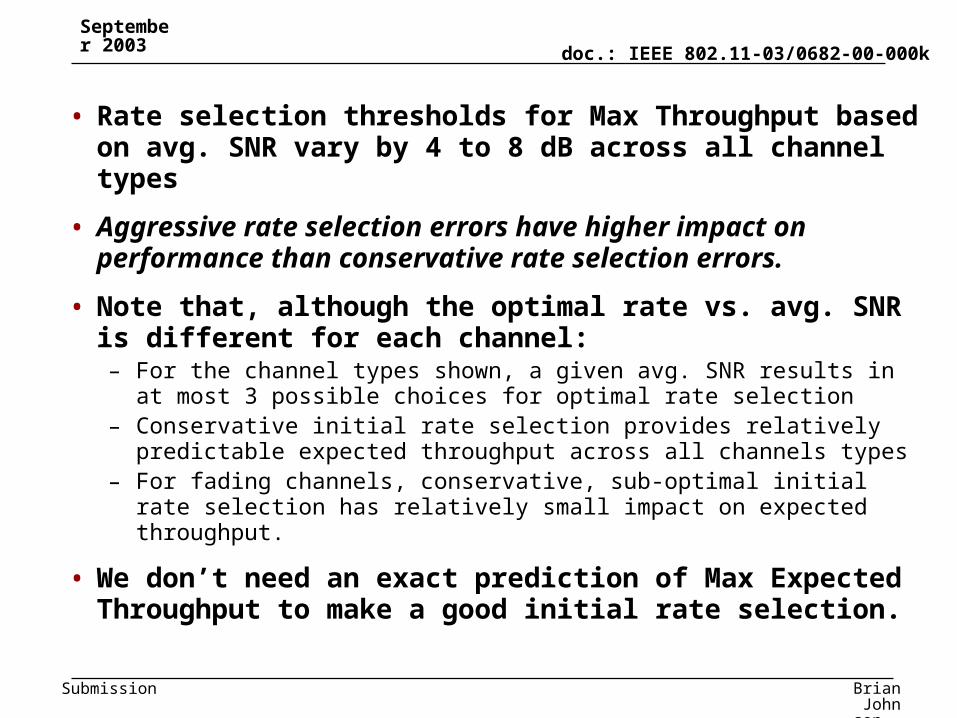
• Rate selection thresholds for Max Throughput based on avg. SNR vary by 4 to 8 dB across all channel types
• Aggressive rate selection errors have higher impact on performance than conservative rate selection errors.
• Note that, although the optimal rate vs. avg. SNR is different for each channel:– For the channel types shown, a given avg. SNR results in at most
3 possible choices for optimal rate selection– Conservative initial rate selection provides relatively predictable
expected throughput across all channels types– For fading channels, conservative, sub-optimal initial rate
selection has relatively small impact on expected throughput.
• We don’t need an exact prediction of Max Expected Throughput to make a good initial rate selection.

September 2003
Brian Johnson, Nortel Networks
doc.: IEEE 802.11-03/0682-00-000k
Submission
Outline• Purpose
• Simulation Methodology
• PHY results, different channels
• Variation in SNR over fading channels
• Expected Throughput Defined
• Throughput vs. avg. SNR, different channels
• Summary/Recommendations
• References

September 2003
Brian Johnson, Nortel Networks
doc.: IEEE 802.11-03/0682-00-000k
Submission
Conclusions and Recommendations
• A good signal quality measure should also capture degradation due to ISI in OFDM signals from large delay spread channels.
• A good signal quality measure should be predictive of Max Expected Throughput with acceptable uncertainty. This is slightly different than predicting FER or BER for each rate.
• Variation in Max Expected Throughput vs. Avg. SNR across different channel types could be considered within acceptable uncertainty without requiring corrections based on additional measurement techniques.
• A PSNI that can provide a good estimate of the Avg. SNR based on measurement somewhere after symbol detection in the receiver will be predictive of Max Expected Throughput for that receiver.
• To further eliminate variation due to receiver implementation, we could require each receiver implementation to map Avg. PSNI to Max Expected throughput for a pre-determined set of channel conditions and report Max Expected Throughput along with or instead of the actual PSNI result.

September 2003
Brian Johnson, Nortel Networks
doc.: IEEE 802.11-03/0682-00-000k
Submission
Conclusions and Recommendations• One possible way to proceed:
– Evaluate and select a PSNI measurement procedure for single frame and multiple frame signal quality measurements
• Use Max Expected Throughput vs. Avg. PSNI plots and/or PSNI vs. Avg. SNR plots to compare candidate algorithms.
• Base selection on predictability of Max Expected Throughput and/or Avg. SNR for different channel types and receiver conditions.
– Define a procedure for generating a mapping of measured PSNI values to Max Expected Throughput Values for any given receiver implementation.
• Select one or more nominal channel conditions and a range of Avg. SNRs for characterizing any given receiver implementation.
• Simulate, collect and store Expected Throughput vs. Avg. PSNI for each channel and each Avg. SNR.
– Define a channel quality reporting format that includes encoding of the predicted Max Expected Throughput, possibly also with an indicator of the uncertainty, and possibly also with the actual measured PSNI.
– When receiver gets a channel quality request, it: • Measures the PSNI according to the outlined procedure, possibly
taking a single measurement or average of several measurements.• Does a table lookup on its own mapping of Avg. PSNI to Max
Expected Throughput and uncertainty.• Encodes the response according to the defined format.
September 2003
Brian Johnson, Nortel Networks
doc.: IEEE 802.11-03/0682-00-000k
Submission
References• MATLAB code for 802.11a PHY comes from:
“OFDM Wireless LANs: A Theoretical and Practical Guide”, by J. Heiskala and J. Terry, ISBN 0-672-32157-2.
• HYPERLAN/2 Channel 1 (A) comes from:“Channel Models for HIPERLAN/2 in Difference Indoor Scenarios,” ETSI EP BRAN 3ERI085B, March 30, 1998.
• SUI channel models come from:“Channel Models for Fixed Wireless Applications,” IEEE 802.16.3c-01/29r4, July 16, 2001.