doccuments/1987/e/1987_e25.pdf · new ices reporting format chernical analysis of spm 15 15 15 15...
TRANSCRIPT

,---- - - - - -- - -------------1
f)//)&I' v r
(
Ihis report not to be guoted without prior reference to the Council*
International Council for theE~ploration of the Sea
#---_.--
.... --.-.~ ..~- -'-'"
C.M.1987/E:25
•
WDRKING GRDUP ON MARINE SEDIMENTS IN RELATION Ta POLLUTION
Copenhagen, 23 - 27 February 1987
Ihis document is areport of a Working Group of theInternational Council for the Exploration of the Seaand does not necessarily represent the views of theCouncil. Therefore. it should not be quoted withoutconsultation with the General secretary .
*General SecretaryICESPalregade 2-4DK-1261 Copenhagen KDENMARK

< i >
Sectjoo
TAB L E o F C 0 N T E N T S
Page
3 REPORT OF ACTIVITIES OF INTEREST TO THE WORKING GROUP•2
3.13.23.33.4
4
4.1
4.24.3
OPENING OF THE MEETING AND ADOPTION OF THE AGENDA . . .
REPORT OF THE 74TH STATUTORY MEETING
JMG of the 0510 and Paris CommissionslOC .ICES Working GroupsOther Relevant Aetivities
REQUESTS AND COMMENTS FROM ACMP AND REGULATORY ACENCIES
Revised Guidelines for the Use of Sediments as aMonitoring Tool . . . . . . . . .Bioavailability Paper . . . . . .Adviee on Normalization Teehniques
1234
4
456
5 REPORTS ON PILOT SEDIMENT STUDIES . . . . . 6
5.1 pilot Sediment Study in the German Bight 65.2 pilot Sediment Study in the Skagerrak . . 85.3 Sediment Studies in the Kattegat and Belt Sea 8
6 REPORTS ON RESULTS OF lNTERCALlBRATION EXERClSES 8
6.1 The Overall Results of the Three Sediment Traee Metallnterealibrations (1/TM/MS, Baltie and Canadian) 8
6.2 Interlaboratory Comparison for Chlorobiphenyls inSediments . . . . . . . . . . . . . . . . . . . . 9
6.3 Other Interealibrations . . . . . . . . . . . . . 9
7.17.27.2.17.2.27.2.37.37.47.5
7 NORMALIZATlON TECHNIQUES
Grain Size Normalization . . . . .Geoehemieal Norrnalization of Traee Element Data
Normalization to AluminiumNormalization to lithiumNormalization to organic carbon
Normalization of Nutrient Data . . . . .Normalization of Organie Contaminant Data . . . . .Preparation of Guidelines for Monitoring ContaminantConcentrations in Sediments . . . . . . . . . . . . .
9
10111112121313
14

< ii
Sectioo Page
,.. ,f -
,
8 USE OF SUSPENDED PARTICULATE MATTER IN CONTAMINANTMONITORING . . . . . . . . .. . 15
8.18.28.2.18.2.2
9
Questioonaire on SPMInterlaboratory Cornparison of
Trace ElementsOrganic Contaminants
NEW ICES REPORTING FORMAT
Chernical Analysis of SPM15151515
16 •10
11
11 . 1
11.2
12
12.112.212.3
13
14
TESTS FOR ESTIMATING POTENTIAL BIOAVAILABILITY OF TRACECONTAMINANTS IN SEDIMENT . . . . . . . . . . . .
LEAFLETS AND OTHER PUBLICATIONS . .
Status of ·First Intercalibration on Trace Metals inMarine Sediments·Sediment Sampling . . . . . . . . . . . . . . . .
OTHER BUSINESS
Irish Sea Report . . . . . . . . . . .Sediment Traps in Pollution MonitoringCollection of SPM . . . . . . . . . . .
RECOMMENDATIONS
CLOSURE OF MEETING
16
16
1617
17
171818
18
19
ANNEX 1 : AGENDA 20
ANNEX 2: LIST OF PARTICIPANTS 22
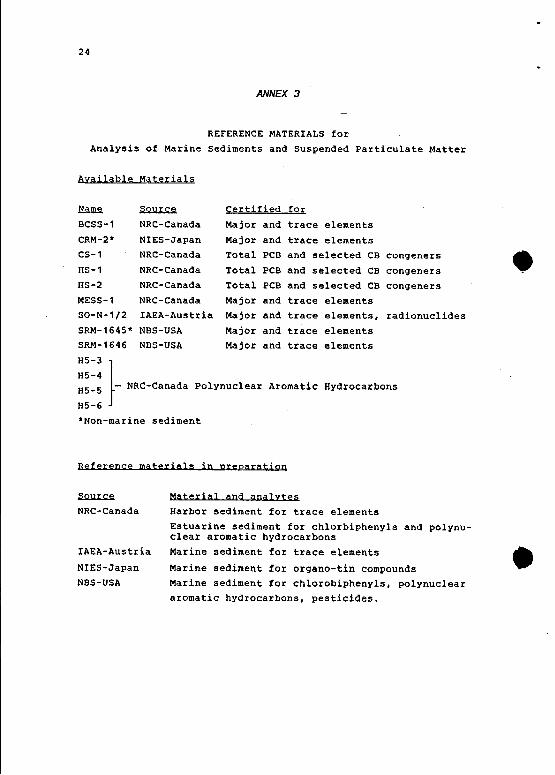
ANNEX 3: REFERENCE MATERIALS for Analysis of MarineSediments and Suspended Particulate Matter 24
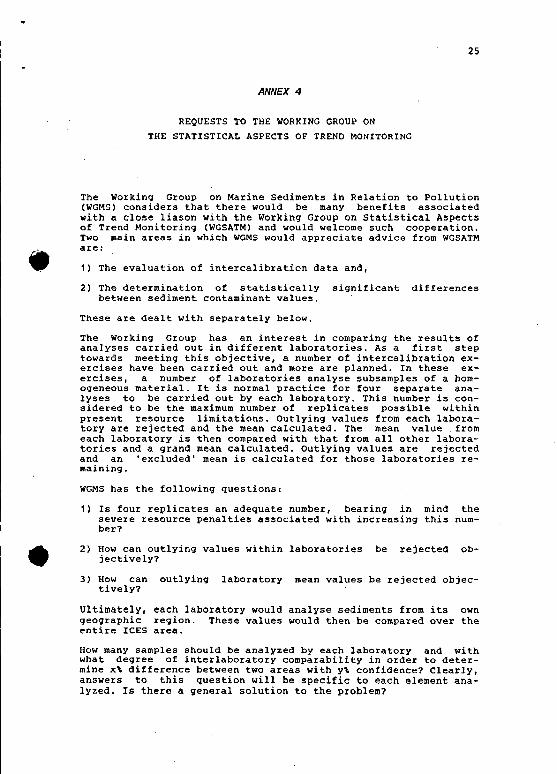
ANNEX 4: REQUESTS TO THE WORKING GROUP ON THE STATISTICALASPECTS OF TREND MONITORING ••••••••• 25
ANNEX 5. NOTE ON SEDIMENT STUDIES IN THE GERMAN BIGHT ANDADJACENT AREAS OF THE NORTH SEA • • • • • • • •• 27

·,-
Section
ANNEX 6:
ANNEX 7 :
ANNEX 8:
e ANNEX 9 :
ANNEX 10:
ANNEX 11 :
ANNEX 12:
--- -- - -------
< iii >
Page
A PLAN FOR CONDUCT OF AN INTERLABORATORYCOMPARISON FOR ANALYSIS OF SEDIMENT FOR CHLORO-BIPHENYLS . • . • . • • • • • • • • • 36
A BRIEF REVIEW OF APPROACHES TO MEASRUINGSEDIMENT QUALITY • . • . • • 39
Questionnaire Regarding Collection and Analysisof Suspended Particulate Matter (SPM) 47
SEDIMENT TRAPS IN POLLUTION MONITORING.A REVIEW • • • • • • • • • • • • • 49
SAMPLING OF SUSPENDED PARTICULATE MATTER (SPM)FOR THE ANALYSIS OF TRACE METALS 69
ACTION LIST 72
RECOMMENDATIONS 74
---00000---
•
•
•
1 OPENING OE THE MEETING AND ADOPTION OE THE AGENDA
The Chairman, Prof H windom, opened the meeting at 9.45 hrs on 23February 1987 and welcomed the participants. The draft agenda wasconsidered and it was agreed that relevant seetions of the draftIrish Sea Status Report should be discussed under agenda item 12and a Danish report on sediments in the Kattegat and Belt Seashould be covered under a new item 5.3. With these additions, theagenda was adopted. It is attached as Annex 1. The list of participants is attaehed as Annex 2.
2 BEPORT OF THE 74TH STATUTQRY MEETING
The Environment Officer presented a list of the 1986 Council Resolutions related to environmental topies. An important relevantoutcome of the 1986 Statutory Meeting was a partial reorganization of the working groups dealing with studies of contaminantsin the marine environment, whereby the former Working Group onMarine Pollution Baseline and Monitoring Studies in the NorthAtlantic was dissolved and several new working groups were establised, including the Working Group on the Biological Effeets ofContaminants, the Working Group on the Statistieal Aspeets ofTrend Monitoring, and the working Group on Environmental Assessments and Monitoring Studies. In addition, the ICES/SCOR WorkingGroup on the Study of the Pollution of the Baltic and the ICESWorking Group on the Coordination of Hydrographie Investigationsin the Baltic were merged into the Working Group on the BalticMarine Environment.
Although the WGMS had not reeommended that it meet in 1987, theMarine Environmental Quality Committee and the Advisory Committeeon Marine Pollution agreed that there were a number of topicsthat the Working Group should diseuss this year and, thus, reeommended to Council that WGMS should meet this year. This was aecepted by Couneil.
3 REPORT OF ACTlVlTlES OF INTEREST TO THE WORKlNG GROUP
3.1 JMG of the 0510 and Paris Commissions
The Environment Officer reported that the main consideration oflCES advice to the Oslo and Paris Commissions concerning sedimentmonitoring had taken place at the Fifth Meeting of the Ad ~Working Group on Monitoring in December 1986. That meeting hadconsidered in partieular the advice in the 1986 Report of theleES Advisory eommittee on Marine Pollution providing guidelinesfor monitoring eontaminants in sediments and on proeedures forthe normalization of contaminant coneentrations in sediments. TheAd Hoc Working Group rejected the ACMP guidelines for sedimentmonitoring, as deseribed in more detail in Seetion 4.1, below. Interms of normalization proeedures, the Ad Hoc Working Groupagreed that three procedures should be promoted: (1) grain size,(2) organic carbon, and (3) aluminium. That group had held anextensive diseussion on the merits of analyzing metals in thegrain size fraetion < 20 ~m~ analysis of that < 63 ~m, butit was agreed that the general reeommendation should be foranalysis of the fraetion < 63 ~m.
2
The outcome of this meeting of the Ad Hoc Working Group wasreviewed by the Joint Monitoring Group (JMG) in January 1987,which accepted all the recommendations concerning sediment monitoring. The JMG was interested in the development of a statistical procedure, similar to that for biota, which could be applied to sediment monitoring results to determine temporal trendsin contaminant concentrations. In order to develop suitable statistical techniques, the JMG agreed that it would be necessary:
1) to list the covariates that should be measured and identifythe most important;
2) to consider whether a suitable data set exists in order totest any hypothesis for a statistical technique;
3) to identifY the difficulties in establishing spatial, as op- •posed to temporal, trends.
The JMG requested ICES to provide advice on a statistical procedure which could be applied to test an hypo thesis for a statistical technique. The JMG also requested ICES to' provide information on appropriate procedures for the storage of sedimentsampies prior to analysis for inorganic and organic contaminants,with a view to enabling laboratories who presently hold archivedsediment sampies to determine whether analysis may be worthwhile.This information should be provided in 1988.
The WGMS took note of this information and agreed to consider therelevant issues under the appropriate agenda items.
3.2 ~
The Chairman discussed activities of the IOC/UNEP Group of Experts on Methods, Standards and Intercalibration (GEMSI). Threeactivities were discussed: those conducted by the Sediment Subgroup, the River Input Sub-group and training exercises associated with the UNEP Regional Seas Programme.
The GEMSI Sub-group on the use of sediments for pollution monitoring was to have areport prepared on this subject by its lastmeeting in March 1986. Unfortunately, it was not completed bythat time. Dr Loring was a member of that Sub-group and statedthat the fate of this report was uncertain.
The GEMSI Sub-group on River Inputs conducted a training/inter- ~calibration workshop on pollutant transport in Bangkok, Thailand ,.,during April 1986. The Chairman was coordinator of this workshopand feIt that the part of it concerning suspended sediments waspertinent to the WGMS. Laboratories from East Asian countries(Thailand, Philippines, Japan, Korea, China) and North AmericaCU.S.A. and Canada) conducted trace metal analyses on suspendedsediment samples collected as apart of this exercise. Consid-ering the relatively little experience of the Asian laboratories,the results showed good agreement. The Chairman stated that theresults from this exercise and those from the lCES intercali-bration exercise, jointlY conducted by WGMS and MCWG during 1985,suggest that measurements of trace metals in suspended particul-
•
•
3
ates may be easy enouqh to alloJ the use nf this component ofmarine systems to be included in pollution monitorinq schemes.
The IOC/UNEP GEMSI is encouraqinq the measurement of individualhydrocarbons and orqanochlorines. To this end, two training workshops have been conducted as part of the UNEP Reqional Seas Programme, one in Papua, New Guinea for orqanochlorines, and one inPuerto Morales, Mexico for polynuclear aromatic hydrocarbons.Ouring both workshops, a few experienced analysts gave lecturesand practical laboratory demonstrations to a number of analystswho participate in regional programs.
The Environment Officer reported that IOC, in cooperation withIAEA and UNEP, has established a Group of Experts on Standardsand Reference Materials for Marine Chemistry. This Group shouldcoordinate the preparation of appropriate reference materials foruse in studies of marine contaminants. ICES is represented onthis Group of Experts by the Chairman of the Marine Chemistryworkinq Group, so any requirements for certified reference materials identified by WGMS should be communicated to this ICESrepresentative.
Or Calder mentioned that the U.S. National Oceanic and Atmospheric Administration had recently prepared a cataloque entitled"Standard and Reference Materials for Marine Science", whichlists the reference materials available for the various matrices.He agreed to excerpt from it a list of reference materials forthe analysis of marine sediments and suspended particulate matter. This list is given in Annex 3.
3.3 ICES Working Groups
The Working Group agreed that it was necessary to introduce astatistical component into the studies of contaminants in sediments. This should include the statistical evaluation of theresults of intercalibration exercises, a statistical componentfor sediment sampling, and an appropriate statistical analysis ofthe data. The WGMS agreed that information on appropriate statistical methods should be requested from the new Working Group onthe Statistical Aspects of Trend Monitorinq (WGSATMl. Ors Lorinqand Rowlatt agreed to formulate this request, which is attachedas Annex 4.
Or Loring stated that he could provide a set of data on metals inmarine sediments for use in testinq out appropriate statisticalmodels.
In terms of sediment-related activities of other ICES workinqGroups, it was no ted that the work on sediment studies in theBaltic Sea, now coordinated by the Workinq Group on the BalticMarine Environment, was progressing very slowly. However, it wasanticipated that maps showing sediment accumulation areas in theBaltic Sea should be completed before the end of the year.
4
3.4 Other Relevant Activities
Dr Calder stated that the U.S. NOAA has conducted a study in SanFrancisco Bay to evaluate several approaches to determining sediment quality, with the aim of selecting a few approaches for application in its nationwide monitoring program. The approachesbeing evaluated include: determination of organic and trace metalcontaminant concentrations in sediments; tests of five sedimentbioassays, including use of two amphipod species, a worm, seaurchin embryos, and mussei larvae, measurement of benthic infaunal community structure; use of a sediment profile camera tomeasure extent of bioturbation, depth of redox discontinuity,successional stage of benthic infauna, and concentration of dissolved oxygen at the sediment-water interface; and determinationof the concentration of a sewage-denned bacterium (Clostridiumperfringens) in the sediment. A complete report on the study isexpected by March 1988.
Another activity that was suggested by the Chairman as being ofinterest to the Working Group is an upcoming meeting sponsoredjointly by the U.S. National Oceanic and Atmospheric Administration and the Skidaway Institute of Oceanography. This· meetingis designed to bring together state, federal and academic marineenvironmental research and regulatory groups in the SoutheasternUni ted States to discuss problems and programs of mutual interest. Apart of this meeting will be devoted to comparing four ormore sets of data on trace metals in marine sediments. These datahave been collected by different groups and represent severalhundred sediment analyses. An attempt will be made to comparethese data using different normalization procedures such as havebeen discussed by the weMS. The Chairman suggested that this combined data set may provide a basis for testing various normalization and statistical models for sediment data interpretation.
4 REOUESTS ANn COMMENTS FROM ACMP ANn REGULATORY AGENCIES
4.1 Revised Guidelines for the Use of Sediments as a Monitoring~
At the 1986 weMS meeting arequest from JMG about more detailedquidelines for the use of sediments as a monitoring tool was discussed. It was aqreed that the only way to obtain revised guidelines before the 1986 ACMP meeting was to make arevision of theold guidelines (Annex 2 of the 1983 ACMP report and Annex 2 ofthe 1984 ACMP report). Drs D. Loring, J. Skei and A. Jensen wereasked to re-arrange and combine the old guidelines in a logicalsequence.
This modified version was circulated to the Group for commentsbefore the June 1986 ACMP meeting. However, the ACMP could notaccept the rearranged guidelines and prepared their own quidelines (Section 15 of the 1986 ACMP report) which were presentedat the Fifth Meeting of the Ad Hoc Workinq Group on Monitoring(MONWG) of the Os10 and Paris Commissions in December 1986. ThisGroup, however, did not find the ACMP advice detailed enouqh forJMP purposes. Drs Jens Skei and Arne Jensen, who attended theMONWG meeting, then presented the original WGMS rearranged guidelines. These rearranged quidelines were accepted by MONWG with a
•

•
•
5
few modifications and additions. In January 1987 the JMG acceptedthese guidelines from the MONWG meeting.
In the continuation of the work to refine the advice on the monitoring of contaminants in sediments, it was recalled that Dr Larsen had presented the first draft of a paper on the sensitivityof sediments as a monitoring tool at last year's meeting thatprovided a good beginning on this topic. Dr Larsen reported thatfurther work on this paper has been hampered by the complexity ofsediments. The original intention of the paper was to provide asimple cookbook approach to sediment monitoring, but this has notproved to be feasible because sediments are so complicated.
Dr Gerlach pointed out that the benthos can change the picture inthe sediments very much depending on the type of animals and whatthey do. This can result in changing mixing rates over time atany given point. Mixing rates will be different from year toyear. In terms of mixing rates over a short time, there may bemore advection than diffusion but the models only show diffusion.
Knowledqe of the position of the redoxcline is also important asthe concentrations of certain substances, e.g., phosphorus, canbe very different above and below the redoxcline.
The Working Group encouraged Dr Larsen to continue work on thispaper intersessionallY. It was agreed that several examplesshould be qiven of the application of the concepts in this paperto different types of sediments.
4.2 Bioayailability Paper
The Chairman informed the Group that the ACMP had rejected theWGMS paper on bioavailability. In the 1986 ACMP report (Section17), a discussion on determining the bioavailability of contaminants in sediments is presented that presumably reflects theACMP's opinion on the subject. The WGMS members reviewed thispart of the ACMP report and discussed it in some detail.
The ACMP appears to aqree with WGMS's opinion that the interactions between marine biota and sediments involve complex processes. The ACMP states that "it would be misleadinq to sugqestthat a broadly applicable method for measuring bioavailability islikely to emerge from future research into this topic." They,however, go on to suggest that guidance can and should be givenon certain aspects of bioavailability that would be of help inevaluatinq data from monitorinq programs. They concluded that "anapproximation of the bioavailable fractions of metals can only beobtained by aseries of [chemical] extractions ... " The WGMSmembers feel that the ACMP does not substantiate this conclusion.
The ACMP report also considered future prospects regardinq thissubject, suqqestinq that considerable research will be necessarybefore more systematic procedures can be developed. They statethat "chemical techniques alone are unlikely to provide a satisfactory approach and bioloqical tests cannot be substancespecific unless they are coupled to specialised chemical analyses", yet in the interim period they encouraqe the use of.series of chemical extractions to approximate bioavailability.
6
The WGMS finds this whole discussion contradictory.
Of particular concern to the WGMS with regard to this subject, isthe way in which ACMP first requests our advice as an expertgroup and then rejects it and.replaces it with its own. If theACMP feels that it has sUfficient expertise within its group, whydoes it forward requests to other qroups.
The members recommended that the Chairman express these views ina letter to the Chairman of ACMP.
4.3 Adyice on Normalization Technigues
As stated in Council Resolution 1986/2:26, the ACMP requested theWorking Group to provide further advice on normalization techniques for use in comparing trace metal concentrations in different sediment types. The Chairman indicated that he had discussedthis matter with Dr J.M. Bewers, Chairman of ACMP, who indicatedthat the ACMP felt that this should be a high priority for theWorking Group. Section. 16 of the ACMP report discussed this sub-'ject and this was distributed to the'Working Group' members. Atthis point discussion was limited, since this is the topic ofagenda item 7 below.
5 REPORTS ON PILOT SEpIMENT STUpIES
5.1 pilot Sediment Study in the German Bight
Dr Albrecht presented results from past and ongoing sedimentstudies in the German Bight and adjacent areas of the North Sea.Surficial sediments were taken from most areas of the North Seaand analysed for Hg, Cd, Cu, Zn, Pb, Cr, V, As, Mn, Fe, Ti, Al,TOC, nitrogen and phosphorus, and carbonate carbon. In addition,sediment cores were taken and down core profiles of the same elements were determined. In this study the ·fines· «20~m) wereseparated from the sediments and analysed. Results were compared,where possible, to the results from earlier campaiqns in theGerman Bight when total sediments of varying grain size were analysed.
It was concluded that:
•
Sampling sediments in dispersive areas, in addition to accumulating areas, will give useful information on trace metal bur-den and on factors other than grain size which influence the ~trace metal content of sediments. Trace metal distributions in ,.,surficial sediments are complex and cannot be described byknown sources alone - with the possible exception of Hg. Inparticular, levels of some trace elements (e.g., Cr, V) in re-mote areas are higher than in the German Bight, includingareas affected by the dumping of acid iron wastes from theTi0
2industry.
- No significant positive correlation of trace metals andaluminium in the fines of North Sea surficial sediments wasobtained. Thus, these data cannot be normalized to aluminium.Some fractions of trace metal variation, in some cases a sig-
•
7
nificant one, could be described by multiple linear regressionon TOC and Fe. However, normalization to TOC or Fe alone didnot lead to acceptable results. Dividing the North Sea intoseveral sub-areas, calculating multiple regressions for thesub-areas and inserting a common pair of values for TOC and Fe(TOC = 3.5\, Fe = 5\) into the regional regressions led tosimilar "expectation values· for the sUb-areas, except theGerman Bight. In the latter area, higher values were obtainedfor Hg, Cd and Zn. This approach, though promising at a firstglance, was partially rejected because the regression equations are essentially equations of conservative mixing.Neither TOC nor Fe are conservative.
- Evidenee was presented from down eore profiles that in somecases some traee elements (e.g., Zn and Cu) may be lost fromthe sediment in proportion to the degradation of organie matter. These profiles might be misleadinq and erroneously beinterpreted as indieating anthropogenie eontamination.
Evidence was further presented that other processes in subsurface sediments may lead to strong enrichment of, e.q., Feand phosphorus.These processes lead also to the enriehments oftrace elements such as Cu and Pb or Cr and V in sub-surfacesediments.
- In some eores, increasing concentration of Cd with depth wasdetected. This suggests remobilization of Cd elose to thesediment surface and downward migration and precipitation atdepth.
It was further eoncluded that:
- Extreme eare must be taken in deriving the his tory of traeemetal contamination from the analysis of sediment cores,
- care must also be taken in estimatinq background levels fromsediment cores,
the interpretation of down core profiles requires detailedknowledge of trace metal interstitial water chemistry.
A brief note deseribing studies in the German Bight is presentedin Annex 5.
In the discussion of these results it was pointed out that whenonly the fraction <20 ~m is analyzed, this is equivalent to normalizinq to aluminium, so the differences seen in relation to TOCand Fe are those that would be found after normalizing to Al.This is beeause the concentration of aluminium is always constantin the <20 ~m fraction. It was also noted that analysis of thefine fraction eliminates the correlation between Fe and TOC thatcan be found in the analysis of larger grain size fractions. However, in the area under study, the analysis of the <20 ~m fraction is useful to obtain a better picture of the spatial difterences in the distribution of contaminants.
It was further noted that certain trace metals, particularly copper and zinc, have a close relationship to TOC and seem to be mobilized trom the sediment by integration in organic matter and
8
then lost from the sediment. Thus, in the German Bight, it appears that a down core profile for zinc is not indicative of thecontamination his tory of zinc.
5.2 pilot Sediment Study in the Skagerrak
The working Group noted that a number of years ago it had beenagreed that a pilot study of sediments should be undertaken inthe Skagerrak to investigate the usefulness of sediments in monitoring contaminants and to determine the load of contaminants inthe sediments in this area. In 1982, work was conducted by Norwegian, Swedish and Dutch scientists to study the transport ofsuspended particulate matter and trace metal concentrations inthe water in this area. However, samplinq of the bottom sedimentswas not undertaken owing to a lack of financial support. It isproposed that this item be removed from the agenda until newinterest and funding are available.
5.3 Sediment Studies in the Kattegat and Belt Sea
Dr Larsen summarized the report ·Accumulation of mud sedimentsand trace metals in the Kattegat and the Belt Sea·, which hadbeen prepared by Dr P. Pheiffer Madsen and himself. This reportreviewed available information on the geology of sediments in themarine area around Denmark and compared trace metal concentrations in pre-1850 sediment samples with concentrations in recentsediments. These trace metal concentrations had been normalizedto loss on ignition. By comparing these values, enrichment factors were calculated for the metals studied. Estimates were alsogiven of the accumulation of trace metals in mud sediments in theareas covered.
The working Group noted this report with interest. For bettercomparison with results from other areas, it was felt that itwould have been useful if concentrations of trace metals in sediments had also been given before normalizing the values to losson ignition.
6 REPORTS ON RESULTS OF INTERCALIBRATION EXERCISES
6.1 The Overall Results of the Three Sediment Trace MetalIntercalibrations (1/TM/MS. Baltic and Canadianl
In view of the importance of cornparing the comrnon results of theICES First Intercalibration on Trace Metals in Marine Sediments(1/TM/MS), the Baltic Sediment Intercalibration, and the NationalResearch Council of Canada intercalibration for two samples(ICEM:B, NRCC:HB-2 and ICEM:C, Baltic sediment:MBSS), the WorkingGroup requested Dr S Berrnan of NRCC (Ottawa, Canada) to prepare abrief report summarizing and comparing the results obtained forthe samples common to these intercalibrations and outline thecommon problems associated with the analyses of these sampies. Inaddition, cornments on the potential use of these sampies as secondary reference materials should be made.
•
•
9
6.2 Interlaboratory Comparison for Chlorobiphenyls in Sediments
The JMG had requested ICES to consider the feasibility of conductinq an interlabcratory comparison for the analysis of chlorobiphenyls (CBs) in sediments and, if feasible, to prepare a planfor the implementation of such an exercise. A draft plan was prepared intersessionallY by Dr Calder and sent to other WGMS members for review. After incorporation of comments from six reviewers, the plan was submitted to ICES. The ACMP reviewed thisplan and accepted it for inclusion in the 1986 ACMP Report. Thisplan was reviewed by the JMG at its 1987 meeting and accepted.The JMG requested ICES to find a coordinator for this exerciseand provide cost estimates for its implementation.
The Marine Chemistry Workinq Group reviewed this plan durinq its1987 meeting and determined it to be the proper approach. Therewas no interest amonq members of the MCWG for coordinatinq theexercise. Dr Calder reported that a nearly identical intercomparison was beinq planned for several US laboratories by the USNOAA and NBS. He will explore the possibility of adjustinq theintercomparison to meet ICES and OSPARCOM requirements. If this1s poss1ble, then aproposal, similar to that in Annex 6, will besubmitted to ICES.
6.3 Other Intercalibrations
The Chairman aqain mentioned the IOC/UNEP River Input Training/Intercal1bration Workshop in< Banqkok, Thailand. He stated thatalthouqh its focus was different from that of the WGMS, thoseaspects dealinq with suspended sediments miqht provide a usefulbasis for desiqninq an intercalibration exercise for particulatetrace metals by the Workinq Group.
The report of this IOC/UNEP Workshop will be completed and presented at the next GENSl meeting in July 1987 and the Chairmansaid he would be prepared to have copies sent to WGMS members atthat time.
7 NOBMALIZATION TECRNIOUES
The Chairman stated that if the Workinq Group can reach generalaqreement on the important aspects of this topic, then a subgroup will be appointed to work 1ntersessionally to prepare draftguidelines for the use of normalization techniques. The draftquidelines will be presented to the entire workinq Group at thenext meetinq. Dr. Rowlatt pointed out that general quidelines mayconflict with procedures developed in site-specific studies. TheChairman responded that in cases where lCES is asked to evaluatedata, ICES can state the way in which the data should be presented. He further stated that without sufficient information onthe qeochemical settinq for the contaminant data, no interpretation of that data is possible. The Chairman further stated thatthe WGMS must be prepared to contribute to regional environmentalassessments as highliqhted in the terms of referencc uf the newWorkinq Group on Environmental Assessments and Monitoring Strateqies. Dr. Calder stated that environmental assessments are bestdone if laboratories report the contaminant data and the geochem-

10
ical normalizing data, rather than "normalized contaminant data".In this way, various approaches to normalization can be tried ina uniform way over all data sets.
7.1 ~rain Size Normalization
It was agreed that there are two ways of normalizing contaminantconcentrations in sediments by grain size: separating a specificgrain size fraction and analyzing only that fraction; or determining contaminant concentration in the total sediment as weIl asgrain-size distribution in that sediment and then evaluating therelationship between contaminant concentration and a specificgrain size fraction. With regard to these approaches, Dr. Rowlattstated, and there was general agreement, that one cannot assumethat "total metals" reside in any one grain size fraction of asediment. Dr. Calder pointed out that freeze drying a sedimentand physicallY separating various grain-size fractions will leadto los ses of trace organic analytes and possible inadvertent contamination of the sampie. Dr. Jensen noted that separating andconcentrating the fine size fraction from a large quantity ofcoarse sediments is the only way to obtain good analytical datawhen concentrations are low. The Chairman responded that suchconditions represent lightly or non-contaminated sediments andtherefore may not warrant such effort.
with regard to the second approach, Dr. Loring pointed out thatin uncontaminated sediments over 80\ of the trace elements occurin the alumino-silicate lattice of clay particles of less than 2~m size; these primary trace metal carriers increase in abundanceas grain size decreases. Therefore, the abundance of aluminosilicate phases is the primary determinant of trace elements insediment, while grain size is a secondary determinant.
The working Group concluded that for evaluation of spatial trendsover large areas, or over any area where both organic and traceelemental contaminants are of concern, chemical analysis shouldbe conducted on the total sediment, after removal of large inhomogeneously distributed material, e.g., pebbles, twigs, animals,etc. This conclusion follows from acceptance that any separatedfraction (e.g., <63 ~m) may not represent the total contaminantload, and that the separation process may lead to loss of organicanalytes and to an increase in inadvertent contamination of thesample. For site specific or regional monitoring of trace elements in sediment, analysis of aseparated size fraction is anacceptable approach. However, for analysis of organic contaminants, the total sediment should be used in all cases. It wasnoted that the previous recommendation regarding the amount ofthe sediment in the <63 ~m fraction related to the selection ofappropriate sites for monitoring contaminants in sediments.
Dr. Larsen stated that temporal trend monitoring will require asensitive and perhaps different approach; Dr. N~s agreed, statingthat the goal of temporal trend monitoring has not beensatisfactorily addressed.
It was generally agreed that normalization of contaminants inwhole sediments to a specific grain size faction is inferior tonormalization to a measure of alumino-silicate phases. This topic
•
•
•
11
will be discussed further in Section 7.2, below.
7.2 Geochemical Normalization of Trace Element Data
The purpose of attempting geochemical normalization is to identify and remove the expected natural variability in trace metaldata in order that the anthropogenie signal may be seen clearly.The most obvious first approach utilizes the well-known relationship between trace elements and aluminium in sediments.
7.2.1 Normalization to AluminlYm
The Chairman related a situation in the State of Florida in theU.S.A. He cited a perception by the State Regulatory Agency thatcertain harbors in Florida were "polluted" with trace elements,the perception being the result of elevated metal levels in claysediments compared with the common carbonate-rich sediments thatexist in southern parts of the state. He reported that the StateAgency agreed with his advice to consider geochemical controlover trace element concentrations before drawing conclusions. Herelated the results of analysis of many sediments trom Floridaand Georgia from which a reliable relationship was determinedbetween several trace elements and aluminium for non-contaminatedsediments. These baselines were used to re-evaluate the degree ofcontamination in the Florida harbors. Pr Calder presented datademonstrating the use of this approach from a number of locationsalong the US east and Gulf of Mexico coasts.
By using non-contaminated baselines derived from the Chairman'sstudy and from other sources, areas could be identified withclearly anomalous trace element concentrations. Even though theareas sampled were diverse in many respects (e.g., upland drainage, degree of urbanization and industrialization, climatologicalfactorsl, the approach of normalizing trace element data to aluminium seems to work efficientlY. The Chairman stated that thisapproach makes the situation clear even to untrained individuals.Pr Calder stated that even a trained geochemist could not interpret concentrations of trace elements in sediments without additional geochemical information. Pr Cato expressed concern overthe use of surface samples for establishing the non-contaminatedbaseline. The Chairman responded that the non-contaminated regression of a trace element against aluminium must be createdfrom samples that are, in fact, not contaminated. One can useeither the deeper portion of sediment cores, or surface samplescollected from remote areas. A different regression equation maybe derived in different regions. Pr Cato questioned how one canbe sure that concentrations that lie above the natural regressionare really due to contamination. Pr Calder responded that one'sconfidence increases as the deviation from the regression lineincreases; in some cases, more intensive work may be needed if amore confident result is required. Pr Boutier questioned the useof a constant confidence interval over the full range of aluminium concentrations, as had been done in the Chairman's study.The Chairman recognized that this concern was valid and statedthat ideally one should seek data distributed uniformly over therange of aluminium concentrations observed. Pr Rowlatt pointedout that uncertainty exists in both the trace element and the

12
aluminium concentrations, and, therefore, a more comp1ex statistical approach may be required. Statistical needs for interpretation of trace element concentrations in sediments are discussedmore ful1y in Annex 4.
7.2.2 Norma1ization to lithium
Dr Loring introduced this topic by reviewing the reasons whygrain size is secondary to a1umino-silicate 1attice effects incontrolling trace element concentrations in non-contaminatedsediments. He went on to state that in areas where chemicalweathering predominates, the alumino-silicate minerals are foundpredominant1y in the fine-grained fractions. In contrast, inglacial sediments, alumino-silicate minerals are found in allsize ranges. However, the coarser a1umino-silicates contain veryfew trace elements within their 1attice and normalization toaluminium is not effective in exp1aining variability in traceelement concentrations. On the other hand, Dr Loring has determined that lithium does not occur in coarse a1umino-si1icateminerals, but does. covary with the <63 ~m fraction of glacia1sediments. Thus, in these sediments, metal to lithium regressionsare more usefu1 than metal to aluminium regressions. He statedthat the uncertainty in lithium analysis is no greater than thatin aluminium analysis and that lithium is easily determined byflame atomic absorption spectrometry.
The Chairman questioned the fate of lithium during diagenesis ofsediments. Dr Loring replied that lithium is transferred to thec1ay mineral lattice as weathering proceeds. Dr Row1att asked ifit would not be better to have all laboratories use the same normalizing element. The Chairman responded that different normalizers can be used, depending on local conditions, as long as theypermit ca1culation of the "non-natural" component of the totaltrace element content. The "non-natural" component can be compared from area to area. Dr Loring stated that he prefers to confirm the amount of the "non-natural" component by use of weakacid leaches of sediments and direct measurement of both the"non-natural" and the natural components of the sediment. TheChairman noted that this approach cannot be generally app1iedunless independent evidence is avai1ab1e to show that the weakacid soluble component is identica1 to the "non-natural" component in contaminated sediments. As a closing comment, Dr Loringnoted that other normalizers may be better than either aluminiumor lithium, e.g., organic matter is sometimes the principal carrier for mercury.
7.2,3 Norma1ization to organic carbon
Dr Cato presented the resu1ts of his studies in Sweden. He determined trace element to organic carbon regressions in severalareas and observed that the slope of the regression was relatedto the degree of contamination.
In these studies the principal trace element bearing phase seemsto be organic matter. Although many of the sediments were veryhigh in organic matter (up to 15\ TOC), the relationships werefound to hold at low TOC concentrations as wel1. Dr Cato noted
•
•
•
13
that the environmental significance (e.g., bioavailability ortoxicity) of the observed elevations in trace element content arenot known. Dr Jensen demonstrated from the Danish report on sediment studies in the Kattegat that high correlations betweenmetals and loss on ignition have also been found in the pre-1850sampies. The metal:loss on ignition ratio is used as guidance foridentlfying contaminated areas.
Considerable diseussion ensued regarding the eomparability oftrace element data from reeently deposited, organic-rich sediments. While Drs Rowlatt and Calder held that such deposits aresignificant to benthic environmental quality, the Chairman notedthat part of the trace elements based in such deposits will berapidly removed and only the "stabilized" trace elements can beeompared on a regional basis. Dr Nres concurred that normalizationto organic carbon may be a valid region-specific approach, but iteannot be applied over all areas. The Chairman agreed that, to begenerally applicable, a "natural" metal to carbon regression mustexist so that the anthropogenie ("non-natural") component can bedetermined. The Chairman concluded, and the Working Group agreed,that any normalization approach can work if the approach allowsdiscrimination of the "non-natural' from the natural component.
7.3 Normalization of Nutrient pata
The Chairman asked the working Group to consider ways in whichnutrient concentrations in sediment, or measures of relatedparameters, could be used to predict eutrophication or negativeeffects of organic over-enrichment. Dr Cato presented data onnitrogen and carbon in sediments. He suggested that such information could be used to identify areas in which excess nitrogenfrom, e.g., agricultural run-off, has led to eutrophication. TheChairman, along with Drs Nres and Calder, noted that remineralization of organic matter and other biologieal faetors wouldpresent problems to this approach. Yet, the Working Group agreedthat it would be desirable to seek a sediment-based measure ofdeveloping organic over-enrichment stress. The Chairman and DrCalder reported on their experience with a sediment profilecamera for evaluating organic enrichment and resulting effects onredox eonditions and benthie eommunity structure. Dr Calderagreed to prepare areport intersessionallY that describes theresults of studies employing the sediment profile camera. Dr Catoagreed to prepare areport on the interpretation of nutrient concentrations in sediments as a way of detecting eutrophicationproblems. The Chairman will send relevant data to Dr. Cato .
7.4 NormalizatioD Qf organic Contaminant nata
Dr Calder introduced this topic by reviewing aseries of approaches to measuring sediment quality being considered in theUSo The approaches fell into four categories:
- comparison of contaminant data in the sediment of concern todata from a referenee or pristine areal
14
- comparison of contaminant concentrations in interstitial waterwith water quality criteria;
- use of equilibrium partitioning theory to calculate from observed contaminant concentrations in sediment the concentrations that could exist in either interstitial water or intissue and comparison of the calculated values with relevantwater quality or seafood quality criteria; and
- measurement of biological parameters that may be related tocontaminant burdens in sediment.
In theory, the above approaches apply equally weIl to trace elemental or organic contaminants. The most straightforward approachis the comparison of contaminant burdens in sediment from onearea to another. For synthetic organic contaminants Ce.g., organochlorines), data need to be normalized only to the mass ofsediment analyzed, i.e., ng contaminant/g sediment-dry weight.For organic contaminants that exist naturally Ce.g., many of thePAHS), concentrations in pristine or remote sediments could besubtracted from concentrations observed in sediments of concern.In general, this is an unnecessary step, as concentrations' inremote areas lie near the limits of quantitation for the methodsemployed at this time. For the equilibrium partitioning approaches. several assumptions must be made. One of these is thatorganic contaminants in sediment behave as though they were "dissolved" in the total organic matter in the sediments. Cr Calderpresented data demonstrating a relationship between some organiccontaminants Cchlorobiphenyls and CCTs) and the total organiccarbon in U.S. nearshore sediments. He also presented data demonstrating a relationship between CCT residues in livers frombenthic dwelling fish and organic-carbon-normalized CCTconcentrations in sediments when both fish and sediment werecollected from the same station. At present, these relationshipsare poorly defined, but it seems possible that further investigation may strengthen them. Therefore, measurement of totalorganic carbon should always accompany determination of organiccontaminants in sediments to permit more thoughtful evaluation ofthe contaminant residues found. The normalization of contaminantdata to synoptically measured biological parameters was discussedbriefly. Cr Calder agreed to prepare areport on this topic forthe next meeting of the Working Group.
7.5 Preparation of Gujdelines for Monitoring contaminantConcentrations in Sediments
The Chairman stated that it seemed possible to prepare generalguidelines for normalizing contaminant concentrations in sediments for purposes of comparing various regions within the ICESarea. Cr Loring agreed to lead the development of such guidelinesfor trace element measurement, with the assistance of the Chairman, Cr Rowlatt, Cr Jensen, and Cr Cato. The guidelines will beprepared intersessionally and presented for review at the nextmeeting of the Working Group. It was agreed that all membersshould send detailed examples of their preferred methods of normalization to Cr Loring for use in this work.
Cr Calder agreed to prepare interim guidelines for normalization
•
•
15
of organic contaminants for the purpose of spatial comparisons;these appear as Annex 7 to this report.
8 USE OF SUSPENDED PARTlCULATE MATTER IN CONTAMINANT MONlTORING
The Chairman stated that the consideration of suspended particula te matter (SPM) has been given entirely to the WGMS; the MarineChemistry Working Group will not consider this topic.
8.1 Ouestionnaire on SPM
Pr Calder reviewed the history of the questionnaire that was prepared in present form after the last meeting of the WorkingGroup. He had sent the questionnaire to the Environment Officerfor distribution in la te summer 1986. The Environment Officerapologized that it had not been circulated at that time. TheChairman accepted this apology and stated that the delay in distributing the questionnaire would give the full Working Group theopportunity of commenting on the questionnaire. After discussion,it was concluded that the questionnaire should be distributed byICES and that responses should be directed to lCES. Each WorkingGroup member is to suggest individuals to receive the questionnaire. Pr Calder will prepare a summary of the responses for thenext meeting of the Working Group. The questionnaire is includedas Annex 8 to the report.
8.2 lnterlaboratory Comparison of Chemical Analysis of SPM
The Chairman stated that the objective of an intercomparison exercise on SFM analysis is to evaluate procedures for the preparation of filters. collection of sampies. and reporting of data.Acceptable analytical competence must be assumed to exist.
8.2.1 Trace Elements
The Chairman stated that he had conducted an interlaboratory comparison for analysis of trace elements in SPM collected from ariver system in Thailand. He agreed to provide to the WorkingGroup areport on this intercomparison as weIl as a plan for theconduct of an interlaboratory comparison that meets ICES' needs.He further volunteered to act as coordinator for a future intercomparison workshop for analysis of trace elements in SFM, butonly if both the WGMS and MCWG endorse the plans for the intercomparison workshop and if it is conducted in his horne laboratory.
8.2.2 organic Contaminants
Dr Calder stated that because analytical competence has to bedernonstrated before an intercomparison exerC1se on the analysisof organic contaminants in SPM is conducted, the development of aplan is premature at this time. Before a plan is developed. theresponses to the SPM questionnaire must be considered as weIl asthe progress of interlaboratory comparisons of analyses of sedi-
16
ment for organic contaminants.
9 NEW ICES REPORTING FORMAT
The Environment Officer presented the new Interim Reporting Format for Contaminants in Sediments, which has been developed on astructure similar to that used for the Interim Reporting Formatfor Contaminants in Sea Water. While this format is intended forgeneral use, its most immediate use will by laboratories contributing data on contaminants in sediments to the Joint Monitoring Programme of the Oslo and Paris Commissions.
The Working Group commented on several details in the reportingformat, but generally feIt that the format was weIl prepared.
10 TESTS FOR ESTlMATING POTENTIAL BIOAYAILABILITY OF TRACECQNTAMINANTS IN SE~
The Working Group recalled that Dr A J de Groot had indicatedthat he would prepare a paper on possible tests for estimatingpotential bioavailability of contaminants in sediments. The Environment Officer stated that Dr de Groot had recently informedher that he had been unable to prepare a paper for this year'smeeting, but that he was willing to inform the Group next yearabout progress in work in the Netherlands on quality criteria forheavy metals in sediments with respect to their effects on biotaand ecosystems.
The Working Group looked forward to reviewing Dr de Groot's paperon this topic, but also feIt that all members should become involved in this work. Therefore, the Working Group agreed thateach member should prepare a paper describing his/her method forestimating the potentially bioavailable fraction of contaminantsin sediments and giving an evaluation of whether this techniqueis useful and can give comparable results. These papers shouldpreferably be circulated in advance of the meeting. Membersshould be prepared to present their findings and discuss the implications. In this connection, it was agreed that Dr Loringshould provide a description of his method of acetic acid leaching for estimation of weakly bound metals and the results of itsuse in clean areas as weIl as in contaminated areas.
11 LEAFLETS AND eTHER PUBLICATIONS
11.1 S1gtus of "First Intercalibration on Trace Metals in MarineSediments"
The Environment Officer stated that the pUblication of the finalreport on the results of this intercalibration had been approvedat the last Council Meeting. Dr Loring had submitted the finalreport in late 1986 and the report will appear as CooperativeResearch Report No. 143 within about one month.
The Working Group noted that, although previously participants inICES intercalibration exercises had received a free copy of thefinal report on the exercise, this policy had changed in the past
•
17
year or so. Thus, participants were often unaware that the reporton the exercise had been published until many months thereafter.The Working Group feIt that ~his policy should be re-evaluatedand encouraged the lCES Secretariat to send all participants inan intercalibration exercise a free copy of the report on the results. Participants in these intercalibrations have worked hardto contribute to the exercise and should receive the report whenpublished.
11.2 Sediment Sampling
The working GrOUp noted that the ACMP had requested it to developa strategy for the preparation of descriptions of techniques forsediment sampling, sub-sampling and sampie preparation for publication in the new ICES series Techniques in Marine EnvironmentalSciences. In discussion, it was pointed out that a videotape of asampling operation would be far more descriptive and practicalthan a written description alone. The video tape could be accompanied by a written description.
The Chairman offered to discuss the possible production of ademonstration videotape with people at his institute. Other members of the Working Group with appropriate facilities mayaIsowish to investigate this possibility. The Working Group agreed toreturn to this topic at next year's meeting.
12 OTHER BUSINESS
12.1 Irish Sea Report
The Chairman informed the Group that the Chairman of the WorkingGroup on Environmental Assessments and Monitoring Strategies, DrJ E Portmann, had requested WGMS to review the UR portion of theIrish Sea Status Report. Dr Rowlatt was asked to lead the discussion, which is summarized as follows.
The report addresses various modes of pollutant input into theIrish Sea, but omits that due to atmospheric transport and deposition. The WGMS realized that no information may exist, but itstill felt that this topic should be mentioned in the report,indicating the level of understandinq of this mode of pollutantentry. Presumably, other regional assessments should likewiseaddress all potential modes of pollutant entry, reviewing theexistinq (Or non-existinq) understandinq, if developinq monitoring strategies is the qoal.
The Workinq Group members felt that the report should use appropriate scientific phrases and wording. For example, the term"flywheel effect", used to describe the buildup of mercury inIrish Sea sediments followed by slow release even thouqh inputscease, is not appreciated by scientists from countries whereEnglish is not the mother tongue.
Probably the most important criticism of the report related tohow data on metal levels in sediments are presented. The reviewof metal levels in some cases presented concentrations for thesize fraction <90 ~m and in other cases concentrations are based
18
on total sediment. For regional comparisons of sediment data,metal concentrations should be expressed in terms of total sediment concentrations. Alternatively, some "normalizer", such asaluminium, can be used to allow the reader to assess whether theconcentrations are natural or anthropogenically altered.
The Chairman agreed to forward these comments to Dr Portmann.
12.2 Sediment Traps in Pollution Monitorinq
Dr Nres presented a review he had prepared on techniques presentlyused for trapping sediments (attached as Annex 9). He pointed outthat, to his knowledge, sediment traps had not been used forpollution monitoring, although he and Dr J Skei were planningsuch a program.
The working Group agreed that this report was informative andfelt that it could be the basis of a very useful publication. ltwas agreed that the work on this document should continue intersessionally and that examples of the use of sediment traps andsuspended particulate material in pollution monitoring should begiven. Members with relevant information should prepare a paperwhich should preferably be circulated before the meeting. Thesepapers can be collected together with Dr Nres' review and submitted for publication in the Cooperative Research Report series.
12.3 Collection of SPM
The working Group took note of a paper submitted by Prof L Brügmann on a method for the quantitative collection of SPM from seawater (attached as Annex 10). The Group felt that this method wasvery rigorous and should give good results, but it also entailedmore work and may create more possibility for contamination ofthe sample than some other simpler methods. Noting that Dr PYeats and Dr Brügmann had been requested by the Marine ChemistryWorking Group to prepare a draft leaflet on the measurement ofSPM concentrations in sea water, it was agreed that Drs Rowlatt,Vinhas and Windom would review this draft leaflet on behalf ofthe WGMS.
13 RECOMMENPATlONS
The Working Group reviewed the list of intersessional activitiesthat should be eonducted. This i5 given in Annex 11. The WorkingGroup recommended that leES conduct an intercomparison programfor the Joint Monitoring Group on the measurernent of individualchlorobiphenyls in marine sediments, with Dr J Calder as coordinator, provided that the 0510 and Paris Commissions providefunding (Recommendation 1, Annex 12).
The Working Group then considered its next meeting and agreedthat it should take place for five days at the end of February orthe beginning of March. The Chairman invited the Group to meet insavannah, Georgia, if this is approved by council. The followingtopics will be con5idered:
19
1) papers on preferred approaches for the normalization of concentrations of trace metals in sediments;
2) an overall review of the results of three intercalibrationexercises on trace roetals in marine sediments,
3) papers on possible methods for testing the potential bioavailability of contaminants in sediments;
4) papers on the experience gained from the use of sedimenttraps or the collection of SPM in pollution monitoring programs; and
5) the results of the questionnaire on the collection and analysis of SPM and proposals for possible relevant intercalibration exercises.
The full recommendation for the 1988 WGMS meeting is given inRecommendation 2 (Annex 12).
14 CLOSURE OF MEETING
As all business was completed. the Chairman thanked the participants for their contributions and closed the meeting at 16.00 hrson 27 February 1987.

20
ANNEX 1
WORKING GROUP ON MARINE SEDIMENTS IN RELATION TO POLLUTION
Copenhaqen, 23-27 February 1987
1. OPENING OF THE MEETING AND ADOPTION OF THE AGENDA
2. REPORT OF THE 74TH STATUTORY MEETING
3. RE PORT OF ACTIVITIES OF INTEREST TO THE WORKING GROUP
3.1 JMG of the Oslo and Paris Commissions3.2 IOC3.3 ICES Workinq Groups3.4 Other relevant activities
4. REQUESTS AND COMMENTS FROM ACMP AND REGULATING AGENCIES
4.1 Revised quidelines on the use of sediments as amonitorinq tool
4.2 Bioavailability paper4.3 Advice on mormalization teehniques4.4 Other comments and requests
5. REPORTS ON PILOT SEDIMENT STUDIES
5.1 German Biqht5.2 Skaqerrak5.3 Katteqat and Belt Sea
6. REPORTS ON RESULTS OF INTERCALIBRATION EXERCISES
6.1 The overall rcsults of the three sediment trace metalintercalibrations (I/TM/MS. Baltie and Canadian)
6.2 Other intercalibrations
7. NORMALIZATION TECHNIQUES FOR USE IN COMPARING TRACE METAL ANDOTHER CONTAMINANT CONCENTRATIONS IN DIFFERENT SEDIMENT TYPES
7.1 Grain size normalization7.2 Use of Aluminum to normalize metal concentrations7.3 Nutrients7.4 Organic contaminants7.5 Other approaches
8. COMPARISON OF MEASUREMENTS OF CONTAMINANTS IN SUSPENDEDPARTICULATE MATTER
8.1 Questionnaire on collection and analysis8.2 Design of procedures for intercalibration
8.2.1 Trace metals8.2.2 Organic contaminants
9. NEW ICES REPORTING FORMAT
10. TESTS FOR ESTIMATING POTENTIAL BIOAVAILABILITY OF TRACECONTAMINANTS IN SEDIMENT
11. LEAFLETS AND OTHER PUBLICATIONS
11.1 Status of "First Intercalibration of Trace Metals inMarine Sediments·
11.2 Sediment sampling11.30thers
12. OTHER BUSINESS
13. RECOMMENDATIONS
14. CLOSURE OF MEETING
21
22
Albrecht, Horst
Boutier, Bernard
Calder, John
Cato, Ingemar
Gerlach, Sebastian
Jensen, Arne
Larsen, Birger
Loring, D.
ANNEX 2
LIST OF PARTICIPANTS
Deutsches Hydrographisches Inst.Bernhard-Nocht-Str.78Postfach 2200-2000 Hamburg 4FEDERAL REPUBLIC OF GERMANY
IFREMERrue de l'Ile d'YeuB.P.104944037 Nantes-CedexFRANCE
National oceanic & Atmospheric Adm.NOAA/OMA 32Ocean Assessment DivisionRockville, Maryland 20852USA
Geological Survey of SwedenBox 670S-751 28 UppsalaSWEDEN
Institut für Meereskunde an derUniversität KielDüsternbrooker Weg 200-2300 KielFEDERAL REPUBLIC OF GERMANY
Marine Pollution LaboratoryJ~ersborq Alle 1BDK-2920 CharlottenlundDENMARK
Institute for Applied GeoloqyTechnical University of DenmarkAnker Enqelundsvej 1DK-2800 LyngbyDENMARK
Departrnent of Fisheries & OceansBedford Institute of OceanoqraphyP.O. Box 1006Oartrnouth, N.S. B2Y 4A2CANADA

N<es, Kristoffer
Pawlak, Janet
Rowlatt, Steve
Vinhas, Tereza
Windom, H. (Chairman)
Norwegian Institute for Water ResearchRegional Office S~rlandet
Groosevn 36N-4890 GrimstadNORWAY
ICESP<elagade 2-4DK-1261 Copenhagen KDENMARK
Fisheries LaboratoryRemembrance AvenueBurnham-on-CrouchEssex CMO 8HAUK
Instituto HidrograficoRua das Trinas 491296 LisbonPORTUGAL
Skidaway Institute of OceanographySavannahGeorgia 31406USA
23
24
ANNEX 3
REFERENCE MATERIALS tor
Analysis ot Marine Sediments and Suspended Particulate Matter
Available Materials
Name Source Certified tor
BCSS-1 NRC-Canada Major and trace elementsCRM-2· NIES-Japan Major and trace elementsCS-1 NRC-Canada Total PCS and selected CB congeners -HS-1 NRC-Canada Total PCB and selected CS congenersHS-2 NRC-Canada Total PCS and selected CB congenersMESS-1 NRC-Canada Major and trace elementsSQ-N-1/2 IAEA-Austria Major and trace elements, radionuclidesSRM-164S· NBS-USA Major and trace elementsSRM-1646 NBS-USA Major and trace elements
.5-3 }HS-4HS-5 - NRC-Canada Polynuclear Aromatic Hydrocarbons
HS-6·Non-marine sediment
Reference materials jn preparation
~
NRC-Canada
IAEA-Austria
NIES-JapanNBS-USA
Material and analytes
Harbor sediment tor trace elements
Estuarine sediment tor chlorbiphenyls and polynuclear aromatic hydrocarbonsMarine sediment tor trace elements
Marine sediment tor organo-tin compoundsMarine sediment tor chlorobiphenyls, polynucleararomatic hydrocarbons, pesticides.
25
ANNEX 4
REQUESTS TO THE WORKING GROUP ON
THE STATISTICAL ASPECTS OF TREND MONITORING
The Working Group on Marine Sediments in Relation to Pollution(WGMS) considers that there would be many benefits associatedwith a close liason with the Working Group on Statistical Aspectsof Trend Monitoring (WGSATM) and would welcome such cooperation.Two main areas in which WGMS would appreciate advice from WGSATMare:
1) The evaluation of intercalibration data and,
2) The determination of statistically significant differencesbetween sediment contaminant values.
These are dealt with separately below.
The Working Group has an interest in comparing the results ofanalyses carried out in different laboratories. As a first steptowards meeting this objective, a number of intercalibration exercises have been carried out and more are planned. In these exercises, a number of laboratories analyse subsampies of a homogeneous material. It is normal practice for four separate analyses to be carried out by each laboratory. This number is considered to be the maximum number of replicates possible withinpresent resource limitations. Outlying values from each laboratory are rejected and the mean calculated. The mean value fromeach laboratory is then compared with that from all other laboratories and a grand mean calculated. Outlying values are rejectedand an 'excluded' mean is calculated for those laboratories remaining.
WGMS has the following questions:
1) Is four replicates an adequate number, bearing in mind thesevere resource penalties assoeiated with inereasing this number?
2) How can outlying values within laboratories be rejeeted objeetively?
3) How ean outlying laboratory mean values be rejeeted objee-tively?
Ultimately, each laboratory would analyse sediments from its owngeographie region. These values would then be eompared over theentire ICES area.
How many sampies should be analyzed by eaeh laboratory and withwhat degree of interlaboratory eomparability in order to determine x\ differenee between two areas with y\ eonfidenee? Clearly,answers to this question will be specific to each element analyzed. Is there a general solution to the problem?
26
The working Group would also like to determlne differences between the same region at different times, as analyzed by one laboratory. How many samples should be analysed at each time in order to determine x\ difference between two areas with y\ confidence? This problem is similar to the preceding case except thatthe interlaboratory variability is omitted.
The WGMS would also appreciate advice on which regression methodto use with data where both variables include error terms.
27
ANNEX 5
NOTE ON SEDIMENT STUDIES IN
THE GERMAN BICIIT AND ADJACENT AREAS OF THE NORTH SEA
by
Horst Albrecht
Deutsches Hydrographisches Institut
This is a brief note on past and ongoing sediment studies carriedout by DHI in the German Bight and adjacent areas of the NorthSea. From the experience gained during this study some commentswill be given on the papers "Guidelines for the use of sedimentsas a monitoring tool for studies in the marine environment" and"Sediment quality criteria: Normalization techniques for metals·previously distributed by the Environmental Officer.
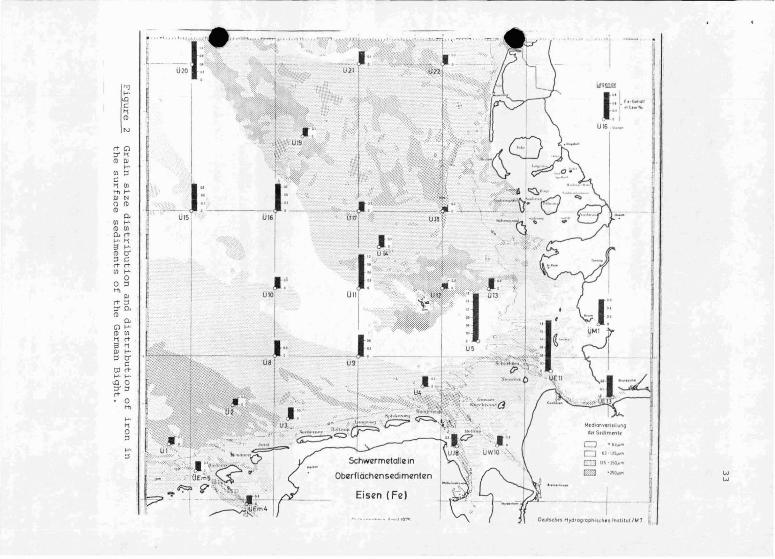
Sediment studies were begun in 1975. Total sediment was analyzedafter total digestion (using HF). Two examples (Pb and Fe) of thefirst results are shown in Figures 1 and 2. Figure 2 also showsthe grain size distribution (Md) of the sediments. It is clearthat these figures show little more than the influence of grainsize on trace element content. Little use only could be made ofthe results obtained from sand areas. Consequently in thefollowing years the work was concentrated on the mud area whichcovers a small sub-area of the German Bight only. Early attemptsto normalize trace metals to TOC or Fe led to the impression thatlevels of Hg, Cd, Pb, and Zn are elevated in the inner GermanBight. Little or no information could be obtained on the possiblespreading of contamination over wider areas.
Mainly in 1979 and 1980 suspended matter sampIes were taken bycontinuous centrifugation and analyzed for some elements aftertotal digestion. Measured concentrations varied greatly. No definite conclusion could be drawn.
In 1982 when we were forced by the requirements of statutorymonitoring to sample sand areas again, we started to separate the"fines" « 20 ~m) from the sediment and to analyze this fraction.since then "surface" samples have been taken from most areas ofthe North Sea. In addition, some cores have been taken and analyzed.
Methods:
Sampling:
"surficial" sediments: exclusively by box corer- large box corer (50 cm x 50 cm) for muddy sediments- small box corer (10 cm x 15 cm) for sands
26
-- cores: large box corer (muddy sediments)vibro corer (sands)
Digestion:
Nitric acid (1:1) in closed teflon vessel(Hg, Cd, Cu, Zn, Pb, Cr, Ni, V, Mn, Fe)
H2S04/K2S206 in closed teflon vessel(P, As)
-- H2so4/HF (Al, Ti, Fe)
Detection:
-- AAS: Zeeman: CdMHS20, snCl 2 , Au trap: HgMHS20, NaBH : Asflame: Cu, ~n, Pb, Cr, Ni, V, Mn, Fe
photochemical: Al, Ti, ,Fe, P
C, N-analyzer: direct and after destruction of carbonates:TOC, N and carbonate carbon
Results and comments
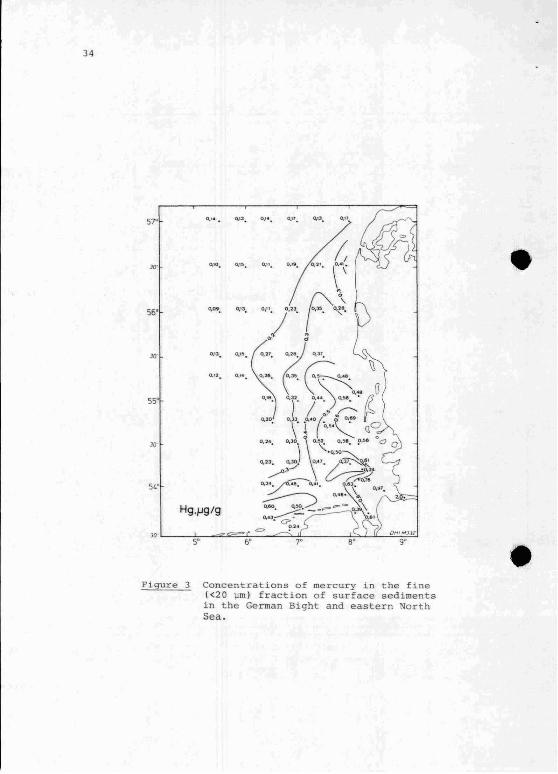
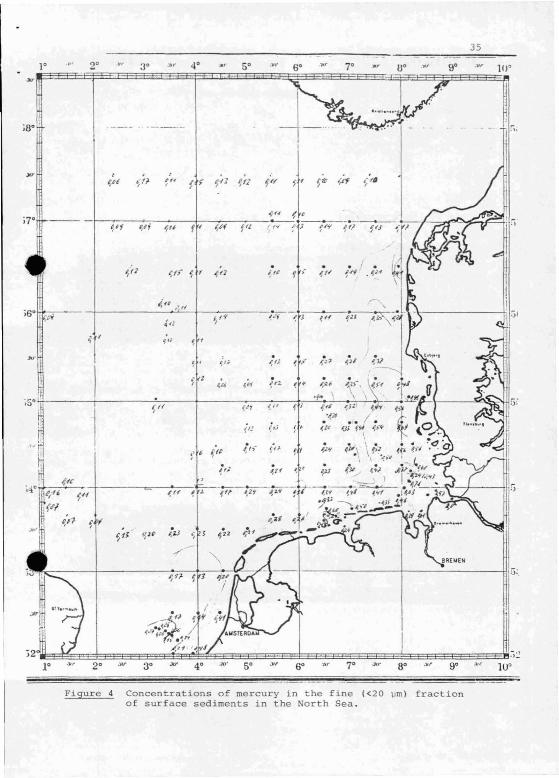
Measured concentrations of Hg in the fines of surficial sedimentsof the North Sea are shown in Figures 3 and 4. The distributionof Hg is well in line with the general ideas about the transportof water masses and perhaps of fine grained particles in theNorth Sea, if one considers the continental rivers to be the mainsources of Hg. The distribution is little or not affected by thepresence of accumulating areas (southeast of Helgoland, the ancient EIbe valley or Helgoland Channel) or dispersive areas(e.q., north of Helqoland). That is why I conclude that samplingshould ~ be exclusively performed in accumulating areas. If Ihad restricted sampling to accumulatinq areas, I would have obtained little or no information about the spreading of Hg in thesediments of the North Sea. I believe that the Hg distributionindeed indicates and reflects contamination.
The situation is not as clear in the case of other metals. Thehiqhest concentration of Cd and Zn were also detected in theGerman Bight. This will to some extent reflect contamination .. Thedistribution obtained is, however, complex. Other factors thanknown sources will have to be taken into account in order to describe or even to understand the measured distribution.
In contrast to the aforementioned metals, the highest concentrations of Pb (except some very high values in the southwesternNorth Sea in front of the UK coast) and Cr were measured in a remote area, i.e., in the Fisher Bank area.
In the case of Pb one might consider the contribution of the airborne load to the sediment load. This will not hold, however, inthe case of Cr. In fact, there are several sources of Cr in theNorth Sea area, mainly discharges or dumping of acid iron wastesfrom the Tio2-industry. In particular, acid iron wastes are being

29
dumped 15 nm northwest of Helgoland in the German Bight. Anannual load of 100 tonnes Cr is being discharged into this area.The concentration of Cr in the fines of German Bight sedimentsis, however, much less than in the Fisher Bank area. The latterarea is not expected to be significantly (if at all) affected bywaste discharges or by dumping activities.
It is clear from these findings that even if the fines of marinesediments are being analyzed, some appropriate "normalization" ofda ta will be required. In fact, the highest content of TOC in thefines was detected in the Fisher Bank area.
How to normalize the data?
I calculated linear correlations between trace elements and majorelements for different sub-areas of the North Sea according todifferent sampling campaigns. Results are given - trace elementby trace element - for different areas in Table 1. I includedresults from three earlier campaigns in the German Bight, whentotal sediment was analyzed. I included further some results forsuspended matter of the German Bight and of the Fladen Groundarea.
No significant positive correlation between any trace element inthe fines with Al was obtained. There is no point in normalizingthese data to Al.
The correlation between Fe and TOC is different in differentareas, in some cases close to zero. Positive correlations wereobtained, however, in most cases between trace elements and Feand TOC. This teIls that these data cannot be normalized toeither TOC or Fe alone. There are, in addition, some strongcorrelations of trace elements with Mn and P.
When total sediment was analyzed, very close correlations betweenFe and TOC and trace elements were obtained. Actually, duringthese campaigns sampies of varying grain size were collected. Theclose correlation between Fe and TOC and trace elements simplyreflects the varying degree of dilution of a fine grained reactive fraction by less reactive coarser material. In this case,the normalizing of trace element data to TOC or Fe will be partially successful. This approach is, however, less sensitive thanthe approach to analyze the fines. In addition, difficulties willarise in interpreting deviations from the regression line, atleast at high levels of TOC and{or Fe. Unfortunately, no Al dataare available for these sampies.
I calculated multiple linear regressions of trace elements on TOCand Fe for Some sub-areas. For some elements, a significant fraction of the variation coul~ be "explained" by the variation ofToe and Fe (cf. Table of R ).
In fact, the measured distribution of Pb in the eastern North Seacan be almost quantitatively described by ~ equation of thetype
Pb A + B'TOC + C'Fe
30
The same holds for V in the eastern North Sea. Inclusion of Mn inthe calculations did not significantly improve the results.
Calculating the regressions for the sub-areas and inserting acommon pair of values (TDC = 3.5', Fe = 5') into regional regression equations results in similar values for different areas except the German Bight. In the latter area, higher values wereobtained for Hg, Cd, and Zn.
Doing the same calculations with the data from the earlier totalsediment campaigns resulted in va lues similar to those obtainedmore recently using the fines.
At a first glance, this approach looks promising. Equations ofthis type are, however, equations of conservative mixing. NeitherTOC nor Fe are conservative. This approach completely ignores the •role of diagenesis. In fact, in some cores the down core profileof Zn and Cu (and P) can almost perfectly be described by thesame approach.
One example iso U9, a sand core from the German Bight. In thiscase the regression is dominated by TOe. The profiles might perhaps be explained by remobilisation of Zn, Cu and P. Scavengingor co-precipitation of phosphate in the oxic surface layer willadd to the profile of phosphorus. In any case, it will be difficult to relate these profiles to pollution or even pollutionhistory.
Hg, Cd and Pb could not be linearly related to TOC and Fe. Note,however, the increase of Cd and Fe with depth below 70 cm.
Linear relations of Zn and Cu with Toe and Fe were not found inall cores. An example is U33, a highly sulphidic core trom theinner German Bight.
In general, one should not expect linear relationships of tracemetals with TOC and/or Fe to hold. Linear relations to TOC alonewould require that the trace metal be remobilised and lost fromthe sediment in proportion to the degradation of organicmaterial.
It is well known that many of the trace elements in question shownutrient-type distributions in the ocean. The processes leadingto nutrient-type distributions will partially continue to operateafter burial of particles. Additional processes, not common inopen ocean waters, are operating in sediments, e.g., precipita- ~tion as or co-precipitation with sulphides. An example is core ,.,U61 from the central North Sea, a muddy sand. Here a strong in-crease of Fe was detected below 90 cm depth. The down core distribution of Fe below 20 cm depth closely resembles the peakheight distribution of pyrite in X-ray powder diagrams. Pb and Cushow a similar but less pronounced increase 85 Fe below 90 cm.
The depth distribution of er and V in this core is closely related to the distribution of total phosphorus in the lower partof the core. This indicates another not weIl understood processwhich may significantly affect trace metal distributions.

31
U61 may represent an extreme ease. The sediment was obviously notaeeumulated under steady-state conditions. Indeed, oxidationcolours were observed in the depth range of 40 cm to 80 cm,though pyrite was present also in this depth range. Between 15 cmand 30 cm black sulphides were present. I am unable to excludethat such processes which led to these "anomalies" are operatingsomewhere today. The down eore distribution teIls at least thatextreme care must be taken in estimating trace metal "backgroundlevels" from sediment cores.
There is one core which shows smooth down core distributions ofinterstitial water phosphate, ammonia and alkalinity. It is amuddy sediment taken in August 1986 from the outer Skagerrakarea.
Ammonia is very low «1 ~M) in the top 9 cm and increasesstrongly below that depth. Phosphate passes through a maximum at20 cm depth. The core seems to be close to steady state with respect to diagenesis of phosphorous and nitrogen. Down core profiles of Fe and Mn show sub-surface minima at 6 to 9 cm depth.The profiles are consistent with mobilisation in the sub-oxiczone, upward migration of dissolved species and precipitationnear the sediment surface, as weIl as downward migration andpreeipitation in the sulphidie zone. The measured down coredistribution of interstitial water, Fe and Mn is in qualitativeagreement with this idea.
Cadmium (partieulate) inereases with depth. The distribution ofCd requires sedimentation of Cd-rich material, remobilisation ofCd close to the sediment surface, downward migration and preeipitation at depth.
What is the "background level" of Cd ?
The experienee gained from these eores elearly demonstrates that
- extreme eare must be taken in deriving the history of tracemetal contamination from the analysis of sediment cores,
- eare must also be taken in estimating background levels fromsediment cores,
the interpretation of down eore traee metal profiles requiresdetailed knowledge of trace metal interstitial water chemistry.
We have now started to measure interstitial water trace metalprofiles.
Finally, I want to add that all very reeently obtained evideneepoint to strong seasonal variations of Cd in oxie and sub-oxiesediments of the German Bight and the eentral North Sea.

32
.0a...~
äi,~
'::>
iI: ...
~2'::>
CJi~ '_,_s~ _
lil: • R ='::>
....,.. ~
.:;
';<;::::.-t.'
~i9~,
il _ ,~----:r="-,--""=<
!I~pH.~
Figure Distribution of lead in the surface sediments ofthe German Bight.
ww
r'}~
J:: l, ,.... to ...
• IUl6 ~Io_
II,'~ I
I
.~/~~,~,..
W ":'-~-'-'" J ?t,-~:·.t(~·"t·,_~IJ/~~·'·I"I~::~::~:; ' ....~b..l'··,··..."'~'1·~··'·,.,"
J~'------:-~015
I
j•.." ,,' .w, ""1
I'" ~~.
, .- .,
~ j , '" ;'""I: '
e-.G):T"C1l PI
>-',
'" ::IC" (JlH1 >-',PI No C1lC1l
'"(Jl >-',C1l (Jl
"'e-.>-', ";:l >-',C1l tt::I Ce-.e-.'" >-',oo ::IH1
PIe-.::I:T'"C1l
'"G)>-"
C1l '"" e-.;:l "PI >-',::I tt
CtJle-.
~g'~~ f ,i, I '\"., "1'"e-. "" ....~ ''''J,'''' ,. "o ~I :"~~ ~7.-'~ • 3~.-1~"~,~ ..,.. .$"·$~:,t" . ...... ,.. '!"'tl ; .. ! .. r ... -:>1)2- :......,.. J '.- '- "'fh'k' '~..... r( •• ' .... ('.. • .. { • .... - $'l J"'''j'''-J J~ 'i\'G'':!.j' "',-..;; MtdlOlwmfllvng11 .::;. .. " J..::.. . ..\(.. rUJ ..1 n..h"''''r: ,., . .w"li'itl' " d"S.dlrn't"Il.o I"" l , ,d"" , .•"'.W, <:> ulC? <c, ....::I ,' ...... J, ,'.";"- ~ '. '~. I CJ ''''_
I .. ~~.! ~""~. ~.. UJ8.~?~ UWIO" CJ U'l1~.-.~' ~~1 ~~'I "~.'",,wt> Schwermetalhzln I \'0 '\ CJ '>S''''._
I "/' , A , • ..~..~... " "" - ',' CJ '''''_' ,." ''''''''',.~, Oberflachensedimenten.,:
1f'"' r OEm5 . ..._......... 'l ..._ ...11 O:,~'i:i!h . . I iI "l"" ·'.'li, .... Elsen (Fe) .• _ _ __.-- 1- ~'~',,",";-
. VEm4I ~ ,,',',' "_" f ~ ......."'..~~....".'"'
34
57" 0.1" • 0.\3. 0,'•• 0-". q,13. 0.11•
;;J,,. 0.1°. o.l~. 0.". 0,111. 0.". \'\
~-
56' 0,09. 0,13. .."." r~:~J"" . ,Ja' 0.13•
::~t~ ~0. 12 • ».... ß55' ••,e ~" ~.. ~..' ~. r / ~~r
~,. ..33 ~'O( 0 ••••. \'! "..~ CeJa'
0,2.,
<".~" .... ,-~". ~,.) ..".~~~
o~-" 00.'.~ ~<5L' 0.". ,e. 0.". ~ 0....
o. .. e· ~.
Hg.jJg/g ~.... p-c.o.;\o",~ .\,:.,
?'.ON/M]]lJa'
5' 6' 9'
Figure 3 Concentrations of mercury in the fine«20 ~m) fraction of surface sedimentsin the German Bight and eastern NorthSea.
35
iSO !l.
I
:Kr , ..~:'4~l' 'I t } ~,., f > 'J-fl p'fl f~c;'
'f;'17 I/f
i7° ---- ~~ ·Ff l',P; 1° fr ~i'f f(t /'''f 4") ~(~., ,
· l~'iI
. ~j41,(1 t;1> t; f ,'2 {fC,.
~I/
I i lD ~l f(
;60
,N U" ~I>'" f J ~u '/1.14tl I
~I
f'~ Il
:If,.~/; · · ~~, ~.Jl, .. ",; ~;r ,:~1
·(.*~ 4" ~'2 ~ "'fj
;5'~ {rr t;~'1 r..'( ! ,I',!I! ~1; ~ .. '!Jo't
.. ·",11 f ~ ~(l ~"(0
~ I ".". · ~ , ·~fJ "l( ~
~(I' ~ ~ -;tt-~2t
I,ezj S.
~n qlP ~ ~7.z
/
t;1}
~'~.~.!; . '4"1 ,,'- /I, .~",
, .;;;., ,:,",:2
r 2° :MI" 3° :IV 4° 5° ",r 6° :I(r 7° 8° go 100
Figure 4 Concentrations of mercury in the fine «20 \Jm) fractionof surface sediments in the North Sea.
36
ANNEX 6
A PLAN FOR CONDUCT OF AN INTERLABORATORY COMPARISON
FOR ANALYSIS OF SEDIMENT FOR CHLOROBIPHENYLS
Introduction
This plan was prepared by the ICES Working Group on Marine Sediments in Relation to Pollution (WGMS). It sterns from arequest tothe WGMS by the Joint Monitorinq Group (JMG) for a plan for conducting an interlaboratory comparison for analysis of chlorobiphenyls (CBs) in marine sediments. Demonstration of satisfactoryinterlaboratory performance would permit the JMG and otheragencies that sponsor marine environmental quality monitoringprograms to include measurements of CBs in sediments in theirprograms with a known level of confidence.'The objective of thisintercomparison is to demonstrate the best possible level of performance by experienced laboratories. Once a level of performanceis achieved that meets the needs of JMG. training activities canbe arranged to enhance competency among all JMP laboratories.
Pre-implementation actions
The first step is to select a coordinating laboratory. It must bea laboratory experienced in the analysis of CBs in marine orestuarine sediments and one that has, or that can obtain, the resources to sustain the intercomparison exercise to its conclusion. The US NOAA and US National Bureau and Standards (NBS)have tentatively agreed to coordinate the exercise.
The first function of the coordinating laboratory will be toidentify participants for the intercomparison. This will be donein conjunction with ICES and its relevant working groups. Theparticipating laboratories must have shown by prior experiencethat they have a high potential for conducting the exercise successfully.
Next the coordinating laboratory must prepare a description ofthe exercise for distribution to the participants. The description will include the general approach to identification, quanti-fication and verification, with the protocol described in suf- ~
ficient detail that the participants can determine what is ex- ...pected of them. Each participant will be responsible for optimiz-ing the general approach to suit the specific conditions of hislaboratory. The description should specify the CB congeners thatare to be used as calibrants and how data are to be reported. Thecoordinating laboratory may suggest that all congeners that havebeen accepted or proposed for the ICES list, or at least thosethat are weIl resolved by the method employed, be used as cali-brants. These congeners are numbers 18, 28, 31, 44, 52, 66, 95,101, 110, 118, 138, 149, 153, 170, 180, 187, 194, 206, 209. It isassumed that concentrations of only these congeners in any sampieare to be reported.
•
----- --------------------
37
The coordinating laboratory will supply calibration solutions attwo or more concentration levels to check linearity over therange of analyte concentrations expected. The concentrations ofanalytes in the solutions will be verified by the coordinatinglaboratory by comparison with available certified reference materials, such as CLB-1, distributed by NRC Canada.
The coordinating laboratory will prepare data reporting formsthat specify explicitly each data point to be reported. Finally,the criteria to be used by the coordinating laboratory for evaluating the level of performance must be described.
The laboratories selected for participation will review the description of the exercise and comment in writing to the coordinating laboratory. At this point, each participant must agree tocomplete the exercise as described and on time, and submit payment to the coordinator for materials.
Imp]ementatiop
This intercomparison exercise for CBs in sediment will be conduc ted in stages, similar to, but more complex than the stepsdescribed by Wells (MCWG 1986/7.2.4). It will consist of threesequential stages designed to evaluate: 1) GC/ECD analysis only;2) analysis + extract clean-upö 3) analysis + clean-up + extraction of the sample. Each stage is repeated until the desiredlevel of performance is obtained. The coordinating laboratorywill prepare/obtain and dis tribute all solutions, standards, andsamples to the participating laboratories for each stage of theexercise.
Stage One of the intercomparison will consist of the use of twoor more calibration solutions to determine a response curve followed by analysis of CLB-1 and an unknown solution by each participating laboratory.
The data from Stage 1 will be evaluated by the coordinator and areport will be submitted to lCES. The coordinator and lCES willdetermine if satisfactory interlaboratory agreement has beenachieved, or if the Stage should be repeated.
Stage Two will consist of analysis by all participating laboratories of a test extract prepared by the coordinating laboratoryfrom a moderately to heavily contaminated sediment.
Stage Three will consist of analysis of certified reference sediments such as HS-1 and/or HS-2, distributed by NRC Canada, alongwith analysis of an uncompromised reference sediment prepared andcharacterised by the coordinating laboratory.

38
Scbedule for Stage
Coordinater approved •.•.•..•.
Participants identified •...•.
Distribution to participantsof plan .•......•••....••.....
Receipt of comments andcommi tments ........•........•
Distribution of materials ...•
Receipt of data by coordinator
Evaluative report to lCES ....
Budget for Coordinator
Prgbable mgnth
o3
4
6
7
9
11
Optimatlpo mQnth
o2
3
4
5
7
9
Purchase of purified CB congeners ..
Travel to present report to lCES ••.
Preparation of solutions •..........
Preparation and presentation ofreport .
20 @ $400 8,000
2 people @ $2,000 = 4,000
200 hrs @ $35 (7,000)*
100 hrs @ $40 4,000
$16,000
* to be recovered through charges to participants, assuming 20participants.
Bydget fot Particjpants
CLB-1 ..••.•............••..............•.....•.•......•.
Calibration solutions ..••.••.••..•...•....•..••.......•.
Unknown solutions .•.................................•...
Packaging and shipping ...................•..............
Per laboratory .....••.•....•.•.....•.........•.•.•..•.•.
$100
$200
$150
$50
$500
•
39
ANNEX 7
A BRIEF REVIEW OF APPROACHESTO MEASUR1NG SEDIMENT QUAUTY
Dr. John A. CalderNational Status and Trends Program, N:OMA32Office 01 Oceanography and Marine AssessmentNational Oceanic and Atmospheric Admini~tration
Rockville, Maryland 20852 USA
INTRODUCTION
Historically, marine environmental quality in the USA has been measured and regulated on thebasis 01 water quality. The photosynthetic marine load chain begins in the water column and, lormany animals 01 interest to humans, ends there. Most wastes entering the marine environmentare, or appear to 00, liquid, and our waste engineering practices 01 recent centuries are based onmaking waste harmless by diluting it with water. To evaluate the effectiveness 01 this dilution,we have developed a variety 01 tests to measure the toxicity 01 specifie dissolved chemieals, andfrom the results 01 these tests, established water quality eriteria to proteet human health andthe environment from exposure to pathogenic micro-organisms and dissolved ehemieals. Forthese and perhaps other reasons, the state of the environment has been evaluated by looking atwater quality parameters. Why now are measures 01 sediment quality necessary? '
Over the last twenty years, a eonsiderable amount of research has proven that mostcontaminants of concern in the marine environment have very short residence times in thewater column. These contaminants now are known to associate, through a variety 01 naturalbiogeochemical processes, with particulate matter and to eoncentrate in the sediments.Interstitial water also may be enriched in contaminants through interaction with the sediments.Beyond the Immediate vicinity 01 sourees, eontaminant concentrations in the water column willbe low and probably highly variable. As a result, reliable measurement of contaminants in thewater column, beyond the zone 01 initial dilution, Is too difficult, and expensive, to Implement ina regulatory mode. Thus, while many ambient water quality standards, based on concentrationsof toxie ehemicals, have been established by the US Environmental Proteetion Agency (EPA),routine monitoring to ensure that these standards are never exceeded is not done. On the otherhand, the eoncentrations of most toxie ehemicals are higher In sediments, and probably morestable, both temporally and spatially. Therelore, measurement of them in sediment is easler,and sampling strategies are simpler. Further, because many anlmals of limited mobility live inthe sediment, It is possible to devise biological measures of sediment quality that employindigenous animals to complement and extend the ehemical measurements.
40
Sediment quality standards are needed irrespective of the existence or utility of water qualitystandards. Because of the tendency of contaminants to associate with sediments, the benthiccommunity may not be protected adequately by standards developed from water columnexposures only. Further, decisions on dredging and dredged material disposal require directmeasures of the toxicity of contaminanted sediments. For these reasons, considerable eflort isbeing expended to develop sediment quality standards. Several proposed approaches to measuringsedimli!nt quality are revlewed briefly in the next section.
APPROACHESTOMEASUREMENT CF SEDIMENTOUAUTY
Both Inputs of toxic chemicals and organie over-enrlchment can lead to degraded sedimentquality. Ideally, measures of sediment qualily should deal with both causes of degradation andIdentity the relative Importance of each at a given loeatlon. Most eurrent eflort deals only withthe toxie chemical problem. Seven approaches to determining sediment Quality, as influenced bytoxic chemicals, are reviewed in areport to the US Army Corps of Engineers (Tetra Tech, •1985). These are: ...
reference area approach;water quality criteria approach;equilibrlum partitioning (sediment-water) approach;equilibrlum partitioning (sediment-biota) approach;bioassay approach;toxicity endpoint approach; andapparent effects threshold approach.
There are advantages and disadvantages associated wlth each of these approaches; none meets allneeds. All of them evaluate sediment quality as it ls influenced by toxic chemlcal contamination.Best usage of these approaches requires that concentrations of toxic organic chemicals benormalized as appropriate either to the amount of total organic carbon in sediments or to theamount of total lipid in tissues. The two equilibrium approaches are not yet developed forpredicting trace metal concentrations in water or biota. Eflorts are underway to evaluate therole of lron and managanese oxides in mediating the bioavailability of anthropogenically-der;vedtrace metals, and to use this interaction In a predictive fashion (J. Neff, personalcommunication). .
ReferenC9 Area (ar Background) Approach
Sediment quality Is estimated by eomparing the concentration levels ofcontaminants In the sediment of concem with levels of the same contaminants Insediments from a relatively pristine area.
Water Quality Criteria Approach
Contaminant concentrations in Interstitlal water are measured direclly andcompared to existing water quality crlteria.

•
•
41
Equilibrium Partitioning (Sediment-Water) Approach
An equilibrium partitioning modells used to estimate interstitial waterconcentrations of contaminants based on measured sediment contaminant levels.The estimated interstitial water concentration for each contaminant is comparedto existing water quality criteria. (For details of this approach, see Appendix A.)
Equilibrium Partitioning (Sediment-Biota) Approach
An equilibrium partitioning model is used to estimate body burdens of. contaminants f,om measured sediment contaminant levels. The estimated bodyburdens are compared to existing legal limits for residues In lood. (For details ofthis approach, see Appendix A.)
Bioassay Approach
Dose-response, or more properly, exposure-response, relationships aredetermined f,om exposure of a test organism to sediment having a measuredcontaminant burden. Lethai or subleIhai (including bioaecumulation to actionlevels) effects are compared quantilatively to effects observed in controlsediments.
Toxicity Endpoint (or Screening Level Concentration) Approach
The presence of a benthic species is observed for aseries of sediments havingmeasured levels of specific contaminants. The minimum concentration for eachcontaminant that was not exceeded in 90% of the sediments containing the speciesis determined and ealled the "species probable no-effeets level" (SPNEL). Foreaeh conlaminant, the process is carried out with numerous species, and a"probable no-elfects level" (PNEL) is determined to be the value above which95% of the SPNELs occur. A more complete treatment of this approach is givenby Neff et al, in press.
Apparent Effects Threshold Approach
Coneentralions of contaminants in sediments are measured and correlated to one ormore biological endpoints determined on the native benthic community. Theeoncentration for each contaminant above which the effect always oceurs is calledthe "apparent effect threshold".
Each of the above approaehes deals with alteration of sediment quality as a result of Introductionof toxie ehemicals. At least !wo other approches have been deseribed that respond to organieIoading and hypoxia. Rhoads and Germano (1982) proposed the Organism-Sediment Index (OSI)that combines as one numerieal value, Information on bioturbation and depth of oxygenatedsediment, successional stage of the benthic fauna, and concentration of dissolved oxygen at the
42
sediment-water interface. Earlier, Word (1978) had proposed Ihe Infaunal Trophic Index(ITI), a characterization of the infaunal community based on feeding mode, as an approach forQuantifying the effects of organie loading on benthic community structure
COMBINATIO'l OF APPROACHES
Given the non·universality of the approaches described above, several investigators havereached the obvious conclusion that a combination of approaches should be attempted. The OSI ofRhoads and Germano Is Uself a combination of several measures, but each of them are responsiveprimarlly 10 organic loading and none of them are very responsive to toxic chemieals. TheSediment Quality Triad, described by Leng and Chapman (1985), provides for the side-by-sidecomparison of measures of toxie chemieal coneentrations In sedimenls. results from sedimentbioassays, and measures of benthic infaunal community structure. Reeently, the US EPA and thestale of Washington Department of Eeology relied on simullaneously determined chemicalconcentrations in sediments and sediment bioassay results 10 evaluate an application for disposalof dredged material (US EPAlWDOE 1985). The specifie approaches used in the latter two •combinations emphasize the effects of loxic chemieals and provide little lnsight to the problem oforganic loading•
• Carrying the multiple-measure approach one step further, . the US Natio~;I" Oce~nic andAtmospherie Administration (NOAA) recently has Initiated a pilot study In San Franelsco Baythat combines measures of toxie chemicals In sediments, several sediment bioassays, benthicinfaunal characterization, and calculation of the OSI. A full report on this pilot study will beavailable in early 1988. and will be immediately useful to the redesign of NOAA's nationwidemarine environmental Quality monitoring and assessmenl aetivities.
Efforts are continuing to develop methods for the measurement of sediment Quality thatultimately may result In standards for sediment Quality. Avallable measures allow theobservation of areas of degraded sediment Quality from both chemieal and biologicalperspectives. None of the approaches reviewed here allows attribution of an observed effect to aspecifie chemical or souree of contamination. Therefore regulation of contaminant sources basedon sediment Quality measures alone will be diflicull In those areas receiving a variety ofcontaminants from a variety of sourees, a relatively common situation. However, sedimentQuality measures can be used etlectively to describe the overall environmental Quality of a givenarea. highlighting those areas with such poor sediment Quality thaI responsible agencies shouldfeel compelled to take aclion.
REFERENCES
Long, E.R. and P.M. Chapman, 1985. A Sediment Quality Triad: measures of sedimenlcontaminalion. toxieity and infaunal community eomposition In Puget Sound. Mar. Poil. Bull.ll; 405·415

•
43
Neff, J.M., B.W. Cornaby, R.M. Vaga, T.C. Gulbranson, J.S. Scanlon, and D.J. Sean, in press.Americal Society for Testing and Materials, Proceedings 01 the Tenth Symposium on AquaticToxicology, May 4-6, 1986.
Rhoads, D.C. and J.D. Germano, 1982. Characterization of benthic processes using sedimentprofile imaging: An effecient method of Remote Ecological Monitoring of the Seafloor (REMOTSSystem). Mar. Ecol. Prog. Ser., ~ 115-12B.
Tetra Tech, 1985. Task 3. Evaluation of Approaches for the Development of Sediment OualityValues for Puget Sound. Dralt Report. DACW67-85-D-0029. Tetra Tech Inc, 1t 820 NorthupWay, Suite 100, Bellevue, Washington, 98005 USA.
US Environmental Protection AgencylWashington Department 01 Ecology, 1985. Interimdecision criteria for uncontained disposal of dredged material at the Port Gardner open-waterdisposal5ite. Unpublished. (Clted in Tetra Tech, 1985)
Word, J.O. The lnlaunal Trophic Index. 1978. Annual Report. Soulhern California CoaslalWater Research Project. pp. 19-40.

44
A BRIEF REVIEW OF APPROACHES TO MEASURING SEDIMENT QUAUTYDr. John A. Calder
APPENDIX A: Derivation 01 the Equilibrium Partitioning Approach lorDetermining Sediment Quality Criteria
EquiUbrium Partitioning (Sediment-Water) Approach
An equilibrium partitioning modells used to estimate interstitial water concentrations 01contaminants based on measured sediment contaminant levels. The estimated lnterstitial waterconcentration lor each contaminant Is compared to existing water qualily criteria. Theestimation 01 interstitial water concentrations Irom sediment concentrations involves a criticalassumption: the distribution 01 contaminant between sediment and Interstitial water is governedby rapid and continuous exchange between these !wo phases. This assumption 01 thermodynamicequilibrium at the sediment-water interface Implies that the sediment phase/aqueous phase •concentration ratio ls a constant. The distribution can be represented as:
where:KD • thermodyriamic sediment-water partition coefficient
es • sediment concentration
Ciw • Interstitial water concentration
It has been shown by several Investigators that KD values 01 nonpolar. nonionie organic
contaminants are correlated with the total organic carbon (TOC) content 01 sediments. Beeausethe organie mat1er In sediments apparently mediates the sediment-water exchange, sedimenteoncentrations 01 hydrophobie organic contaminants are normalized 10 TOC in using theequilibrium partitioning approach:
where:KOC • organic carbon-normalized partition coeffieient
'oe • 'raction 01 organie carbon in the sediment on a wl/wt
basis In deelmal 'orm
If a Koe value and a water quality criterion (Cw/er) are known lor a speeific contaminant. as
weU as the TOC in the sediment 01 Interest. then a sediment quality criterion (Cs/cr) can be
determined by:Cs/er • Koc x Cw/er x loe
•
45
Because KOC values are not available lor many contaminants. the more widely available Kow(octanol-water partition coeflicients) are used to estimate Koc values by:
log Koc • (a) log Kow + b
where a and bare empirically derived constants. This relationship implies that the partitioning01 a nonpolar. nonionic organic compound between water and an Immiscible sOlvent ismechanistically analagous to Its distribution between water and sedimentary organic matter.
Use 01 this approach requires acceptance 01 the assumptions that contaminants are distributed Insediments according to a steady-state equilibrium, and that the KO• or Kow' Is constant under all
conditions. Further. the approach requires the existence 01 a water quality criterion lor aspecilic contaminant. an assumption that the criterion is meaninglul, and a lurther assumptionthat the criterion is applicable to the Interslitial water-sediment environment as weil as to thewater column.
Equilibrium Partitioning (Sediment-Biota) Approach
An equilibrium partitioning model is used to estimate body burdens 01 contaminants Irommeasured sediment contaminant levels. The estimaled body burdens are compared to existinglegal limits lor residues in lood. This approach is very similar to the one described above andrequires that the lollowing assumptions be made:
1. thermodynamic equilibrium exists among sediment, interstitial waler and organisms withregard to lhe distribution 01 conlaminants;
- 2. the distribution 01 the contaminant between lipids in biota and organic maller in sediments Isconstant regardless 01 the specilic organism. sediment or contaminant being considered.
The equilibrium expression is:
where:Kb • distribution coelfieient between biota and sediment
C b concentration 01 conlaminant in biota. normalized to
lipid conlent
es. concenlration 01 contamlnant In sediment. normalized to
organic carbon content
BCF • bioconcentralion lactor.
46
This equation converts to:
log Cs - log Cb' log BCF.
If the BCF is known and if there is a legal limit for the concentration of a speclfic contaminant inbiota. then the corresponding limit. or criterion, for the sediment concentration level can becalculated. (One can assurne a value for lipid content and TOC, or use measured values.)
McElroy end Means (in press) define an "Apparent Preference Factor (APF)" as:
APF - (Csr'/oTOC)/(CtI'/olipid).
The APF is clearly the inverse of the BCF as described earlier. In their work involving twobenthic organisms end \WO sediment types. McElroy and Means demonstrale that the APF, andhence the BCF. is not a constant for e given contaminant, but seems to vary as a function of lhe •specific sediment and organism being investigated.
REFERENCE.
McElroy. A.E. and J.C. Means. in press. Factors Affecting the Bioavailability ofHexachlorobiphenyl to Benthic Organisms. Americal Society for Testing and Materials.Proceedings of the Tenth Symposium on Aquatic Toxicology, May 4·6,1986.

•
ANNEX 8
Ouestionnaire Regarding Collection and Analysisof Suspended Particulate Matter
(SPM)
Prepared under the auspices of the Working Group on Marine Sediments ofthe International Council for the Exploration of the Sea.
1. Do you col1ect SPM for analysis of chemical contaminants?__NO Please complete item 11 and return this questionnaire to
the address provided.__YES From --.-riverine environments (Check al1 that apply.l
__estuarine environments--IYlarine environments
2. What sampling methods are employed? (Check 2111 that apply.l
__sediment traps__collection of discrete water sampIes with subsequent
filtration__continuous pumping with on-board filtration__continuous pumping with in-situ filtration__continuous flow centrifugation__other (please describe)
3. If a filtration method is used. please describe the type and pore size oefilter used.
4. How do you determine and report the concentration of SPM in the watercolumn?
5. What precautions against contamination or degradation or the sampIeare taken?
47

-------------------------1
48
6. What chemical constHuents are determined?
7. What units (e.g., I1g/g, I1gll) are used to report the chemical results?
8. If results of your work with SPM have been pUblished, please givecitation(s).
9. Which aspect(s) of your work with SPM present(s) particular difficulty.and which might benefit from the exchange of views inherent inintercomparison exercises?
10. Would you be willing to participate in interlaboratory comparisonexercises for collection and analysis of SPM for chemical constituents.especially toxic chemical contaminants? ----.NO __YES __YES, underthe following conditions:
11. Respondents Name _Address _
Please return this form to: Environment OfficerICESPalaegade 2-4DK-1261 Copenhagen K, DENMARK

•
•
ANNEX 9
International Council for the Exploration of the Sea.
Working Group on j-Iarine Sediments in Relation to Pollution.
"This paper not to be cited without prior reference to theauthor"
SEDIMENT TRAPS IN POLLUTICN MONITORING. A REVIEW.
by
N<2s, Kristoffer
Norwegian Institute for Water Research
49
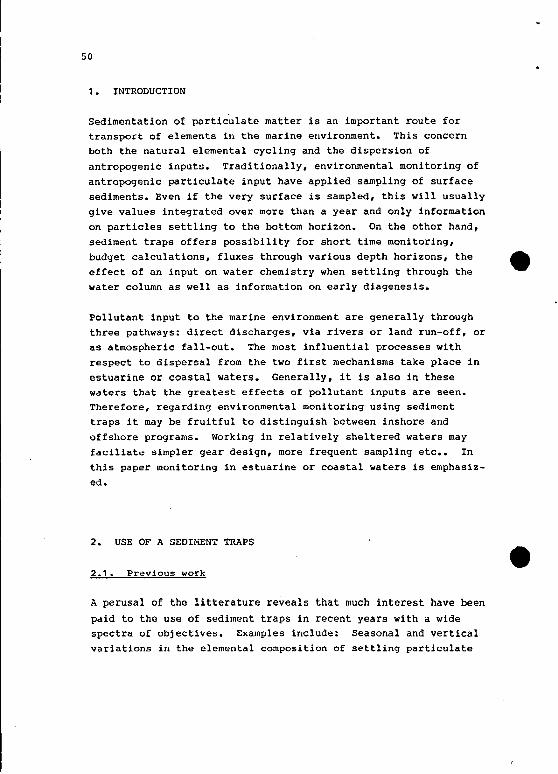
50
1. INTRODUCTION
Sedimentation of partic~late matter is an important route fortransport of elements in the marine environment. This concernboth the natural elcmental cycling and the dispersion of
antropogenic inputs. Traditionally, environmental monitoring of
antropogenic particulate input have applied sampling of surfacesediments. Even if the very surface is sampled, this will usually
give values integrated over more than a year and only information
on particles settling to the bottom horizon. On the other hand,sediment traps offers possibility for short time monitoring,
budget calculations, fluxes through various depth horizons, the ~
effect of an input on water chemistry when settling through thewater column as well as information on early diagenesis.
Pollutant input to the marine environment are generally throughthree pathways: direct discharges, via rivers or land run-off, oras atmospheric fall-out. The most influential processes withrespect to dispersal from the two first roechanisms take place in
estuarine or coastal waters. Generally, it is also in thesewaters that the greatest effects of pollutant inputs are seen.Therefore, regarding environmental monitoring using sediment
traps it may be fruitful to distinguish between inshore andoffshore programs. Working in relatively sheltered waters may
faciliate simpler gear design, more frequent sampling etc.. Inthis paper monitoring in estuarine or coastal waters is emphasiz
ed.
2. USE OF A SEDI~~NT TRAPS
2.1. Previous work
A perusal of the litterature reveals that much interest have been
paid to the use of sedilnent traps in recent years wi th a widespectra or objectives. Examples include: Seasonal and verticalvariations in the elemental composition of settling particulate
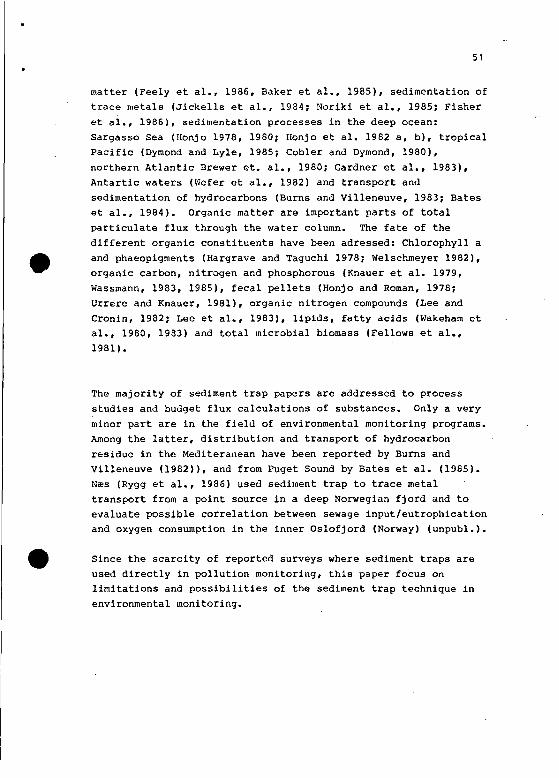
•
51
matter (Feely et al., 1986, Baker et al., 1985), sedimentation of
trace metals (Jickells et al., 1984; Noriki et al., 1985; Fisheret a1., 1986), sedimentation processes in the deep ocean:
Sargasso Sea (Honjo 1978, 1960; llonjo et al. 1982 a, b), tropicalPacific (Dymond and Lyle, 1985; Cobler and Dymond, 1980),
northern At1antic Brewer et. al., 1980; Gardner et a1., 1983),Antartic waters (Wefer et al., 1982) and transport and
sedimentation of hydrocarbons (Burns and Villeneuve, 1983; Bateset al., 1984). Organic matter are important parts of total
particu1ate flux through the water column. The fate of thedifferent organic constituents have been adressed: Chlorophyll a
and phaeopigments (llargrave and Taguchi 1978; Welschmeyer 1982),organic carbon, nitrogen and phosphorous (Knauer et al. 1979,
Wassmann, 1983, 1985), feca1 pellets (Honjo and Roman, 1978;Urrere and Knauer, 1981), organic nitrogen compounds (Lee and
Cronin, 1982; Lee et al., 1983), lipids, fatty acids (Wakeham eta1., 1980, 1983) and total microbia1 biomass (Fellows et al.,
1981).
The majority of sediment trap papers are addressed to processstudies and budget flux ca1cu1ations of substances. Only a very
minor part are in the fie1d of environmental monitoring programs.Among the latter, distribution and transport of hydrocarbon
residue in the Mediteranean have been reported by Burns andVilleneuve (1982», and from Puget Sound by Bates et al. (1985).N~s (Rygg et a1., 1986) used sediment trap to trace metal
transport from a point source in a deep Norwegian fjord and toeva1uate possible correlation between sewage input!eutrophicationand oxygen consumption in the inner Oslofjord (Norway) (unpub1.).
~ Since the scarcity of reported surveys where sediment traps areused directly in pollution monitoring, this paper focus onlimitations and possibi1ities of the sediment trap technique in
environmental rnonitoring.

S2
2.2. Trap design
Generally, it may be distinguished between the following types ofsediment traps:
1. Bottom sediment traps: (a) sediment vessel at or elose tothe sediment surfaee and (b) sediment vessel above thesediment surfaee.
2. Buoy-earried sediment traps: (a) moored sediment traps,
and (b) free-drifting sediment traps.
Controversial opinions eoneerning the use of sediment traps,their eonstruetion as weIl as the validity of sediment trap data,have been raised. However, after 1aboratory and field
in~~stigations,'prim~riiYbYGardner (1980 a, b), B10esch and
Durns (1980), Blomqvist and Häkanson (1981) and Häkanson andJanson (1983), it was eoneluded: (1) simple cy1inders would bethe most favorable form for a sediment vessel in all types of
waters (stagnant or turbulent, 1imnie or marine), (2) bottleshöped vessel overtrap sediments, (3) funnels generally yieldunderdeposition. If using eylinders, the vessels should have adiameter of minimum 4 em and a height/diameter-quotient (aspeetratio) larger than 3. In very turbulent waters the aspect ratioshould be inereased. If these requirements are met, parallelsylindrical vessels usually give satisfaetory results.
However, even if sylindrical traps are used, recent research by
Dutman et al. (1986) and Butman (1986) demonstrates that problems
still exists of getting unbiased sampIes, especially in nearshore, shelf or slope environments where flow and particledynamics are complex. According to these authors, trap Reynolds
number must also be taken into consideration along with aspect
ratio and trap geollletry when evaluating relative particlecollection efficiencies. Clearly, more research is needed to
improve our understanding of partiele trapping mechanisms in
search to identify a truly unbiased collector.
The most frequently used traps are buoy-carried types. Different
•
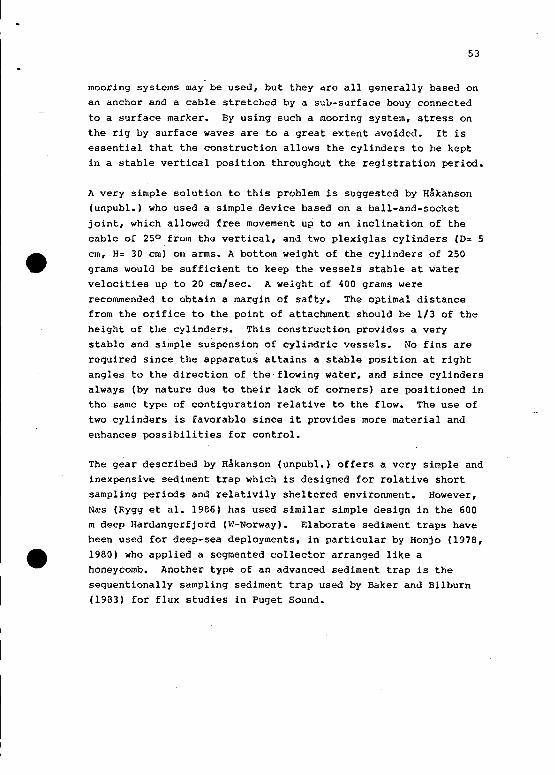
•
•
53
mooring systems may be useu, but they are all generally baseu onan anchor and a cable stretched by a sub-s~rface bouy connected
to a surface marker. By using such a mooring system, stress on
the rig by surface waves are to a great extent avoideu. It isessential that the construction allows the cylinders to be kept
in a stable vertical position throughout the registration period.
A very simple solution to this problem is suggested by Hakanson(unpubl.) who used a simple deviee based on a ball-and-socket
joint, which allowed free movement up to än inclination of thecable or 250 from the vertical, and two plexiglas cylinders (D= 5
cm, H= 30 cm) on arms. A bottom weight of the cylinders of 250
grams would be sufficient to keep the vessels stable at watervelocities up to 20 em/sec. A weight of 400 grams were
reconmended to obtain a rnargin of safty. The optimal distaneefrom the orifice to the point cf attachment should be 1/3 of theheight of the cylinders. This construction provides a very
stable and simple suspension of cylindric vessels. No fins arerequired since the apparatus attains a stable position at rightangles tu the direction of the'flowing water, and since cylindersalways (by nature aue to their lack of corners) are positioned inthe same type cf contiguration relative to the flow. The use oftwo cylinders is favorable sinee it provides more material andenhances possibilities for control.
The gear deseribed by Ha.kanson (unpubl.) offers a very simple andinexpensive sediment trap whieh is designed for relative short
sampling per iods and relativily sheltered environment. Ilowever,
Na!s (I\Y99 et al. 1986) has used similar simple design in the 600m deep Hardangerfjord (W-Norway). Elaborate sediment traps havebeen used for deep-sea deployments, in particular by Honjo (1978,
1980) who applied a segmented collector arranged like ahoneycomb. Another type of an advanced sediment trap is the
sequentionally sdmpling sediment trap used by Baker and Bilburn(1983) for flux studies in Puget Sound.
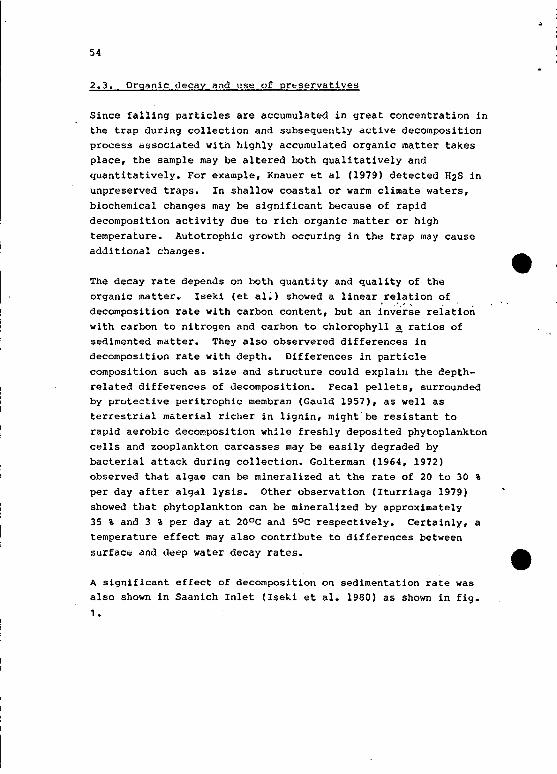
54
2.3. Organic oecay and use of pr~servatives
Since falling particles are accumulated in great concentration inthe trap ouring collection and subsequently active decolllpositionprocess associated with highly accumulated organic matter takesplace, the sample may be altered both qualitatively andquantitatively. For example, Knauer et al (1979) detecteu H2S inunpreserved traps. In shallow coastal or warm climate waters,biochendeal changes may be significant because of rapiddecomposition activity due to rich organic matter or hightemperature. Autotrophie growth occuring in the trap may causeadditional changes.
The decay rate depends on both quantity and quality of theorganic matter. Iseki (et al~) showed a linear relation ofdecomposition rate with carbon content, but an inv~~~e reiationwith carbon to nitrogen and carbon to chlorophyll ~ ratios ofsedimented matter. They also observered differences indecomposition rate with depth. Differences in particlecomposition such as aize and structure could explain the depthrelated differencea of decomposition. Fecal pellets, surroundedby protective peritrophic membran (Gauld 1957), as wel1 asterrestria1 material richer in lignin, might'be resistant torapid aerobic decomposition whi1e fresh1y deposited phytoplanktonce1ls and zooplankton carcasses may be easi1y degraded bybaeterial attaek during colleetion. Golterman (1964, 1972)observed that algae ean be minera1ized at the rate of 20 to 30 ,per day after a1ga1 lysis. Other observation (Iturriaga 1979)showed that phytoplankton can be mineralized by approximately35 % and 3 % per day at 200 C and 50 C respectively. Certainly, atemperature effect may also contribute to differences between
surfac~ unu ueep water decay rates.
A significant effect of decomposition on sedimentation rate wasalso shown in Saanich Inlet (Iseki et al. 1980) as shown in fig.
1 •
•. '.

55
7,0
6,0k:030 ~=025
~=020
5,0k=015
4,0
~O~=010
Zp k:005
k=OOl• 1,0 k=OOO
Ft/A 00 10 15 10 25 30
Suspension period (days)
Fig. 1. Changes in the rate of gross sedimentation to apparent
sedimentation (Ft/A) in the course cf suspension
period. Decomposition rate represents as k. Grosssedimentation rate is given as 10 mg (cyl x d) -1.(k = -1/t x Cu [(No - t:. D)/No] where No is the initial
amount of sedimented carbon and A D is .the decreased
amount of carbon during t days). After Iseki et al.1980.
•In flux measurements from inner Oslofjord, Norway, N~s (unpubl.)observed a 30 % difference in total particulate matter betweell
preserved (chloroform) and unpreserved traps deployed at 65,· 80and 125 m waterdepth (temp. 5-100 C) over a six week per iod.
Sounders (1972) showed a decomposition rate of particulate matter(mainly dead phytoplankton) ranging from 14 % per day in thebeginning of his experiment to 0,3 to 5 % per day for 3 days olddetritus.
The decay cf crganic matter in sediment traps deplcyed in the
deep ocean has among other been addressed by Gardner et al.(1963). Their observations and experiments indicated that the
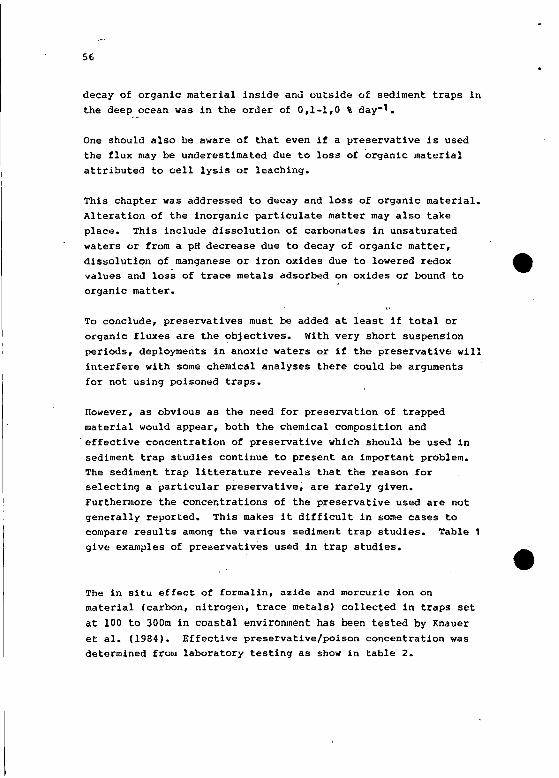
56
decay of organic material inside anu outside of sediment traps inthe deep ocean was in the order of 0,1-1,0 % day-1.
One should also be aware of that even if a preservative is used
the flux may be underestimated due to loss of organic materialattributed to cell lysis or leaching.
This chapter was addressed to decay and 1055 of organic material.Alteration of the inorganic particulate matter mayaIso takeplace. This incluue dissolution of carbonates in unsaturated
waters or from a pR decrease due to decay of organic matter,
dissolution of manganese or iron oxides due to lowered redox ~
values anu loss of trace metals adsorbed on oxides or bound toorganic matter.
To conclude, preservatives must be added at least if total ororganic fluxes are the objectives. With very short suspension
periods, deployments in anoxie waters or if the preservative will
interfere with some chemical analyses there could be argumentsfor not using poisoned traps.
1I0wever, as obvious as the need for preservation of trapped
material would appear, both the chemical composition and"effective concentration of preservative whieh should be used in
sediment trap studies continue to present an important problem.The sediment trap litterature reveals that the reason forselecting a particular preservative, are rarely given.
Furthermore the concentrations of the preservative used are notgenerally reported. This makes it difficult in some cases tocompare results among the various sediment trap studies. Tablegive examples of preservatives used in trap studies.
The in situ effect of formalin, azide and mercuric ion onmaterial (carbon, nitrogen, trace metals) collected in traps set
at 100 to 300m in coastal environment has been tested by Knaueret ale (1984). Effective preservative/poison concentration wasdetermined from laboratory testing as show in table 2.

•Table 1. Examples of COlMlon "preservat.ives" used in previous trap studies.
Mode of
~reservative Concentrat.l.on
preservat.l.ve
delivery
Paramet.er( s)
mea5ured Reference
Chloroform Not glven
Chloroform Not given
Buffered gluc.aral- 2 •dehyde
Paraformaldehyde 5 •f"ormalin 10 •A'Zlde Not. gl..ven
Sodium azide Not ql..ven
;"zloe , l'iaCl NOt: gi.ven
Prahl and
Gardner. 1981
Carpenter, 1919
Zeitzschel et a1.. 1978
Wefer et a1 .• 1982
Wassmann, 1983, 1985
Orqanic nitrogen Lee and Cron),n. 1982
Decompos i t ion
oE sqlJid pens,
lohster tails,
shr lmp
Feea1 pe11ec.s.
polycyclic aromatic
hydrocarbons
Opal, amino acids,
sugars, calci~e,
a1lJminosi1icates, etc.
Not given
Total particu1ate
macter. C, N. ChI. a
Feea1 pellets Go.... inq and Silver, 198)
Total particu1ate Baker et a1 .• 1985
matter, Al. C, ehr. a
:eca). pel,lec.s, ViHl0US l1onJO, L':l/D
organisms, bioqenlc
carbonates
Free in collector
Pree 1n solution
Free in collector
Free in dens 1. cy
solution
Released from
Free in dens.l ty
salut ion
Oispensed from
diffuser chamber
Free 10 501uc.ioo
LJispensea trom
dlffuser chamber
Not. given
Not. qiven"
Not qiven
Mereur: ic chlor ide
in conc br 1 oe
Chloroform
Mereur ic chlor ide
"Rock sollt" ~
oyster shell
H)P0 4 , Holet
Not glven
0,5 M, 1,S M
Denslty solutlon
free Ln denslty
So1utlon
Feeal pellets
ATP, ADP, AMP
Dunbar and Berger, 1981
Fello....s et al., 1981

58
Table 2. Effects of selected preservatives on the incorprationof 3H adenine into total nucleics acids for a surfaceseawater microbial population.
Treatment
Control (no preservative)Formalin
(CH20)
Azide (NaN3)
~Iercury
(HgC1 2)
Preservative
concentration
0,01 ~I
0,06O,GO
1,25·0,25 mM
1,202,5
12,025,00,25
0,50
2,55,e
3H-Adenine
incorporation Percent ofnCi 1-1 control
29,2 100
1,0 3,4 •0,36 1,20,91 3,10,0 0
21,5 7413,6 4710,a 402,44 a,30,96 3,31,07 3,71,02 3,51,16 3,91,02 3,5
·1,25 i~ formalin treatment (=10 % formalin) used as adsorptioncontrol. Absolut radioactivity incorporated was equivalent to<I % of contro1 sampIe.(After Xnauer et al., 1984).
Substantial differences between treatments were observed byKnauer et al. (1984). Effects were not uniform, and appeared to
be parameter-specific. During short-term Clep10yment (six days),
no significant differences in C flux were observed at 100 m,r8gardless of preservative used. Traps treated with azideyielded significantly lower N values. At 300 m (short-term
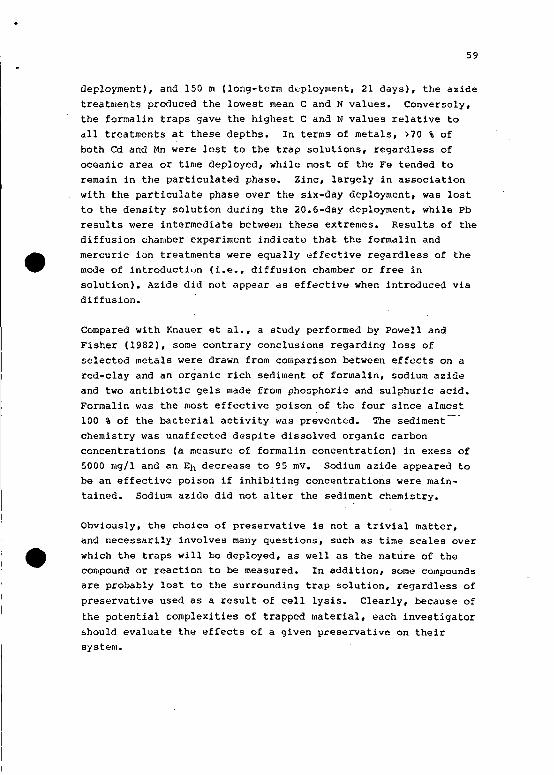
•
•
59
cleployment), and 150 m (long-term d",ployment, 21 days), the azide
treatments produeed the lowest mean C and N values. Conversely,the formalin traps gay<! the highest C and N va lues relative to
all treatments at these depths. In terms of metals, >70 % ofboth Cd anel Mn were lost to the trap solutions, regardless of
oeeanie area or time eleployed, while most of the Fe tended toremain in the partieulated phase. Zine, largely in association
with the partieulate phase over the six-day deployment, was lostto the density solution during the 20.6-day deployment, while Pbresults were intermediate betweell these extremes. Results of thediffusion chamber experiment indicate that the formalin and
mercuric ion treatments were equally ~ffective regardless of themode of introduetion (i.c., diffusion chamber or free insolution). Azide did not appear dS effeetive when introduced viadiffusion.
Compared with Knauer et al., a studt performed by Powe11 andFisher (1982), some contrary conc1usions regarding 10ss of
se1eeted metals were drawn from eomparison bet~leel1 effeets on ared-e1ay and an organic rich sedihlent of formalin, sodium azide
and two antibiotic gels made from phosphoric and su1phurie acid.
Formalin was the most effective poison of the four sinee almost100 % of the bacterial activity was prevented. The sediment
chemistry was unaffected despite dissolved organic carbonconeentrations (a measure of formalin eoneentration) in exess of5000 mg/l anel an Eh decrease to 95 mV. Sodium azide appeared tobe an effective poison if inhibiting eoncentrations were maintained. Sodium aziele did not alter the sedi~ent chemistry.
Obviously, the choiee of preservative is not a trivial matter,and necessarily involves many questions, such as time seales over
which the traps will be deployed, as weIl as the nature of theeompound or roaetion to be measured. In addition, some compoundsare probably lost to the surrounding trap solution, regardless of
preservative used as a result of cell lysis. Clearly, beeause of
the potential cornplexities of trapped material, eaeh investigator~hould evaluate thc effeets of a given preservative on theirsystem.
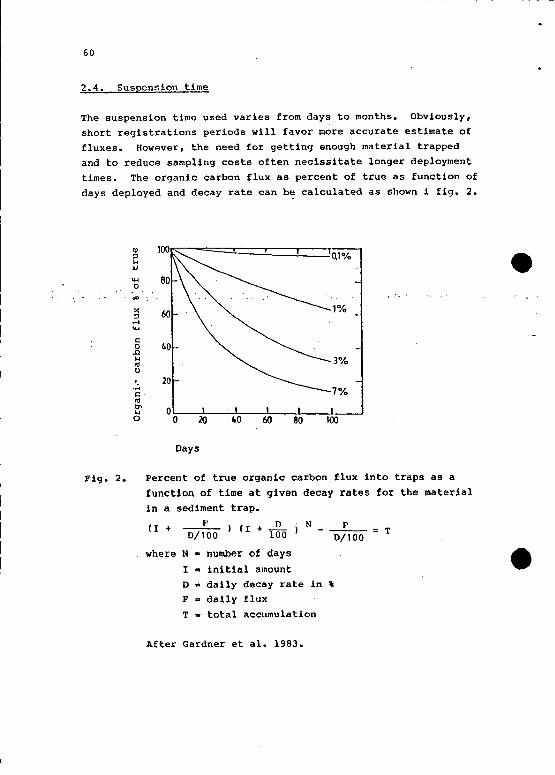
60
2.4. Suspension time
The suspension time used varies from days to months. Obvious1y,short registrations periods will favor more accurate estimate off1uxes. However, the need for getting enough material trappedand to reduce samp1ing costs often necissitate longer dep10ymenttimes. The organic carbon f1ux as percent of true as function of
days dep10yed and decay rate can b~ ca1cu1ated as shown i fig. 2.
~~H~
~
0\ . . @
x~~
~
c0~
H~
0. M~c~~ 0H0 0 ~
Days
40 80
. :.
1%
3%
7%
100
•
Fig. 2. Percent of true organic carbon f1ux into traps as a
function of time at given decay rates for the material
in a sediment trap.
(I + ___F ) (I + 00/100 100
N F
0/100T
where N number of days
I • initial amounto • dai1y decay rate in ,F = daily flux
T = total accumu1ation
After Gardner et ale 1983.

•
61
The curves in fig. 2 place constraints on the recon~ended lenghtof ueployment when traps are used to calculate organic carbon
flux. For a maximum error of 10 % in the organix flux,deployments would hdve to be limited to less than 4 days if daily
decay started at 7 % based on the equation given by Gardner et al
(1983).
Their experiments reported decay rates of 0,5-1,0 % per day for
unpoisoned material, which would dllow deployments of 22-44 days~ith less than 10 % error and 0,1-0,5 % per day for poisonedmaterial which would allow deployments up to 216 days with only a
10 % error due to decaying material. This assumes the sampie iscollected in the bot tom of a trap where overlying water is
readily exchanged. Where sampies are concentrated into a longnarrow collection tube (cm's wide) and new sampie continually
buries old sampie, the decay rates may slow down due to isolation
of the sampie and/or the creation of anoxie condition.
3. CONCLUSIONS
Sediment traps are generally comparatively simple instruments, atleast if restricted to inshore use, which may be utilized formany purposes. Obvious sediment trap data are needed for budget/
flux ealculations. They offer good opportunity for short time
(less than d year) environmental monitoring, or dispersionstudies. Transport and flux though selected depth horizons canbe addressed as weIl as variations with time and season. Effectsof discharge restrietions can quickly Le verified. Further, the
stress upon botttom Ilving organisms by hypersedimentation orsedimentation of harmful substances may be indicated. Importantinformations on water chemistry from particle alterations duringsettUng can be obtained from sediment trap data. Examples of
this is the dependance of oxygen comsumption on organic particle
decay. If trap data are compared with the surface sediments
chemistry, the role of early diagenesis may be postulated.
62
As argued above, the use of sediment traps might be an important
tool in pollution monitoring. However, even if good, apparentlyundisturbed data from parallel sediment vessels have been
obtained, one would still face interpretational problems.Sediment trap data must always be treated with care. The
problems that any user should bear in mind is the effect of
mineralization, preservation and exposure time. It is notpossible to give universial answer to these questions because
they depend on the objectives for the study to be undertaken andon the parameters to be analyzed. However, these problems shouldbe carefully evaluated and reported in all papers in order to
facilitate intercomparisoll.
Problems also exist, and will presumably never be solved,concerning marking and inquisitive people. This.:is, however, notonly a :;erious drawback with the sediment trap technique, but a
general problem encountered with all types of long-termregistration in the field. Despite all these limitations, the
use of sediment traps in pollution monitoring will be beneficial
for many purposes.
•
63
4. REFERENCESBaker, E.T., R.A. Feely, M.R. Landry and M. Lamb, 1985.
Temporal variations in the concentration and settling fluxof carbon and phytoplankton pigments in a c.J.eep fjordlike
estuary. Estuar. Coastal and Shelf Sei., 21 : 859-877.
Baker, E.T. and H.B. Milburn, 1933. Aninvestigation of particle fluxes.
1 : 425-435.
instrument system for heContinent. Shelf. Res.,
•
Bates, T.S., S.E. öamilton and J.D. Cline, 1984. Verticaltransport and sedimentation of hydrocarbons in the centralmain basin of Pudget Sound, Washington. Environ. Sei.
Tech., 18 : 299-305.
Bloesch, J. and N.M. Burns, 1980. A critical review ofsedimentation trap technique. Schweiz. Z. Hydroi., 42 15
55.
Blomquist, s. anc.J. L. ö':;'kansoll, 1961. A review on sediment trapsin aquatic environments. Arch. Hyc.J.robiol., 91 : 101-132.
Brewer, P.G., Y. Nozaki, D.W. Spencer and A.P. Fleer, 1980.Sediment trap experiment in the deep North Atlantic:Isotropie and elemental fluxes. J.Mar. Res., 38 : 703-728.
Burns, K.A., and J.P. Villeneuve, 1983. Biogeochemicalprocesses affecting the distribution and vertical transportof hydrocarbon residues in the coastal l·iedi terranean.
Geochim. Cosmoehim. Acta, 47 995-1006.
Butman, C.A. 1936. Sediment trap biases in turbulent flows:Results from a laboratory flume study. J.Mar. Res., 44:
645-693 •

64
Butman, C.A., W.D. Grant and K.D. Stolz~nbach 1986. Predictiollsof sediment trap biases in turbulent flows: A theoreticalanalysis based on observations from the litterature. J.Mar.Res., 44 : 601-644.
Cob1er, R. and J. Dymond, 1980.Galapagos Spreading Center,209 : 801-803.
Sediment trap experiment on theequatorial Pacific. Science,
Dymond, J., and M. Lyle, 1935. Flux comparisons betweens~diments and sediment traps in the eastern tropica1 ~
Paeifie: Implications for atmospherie C02 variations duringth~ Pleistocene. Limnol. Oeeanogr., 30 : 699-712.
Feely, R.A., G.J. ~~ssoth, E.T. Baker, J.F. Gendron, A.J. Paulsonanu E.A. Creulius, 1986. Seasonal and vertieal variations inthe elemental eomposition of suspended and settlingparticu1ate matter in Puget Sound, Washington.Estuar.Coastal and Shelf Sci., 22 : 215-239.
Fellows, D.A., D.M. Karl and G.A. Knauer, 1981.fluxes and the vertieal transport of living..Ipper 1500 IR of the northeast Paeife Ocean.28A : 921-936.
Large partiele
carbon in heDeep Sea Res.,
Fisher, K., J. Dymond and M. Lyle, A. Sontär and S. Rau, 1986.The benthie cycle of copper: Evidenee from sediment trapexperiments in the eastern tropical North Paeific Ocean:Geochim. cosmochim. Acta, 50 : 155-1543.
Gardn~r, ...D., 1980 a. Sediment trap dynamlcs and calibraUon: a
laborat~ry evaluation. J. Mar. Res., 38 : 17-39.
Gardner, ~l.D. 1980 b. Field assessrnent of sediment traps. J.
Mar. Res., 38 : 41-52.

•
65
Gardner, W.D., K.R. Hinga and J. Marra, 1983. Observations on
the degradation of biogenie material in the deep oeean withimplieations on aecuracy of sediment trap fluxes. J. Mar.
Res., 41 : 195-214.
Gardner, W.D., M.J. Riehardson, K.R. Hinga and P.E. Biscaye,1983. Resuspention measured"with-sediment traps in a high
energy environment. Earth. Planet. Sei. Lettters, 66 :
262-278.
Gauld, D.J., 1957. A peritrophie membrane in calanoid eopepods.
Nature, Lond., 179 : 325-326.
Golterman, H.L. 1964. Minera1ization cf algae under sterileeonditions or by bacterial breakdown. Verh. int. Verein.
theor. angew. Limno1., 15 : 544-548.
GolterlllaIl, H.L. 1972. The ro1e of phytoplankton in detritusformation. Mem. Ist. Ital. Idrobio1., 29 (suppl.) : 89-103.
Hargrave, B.T. and S. Taguehi, 1978. Origin of depositedmaterial sedimented in a marine bay. J. Fish. Res. Board.
Can., 35 : 1604-1613.
Banjo, S., 1978. Sedimentation of materials in the Sargasso Sea
at a 5,367 deep station. J. Mar. Res., 36 : 469-492.
Banjo, S., 1980. Material fluxes and modes of sedimentation inthe mesopelagie and bathypelagie zones. J. Mar. Res., 38 :
53-97.
Bonjo, S., S.J. Manganini and J.J. Lole, 1982. Sedimentation ofbiogenie matter in the deep ocean. Deep Sea Res., 29 : 609
625.

66
Honjo, S., S.J. Manganini and L.J. Poppe, 1982. Sedimentation oflithogenic particles in the deep ocean. ~Iar. Geol., 50 :1999-220.
Honjo, S. and I-I.R. Roman, 1978. Marine copepoo fecal pellets:production, preservation and sedimentation. J. i'lar. Res.,36 : 45-57.
H-!kanson, L. (unpubl.). Suspension and cal1bration of a sedimenttrap. National Swedish Enviro~~ental Protection BoarJ,
Uppsala, Sweden. ~
Häkanson, L. and M. Jansson, 1983. Principles of lake
sedimentology. Springer-Verlag, Heidelberg, 316 p.
Iseki, K., F. Whiney and C.S. Wong, 1980. Biochemical changes ofsedimented matter in sediment trap in shallow coastal
.waters. Bull. planke Soc. Japan, 27 : 27-36.
Iturriaga, R., 1979. Bacterial activity related to sedimentingparticulate" matter. Mar. Bioi., 55 157-169.
Jickells, T.O., li.G. Denser and A.H. Knap, 1584.
The sedimentation rates cf trace elements in the SargassoSea measured by sediment trap. Deep Sea Res.," 31 : 11691178.
Knauer, G.A., D.M. Karl, J.H. Martin and C.N. Hunter, 1984. Insitu effects of sdlected preservatives on total carhon,
nitrogen and metals collected in sediment traps. J .~Iar.
Res., 42 : 445-462.
Knauer, G.A., J.H. Martin and K.W. Bruland, 1979. Fluxes of
particulate carbon, nitrogen and phosphorous in the upfler
wate'r column of the northeast Pacific. Deep Sea Res.,26 A : 97-108.
67
Lee, C., S.G. Wakeham and J.W. Farnington, 1983. Variations in
the cOi\1position of particulate organic matter in a time
series sediment trap. Mar. Chem., 13 : 181-194.
Lee, L. and C. Cronin, 1982. The vertical flux of particulateorganic nitrogen in the sea: decornposition of amino acids inthe Peru upwelling area and the equatorial Atlantic. J.Mar. Res., 40 : 227-251.
Noriki, S., N. Ishimori, K. HaraJa and S. Tsunogai, 1985.
Removal of trace metals from seawater during a phytoplankton
bloom as studied with sediment traps in Funka Bay, Japan.
Mar. Chem., 17 : 75-89.
Powell, H. and K. Fisher, 1982. Comparison study of bactericidesfor seJirnent traps. EOS, 63/45.
Skei,J., B.Rygg and K.N~s, 1986 (in Norwegian). Tiltaksorienterte milj0unders0kelser i S0rfjorden og Hardangerfjorden1984/85. Delrapport 1: SedimentfeIler, bunnsedimenter ogb10tbunnsfauna. Statlig program for forurensningsover
vakning (SFT), Rapp.nr. 222/86. NIVA 0-8000309. 62s.
Saunders, G.W. 1972. The transformation of artificial detritus
in lake waters. Hem. Ist. ital. Idrobiol., 29 (suppl) : 261-288.
Urrere, 11.A. aud u.". Knauer, 1981. Zooplankton fecal pelletfluxes and vertical transport of particulate organicmaterial in the pelagic environment. J. Plank. Res., 3369-3G7.
Wakeham, s.G., J.W.
G.B. Nigrelli,
Organic matter
Atlantic Ocean.
Farrington, R.B. Gagosian,
B.W. Tripp, S.O. Smith and
fluxes from sediment traps
Nature, 286 : 798-800.
C. Lee, H. DeBaar,
N.M. Frew, 1980.
in the equatoria1

68
Wakeham, S.G., C. Lee, J.W. Farrington and R.ß. Gagosian, 1984.Biogeochemistry of particu1ateorganic matter in theoceans: Resu1ts from sediment trap experiments.Deep Sea Res., 31:509-528.
Wassmann, P., 1933. S",dir.lentation of organic and inorganicparticulate material in Lindäspollene, a stratified, land
locked fjord in western Norway. Mar. Ecol. Prog. Ser., 13237-248.
Wassmann, P., 1985. Sedimentation of praticulate material in two
sha11ow, 1and-locked fjorus in western Norway. Sarsia, 70 : e317-331.
Wefer, G., E. Suess, W. Balzer, G. Liebezeit, P.J. Müller, C.A.Ungerer and W. Zenk, 1982. Fluxes of biogenic componentsfrom sediment trap deployment in circrnnpolar waters of theDrake Passage. Nature, 299 : "145-147.
~lelchmeyer, N.A., 1982. The dynamics of phytoplankton pigments.
Implications for zooplankton grazing and growth. Ph.D.dissertation, Univ. of Washington, 176 pp.

69
ANNI;X 10
SAMPLING OF SUSPENDED PARTICULATE MATTER (SPM)
FOR THE ANALYSIS OF TRACE MET ALS
by
L. Brügmann
Institut für Meereskunde, 253 Warnemünde, Seestrasse 15
Sehliessfaeh 38, German Demoeratie Republie
Frequently, it has been demonstrated that the mode of eolleetionfor suspended partieulate matter (vaeuum/pressure, in-line/offline filtration, eentrifugation ete.) and the quality of the applied equipment (type, pore size, blanks, material of filters,modes used for the eleaning of filters, vessels, tubes, filterholders, ete.) may influenee the results of analyses of the totaleoneentration of SPM per volume and its trace metal contentconsiderably.
Examples:
1) ,Tambiev and Demina (1982) eompared 3 filters ("A": 0.7 ~m (0.3- 1.0 ~m) cellulose nitrate membrane; "B": 0.4 ~m (0.32 - 0.42~m) polycarbonate Nuclepore; "Co: 0.5 ~m (0.47 - 0.51 ~m)
polyethyleneterephthalate "Dubna", manufaetured similar to"Nuclepore" filters) on their vaeuum filtration effieiency onsampies from the brackish Baltie Sea. Whereas with filters "B"and "C" seston eoncentrations of 0.60 and 0.73 mg/I werefound, filter "A" resulted in a five to six times higher meanvalue (3.6 mg/I). The metal blank (in ~g/filter areal of filter "A" was several times higher than for "B" or' "C" (determined for the elements Zn, Cu and Ni).
2) Danielsson found that 0.45 ~m Millipore membrane ~ilters mayintroduce large errors due to the changing pore S1ze duringthe course of the filtration. For instance, the iron coneentrations measured in the filtrate deereased sharply and becamenearly zero when the filters were clogged and when the veryfine and eolloidal dispersed fractions were also retained. 0.4~m Nuelepore filters behaved similarly. 'However, the cloggingpoint was better and more sharply marked.
3) Brzezinska-Paudyn ~'äl. (1985) compared the effieiency ofthree filter types, namely, an 0.4 ~m Nuelepore, an 0.45 ~m
cellulose acetate and an '0.45 ~m' glass fiber filter, for theeollection of SPM and partieulate traee metals in the southernBaltie Sea. Again, the amount of SPM eollected by both 0.45 ~m
filter types (mean: 9.8 mg/I, range: 6.8 - 12.9 mg/I for eachfilter) was higher than with 0.4 ~m Nuclepore filters (6.4mg/I, 5.1 7.7 mg/I). However, the SPM eollected with theNuclepore filters was found to bear significantlY highercontents of many metals in relation to the other filter types.By this, the partieulate metal eoneentration per volume of
70
sampie of all three filter types became aqain closer to eachother. (This would imply that the 'excessive' SPM sampled bythe qradually cloqqinq membrance filters is relatively poor inmetals.)
The information taken from the literature and our own experiencelead us to use exclusively filters of the Nuclepore and relatedtypes (e.q., 'Dubna') for filtration of sea water for lateranalysis of the SPM for trace metals. The SPM samplinq procedureused by the Institute of Marine Research, Rostock-Warnemünde resulted in low mean ses ton concentrations for the Baltic Sea (below 1 mq/l), much lower than previously published data. The following procedure is in use (Brüqmann, 1986):
a) 0.4 ~m/47 mm diameter Nuclepore filters are leached severalweeks in 2 N HCI (suprapure quality), washed and soaked with eseveral aliquots 'of 'Milli Q water' (MQW), dried under alaminar box, kept over desiccatives, pre-weiqhed on anelectronic microbalance and wrapped in pre-numbered parchmentenvelopes.
b) Under the laminar box the filter holders are equipped with thefilters moistened with MQW.
For offshore sea water the SPM samplinq is performed on-line from30 1 "GO-flo' sampiers. The outlet of the sampier is connectedvia a plastic tube with the (Nuclepore) filter holder (previouslycleaned by soakinq with diluted HC1 and MQW). The SPM is collected from the total volume of the sampier by pressure filtration (maximum about 0.7-0.8 at). The pressure is kept by an Arflask, connected via tubes with the upper opening of the sampier.Inside this tube a qlass frit is inserted to avoid the transferof fine metal parts from the pressure equipment into thesample(r).
The filters are transferred dust-protected into a 50 ml plastic(Millipore) syrinqe connected with a filter holder. The filtersare washed two times with 10 ml MQW, two times folded--usinq teflon pincettes--with the loaded surface inside, brouqht back intothe parchment envelope and stored in a deep-freezer.
Before further treatment in the land laboratory (leachinq with0.5 N HCI, followed by "total" decomposition with HF/HNOJ/HCI ina teflon vessel of 6 ml volume which is inserted into an Al blocktoqether with 19 other vessels for pressure bomb digestion), theloaded filters are again dried under a clean bench, held over ~
desiccatives and re-weiqhed. ...
For Baltic waters with more than 10 times hiqher SPM concentrations, an off-line pressure filtration is performed. For thispurpose, between 0.5 and 2 1 water are filtered usinq a Sartoriusfilterinq device "SM 16511" under a laminar box. Filter types,their preparation, pressure, storage conditions and furthertreatment are the same as those described for the sea water online filtration.
Most important for the'off-line filtration is the use of a representative sub-volume of the total sampie. Therefore, before retrieving the sampie from the sampier for the subsequent filtration, the total volume is homoqenized by shakinq the sampier. The
•71
aliquot obtained must be filtered entirely. In addition, it isadvisable to shake the empty bottle with the first 10 rol MQW filter washing portion to resuspend any particles adhered to thebottle surtace.
REFERENCES
Brügmann, L. 1986. ParticulateBaltic 5ea and parts of theMeeresk. 55: 3-18.
trace metals in waters of theadjacent NE Atlantic. Beitr.
Brzezinska-Paudyn, A., Balicki, M.R. and Van Loon, J.C. 1985.5tudy on the elemental composition of marine particulatematter collected on different filter material. Water, Airand Soil Pollution 24: 339-348.
Danielsson, L.G. On the use of filters tor distinguishing betweendissolved and particulate metal fractions in natural waters.Water Res.
Tambiev, 5.B. and Demina, L.L. 1982. Experience of the use ofdifferent types of filters for sea water filtration (inRussian). Okeanologiya 22: 137-142.
.. ,'
72
ANNEX 11
ACTION LIST
1) The Chairman should write to the Chairman of ACMP concerningthe rejection of the working Group's advice on guidelines forthe monitoring of sediments and on the bioavailability ofcontaminants in sediments and request explanations for theserejections.
2) Pr Larsen is encouraged to continue the work on his paper onthe sensitivity of sediments in monitoring contaminants andto include examples of the application of the ideas given tospecific situations.
3) Pr Berman is encouraged to prepare an overall review of theresults of, the, three, intercalibration exercises on tracemetals in'marine'sediments for discussion at the' 1988 WGMSmeeting.
4) Pr Calder has agreed to report on the results of the use ofsediment cameras at the next meeting.
5) Pr Cato has agreed to prepare a paper on the interpretationof nutrient data in sediments as a signal to determine whenthere may be problems with low oxygen concentrations oreutrophication. pr Windom will send some relevant data to DrCato.
6) pr Loring will coordinate work on the development of a paperon techniques to normalize trace metal concentrations insediments, with the assistance of prs Bowlatt. Windom, Cato,and Jensen. All members should send examples of theirpreferred methods of normalization to Pr Loring by the end ofJune 1987. The resulting paper will be circulatedintersessionallY for comment and distributed before the 1988meeting.
"'.',., .. , "
7) If necessary, Pr Caldcr will prepare a paper on techniques tonormalize concentrations of organic contaminants, in marine'sediments.
8) The Chairman will send a list of addresses of persons who ~should receive the questionnaire on analysis of SPM to theEnvironment Officer, 'who will distribute this questionnaireand collect the responses. She will send the responses to ~
Calder, who will analyse them and report back to the WorkingGroup.
9) The Chairman has agreed to design plans for an intercalibration workshop on the analysis of trace metals in SPM.
10) All members have agreed to provide comments on the InterimReporting Format for Contaminants in Sediments to the Environment Officer by the end of June 1987.

73
11) Dr Ade Groot has agreed to report on the results of studiesof methods to test for potential bioavailability of tracemetals in sediments; other members with information onpossible methods to test potential bioavailability shouldalso prepare papers for the next meeting.
12) The Chairman and other members have agreed to explore thepossibility of preparing videotape presentations of sedimentsamplinq and preparation methods.
13) All members with experience in the use of sediment traps orSPM collection for pollution monitorinq are encouraged toprepare papers giving the results of this experience forcirculation prior to the next meeting, with the aim ofcollectinq the papers toqether for publication.
74
ANNEX 12
RECOMMENDATIONS
Recommendation 1
The Working Group on Marine Sediments in Relation to Pollutionrecommends that an intercomparison programme on the measurementof individual chlorobiphenyls in marine sediments be carried out,with Dr J Calder as coordinator, for laboratories participatingin the Joint Monitoring Programme, subject to approval of fundsfor this intercomparison by the Oslo and Paris Commissions.
Recommendation 2
The Worlüng- recommends
early Marchtasks:
Group on Marine Sediments in Relation to Pollutionthat the Group meet for five days in late February or1988 in Savannah, Georgia to carry out the following
1) consideration of appropriate approaches to the normalizationof concentrations of trace metals in sediments,
21 consideration of an overall review of the results of threeintercalibration exercises on trace metals in marine sedimentsand the implications for sediment monitoring programmes,
3) review possible methods for testing the potential bioavailability of contaminants in sediments;
4) review of papers on experience gained form the use of sedimenttraps and the collection of suspended particulate matter inpollution monitoring programmes; and
5) review of the results of the questionnaire on the collectionand analysis of SPM and proposals for possible relevant intercalibration exercises.
The Environment Officer should take part in this meeting, ifpossible.