dochdl2onprintreadytmptarget · structure which consists of the group’s business areas. gunnebo...
TRANSCRIPT

ÅRSREDOVISNING2011ANNUAL REPORT 2011

ii
2011 has been an eventful year. The business has continued to be refined, two acquisitions have been made and Gunnebo has continued to invest in growth in China, India and Indonesia. Read more under Comments by the CEO on pages 4–5.
Gunnebo has customers worldwide. Read about their thoughts on the security
solutions of the future on pages 10–13. Some of the solutions are already a reality,
read about them on pages 14–25.
4
13
...THERE WAS A LEADING GLOBAL PROVIDER OF A SAFER FUTURE?
...SECURITY COULD MAKE LIFE MORE EFFICIENT
FOR EVERYONE?
The Gunnebo GroupThe Year in Brief 2Highlights of 2011 3Comments by the CEO 4Vision, Mission and Strategy 6Business Model 8
The BusinessCustomers on the Future 10Business Areas 14
Bank Security & Cash Handling 16Secure Storage 20Global Services 22Entrance Control 24
Sustainable BusinessResponsibility and Development 26Supply Chain 27Quality 28Environment 29Employees 32
Financial ReportingBoard of Directors’ Report 34Definitions 38Group Income Statements 39Group Statement of Comprehensive Income 39Group Balance Sheets 40Change in Group Equity 42Group Cash Flow Statements 43Parent Company Income Statements 44Parent Company Statement of Comprehensive Income 44Parent Company Balance Sheets 45Change in Parent Company’s Equity 47Parent Company Cash Flow Statements 48Notes 49Proposed Distribution of Earnings 72Auditor’s Report 73
Corporate GovernanceCorporate Governance Report 74Board’s Report on Internal Control 79Auditor’s Report 81Board of Directors 82Group Executive Team 84
Capital MarketInformation for the Capital Market 86Risk and Sensitivity Analysis 88The Gunnebo Share 92Five-Year Review 94
Addresses 96Gunnebo Glossary 97
This document is essentially a translation of the Swedish language version. In the event of any discrepancies between this translation and the original Swedish document, the latter shall be deemed correct.

1
23
Watch our film, Shaping the Future of Security, at www.gunnebogroup.com
WANT To FIND oUT MoRE?
Gunnebo has solutions that increase efficiency and security for all players in the global cash handling cycle. Read more about the offering on pages 16–19.
... CASH HANDLING CouLD BE IMPRoVED ALoNG THE ENTIRE CHAIN?
During the year Gunnebo has developed an exciting portfolio of services. Read more about them on pages 22–23.
Doing business in a way that has the minimum possible impact on the environment and
creates value for all stakeholders is second nature to Gunnebo. Read more on pages 26–33.
... THE FuTuRE CouLD BE BuILT oN TRuST?
... GuNNEBo CouLD CoNTRIBuTE To A
SAFER SoCIETY?
18 26
2
>> THE GUNNEBO GROUP > THE YEAR IN BRIEF
the year in brief
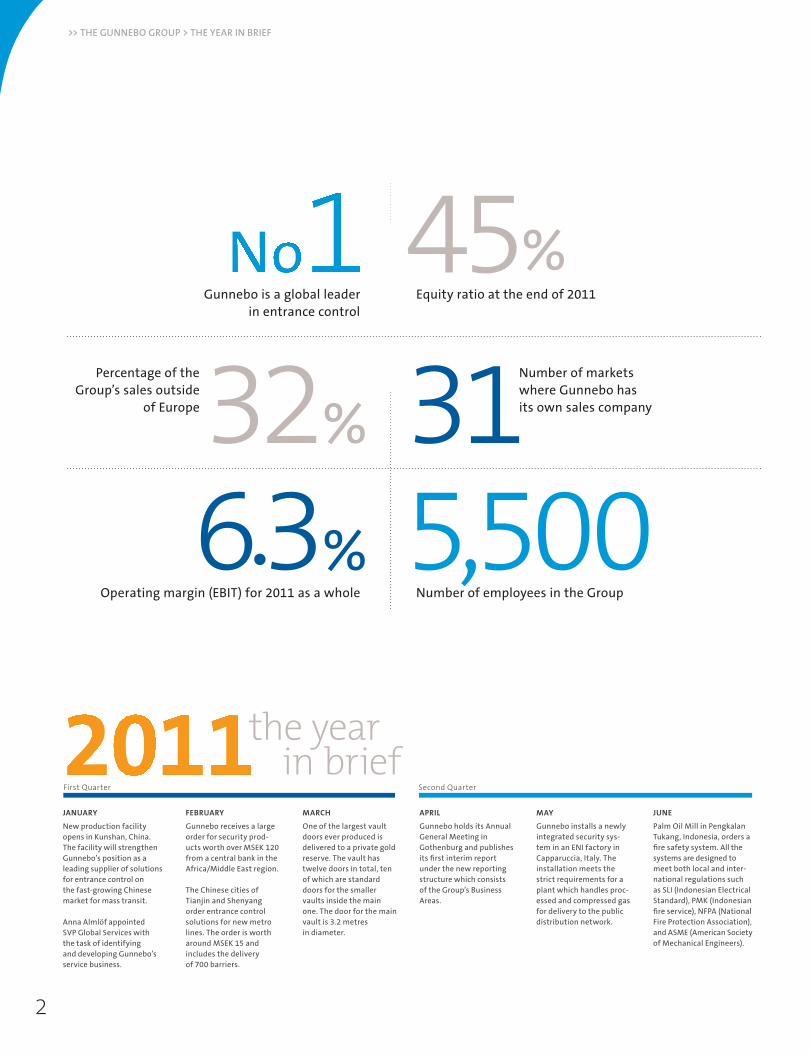
JANUARY FEBRUARY MARCH APRIL MAY JUNE
New production facility opens in Kunshan, China. The facility will strengthen Gunnebo’s position as a leading supplier of solutions for entrance control on the fast-growing Chinese market for mass transit.
Anna Almlöf appointed SVP Global Services with the task of identifying and developing Gunnebo’s service business.
Gunnebo receives a large order for security prod-ucts worth over MSEK 120 from a central bank in the Africa/Middle East region.
The Chinese cities of Tianjin and Shenyang order entrance control solutions for new metro lines. The order is worth around MSEK 15 and includes the delivery of 700 barriers.
One of the largest vault doors ever produced is delivered to a private gold reserve. The vault has twelve doors in total, ten of which are standard doors for the smaller vaults inside the main one. The door for the main vault is 3.2 metres in diameter.
Gunnebo holds its Annual General Meeting in Gothenburg and publishes its first interim report under the new reporting structure which consists of the Group’s Business Areas.
Gunnebo installs a newly integrated security sys-tem in an ENI factory in Capparuccia, Italy. The installation meets the strict requirements for a plant which handles proc-essed and compressed gas for delivery to the public distribution network.
Palm Oil Mill in Pengkalan Tukang, Indonesia, orders a fire safety system. All the systems are designed to meet both local and inter-national regulations such as SLI (Indonesian Electrical Standard), PMK (Indonesian fire service), NFPA (National Fire Protection Association), and ASME (American Society of Mechanical Engineers).
6.3 32 31
Number of employees in the Group
Gunnebo is a global leader in entrance control
%
%
%
Operating margin (EBIT) for 2011 as a whole
Percentage of the Group’s sales outside
of Europe
45
5,500
Equity ratio at the end of 2011
Number of markets where Gunnebo has its own sales company
First Quarter Second Quarter

3
Key ratios2011 2010 2009
Net sales, MSEK* 5,137 5,263 5,480Operating profit excl. items of a non-recurring nature, MSEK* 317 324 234Operating margin excl. items of a non-recurring nature, %* 6.2 6.1 4.3Operating profit, MSEK* 324 197 59Operating margin, %* 6.3 3.7 1.1Earnings per share after dilution, SEK** 3.00 2.35 –3.42Net debt, excl. pension commitments, MSEK 299 261 803Equity ratio, % 45 43 33
HIGHLIGHTS OF 2011
* Refers to continuing operations ** The figures for 2009 have been adjusted for the bonus issue effect resulting from the new share issue
The equity ratio continued to improve and totalled 45% (43%).
Net debt excluding pension commitments amounted to MSEK 299 (261).
Order intake increased in constant currency rates by 2% and amounted to MSEK 5,091 (5,271).
Net sales increased in constant currency rates by 3% and amounted to MSEK 5,137 (5,263).
Operating profit excluding items of a non-recurring nature amounted to MSEK 317 (324) and the operating margin to 6.2% (6.1%).
Operating profit strengthened to MSEK 324 (197) and the operating margin was 6.3% (3.7%).
Profit after tax for the period improved and totalled MSEK 230 (178).
Earnings per share were SEK 3.00 (2.35).
The Board and the CEO propose a dividend of SEK 1.00 (SEK 0.50) per share.
JULY AUGUST SEPTEMBER OCTOBER NOVEMBER DECEMBER
DHL turns to Gunnebo for the development and installation of security systems at its new global logistics centre in Milan, Italy. Gunnebo will deliver a complete integrated system which includes protection against unau-thorised intrusion, CCTV, entrance control and a centralised system for fire safety.
Gunnebo strengthens its platform for entrance control in Africa through the acquisition of South African Alltech.
Lidl Sweden orders the closed cash handling concept, SafePay™, for 21 of its stores. The concept is a completely closed security chain all the way from the point of payment to the cash counting centre.
French bank, Caisse d’Epargne, orders the lar-gest safe deposit locker system ever installed in France, a SafeStore Auto Maxi with 975 lockers.
Gunnebo Perimeter Pro-tection is sold to Procuri-tas Capital Investors IV. The business has 400 employees and net sales of MSEK 700.
Komercni Banka, the Czech Republic’s largest bank and a subsidiary of French Société Générale, orders electronic lock GSL 1000 and deposit safe Millium III DFX 120.
Acquisition of a further 30% of Gunnebo’s Brazil-ian sales company. The company is a leading supplier of security solu-tions for the retail sector in Brazil and will be a platform for Gunnebo’s growth in the country.
A decision is made to carry out cutbacks in Gunnebo’s Spanish organisation. This is to better adapt the business to prevailing market conditions. The cutbacks affect one-third of the workforce of 350 people.
Third Quarter Fourth Quarter

4
>> THE GUNNEBO GROUP > COMMENTS BY THE CEO
2011 has been an eventful year. We have continued to streamline our business by divesting the fencing operation, Perimeter Protection, and by acquiring South African Alltech and majority ownership of our Brazilian sales company. We have also continued to invest in and lay a firm foundation for growth in China, India and Indonesia.
COMMENTS BY THE CEO
DEAR SHAREHOLDER
By implementing and executing our strat-egy, we are progressively strengthening our earning capacity. As we sum up the 2011 financial year we can report a gross margin of 30.5% (29.3%) and an operating margin of 6.3% (3.7%). Similarly, net profit improved considerably and totalled MSEK 230 (178), giving earnings per share of SEK 3.00 (2.35). Net debt at the year-end remained low, MSEK 299 (261), and the equity ratio was 45% (43%). The Group has a strong financial position which creates freedom and head-room for further growth initiatives.
During the year we have continued to shift the point of gravity of our business to markets outside of Europe. In 2005 sales in markets outside of Europe accounted for 10% of total Group sales, while at the end of 2011 that had risen to 32%. This shift is crucial for Gunnebo as we see the major growth in our core business over the next few years coming from the markets in Asia, Brazil, Africa, the Middle East, Australia and South Africa. Europe is and will continue to be our home market, where we will monitor, strengthen and further develop our busi-ness from strong market positions.
The Group’s market development showed great geographic differences in 2011. The markets outside of Europe developed strongly with a growth of 21% – in Asia Pacific the growth was as high as 26%. In Northern
Europe, market development was stable during the year, as it was in certain markets in Southern Europe such as France and Italy. However, there is no sign of a quick recovery in Spain, which is the reason for the cost-cutting programme announced in December.
We have had several tough years going through a significant change process. This process is not entirely complete and we have not quite achieved our targets yet, but the ability the Group’s employees have shown over the past two years to remain focused on our goals and implement the plans we have made, is promising for the future. I would like to thank all of Gunnebo’s 5,500 employees for their significant efforts in 2011. We will now continue the process of executing our strategic plan!
We have clear targets and objectives and know our core business. In 2012 we will con-tinue to invest in growth, conduct activities which will improve the gross margin, and take measures to bring about greater effi-ciency in the European sales companies. Achieving this will be supported by our strong financial position, a streamlined busi-ness and an organisation prepared to seize the opportunities being offered in 2012 .
Per BorgvallPresident and CEO
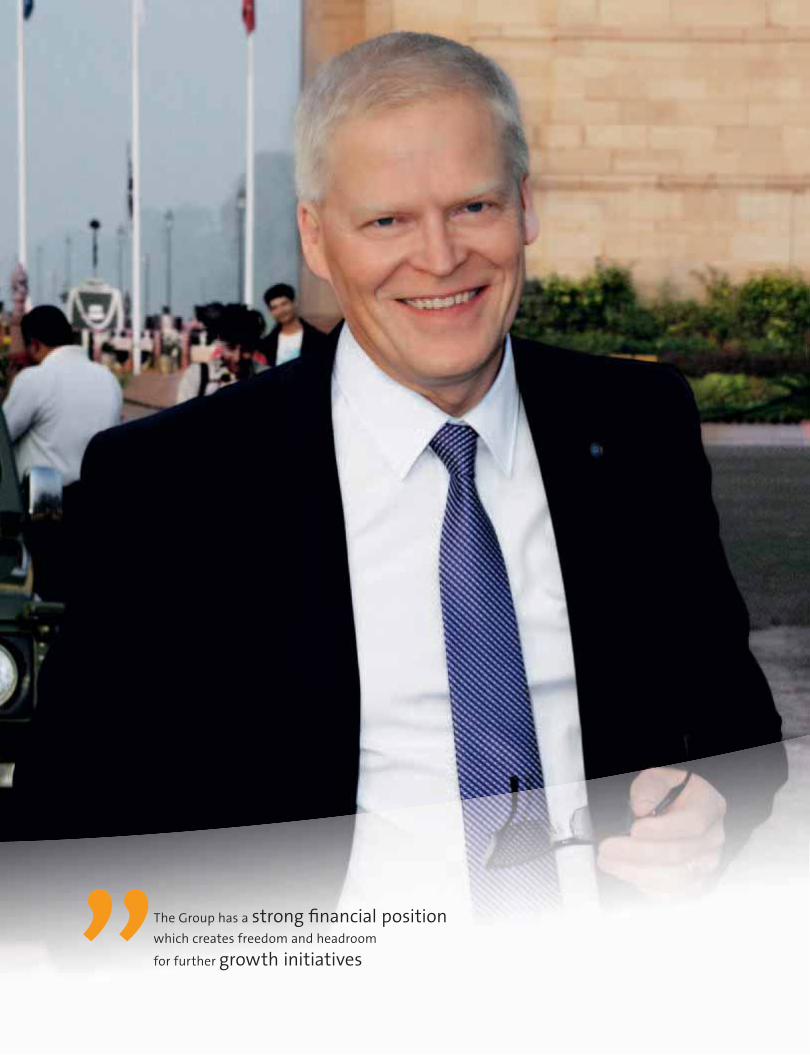
The Group has a strong financial positionwhich creates freedom and headroom
for further growth initiatives

6
>> THE GUNNEBO GROUP > VISION, MISSION AND STRATEGY
Gunnebo creates value by taking responsibility. As a professional business partner and a good employer, the Group offers solutions which exceed customers’ expectations. Customers’ businesses become more efficient and more secure thanks to Gunnebo’s offering. Satisfied customers mean that Gunnebo can do good business and generate shareholder value.
VISION, MISSION AND STRATEGY
THE LEADING GLOBAL PROVIDER OF A SAFER FUTURE
GUNNEBO IN A FUTURE BUSINESS ENVIRONMENT Gunnebo’s vision is to be the leading global provider of a safer future. This vision inspires the Group’s employees to do that little bit extra – it drives and motivates them in their day-to-day work.
Gunnebo succeeds when the Group offers cutting-edge expertise and solutions that stem from an understanding of the customer’s business. Offering a safer future means taking a long-term approach, investing in product development and innovation, and building durable relationships which generate lasting mutual value.
THE VISION IN FIGURESGunnebo shall earn a long-term return on capital employed of at least 15% and an operating margin of at least 7%. The Group shall achieve organic growth of at least 5% a year.The equity ratio shall not fall below 30%.
With the current capital structure, an operating margin of 7% equates to a return on capital employed of approximately 15%. Gunnebo’s financial goals have remained unchanged since 2005.
financial goals
vision
Goals and outcomesLong-term
goalsOutcome
2011Outcome
2010Outcome
2009
Return on capital employed1,2), % 15 13.2 13.5 7.5Operating margin2), % 7 6.2 6.1 4.3Equity ratio1), % >30 45 43 33Organic growth net sales, % 5 1 0 –9
1) Incl. discontinued operations. 2) Excl. items of a non-recurring nature.
missionGUNNEBO’S ROAD TO ACHIEVING ITS GOALS Gunnebo’s mission is to create a safer world by providing efficient and innovative security solutions that create value for customers, partners, employees, shareholders and society on a global level.

7
THE ROAD TO ACHIEVING THE VISION The strategy is all about making choices. In 2010 a new strategy was established for the Group, which was executed in 2011. This strategy has driven a series of changes, including a new reporting structure from the first quarter of 2011.
Gunnebo’s strategy focuses on a well-defined core business which is run in four Business Areas: Bank Security & Cash Handling, Secure Storage, Global Services and Entrance Control. Gunnebo’s goal is for all four Business Areas to have a global offering.
Gunnebo’s strategy for growth involves developing the European business from strong positions, gradually moving the emphasis of the business outside of Europe, and creating strong platforms on the world’s growing markets. Growth should be profitable and take place both through our own efforts and through acquisitions.
ACQUISITION STRATEGYGunnebo has a strong financial position allowing it to grow through acquisitions. The aim of future acquisitions is to strengthen the core business and/or strengthen the geographical spread of the Group’s business. Acquisitions which strengthen the service business and increase the Group’s presence in Brazil, Turkey, Australia, China, India and the US are of particular interest. Gunnebo will only acquire businesses that can make a positive contribution to the Group’s results more or less immediately.
BRAND STRATEGYGunnebo is the brand primarily used on the security prod-ucts, systems and services sold by the Group. Products and systems within physical security are also sold under the Chubbsafes, Fichet-Bauche and Rosengrens brand names. On some markets, strong local brands may also be used. One example is in India where the brand name Steelage is used for physical security products in the Bank Security & Cash Handling and Secure Storage Business Areas.
Other brand names used within the Group are Gateway (electronic article surveillance), SafePay™ (closed and integrated cash handling) and Alltech by Gunnebo (basic entrance control solutions).
Gunnebo also owns the brand name elkosta™ which is licensed to the divested operation Perimeter Protection.stra
tegy
for g
row
th

>> THE GUNNEBO GROUP > BUSINESS MODEL
BUSINESS MODEL
Gunnebo’s primary mission is to create value for all the Group’s stakeholders. Based on this, the Business Areas formulate strategies within their respective customer, product and service categories.
OPERATIONS BUSINESS AREASResponsible for all product sourcing, whether the products are made within the Group or sourced externally. Operations leads work relating to the environ-ment, logistics and quality.
PURCHASING LOGISTICS PRODUCTION ENVIRONMENT QUALITY
The four Business Areas are responsible for developing global strategies and business plans within their respective areas of expertise. They further develop Gunnebo’s global offering, both with regard to products and the overall concept.
8
Targets all players in the global cash handling cycle – central banks, banks, retail and cash-in-transit (CIT) companies. The offering is global and adapted to conditions in each market. Read more about the offering on pages 16–19.
BANK SECURITY & CASH HANDLING
Offers solutions for secure storage, such as safes of different security grades. The business is carried out both directly and indirectly through partners. Read more about the offering on pages 20–21.
SECURE STORAGEOffers security-related services. The business proposition varies by market. In 2011 a common, global offering has been developed. Read more about the offering on pages 22–23.
GLOBAL SERVICES
Retail and office centre, Australia (Entrance Control)
Crédit Agricole, bank, France(Bank Security & Cash Handling)
London Luton Airport, UK(Entrance Control)
SALES CHANNELS Gunnebo’s sales channels comprise its own sales companies on 31 markets as well as a global network of partners. The sales channels carry out the strategies drawn up by the Business Areas, and are responsible for sales and marketing. On markets where the Group has its own sales companies, they are responsible for installation and service.

9
Offers solutions for entrance control. Aimed at players in construction and infra-structure, such as architects and integra-tors, businesses within mass transit, such as metro systems and airports, and other customers that require solutions for entrance control. Read more about the offering on pages 24–25.
ENTRANCE CONTROL
MARKETINGSALESINSTALLATIONSERVICE
International Bank Vaults (IBV), South Africa(Bank Security & Cash Handling)
Mandarin Oriental Hotel, Indonesia (Global Services)
Carlson Rezidor Hotel Group, international(Secure Storage)
Sales by region 2011
EMEA, 78%Asia Pacific, 15%Americas, 7%
Total: MSEK 5,137

...THE FUTURE WAS BUILTON CONFIDENCE?
Gunnebo has concluded that future challenges in security are closely related to the ability to collaborate across system borders. Here some of the Group’s customers talk about how this could influence developments in their day-to-day operations. Thanks to a global presence, Gunnebo pursues far-reaching multinational collaboration projects and can help customers who wish to expand and link different systems together.
ADDING VALUEWith unique expertise in security and 1,500 experienced service engineers in 31 countries, Gunnebo can deliver a
comprehensive service portfolio. Gunnebo’s services create added value, increase the value of customers’ security investments and are designed to provide support throughout the entire business process.
CUSTOMER EVENTSGunnebo participated in many trade fairs in 2011 including Passenger Terminal exhibition (Denmark), Euroshop (Germany), Safety and
Security Amsterdam (Netherlands), HUNGORO(Hungary), Tektónika (Portugal), FinnSec (Finland), Bezpeka (Ukraine), IFSEC (South Africa) and IFSEC (India).
NEW CUSTOMERS South African Standard Bank ordered two SafeStore Auto safe deposit locker systems. They are the
first safe deposit lockers to be delivered to the country. If the installations are a success, the bank will extend the concept to more of its 700 branches across South Africa. Standard Bank also has 450 branches in other African countries.
!
! !
10
>> THE BUSINESS > CUSTOMERS ON THE FUTURE
11
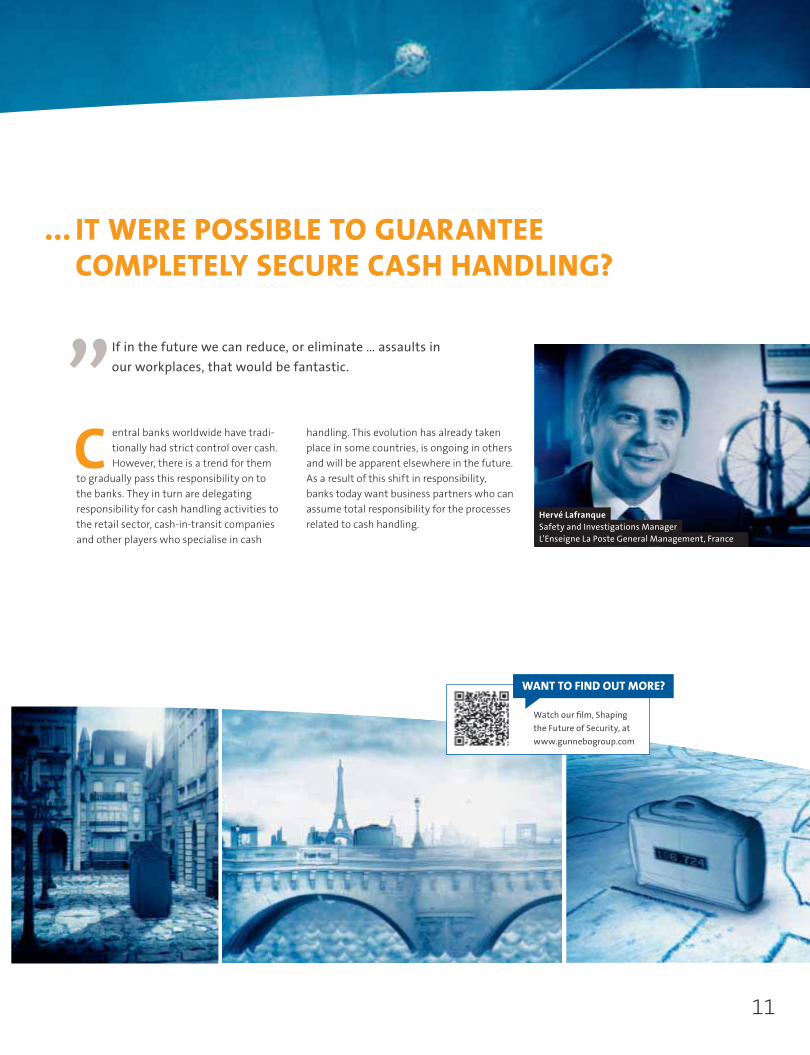
... IT WERE POSSIBLE TO GUARANTEE COMPLETELY SECURE CASH HANDLING?
handling. This evolution has already taken place in some countries, is ongoing in others and will be apparent elsewhere in the future. As a result of this shift in responsibility, banks today want business partners who can assume total responsibility for the processes related to cash handling.
C entral banks worldwide have tradi-tionally had strict control over cash. However, there is a trend for them
to gradually pass this responsibility on to the banks. They in turn are delegating responsibility for cash handling activities to the retail sector, cash-in-transit companies and other players who specialise in cash
Hervé LafranqueSafety and Investigations ManagerL’Enseigne La Poste General Management, France
If in the future we can reduce, or eliminate … assaults in our workplaces, that would be fantastic.
Watch our film, Shaping the Future of Security, at www.gunnebogroup.com
WANT TO FIND OUT MORE?

...YOU COULD CONTROL YOUR SAFE REMOTELY?
...WE COULD GIVE PARTNERS REAL-TIMEACCESS TO CRITICAL INFORMATION?
and do not have to be installed in the safe during production. In the future, standard-ised ports will be built into the safe to ena-ble plug-and-play equipment with extra functionality. Furthermore, advanced elec-tronic locks which connect the safe to a network and report anomalous events to a central source will become more common.
he ability to link together different systems will influence developments in the secure storage sector. There
are already an increasing number of options that make it possible to integrate stand-alone safes with other systems. Today, for example, functions such as alarms and seis-mic detectors require no special adaptation
If you share data with your providers – like banks – everybody
knows what’s going on … and it’s the basis for a better deal together.
offer software that can gauge when it is time to carry out preventive maintenance, a solution that maximises operating time and keeps replacement costs to a minimum. It is vital in this context that such connectivity should not only exist between Gunnebo’s solutions but also between Gunnebo’s solu-tions and partners’ products.
unnebo’s service offering will be strengthened thanks to increased connectivity and smarter soft-
ware. TCP/IP solutions will make it easier to monitor equipment in the field. Status reports generated in real time will make cost-efficient remote service possible. Furthermore, Gunnebo will also be able to
G
T
Edwin ten BrinkOwner Ten Brink Food Retail, Netherlands
12
>> THE BUSINESS > CUSTOMERS ON THE FUTURE

13
C ustomers in the field of entrance control require solutions that are connected, can communicate with
each other and share information. TCP/IP connectivity between cameras, alarm sys-tems and entrance control solutions enables security personnel to identify risk areas and take immediate action by closing off one area or opening another. Airport security is particularly challenging, and is an area where the capability for greater connectivity and compatibility between systems lays a better foundation for increased security and efficiency. There is currently no equipment on the market that can scan both tickets and ID documents when boarding an air-craft; in the future a system for face recog-nition, for instance, could scan passengers as they queue for boarding.
... A FACE RECOGNITIION SYSTEM COULD BE CONNECTED TO THE TICKET INFORMATION?
Our aim is to let the passengers get in through the airport … as smoothly as possible. And we are aiming to see how we can make it even faster … in the future.
Remote monitoring is one way of ensuring that our business is done more efficiently in the future.
Drs. Rizqullah Thohuri President Director of
PT Bank BNI Syaria, Indonesia
Rashid Khalifa Al-KhalifaUnder Secretary, Ministry of the InteriorKingdom of Bahrain
Watch our film, Shaping the Future of Security, at www.gunnebogroup.com
WANT TO FIND OUT MORE?

14
>> THE BUSINESS > BUSINESS AREAS
DRIVING THE FUTURE OF SECURITYBUSINESS AREAS
BUSINESS AREAPERCENTAGE OF
GROUP SALES KEY RATIOS OFFERING BRANDS
BANK SECURITY& CASH HANDLINGEstimated global market valueMEUR 9,000
Annual growth 5%
44%
20112011 20102010
Order intake, MSEKOrder intake, MSEK 2,2152,215 2,4772,477Net sales, MSEKNet sales, MSEK 2,2762,276 2,4272,427Operating profit,Operating profit,MSEKMSEK 147147 166166Operating margin, %Operating margin, % 6.56.5 6.86.8
Physical SecurityPhysical Security Certified vaults and safes,Certified vaults and safes,mechanical and electrical safe deposit lockers,mechanical and electrical safe deposit lockers,robotised safe deposit lockers, security doors,robotised safe deposit lockers, security doors,interlocking doors and entrance controlinterlocking doors and entrance controlCash HandlingCash Handling Self-service bank lobbySelf-service bank lobby solutions, cash handling solutions forsolutions, cash handling solutions forcheckouts and cashiers’ officescheckouts and cashiers’ officesElectronic SecurityElectronic Security Access control, intrusionAccess control, intrusiondetection, CCTV, high-security electronic locks,detection, CCTV, high-security electronic locks,remote surveillance systemsremote surveillance systems
GunneboGunneboChubbsafesChubbsafesFichet-BaucheFichet-BaucheRosengrensRosengrensSafePaySafePay™™
SECURE STORAGEEstimated global market valueMEUR 1,500
Annual growth 3–5%
14%
20112011 20102010
Order intake, MSEKOrder intake, MSEK 736736 748748Net sales, MSEKNet sales, MSEK 731731 750750Operating profit,Operating profit,MSEKMSEK 1515 3838Operating margin, %Operating margin, % 2.12.1 5.15.1
Safes and cabinets, fire-resistant data mediaSafes and cabinets, fire-resistant data mediasafes, fire-resistant document safes, fire-safes, fire-resistant document safes, fire-resistant filing cabinets, deposit safes andresistant filing cabinets, deposit safes andATM safesATM safes
GunneboGunneboChubbsafesChubbsafesFichet-BaucheFichet-BaucheRosengrensRosengrensSteelageSteelage
GLOBALSERVICESAnnual growth 3–4% 22%
20112011 20102010
Order intake, MSEKOrder intake, MSEK 1,1441,144 1,1201,120Net sales, MSEKNet sales, MSEK 1,1201,120 1,1201,120Operating profit,Operating profit,MSEKMSEK 121121 9191Operating margin, %Operating margin, % 10.810.8 8.18.1
Lifecycle CareLifecycle Care representing a portfolio of representing a portfolio of product-related services tied in to Design,product-related services tied in to Design,Implementation, Maintenance and EvolutionImplementation, Maintenance and EvolutionBusiness CareBusiness Care representing services connectedrepresenting services connectedto client business processes and defined asto client business processes and defined asManaged Security Services, Security ConsultancyManaged Security Services, Security ConsultancyServices and Security Software ServicesServices and Security Software Services
GunneboGunneboFichet-BaucheFichet-BaucheTélésurveillanceTélésurveillance
ENTRANCE CONTROLEstimated global market valueMEUR 420
Annual growth 6%
14%
20112011 20102010
Order intake, MSEKOrder intake, MSEK 713713 654654Net sales, MSEKNet sales, MSEK 720720 691691Operating profit,Operating profit,MSEKMSEK 3636 –1–1Operating margin, %Operating margin, % 5.05.0 –0.1–0.1
Product SolutionsProduct Solutions A wide range of entranceA wide range of entrancegates, security gates, security doors, blast andgates, security gates, security doors, blast andbullet-resistant doors, windows, partitions andbullet-resistant doors, windows, partitions andtransfer solutionstransfer solutionsConcept SolutionsConcept Solutions Entrance control solutionsEntrance control solutionsfor office buildings, airports and public transfor office buildings, airports and public trans--port systems, such as metro, train and busport systems, such as metro, train and busnetworksnetworks
GunneboGunneboAlltech byAlltech by GunneboGunnebo
DEVELOPING BUSINESSES
6%
20112011 20102010
Order intake, MSEKOrder intake, MSEK 283283 272272Net sales, MSEKNet sales, MSEK 290290 275275Operating profit,Operating profit,MSEKMSEK –35–35 –37–37Operating margin, %Operating margin, % –12.1–12.1 –13.5–13.5
Developing Businesses is made up of SafePay™Developing Businesses is made up of SafePay™and Gatewayand Gateway
SafePaySafePay A solution developed in-house forA solution developed in-house forintegrated and closed cash handlingintegrated and closed cash handlingGatewayGateway A global supplier of Electronic ArticleA global supplier of Electronic ArticleSurveillance (EAS) solutions for retailersSurveillance (EAS) solutions for retailers
SafePay™SafePay™GatewayGateway

15
Gunnebo’s Business Areas develop, design and create the security solutions and services which are sold to customers around the globe. They represent the four core areas of Gunnebo’s expertise – Bank Security & Cash Handling, Secure Storage, Global Services and Entrance Control.
BUSINESS AREAPERCENTAGE OF
GROUP SALES KEY RATIOS OFFERING BRANDS EXAMPLES OF CUSTOMERS MARKET POSITION COMPETITORS
Bank Security & caSh handlingEstimated global market valueMeur 9,000
Annual growth 5%
44%
2011 2010
Order intake, MSEK 2,215 2,477Net sales, MSEK 2,276 2,427Operating profit, MSEK 147 166Operating margin, % 6.5 6.8
Physical Security Certified vaults and safes, mechanical and electrical safe deposit lockers, robotised safe deposit lockers, security doors, interlocking doors and entrance control
Cash Handling Self-service bank lobby solutions, cash handling solutions for checkouts and cashiers’ offices
Electronic Security Access control, intrusion detection, CCTV, high-security electronic locks, remote surveillance systems
Gunnebo Chubbsafes Fichet-Bauche Rosengrens SafePay™
Banks HSBC, ING Bank, Nordea, Swedbank, SEB, Le Crédit Lyonnais, Citibank, Credit Suisse, Development Bank of Singapore, Union Bank of India, Bank of India, Standard Bank, Axis Bank Ltd, Manappuram Finance Ltd, Muthoot Finance Ltd, Crédit Agricole, International Bank Vaults, La Poste, External European Action Service (European Union External Action)
Central Banks Central Bank of Kuwait Retail COOP, Smart Club, Statoil, Leroy Merlin, Aldi
Cash in Transit Loomis, Brinks
Gunnebo holds a very strong position in the bank security and cash handling market and already enjoys collaborations with all the major banks, the largest CIT companies and many of the leading retail chains in Europe. In India, Indonesia, Australia and Canada, Gunnebo is the largest player in bank security. In Africa, the Group has partnerships with the majority of banks with ambitions for growth.
Physical Security Many local players
Cash Handling Diebold, NCR, PSI Group (Cash Guard), Scan Coin, Talaris, Wincor- Nixdorf
Electronic Security Bosch Security, G4S, Niscayah, Nedap, Siemens Building Technology
Secure StOrageEstimated global market valueMeur 1,500
Annual growth 3–5%
14%
2011 2010
Order intake, MSEK 736 748Net sales, MSEK 731 750Operating profit, MSEK 15 38Operating margin, % 2.1 5.1
Safes and cabinets, fire-resistant data media safes, fire-resistant document safes, fire- resistant filing cabinets, deposit safes and ATM safes
Gunnebo Chubbsafes Fichet-Bauche Rosengrens Steelage
End customers include casinos, jewellers, fashion houses, offices, pharmaceutical companies, local authorities, universities, hospitals and manufacturers of ATMs.
Gunnebo estimates its global market share in certified safes at 12–15% and over 25% in Europe. The market share for non-certified products and products with lower certification is estimated at less than 5%.
The secure storage market is highly fragmented with many small and local players.
glOBal SerViceSAnnual growth 3–4% 22%
2011 2010
Order intake, MSEK 1,144 1,120Net sales, MSEK 1,120 1,120Operating profit, MSEK 121 91Operating margin, % 10.8 8.1
Lifecycle Care representing a portfolio of product-related services tied in to Design, Implementation, Maintenance and EvolutionBusiness Care representing services connected to client business processes and defined as Managed Security Services, Security Consultancy Services and Security Software Services
Gunnebo Fichet-Bauche Télésurveillance
First National Bank, Standard Bank (South Africa); Coles, Woolworths (retail, Australia); Decathlon, Promod (retail, Hungary); Brinks (CIT), C1000 (retail), Shell (industry), ALDI (retail), ANWB – Royal Dutch Touring Club (offices, Netherlands).
Gunnebo’s market share in Europe is estimated at 6–7%.
A large number of local installers as well as large multinationals. The competi-tive environment varies therefore from one market to the next.
entrance cOntrOlEstimated global market valueMeur 420
Annual growth 6%
14%
2011 2010
Order intake, MSEK 713 654Net sales, MSEK 720 691Operating profit, MSEK 36 –1Operating margin, % 5.0 –0.1
Product Solutions A wide range of entrance gates, security gates, security doors, blast and bullet-resistant doors, windows, partitions and transfer solutions
Concept Solutions Entrance control solutions for office buildings, airports and public trans-port systems, such as metro, train and bus networks
Gunnebo Alltech by
Gunnebo
Large Customers IBM, Siemens, Shell, Ascom, Thales, Indra Offices Vodafone, Microsoft, Nestlé, Shell, American Express Public Transport Barcelona, Stockholm, Beijing, Shanghai, New Delhi, Melbourne, Bogotá
Airports Madrid, Paris, Warszawa, London, Dubai, Bahrain, Japan, Singapore, Sydney, Boston
Authorities NATO, European Commission, UK Home Office, military bases worldwide
Stadia Real Madrid, Twickenham, Millenium Stadium, Melbourne Park, Khalifa International Stadium, Sepang International Circuit
Gunnebo estimates its global market share at 12% and is the largest supplier of entrance control solutions worldwide: first in EMEA, second in Asia and fourth in the Americas.
Kaba, Boon Edam, Automatic Systems, and many small local players.
deVelOPing BuSineSSeS
6%
2011 2010
Order intake, MSEK 283 272Net sales, MSEK 290 275Operating profit, MSEK –35 –37Operating margin, % –12.1 –13.5
Developing Businesses is made up of SafePay™ and Gateway SafePay A solution developed in-house for integrated and closed cash handling
Gateway A global supplier of Electronic Article Surveillance (EAS) solutions for retailers
SafePay™ Gateway
SafePay COOP, Smart Club, Statoil, Leroy Merlin Gateway Different types of retail businesses such as large chains within groceries, clothing and technology.
SafePay One of the major players on the closed cash handling market for retail.
Gateway The market for EAS is dominated by a few large players where Gateway is one of the smaller global players.
SafePay PSI Group (CashGuard), Scan Coin, Wincor-Nixdorf
Gateway Checkpoint Systems, Nedap, Sensormatic

16
>> THE BUSINESS > BUSINESS AREAS
The Business Area provides a wide range of efficient and innovative solutions and services protecting assets, valuables and people, enabling bank branches and head offices, central banks, cash-in-transit companies and retailers to improve their security and cash handling processes.
INNOVATION ALONG THE WHOLE CASH CHAIN
he vision for the Business Area is to become the world-leading supplier of security solutions for markets
where large volumes of cash, people and merchandise are combined with high secu-rity and efficiency. The Business Area’s objective is to support Gunnebo’s customers in implementing their security projects by offering them solutions that enhance their competitiveness and can be used securely, profitably and reliably over the long term.
As a partner to some of the world’s leading banks for over 100 years, Gunnebo has kept pace with the changing risks in the sector and has developed an in-depth understanding of critical infrastructures. Thanks to its wealth of experience and sound knowledge of the bank security and cash handling market, Gunnebo has consis-tently met its customers’ demands with innovative security concepts and solutions.
The offering Security and efficient cash handling are among the top priorities for banks, central banks, cash-in-transit (CIT) companies and retailers the world over. Gunnebo’s offering within Bank Security & Cash Handling is the result of far-reaching collaborations with the largest players in these sectors. Know-ledge exchange, long industry experience and an understanding of customers’ needs enable Gunnebo to offer market-leading glo-bal solutions that protect customers’ assets, streamline their cash handling processes and strengthen their businesses.
Gunnebo proposes a comprehensive approach with solutions built around the latest technologies and market standards.
The product offering, including solutions for physical security, cash handling and electro-nic security, can be provided in a stand-alone or turnkey format or be customised to meet the needs of each customer, site and level of security.
The market and its driversThe banking market is constantly evolving as new branches are opened or renovated and new security procedures introduced. There are estimated to be over 800,000 bank branches worldwide and there is a high rate of branch openings in markets such as India, Indonesia and China. The world’s 195 central banks have more than 2,000 branches in total and the number of cash counting centres managed by security companies is increasing year by year. Furthermore, there are more than 5,300 counting centres and hundreds of thousands of stores around the world which can benefit from Gunnebo’s market offering for cash handling.
The amount of cash in circulation is conti-nuing to increase. Central banks around the world have gradually begun to change their roles and strategies regarding cash hand-ling, having a knock-on effect on retail banks, which generally prefer cash handling to take place in shops.
This shift is placing greater demands on cost-effective solutions, where concepts for self-service and outsourcing of cash hand-ling are becoming increasingly common, which in turn drives developments within the CIT sector.
There is a clear trend of security-related solutions moving from physical to electro-nic security. Another factor driving the
T
BUSINESS AREA BANK SECURITY & CASH HANDLING
Group’s business is legislation and standar-disation on both a national and internatio-nal level.
Many emerging markets are mainly dri-ven by a growing middle class, which is increasingly placing demands on improved accessibility and more sophisticated solu-tions in bank security and cash handling. The number of bank branches in markets such as India, Indonesia, China and Brazil is expected to grow annually by the hundreds over the coming years.
Market development 2011The Indian bank market has continued to develop very strongly during the year, as have some markets in the Middle East and Canada. In Southern Europe the markets in France, Italy and Switzerland have shown stable development but there is no sign of a quick recovery in Spain. In Northern Europe, the order intake has developed well in Germany and the Nether-lands, particularly within cash handling. Order intake for the year as a whole total-led MSEK 2,215 (2,477). In constant currency rates the order intake decreased by 5%, mainly due to an exceptional project order from a central bank in the Africa/Middle East region in 2010. Excluding this order, the order intake in constant currency rates was unchanged. Net sales amounted to MSEK 2,276 (2,427), in constant currency rates it decreased by 1%. Operating profit amounted to MSEK 147 (166) and the operating margin to 6.5% (6.8%).

17
SafeCash users have full access to a range of data hosting and monitoring services managed by Gunnebo experts. One major advantage has proven to be proactive maintenance, where updates are made and errors corrected before the cash handling cycle can be effected.
DATA HOSTING
SAFECASH RETAIL STATION A self-service recycling solution for retailers. Cashiers receive a mix of coins and notes at the beginning of the day, can exchange during the day and deposit all their takings, which are automatically counted and authenticated, at the end of the day. Counting speed is quick and notes can be entered in bundles, up to 200 at a time. Optionally, the deposit amounts can be credited to the retailer’s bank account, depending on the bank.
optimising
servicescash handling
By sharing data from networks of SafeCashBy sharing data from networks of SafeCashunits with cash-in-transit (CIT) companies, moreunits with cash-in-transit (CIT) companies, moreefficient emptying and collecting proceduresefficient emptying and collecting procedureshave been introduced. CIT partners are alertedhave been introduced. CIT partners are alertedwhen a pick-up is due, optimising route planningwhen a pick-up is due, optimising route planningand saving on unnecessary run-outs.and saving on unnecessary run-outs.
Gunnebo’s close collaboration with theGunnebo’s close collaboration with themarket’s leading CIT players is important andmarket’s leading CIT players is important andhas led to the development of a CIT solutionshas led to the development of a CIT solutionsconcept designed to create more value for CITconcept designed to create more value for CITcompanies and their customers.companies and their customers.
CIT PARTNERSHIPSIn March 2011, Gunnebo sponsored the International Commercial Cash Operations Seminar in Barcelona and shared ideas on how to reduce the cost of the cash cycle using SafeCash solutions. Gunnebo was also invited to present the SafeCash Retail Station at several local events across the world.EV
ENT
DEPOSITSMARTTo respond to demand from smaller shops, Gunnebo launched a scaled-down version of the Retail Station called SafeCash Retail Deposit Smart. Incorporating a deposit function for notes, it allows both real-time monitoring of cash levels and same-day credit.
18
>> THE BUSINESS > BUSINESS AREAS
The latest SafeStore Auto is designed to be comfortablyThe latest SafeStore Auto is designed to be comfortably used by people with disabilities. In countries withoutused by people with disabilities. In countries withoutaccessibility laws, Gunnebo hopes to drive change andaccessibility laws, Gunnebo hopes to drive change andencourage banks to offer its customers non-discriminatoryencourage banks to offer its customers non-discriminatory services.services.
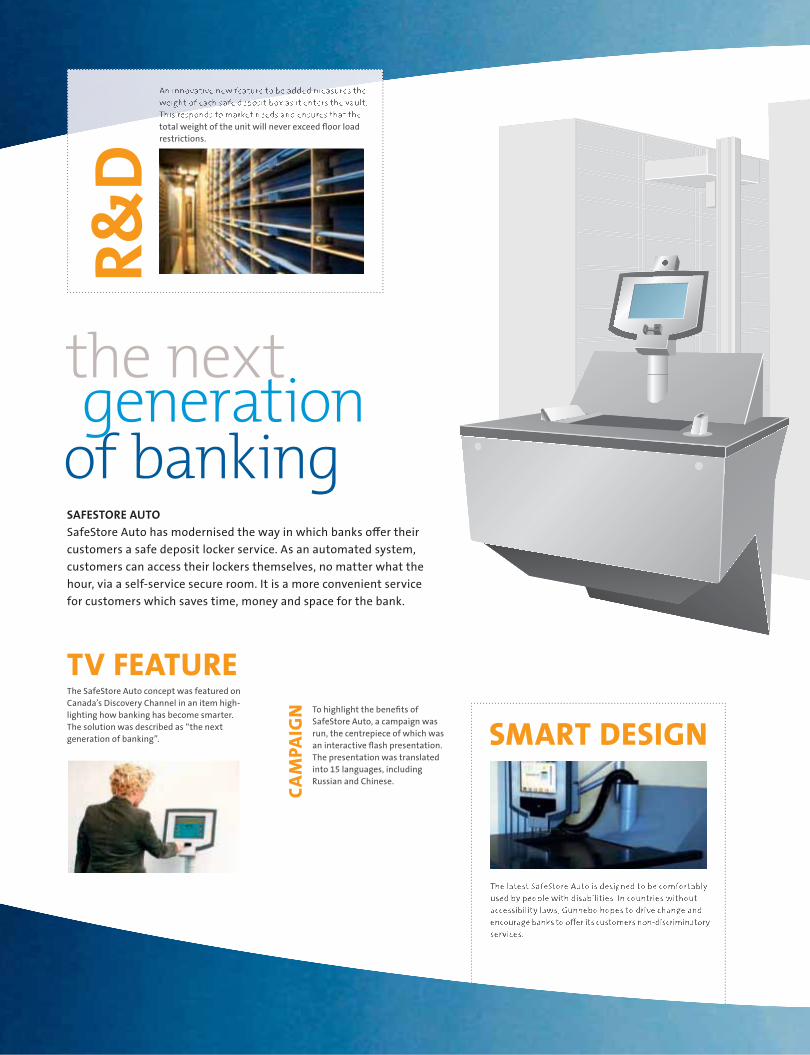
SMART DESIGNTo highlight the benefits of SafeStore Auto, a campaign was run, the centrepiece of which was an interactive flash presentation. The presentation was translated into 15 languages, including Russian and Chinese.
CAM
PAIG
N
An innovative new feature to be added measures theAn innovative new feature to be added measures theweight of each safe deposit box as it enters the vault.weight of each safe deposit box as it enters the vault.This responds to market needs and ensures that theThis responds to market needs and ensures that thetotal weight of the unit will never exceed floor load restrictions.
TV FEATURE
SAFESTORE AUTOSafeStore Auto has modernised the way in which banks offer their customers a safe deposit locker service. As an automated system, customers can access their lockers themselves, no matter what the hour, via a self-service secure room. It is a more convenient service for customers which saves time, money and space for the bank.
The SafeStore Auto concept was featured on Canada’s Discovery Channel in an item high-lighting how banking has become smarter. The solution was described as “the next generation of banking”.
R&D
the next generation
of banking

19
THE
CON
CEPT
CASHCONTROL
PRESS
Money is never handled manuallyMoney is never handled manually since closed cash handling createssince closed cash handling createsa single, secure, controlled proa single, secure, controlled pro--cess for the whole store whichcess for the whole store whichautomates counting and controlautomates counting and controlprocedures. Data on the level of procedures. Data on the level of cash in tills can be shared withcash in tills can be shared withCIT partners creating more cost-CIT partners creating more cost-effective collaboration.effective collaboration.
The new CashControl hosting service allows Gunnebo to help retailers manage and monitor the cash handling process online. It shortens the length of time each till is closed for emptying and refilling, and reduces operating costs for the retailer. The service has already proved successful in Denmark and the Netherlands.
A daily newspaper in Denmark reported on the installation of SafePay in all manned Statoil petrol stations in the country’s urban areas. Since SafePay’s installation, robberies have decreased by over 80%.
closed cash handlingsecure and efficient
SAFEPAYThe complete closed cash handling solution for retail which protects cash from the moment the customer pays all the way to the cash-counting centre – with no gaps in security and no weak links in the chain. The system includes note and coin recyclers for tills, ink-protected transportation cassettes, cash transfer units for the back office and software to manage the whole process.

20
>> THE BUSINESS > BUSINESS AREAS
Business Area Secure Storage uses the latest technology in fire and burglary protection to create high-quality safes which guarantee security both in office and home environments.
PIONEERING FIRE AND BURGLARY PROTECTIONBUSINESS AREA SECURE STORAGE
rotecting valuables from burglary and fire is one of Gunnebo’s oldest businesses. The Group’s position as
a leading supplier is based on the successful combination of quality, knowledge and new technology.
The vision for the Business Area is to develop from a primarily European provider to a global supplier of products and solu-tions for secure storage.
The offering In order to manufacture safes that guaran-tee security wherever they are installed, Gunnebo uses the latest technology for burglary protection and fire resistance. The product offering comprises burglary-resis-tant safes and vaults, fire-resistant safes and high-security locks.
The choice of storage solution depends on what the customer will be storing and the required level of protection. Document safes provide effective protection for important documents against fire, while heat-sensitive digital material, which can be damaged at temperatures as low as 55°C, should be stored in a data media safe. Valuable items, such as money, jewellery,
P medicine and weapons, can be stored in a safe with certified burglary protection or a combination of both burglary and fire protection. There are also solutions for documents used in day-to-day operations, which increase accessibility while simplifying storage.
The majority of products marketed and sold by the Business Area are graded, which means they are tested and certified by inter-nationally and nationally recognised inde-pendent bodies such as the European Security Systems Association or Underwriters Laboratories.
The market and its driversGunnebo is strong in the segment of the market that demands high quality and pro-duct certification. Business within Secure Storage is driven largely by awareness about the importance of protecting valuables against fire and burglary, as well as by its three strong brands, Chubbsafes, Fichet-Bauche and Rosengrens.
A growing middle class means that there are more people with possessions that require secure storage. One trend is an increase in the sale of lower graded or
ungraded safes while demand for products with high-security classifications is stable or declining slightly. Another trend is that customers require a safe’s electronic security systems, such as seismic detectors and electronic locks, to be connected to other applications as a part of a wider and more integrated security system.
Market development 2011The Business Area’s net sales showed a negative development during the year’s first three quarters. During the fourth quarter the development was stronger, especially in France and Australia. Sales of safes to manu-facturers of ATMs developed well through-out the period, and Gunnebo predicts a trend of continued higher volumes. Order intake for the year as a whole amounted to MSEK 736 (748), in constant currency rates it increased by 4%. Net sales for the same period totalled MSEK 731 (750), in constant currency rates they were up 3%. Operating profit amounted to MSEK 15 (38) and the operating margin to 2.1% (5.1%). An unfavourable product mix has had an adverse effect on profitability during the year.
ALL MARKETING AND SALES CARRIED OUT UNDER THE BRANDS:

21
PROGUARDThe ProGuard range of Grade II safes has been expanded with six Grade III models. The series is sold and marketed under one of Gunnebo’s premier Secure Storage brands, Chubbsafes.
ProGuard was certified by the European Security SystemsProGuard was certified by the European Security SystemsAssociation for providing Grade III burglary protection.Association for providing Grade III burglary protection.As with all Chubbsafes products, this was an independentAs with all Chubbsafes products, this was an independenttest to ensure the credibility and impartiality of the grading.test to ensure the credibility and impartiality of the grading.
challenging preconceptions
about safes
Advancements made in manufacturing mean that the new Grade III safes boastAdvancements made in manufacturing mean that the new Grade III safes boastnot only a higher level of burglary protection, but also thinner, lighter walls.not only a higher level of burglary protection, but also thinner, lighter walls.This was highlighted in the “Punches above its weight” launch campaign.This was highlighted in the “Punches above its weight” launch campaign.
PUNCHES ABOVE ITS WEIGHTNew ProGuard Grade III. Light but Incredibly Strong.
Expanded range now includes lighter safes with stronger protection
CAMPAIGN
Professionals from the banking and financial sector in Jakarta were invited to a live test designed to show that products evolve by becoming lighter, smaller and easier to handle, but can still be strong. This was demonstrated when a competitor’s safe – of traditionally heavy design – and the new, much lighter ProGuard were both attacked. The larger, more imposing safe yielded after four minutes. The ProGuard, however, could not be breached, even after three times as much effort.
LIV
E TE
ST

22
>> THE BUSINESS > BUSINESS AREAS
The Business Area creates long-term, strategic business relationships with clients in all targeted market segments around the world, built on client focus and added value. Gunnebo’s customised service offering is founded on its extensive knowledge of, and global experience in, the security industry.
SERVICES WHICH DELIVER PERFORMANCEBUSINESS AREA GLOBAL SERVICES
lobal Services’ vision is to become the preferred partner for the delivery of security services. Using its
expert knowledge of security systems, Gunnebo offers services designed to antici-pate and fully support client needs at every stage of the business relationship – from preliminary design through to delivery, integration, maintenance, upgrades, remote monitoring, consulting and ongoing support.
The offeringBusiness Area Global Services employs over 1,500 security experts – experienced engi-neers and professional support staff who are always available to offer clients the assistance they need, when they need it.
With a comprehensive portfolio defined in two key areas, Lifecycle Care and Business Care, Global Services not only delivers tradi-tional implementation and maintenance programs related to products but also design, consultation, monitoring, training and management services related to the client’s business processes.
Gunnebo’s customised service proposi-tion has both breadth and depth, and is built on receptiveness, innovation, global reach and many years of experience in the security industry worldwide.
G The market and its driversThe market for services in the security industry comprises a large number of local installation and service companies, as well as large multinational corporations. The competitive environment is fragmented and varies from one market to the next.
Similarly client expectations and require-ments vary from market to market, as do legislation and regulations. One of Gunnebo’s strengths lies in its ability to offer services globally via its network of 31 sales companies covering every conti-nent. This is particularly advantageous to clients with an international presence who require a service provider with global reach and the capacity to deliver locally.
The content of the service business in the security industry varies from one market to the next. One universal trend however, is that the complexity of the service offering is increasing, which creates higher entry bar-riers for new players to become established. This grants larger opportunities for a limited number of established players, such as Gunnebo, to grow and win market share. At the same time clients are placing increa-sing demands on the scope of responsibility assumed by a service provider within the framework of a service contract.
Finally, client demand for connectivity bet-ween physical security products and soft-ware, i.e. the ability to link together various products and systems, will continue to increase for years to come, resulting in the development and delivery of more sophisti-cated service solutions.
Market development 2011The trend of a growing need of security-rela-ted services in retail has continued to develop positively also during the fourth quarter of 2011. Gunnebo also sees an increased need for upgrade and refurbishment services, as several customers wish to extend the life-cycle of their security solutions to reduce the need for new investment. Order intake for the year as a whole amounted to MSEK 1,144 (1,120), in constant currency rates it increased by 8%. Net sales for the same period totalled MSEK 1,120 (1,120), in constant currency rates they increased by 6%. Operating profit improved to MSEK 121 (91) and the operating margin to 10.8% (8.1%). The Business Area has enjoyed good deve-lopment in order intake throughout the period thanks to good volumes for new and renewed service contracts. The highest growth is evident in the Canadian, UK and Australian markets. The Business Area conti-nues to show good profit development.

23
Lifecycle Care representing a portfolio of product-related services tied to Design, Implementation, Maintenance and Evolution.
Business Care representing services connected to client business processes and defined as Managed Security Services, Security Consultancy and Security Software Services.
gunneBO’S SerVice Offering
PreVentiVe & cOrrectiVe MaintenanceGlobal Services offers a comprehensive portfolio of maintenance services designed to protect clients’ security systems from the first day of installation to the end of their lifecycle.
Regular maintenance ensures a security system will continue to perform optimally and create value for a business. Through the early detection of problems and diagnostic checks, the risk of disruption to a client’s business is dramatically reduced. When problems do occur, emergency maintenance support makes sure downtime is minimal.
MOnitOring & trackingAlarm MonitoringAlarm Monitoring helps to protect people and assets against a threat like burglary or fire. Detection systems installed at the client’s premises are connected to a Gunnebo alarm centre and a prompt and appropriate response, in cooperation with local security authorities, will be undertaken to prevent escalation of a threat.
Video MonitoringVideo Monitoring is one of the most effective and convenient security solutions used by home owners, businesses and governmental institutions to remotely oversee a site. Video information can be recorded either locally or on Gunnebo’s Cloud Platform, and clients are able to view both live and recorded clips anytime, anywhere using a web browser or smartphone.
TrackingTotal visibility of security equipment allows clients to determine the location, status and identity of assets in transit – in real time. Tracking in this way allows unauthorised move- ments or emergency situations to be swiftly identified and rectified.
flexibility is key to
global services

24
The Business Area offers solutions that protect property by regulating the flow of people without compromising operations or restricting freedom of movement for authorised individuals.
STATE-OF-THE-ART CONTROLOVER THE FLOW OF PEOPLE
BUSINESS AREA ENTRANCE CONTROL
usiness Area Entrance Control offers solutions that protect property by regulating the flow of people wit-
hout compromising operations or restric-ting freedom of movement for authorised individuals.
The offeringMany types of site – from offices and industrial buildings to embassies, airports, metro systems and nuclear power plants – need to be secured against unauthorised access.
Gunnebo’s wide range of solutions for entrance control have been developed to efficiently secure sites and buildings without compromising their operation. Gunnebo has a complete offering of effective solutions providing access and entrance control for public transportation and within airports with anti-return, boarding and immigration gates. For sites with higher security require-ments, Gunnebo offers security portals together with blast- and bullet-resistant doors, windows and partitions.
B The market and its driversOne of the most important driving forces on the entrance control market is the greater demand for constant control over exactly who is where in a building. In parallel, sur-veillance and staffed security in reception lobbies are being reduced in favour of auto-mated security solutions for entrance control.
One clear trend is the greater need for authorised individuals to be able to move around unhindered within an office building, through a metro system barrier, within an arena or through border control at an air-port. Furthermore, the rise in the number of people living in urban areas is contributing to increased pressure on efficient regulation and control of passengers using public transport systems, as well as that of visitors to sports arenas, exhibitions and other sites holding public events.
Customers are also attaching increasing importance to being able to connect diffe-rent systems together. With TCP/IP it is pos-sible, for example, to link up a CCTV system with alarm and entrance control systems.
Market development 2011The turmoil in Europe and its effect on con-struction have impacted the otherwise posi-tive trend for entrance control sales. However France and Italy have despite the circumstan-ces performed relatively well in 2011.
The order intake has developed well during the year. In general, the markets outside of Europe developed strongly during the period, particularly the markets in Southeast Asia, North America, Australia and South Africa.
Order intake for the year as a whole increased in constant currency rates by 15% to MSEK 713 (654). Net sales for the same period increased in constant currency rates by 10% to MSEK 720 (691). Operating profit improved to MSEK 36 (–1) and the operating margin to 5.0% (–0.1%).
The improved operating profit can prima-rily be explained by increased sales, as well as measures within the Get It Right programme, which helped maintain gross margins and contributed to lower costs (which also inclu-des the closure of the factory in Bedford in 2010). The acquisition of Alltech has contribu-ted positively to the profit for the year.
In its latest report, “The World Market for Entrance Control Equipment – 2011 Edition”, IMS Research ranks Gunnebo number one for Entrance Control.
Gunnebo has been ranked as the global number one for the last five years since IMS Research began in 2006.
NUMBER ONE ENTRANCE CONTROL EQUIPMENT SUPPLIER
Global
No.1
IMSRes
earch R
eport E
d. 2011
>> THE BUSINESS > BUSINESS AREAS

25
By combining ImmSec FP gates with an e-passport reader and the latest biometric technology for face capture and fingerprint scanning, Gunnebo created the ABC – or Automated Border Control – self-service immigration gate for Spanish airports, Barcelona and Madrid.
BIOMETRICS
ImmSec FPAn immigration gate solution for airports. It auto-mates the border control process – making it faster for passengers – whilst ensuring that security remains tight through the use of single-person detection technology.
smart solutions save time
at airports
Following installations in Barcelona and Madrid,Following installations in Barcelona and Madrid,Spanish airline, Iberia, introduced passengers toSpanish airline, Iberia, introduced passengers tothe ABC gate by printing a step-by-step guide in itsthe ABC gate by printing a step-by-step guide in itsin-flight magazine, Ronda Iberia.in-flight magazine, Ronda Iberia.
IN-FLIGHT GUIDE
ImmSec FP has been used to designImmSec FP has been used to designan automated immigration solutionan automated immigration solutionat the Mexico-US border in El Paso.at the Mexico-US border in El Paso.It is equipped with the latestIt is equipped with the latestbiometric technology, including abiometric technology, including aforensic-quality fingerprint scanner,forensic-quality fingerprint scanner,and boasts great processing speed.and boasts great processing speed.
BORDER CONTROL
ABC gates were featured on national Spanish TV in a report entitled “New digital system removes queues at airports”. The report was broadcast on Antena 3, la Sexta and TV3.TV
REP
ORT

Ongoing investment in innovation, quality, sales and leadership strengthens the Group’s offering and builds a profitable Gunnebo.
FOR LONG-TERM STRENGTHRESPONSIBILITY AND DEVELOPMENT
unnebo’s responsibility is meas-ured in long-term return, satisfied customers, motivated employees
and a reduced impact on the environment. By being a responsible corporate citizen, Gunnebo gains the trust of its stakeholders and becomes a stronger global brand with increased competitiveness.
Together with the Group’s Core Values, Gunnebo’s Code of Conduct provides employees with support in how they should act responsibly in relation to customers, suppliers, society and the environment, as well as in relation to each other.
Code of Conduct As an international organisation and employer, it is important that Gunnebo
G complies with human rights in all controlla-ble stages of its business. The Group’s Code of Conduct is based on the following inter-national principles: the UN Declaration of Human Rights, the UN Global Compact initi-ative, the International Labour Organiza-tion’s principles on rights in working life, and OECD guidelines for multinational enterprises. The Code of Conduct forms the basis for how all employees in the Group should act, both internally and externally.
Corporate Core ValuesGunnebo’s Core Values guide the Group’s employees in their day-to-day business. They provide guidance at all business-critical stages – from product development to mar-keting, goals, strategies, sales and service.
SUSTAINABILITY CONTACT
Rolf Kjällgren +46 10 102 095 [email protected]
We are proud to offer products and solutions that contribute to a safer society. We have strengthened our offering in 2011 through investments in quality, knowledge and innovation.
Our efforts to achieve the right quality involve all of the Group’s employees and processes. Through cooperation, guidance and frequent follow-ups in 2011, we have intensified our work to deliver the right products, with the right quality and on time.
>> SUSTAINABLE BUSINESS > RESPONSIBILITY AND DEVELOPMENT
Customer focus – understanding what the customers need, helps Gunnebo meet their expectationsQuality – maintaining a high level of quality in every aspect of the businessProfessionalism – carrying out and deliver-ing the right solutions on time, every time is central to everything Gunnebo doesIntegrity – Gunnebo is a partner to rely onCooperation – teamwork and intercultural understanding help Gunnebo build a better global offering
We have invested in our employees in 2011. A leadership programme has been initiated to secure the supply of leaders in the organisation, and we have recruited trainees who are prepared for respon-sible positions with Gunnebo in the future.
We have also established an efficient process for customer-led product development in 2011. I look forward to sharing the results – competitive offer-ings for a safer future.
Per Borgvall, President and CEO
OUR SOLUTIONS PROTECT PEOPLE

27
SUPPLY CHAIN
COLLABORATION FOR LOWER RISK AND HIGHER PROFITABILITY
PurchasingGunnebo works with several global purchas-ing categories – Sheet Steel, Metal Products, Electronics, Printed Circuit Boards, Locks, Safes, Indirect Materials and Transport – and thereby capitalises on its size when making purchases. Categorising purchasing activities strengthens Gunnebo both in terms of negotiating power and purchasing expertise. The purchasing organisation, with a manager for each category, is based in Europe and is supplemented by a local pres-ence in China. Specifications are sent from
Europe and the Chinese organisation ensures the right level of quality is met.
Linking large purchasing volumes to fixed price contracts also reduces the risk of expo-sure to rapid changes in raw material prices. In order to further improve purchasing within the Group, 54 employees have been trained in efficient purchasing during the year.
Gunnebo’s Chinese company for purchas-ing, production and sales gives Gunnebo lower purchasing costs, as well as greater control over quality and environmental aspects. By being closer to suppliers,
Distribution of internal/ external sourcing
Internal sourcing, 54%External sourcing, 46%
External sourcing by Gunnebo purchase category
Indirect materials, 26%Transport, 23%Metal products, 19%Sheet steel, 13%PCBs, 6%Locks, 5%Electronics, 5%Safes, 3%
With an environmental management system which fulfils international standard ISO 14001, Gunnebo ensures the Group has systematic, structured envi-ronmental work in place. The majority of the Group’s production units are certified. Gunnebo’s quality assurance system is based on ISO 9001, which helps
the Group to achieve continuous improvements in all processes as well as increased customer satisfac-tion. Gunnebo is striving to harmonise the quality process for all production units. All production and development units within Gunnebo are certified ISO 9001.
Unit/FactoryISO 14001
certification Product area
Doetinchem, the Netherlands 1999 Secure storageBazancourt, France 2002 Secure storageMarkersdorf, Germany 2003 Secure storageBekasi/Jakarta, Indonesia 2004 Secure storageWadeville/Johannesburg, South Africa Planned 2012 Secure storageHalol, India 2006 Secure storageTrier, Germany 2004 Cash handlingBaldenheim, France 2004 Entrance controlUckfield, UK 2007 Entrance controlLavis/Trento, Italy 2007 Entrance controlKunshan, China (opened January 2011) Planned 2012 Entrance controlSalzkotten, Germany (divested 2011) 2006 Site protectionÖdeborg, Sweden (divested 2011) — Site protectionDoulevant le Château, France (divested 2011) 2011 Site protection
ISO-CERTIFIED PLANTS
With a global presence, collaboration within the Group and with suppliers is important from both a cost and an environmental perspective.
Gunnebo reduces risk in the supply chain. In 2011 Gunnebo replaced several Chinese suppliers which failed to meet the Group’s environmental and quality requirements.
ProductionThe Group has eleven production facilities in nine countries. Proximity to the market is fundamental to meeting customer needs with a competitive global offering. The fac-tory in Kunshan, China, opened in January 2011 and was certified ISO 9001 in August. ISO 14001 certification is planned for 2012.
28
Commitment to quality is one of Gunnebo’s Core Values and is a key element in the Group’s business process. Gunnebo wants to be an industry leader for quality and is working purposefully to deliver the right products at the right time and with the right quality.
RIGHT EVERY STEP OF THE WAYQUALITY
unnebo’s work with quality is based on customers’ expectations and requires commitment and knowledge
from all the Group’s employees and partners.
Quality for competitivenessA cornerstone in the Group’s work with quality is making continuous improvements. The improvement process is based on an ongoing dialogue and evaluations with the Group’s internal and external customers. Quality is the responsibility of all Gunnebo employees, and an important parameter for profitability and a strong brand.
Collaboration for quality assuranceThe Group’s quality assurance system is based on the ISO 9001 standard. Gunnebo is striving to harmonise the quality process for all production units.
Operational quality work is coordinated by the Group’s SVP Quality, but carried out locally by quality managers whose most important task is to ensure that the right level of quality is met and that the Group’s
quality policy is adhered to at all times (see www.gunnebogroup.com). The quality man-agers meet regularly to assess the efficacy of existing processes and identify measures for improvement.
Extended quality standardIn 2011 Gunnebo has increased the number of standards in the Group-wide quality standard, which is used as a starting point for controlling and improving quality. The standard refers to production, logistics and sales.
Many of Gunnebo’s product and system solutions undergo comprehensive external testing and are certified by leading test institutions worldwide. The certificates attained after successful tests are in strong demand among the Group’s customers.
Right first timeGunnebo’s quality control is based on Group-wide systems for steering, measuring and monitoring identified sub-processes. The aim is to steer key processes to get it
G right first time. Gunnebo works with four Group-wide quality goals:
Complaints from customers Delivery precision Costs of poor quality Credits
The quality goals are evaluated regularly. In order to become an industry leader for
quality, in 2011 Gunnebo strengthened its control over delivery precision and product quality. Weekly monitoring of quality, deliv-ery and costs has been supplemented with attitude-changing activities for better dia-logue and collaboration. In 2011 Gunnebo has mapped, standardised and improved quality control at its factories in Bazancourt, Halol and Jakarta.
One important tool in following up the Group’s work with quality is the Non Con-formance Notes (NCN) system. This system provides an overall picture of quality in pro-duction, installation and after-sales service, and lays the foundation for continuous improvements of products and processes.
IMPROVED DELIVERY RELIABILITY FROM CHINA
Thanks to its presence in the country, Gunnebo has been able to increase its delivery reliability from China in 2011 through control over the prod-ucts that are delivered. In August 2011, Gunnebo’s
Chinese factory was certified ISO 9001. The certifi-cation secures the quality of the products from the factory and ensures that the unit follows the requirements of Gunnebo’s quality policy.
>> SUSTAINABLE BUSINESS > QUALITY

29
Regular, goal-oriented work is under way at production units to reduce the Group’s negative impact on the environment. The collaboration between the units’ environmental mangers fosters an exchange of experiences and transfer of knowledge. Below are some examples of Gunnebo’s activities to reduce its impact on the environment in 2011.
Gunnebo’s plant in Doetinchem, Netherlands, now only uses renewable electricity. It has also streamlined its returns system for freight trans-port, thereby reducing consumption of packag-ing materials by 75%.
Through an agreement with its energy supplier, the plant in Trier, Germany, uses electricity from energy sources that have half the German aver-age for carbon dioxide emissions.
At the Markersdorf plant in Germany, heat recovery has been improved in the production premises and the percentage of water-based paint has been increased.
New lighting with half the energy consumption has been installed in the production premises at the factory in Baldenheim, France.
At the unit in Bazancourt, France, employees have been working on a project over the past year to recycle used washing water in cement.
An energy-saving campaign has reduced electricity consumption at Gunnebo’s facility in Jakarta, Indonesia, by 12% in 2011.
The facility in Lavis, Italy, has invested in an efficient new compressor with 25% lower energy consumption.
ACTIVITIES FOR REDUCED ENVIRONMENTAL IMPACT IN 2011
Gunnebo’s environmental goals drive resource-efficient production, and the development of attractive products with a long life cycle and low energy consumption.
ACTIVITIES FOR A SUSTAINABLE FUTUREENVIRONMENT
he purpose of working towards environmental goals is to reduce the Group’s negative impact on the
environment and build on an environmental management system that involves every operational level in the Group.
Environmental managers in dialogue All production units in Gunnebo have an environmental manager responsible for environmental work. The Group’s environ-mental managers collaborate to evaluate the efficacy of existing processes and iden-tify measures for improvement. This dia-logue promotes a transfer of knowledge and
T collaboration between the units, as well as coordination of the internal audit operation.
Gunnebo’s environmental goals Gunnebo’s overriding environmental goals are based on knowledge of the individual businesses’ environmental impact, which is mainly acquired through the Group’s environmental management systems. The targets describe the areas in which the Group’s environmental performance should primarily be improved. Gunnebo’s overriding environmental targets were set in 2008 and will be evaluated after 2012.
Environmental target 1Optimise energy consumption and minimise impact on climate change from the Group’s businesses. The target is to reduce carbon dioxide emissions by 15%. The result is mon-itored quarterly and reported with regard to emissions from production, passenger trans-port and freight transport.
Environmental target 2Make efficient use of raw materials and natural resources. The target is to reduce electricity consumption by 10%. The result of energy consumption in production is monitored quarterly and is reported with regard to supplier, consumption and produc-tion method (nuclear power, fossil fuel, etc.). The amount of electricity from renewable resources shall be reported.
Environmental target 3Maintain effective sorting-at-source and recycling of materials to enable Gunnebo to minimise the amount of non-recycled waste. The target is to increase material recycling by 10%. The result is monitored quarterly, and total waste and recycled waste are reported for the production plants.
Environmental target 4Further develop Gunnebo’s strategy for product development, so that the Group takes environmental aspects such as energy consumption and the use of natural resources into consideration throughout the entire lifecycle of a product.
30
>> SUSTAINABLE BUSINESS > ENVIRONMENT
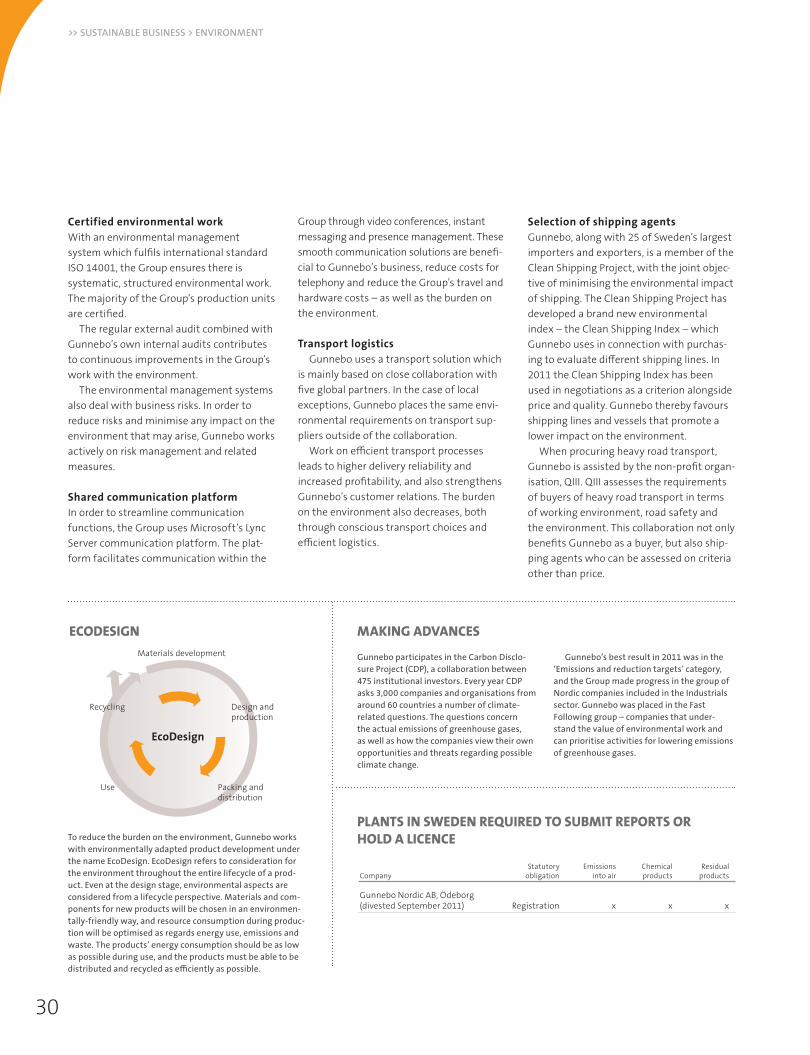
EcoDesign
Recycling Design and production
Packing and distribution
Use
Materials development
Group through video conferences, instant messaging and presence management. These smooth communication solutions are benefi-cial to Gunnebo’s business, reduce costs for telephony and reduce the Group’s travel and hardware costs – as well as the burden on the environment.
Transport logisticsGunnebo uses a transport solution which
is mainly based on close collaboration with five global partners. In the case of local exceptions, Gunnebo places the same envi-ronmental requirements on transport sup-pliers outside of the collaboration.
Work on efficient transport processes leads to higher delivery reliability and increased profitability, and also strengthens Gunnebo’s customer relations. The burden on the environment also decreases, both through conscious transport choices and efficient logistics.
Selection of shipping agentsGunnebo, along with 25 of Sweden’s largest importers and exporters, is a member of the Clean Shipping Project, with the joint objec-tive of minimising the environmental impact of shipping. The Clean Shipping Project has developed a brand new environmental index – the Clean Shipping Index – which Gunnebo uses in connection with purchas-ing to evaluate different shipping lines. In 2011 the Clean Shipping Index has been used in negotiations as a criterion alongside price and quality. Gunnebo thereby favours shipping lines and vessels that promote a lower impact on the environment.
When procuring heavy road transport, Gunnebo is assisted by the non-profit organ-isation, QIII. QIII assesses the requirements of buyers of heavy road transport in terms of working environment, road safety and the environment. This collaboration not only benefits Gunnebo as a buyer, but also ship-ping agents who can be assessed on criteria other than price.
CompanyStatutory
obligationEmissions
into airChemical products
Residual products
Gunnebo Nordic AB, Ödeborg (divested September 2011) Registration x x x
PLANTS IN SWEDEN REQUIRED TO SUBMIT REPORTS OR HOLD A LICENCE
ECODESIGN
To reduce the burden on the environment, Gunnebo works with environmentally adapted product development under the name EcoDesign. EcoDesign refers to consideration for the environment throughout the entire lifecycle of a prod-uct. Even at the design stage, environmental aspects are considered from a lifecycle perspective. Materials and com-ponents for new products will be chosen in an environmen-tally-friendly way, and resource consumption during produc-tion will be optimised as regards energy use, emissions and waste. The products’ energy consumption should be as low as possible during use, and the products must be able to be distributed and recycled as efficiently as possible.
MAKING ADVANCES
Gunnebo participates in the Carbon Disclo-sure Project (CDP), a collaboration between 475 institutional investors. Every year CDP asks 3,000 companies and organisations from around 60 countries a number of climate-related questions. The questions concern the actual emissions of greenhouse gases, as well as how the companies view their own opportunities and threats regarding possible climate change.
Gunnebo’s best result in 2011 was in the ‘Emissions and reduction targets’ category, and the Group made progress in the group of Nordic companies included in the Industrials sector. Gunnebo was placed in the Fast Following group – companies that under-stand the value of environmental work and can prioritise activities for lowering emissions of greenhouse gases.
Certified environmental workWith an environmental management system which fulfils international standard ISO 14001, the Group ensures there is systematic, structured environmental work. The majority of the Group’s production units are certified.
The regular external audit combined with Gunnebo’s own internal audits contributes to continuous improvements in the Group’s work with the environment.
The environmental management systems also deal with business risks. In order to reduce risks and minimise any impact on the environment that may arise, Gunnebo works actively on risk management and related measures.
Shared communication platformIn order to streamline communication functions, the Group uses Microsoft’s Lync Server communication platform. The plat-form facilitates communication within the

SSAAVVIINNGG TTIIMMEE AANNDD PPRROOTTEECCTTIINNGG TTHHEE EENNVVIIRROONNMMEENNTT
MODERN VEHICLES REDUCE IMPACT ON THE ENVIRONMENTIIn 2n 200111 G1 Guunnnneebbo Fo Frranancce me mananaaggeed td to ro reedduucce ie ittsseemimisssisioonns fs foor ir itts es ennttiirre ve veehihicclle fle fleeeet bt by an avy an aveerraaggeeoof 5f 5%%. N. Neewweer vr veehihiccllees ws wiitth lh loowweer er emimisssisioon vn valualueess,,vveehihiccllees ws wiitth sh sttoopp--ssttarart st syysstteemmss, i, innffoorrmmaattiioon fn foorrvveehihiccllee ddrriivveerrss anandd tthhee iinnssttalalllaattiioonn ooff GGPPSS eeqquuiippmmeenntthhavave se sttrreeamamlliinneed td trrananssppoorrt ant and rd reedduucceed td toottalaleemimisssisioonnss. W. Wiitth a sh a sttrriicct vt veehihicclle pe poolliiccy any and td thheessyysstteemmaattiic rc reeppllaacceemmeennt ot of of ollddeer vr veehihicclleess, i, it wt wiillllaallsso bo be pe poosssisibblle te to ro reedduucce ee emimisssisioonns cs coonnsisiddeerrababllyyiin tn thhe ye yeearars ts to co coommee..
5
10
15
20
25
Tonne CO2 /MEUR
07 08 09 10 11
Group carbon dioxide emissions
10
20
30
40
50
MWh/MEUR
07 08 09 10 11
Group electricity consumption
IIn 2n 20011 G11 Guunnnneebbo do diivveesstteed ad an en enneerrggyy--iinntteennssiivve oe oppeerraattiioon wn whhiicch ph paarrttlly ey exxppllaaiinns ts thhe le loowweerrvvaalluuees fs foor er elleeccttrriicciitty cy coonnssuummppttiioon an annd cd caarrbboon dn diiooxxiidde ee emmiissssiioonns ds duurriinng tg thhe ye yeeaarr..
TThihis gs grrapaph sh shhoowws ts thhaat Gt Guunnnneebboo’’s es envnviirroonn--mmeennttal wal woorrk hk has las leed td to lo loowweer er enneerrggyy ccoonnssuummppttiioon in in rn reellaattiioon tn to no neet st salaleess..
TThhe re reeppoorrttiinng og of cf cararbboon dn diiooxxiidde ee emimisssisioonnssrreeffeerrs ts to do diirreecct ant and id innddiirreecct et emimisssisioonns fs frroommtthhe Ge Grroouupp’’s ps prroodduuccttiioon in in rn reellaattiioon tn to no neet st salaleess..
31

32
>> SUSTAINABLE BUSINESS > EMPLOYEES
Gunnebo’s employees work together to achieve the company’s vision of a safer future. In 2011 Gunnebo invested in its employees in order to strengthen the Group – both as a supplier and an employer. At the year-end, Gunnebo had 5,499 (5,251) employees in 31 (30) countries.
INVESTING IN COMPETENCEEMPLOYEES
T
Employees by country
France, 21%India, 17%Indonesia, 16%Spain, 6%Germany, 5%The Netherlands, 5%UK, 5%Sweden, 4%South Africa, 4%Others, 17%
Total: 5,499
he Group’s customers demand high quality with regard to the delivery of products and solutions, and they
expect service that creates value. Employee competence and their outlook on quality, along with their values and attitudes, are important factors for success.
Stimulating international environmentGunnebo offers excellent opportunities for personal and professional growth. Perform-ance assessment, career and succession planning as well as mapping development potential are important activities.
To manage and develop the competence and experience in the organisation while also offering personal development, there is an internal job market on the Group’s intranet. Job vacancies are published here before being advertised externally where appropriate.
One result of successful internal recruit-ment is the staffing of the new Global Serv-ices organisation in Barcelona in 2011. Two members of the Business Area’s manage-ment team were recruited internally.
People Planning ProcessDuring the year, the Human Resources (HR) department of the parent company has developed a tool for personnel planning. The tool provides support in efforts to evaluate employee performance and development opportunities, and to identify and initiate activities for development.
The tool makes work on succession plan-ning easier and enables swift, powerful action when key employees need to be replaced for various reasons.
Leadership and rejuvenation Last year’s mapping of leadership compe-tence in the organisation resulted in a lead-ership programme in 2011 in collaboration with IFL and the Stockholm School of Eco-nomics. In 2011, 20 employees took part in the programme which ran over six months.
A trainee programme has also been started in 2011, whereby four trainees work in different functions and areas over 15 months.
KAM programme Gunnebo’s Key Account Management (KAM) programme fosters customer relations and develops business, primarily with larger local and global customers. The programme began in 2010 and a third round was carried out in 2011.
Diversity for good customer relationsGunnebo’s employees should reflect the Group’s customers, and also be knowledge-able about and have an understanding of local cultures and conditions. The ability to understand customer needs increases with local presence, and with it the ability to fulfil customers’ wishes with bespoke solutions. Having employees close to customers gives Gunnebo better, longer-lasting customer relationships.
Interactive training platform Gunnebo Training Centre (GTC) is a training platform for collecting and efficiently dis-seminating the Group’s unique knowledge. It is a cost-effective, quality-assured method of spreading competence within the Group.
Dialogue for developmentIn order to develop the business, Gunnebo maintains dialogue with employees about their views on areas with potential for improvement, in terms of both the work-place and the work environment.
The vast majority of Gunnebo employees have access to the Group-wide intranet, GunneboNET, the primary channel for com-munication relating to Group-wide processes and policies.

Agneta Hultgren, Gunnebo’s SVP Human Resources: What does Gunnebo aim to achieve with its new trainee programme?“The goal is to bring in young people with the poten-tial to develop into future leaders within the organi-sation. The advantage of recruiting young academics is that professionally they are ‘history-free’, and we therefore have a better chance of influencing and moulding them based on the Group’s needs. We are also seeing that they are open-minded and bring with them energy, creativity and innovation.
I would like to point out that as well as recruiting externally we will attempt to search internally for young employees with development potential, and they will be covered by a separate programme.”
How is the programme structured?“The programme began in November 2011. The four trainees are specialists in the functions of Economy & Finance, Purchasing, Logistics, Service and Produc-tion. During the 15-month trainee programme they will rotate in three countries. Each trainee has a
mentor. The mentor is a representative of the man-agement for the respective function, and there is also a local host for each placement the trainee has. The mentor and host jointly set goals and plan activ-ities for each placement.”
Describe your trainees“We chose four people from all the excellent candi-dates, and it was a tough selection process. We think they stand out from the crowd and have the qualifi-cations we are looking for. They are young and full of initiative, they have international experience and good academic results. They are driven by a strong will to develop and can cope with challenges. Good linguistic skills and a desire to move within the organisation were key selection parameters.
From a diversity perspective, it is pleasing to note that three of the trainees are women. Two of them come from France, one has Swedish-Czech origins and the fourth is from India. I very much look for-ward to following their development and have high expectations of their future input for Gunnebo.”
SECURING FUTURELEADERSHIP
Employees by gender
Women, 15%Men, 85%
Total: 5,499
Employees in sales companies, by function
Service & Installation, 47%Internal Service & Support, 20%Site Protection, 11%Bank, 16%Secure Storage, 4%Retail, 2%
Total: 3,393
Employees by regionEMEA, 43%Business Areas/Operations, 34%Asia Pacific, 16%Americas, 5%Developing Businesses, 1%Head office, 1%
Total: 5,499
Male/female managers
Women, 20%Men, 80%
Total: 158
10
20
30
40
50
Average age
Gro
up t
otal
Busi
ness
Are
as/
Ope
rati
ons
Am
eric
as
EMEA
Asi
a Pa
cifi
c
33

34
>> FINANCIAL REPORTING > BOARD OF DIRECTORS’ REPORT
unnebo is an international security group with an annual turnover of approximately MSEK 5,100 and around 5,500 employees. The Group offers effective, innovative security
solutions in Bank Security & Cash Handling, Secure Storage, Entrance Control and Services to customers around the globe.
Reporting of discontinued operationsThe divestments of Perimeter Protection in September 2011 and of Gunnebo Troax in December 2010 have been recognised in accord-ance with IFRS 5, Non-current assets held for sale and discontinued operations. In the consolidated income statement the profit/loss for discontinued operations is reported separately under “Profit/loss for the year from discontinued operations”. This means that income and costs for Perimeter Protection and Gunnebo Troax have been excluded from other profit/loss items for all reported periods.
In the consolidated cash flow statement the discontinued opera-tions have not been separated in the corresponding way. Information about cash flows for these operations is instead reported in Note 31. The balance sheet only includes the assets and liabilities that remain in the Group after the divestments.
Order intake and net salesThe Group’s order intake amounted to MSEK 5,090.8 (5,271.5). Adjusted for altered exchange rates, order intake increased by 2%. The improvement in order intake in constant currency rates was primarily attributable to Asia, Germany and Canada, while develop-ment in Southern Europe was weaker.
Net sales during the year decreased to MSEK 5,137.1 (5,262.5). A stronger Swedish krona compared to last year had an adverse impact on sales of 5%. Adjusted for exchange rate fluctuations, net sales improved by 3%. Above all there was increased demand in Asia, Africa, Germany and Canada which had a positive impact on net sales, while development in Southern Europe, and Spain in particular, was weaker.
Financial resultsOperating profit increased to MSEK 324.2 (196.7) and the operating margin to 6.3% (3.7%). Currency effects had a negative impact on profit/loss of approximately MSEK 34 compared to last year. Operat-ing profit adjusted for items of a non-recurring nature of MSEK 7.0 (–126.9) amounted to MSEK 317.2 (323.6) and the operating margin to 6.2% (6.1%).
In connection with the acquisition of further holdings in Gunnebo’s Brazilian sales company, the Group obtained a controlling influence and the previously owned holding was revalued to its fair value. The revaluation resulted in a positive impact on profit of MSEK 86.4, which is reported under operating profit. Restructuring costs, along with certain other expenses of a non-recurring nature, burdened the result by MSEK –79.4 (–126.9) in total. The majority of these costs can be attributed to staff cuts in the Group’s Spanish operation, and to structural measures in the Bank Security & Cash Handling Business
BOARD OF DIRECTORS’ REPORT
Area. The measures are part of the savings programme launched in 2009 with the aim of reducing the Group’s fixed costs, and the sav-ings programme is deemed to have reduced fixed costs by approxi-mately MSEK 61 compared to last year.
During 2011 the Group initiated a programme to increase the rate of capital turnover in inventory, and as a result of the programme activities have been carried out with the aim of selling and disposing of products that have been written down. Consequently, some meas-ures which form the basis for calculating a provision for obsolescence in inventories have been adjusted, and this has resulted in the reversal of approximately MSEK 25 against “Cost of goods sold” in the income statement.
Further initiatives to expand the operation have been carried out this year, primarily on the market side. The cost of such measures to pro-mote growth burdened profit by approximately MSEK 50 (11) in total.
Net financial items improved to MSEK –26.5 (–75.5) due to a decrease in average interest on borrowing, as well as lower borrow-ing overall. Group profit after financial items amounted to MSEK 297.7 (121.2). Net profit for the period totalled MSEK 229.7 (178.3), and earnings per share attributable to the parent company’s share-holders was SEK 3.00 (2.35) per share.
The tax expense amounted to MSEK –52.5 (–40.1) and the tax rate to 17.6% (33.1%). The tax rate has been positively affected by non-taxable income of a non-recurring nature and by a more favourable composition of Group profit, with profit improvements in countries where the Group is not yet in a tax position.
Divestment of Perimeter ProtectionIn September 2011, Perimeter Protection was sold to Swedish ven-ture capital company Procuritas Capital Investors. The purchase sum on a debt-free basis after transaction costs amounted to MSEK 268.4 and the Group capital loss totalled MSEK –1.5. Furthermore, profit was recompensed by MSEK 3.5 relating to accumulated translation differences in equity which were reclassified as profit in connection with the divestment.
Gunnebo has invested MSEK 4.6 in the holding company that acquired Perimeter Protection, which equates to a participating interest of 10%, and continues financing in the amount of MEUR 10.
Acquisition of AlltechOn August 31, 2011 Gunnebo acquired Alltech (Pty) Ltd, a market-leading company in South Africa in the field of entrance control. The acquired operation has annual net sales of approximately MSEK 40 and 28 employees. The purchase sum totalled MSEK 41.5. Goodwill arising from the acquisition amounted to MSEK 34.8.
Acquisition of further holdings in Gunnebo’s Brazilian sales companyIn early November a further 30% of both the capital and the votes in Gunnebo’s Brazilian associated company was acquired. The company
The Board and President of Gunnebo AB (publ), company registration number 556438-2629, hereby submit the Annual Report and consolidated accounts for the 2011 financial year.
G

35
is a leading supplier of security solutions for the retail sector in Brazil and has sales in the region of MSEK 130 and 90 employees. The acquisition is an important step in Gunnebo’s continued expansion on the South American market. The purchase sum was MSEK 79.9 and payment was in cash. Acquisition costs totalled MSEK 1.9.
On increasing its ownership of the Brazilian associated company, Gunnebo obtained a controlling influence in the company which has subsequently been recognised as a subsidiary. The previously owned share has hereby been revalued to fair value, resulting in a positive profit effect of MSEK 86.4 which has been reported under operating profit.
Goodwill arising from the acquisition and the revaluation of the previously owned share amounted to MSEK 138.3. After the acquisi-tion the company has had net sales of MSEK 47.5 and an operating profit of MSEK 15.0.
Capital expenditure and depreciationInvestments made in intangible assets and tangible assets during the period totalled MSEK 89.7 (88.3). Investments relating to continuing operations totalled MSEK 84.7 (70.8). Depreciation in the Group and in continuing operations amounted to MSEK 90.1 (113.3) and MSEK 80.9 (82.2) respectively.
Product developmentGroup expenditure on developing and supporting existing product programmes, and on developing brand new products in existing or new market segments, totalled MSEK 77.3 (87.5), of which MSEK 16.4 (16.0) was capitalised in the balance sheet during the year.
Cash flowCash flow from operating activities amounted to MSEK 64.9 (144.6). Payments related to restructuring measures burdened cash flow for the year by MSEK 53.8 and an increase in working capital tied up had a negative impact of MSEK 168.7.
Cash flow from operating activities before changes in working capital improved to MSEK 233.6 (176.8).
Net sales by market 2011 2010
MSEK % MSEK %
France 1,169 23 1,201 23UK 297 6 300 6Spain 291 6 390 7Germany 282 5 235 4India 264 5 252 5Hungary 234 5 205 4Italy 215 4 218 4Canada 204 4 202 4Sweden 188 4 209 4Indonesia 175 3 165 3Belgium 172 3 214 4Australia 170 3 112 2Denmark 147 3 160 3South Africa 135 3 120 2Other 1,194 23 1,280 25Continuing operations 5,137 100 5,263 100
2,000
4,000
6,000
8,000
10,000
Mkr
09 10 11
Net sales
100
200
300
400
Mkr
Operating profit
Incl. items of a non-recurring natureExcl. items of a non-recurring nature
09 10 11

36
>> FINANCIAL REPORTING > BOARD OF DIRECTORS’ REPORT
Liquidity and financial positionThe Group’s liquid funds at the end of the period amounted to MSEK 238.8 (188.7). Equity amounted to MSEK 1,775.4 (1,605.8), producing an equity ratio of 45% (43%).
The improvement in equity can primarily be attributed to profit during the year, which contributed MSEK 229.7. Dividend payments to shareholders burdened equity by MSEK –37.9. Other comprehen-sive income comprising translation differences, hedges of net invest-ments abroad, cash flow hedges and income tax related to these components reduced equity by MSEK –33.9 during the period.
Net debt amounted to MSEK 497.8 (459.5), mainly due to acquisi-tions, dividend to shareholders and an increase in working capital tied up. The divestment of Perimeter Protection, however, had a miti-gating effect. The debt/equity ratio was identical to last year and totalled 0.3 (0.3). Net debt excluding pension commitments amounted to MSEK 298.8 (260.6).
During the third quarter, Gunnebo agreed on a renewed MEUR 140 credit framework which ensures financing is available on market terms until the end of June 2014. The new borrowing facility replaces Gunnebo’s former borrowing facility in the form of a syndicated credit framework and bilateral loans.
EmployeesThe number of employees at the end of the period was 5,499 (5,251 at the beginning of the year). The number of employees outside of Sweden at the end of the period was 5,298 (5,055 at the beginning of the year). The increase in the number of employees can mainly be explained by the acquisitions in Brazil and South Africa and by growth initiatives in India. For more information, see the Employees section on pages 32–33.
Remuneration to senior executivesThe Board proposes that the 2012 Annual General Meeting re-approve the current principles for remuneration and other employ-ment conditions for Gunnebo’s Group Executive Team for 2012. The principles relate to the President and other members of the Group Executive Team and apply to employment contracts entered into after the guidelines have been approved by the Annual General Meeting and to changes in existing employment contracts made subsequently.
Gunnebo will offer the level of remuneration and terms of employ-ment necessary to recruit and retain qualified senior executives. The overall principles for salary and other remuneration to senior execu-
Net sales, operating profit and operating margin by Business Area, MSEK
Net sales Operating profit/loss Operating margin, %
2011 2010 2011 2010 2011 2010
Bank Security & Cash Handling 2,276 2,427 147 166 6.5 6.8Secure Storage 731 750 15 38 2.1 5.1Global Services 1,120 1,120 121 91 10.8 8.1Entrance Control 720 691 36 –1 5.0 –0.1Developing Businesses 290 275 –35 –37 –12.1 –13.5Central items — — 40 –60 — —Continuing operations 5,137 5,263 324 197 6.3 3.7
tives at Gunnebo are, therefore, that compensation shall be competi-tive and in line with market standards. The Group Executive Team’s total remuneration shall consist of fixed salary, performance-related remuneration including long-term incentive programmes, pension and other benefits.
The fixed salary shall take into account the individual’s position, expertise, areas of responsibility, performance and experience, and shall normally be reviewed on an annual basis. The fixed salary shall also comprise the basis for calculating performance-related remuner-ation. The performance-related element shall be dependent on the individual’s achievement of predetermined, quantitative financial targets and may not exceed 50% of the fixed salary.
The Board shall evaluate each year whether a share or share price-related incentive programme will be proposed at the Annual General Meeting.
Pension premiums for members of the Group Executive Team liv-ing in Sweden are paid in accordance with a defined contribution plan. Premiums may amount to a maximum of 35% of the fixed sal-ary, depending on age and salary level. Members of the Group Execu-tive Team living outside of Sweden may be offered pension solutions that are competitive in the country where they live, preferably pre-mium-based solutions. The retirement age shall be 65.
For members of the Group Executive Team living in Sweden, the notice period is 12 months for the company and six months for the individual. No severance pay is awarded. Members of the Group Executive Team living outside of Sweden may be offered notice peri-ods that are competitive in the country where they live, preferably equivalent to the notice periods applicable in Sweden.
The Board is entitled to depart from these guidelines in individual cases if there are specific reasons to do so.
Share categoryAt the end of the year, Gunnebo AB’s share capital amounted to MSEK 379.3, divided into 75,855,598 shares with a quota value of SEK 5. All shares have one vote each and are of the same category. Each share entitles the holder to an equal share of the company’s assets and profits. There are no restrictions on the transferability of shares.
Share dataEarnings per share after dilution were SEK 3.00 (2.35) and for continu-ing operations SEK 3.20 (1.07). The number of shareholders totalled approximately 10,200 (10,600).

37
Proposed dividendThe Board and the President propose that a dividend of SEK 1.00 per share (SEK 0.50 per share) be paid for the 2011 financial year.
Parent companyThe Group’s parent company, Gunnebo AB, is a holding company which has the main task of owning and managing shares in other Group com-panies, as well as providing Group-wide functions and services within corporate management, business development, human resources, legal affairs, financial control/finance, IT, quality, logistics, the environ-ment and communication. The parent company’s operating profit/loss for 2011 amounted to MSEK 18.7 (–29.6). Investments in and divest-ments of shares and participations in subsidiaries amounted to MSEK 0.0 (0.0) and MSEK 0.0 (200.0) respectively. Investments made in intan-gible assets and tangible assets totalled MSEK 3.9 (0.5). Liquid funds at the end of the year amounted to MSEK 0.1 (0.1).
Environmental impactGunnebo strives to operate its business in a way that is not damag-ing to the environment, and it complies with the applicable environ-mental legislation in its businesses and processes around the world. Up until September 2011 the Group operated business requiring notification or a licence under Swedish environmental law at its Swedish company Gunnebo Nordic AB. For more information, see the Environment section on pages 29–31.
Risks and uncertainties Given the international nature of its business, Gunnebo is exposed to financial, business environment and other business risks. The financial risks are mainly linked to changes in interest rates, exchange rates, as well as refinancing and counterparty risks, and primarily comprise financing risk, interest rate risk, liquidity risk and currency risk. These risks are covered by and regulated in the Group’s finance policy.
Business risks primarily include operational and strategic risks, such as market risks, raw material risks, production risks, distribution risks, product risks and legal risks. In addition to the above opera-tional risks, the Group also continuously monitors risks relating to the environment, fraud, changes in prices, competition, technical devel-opment, new legislation, competence supply and taxes.
For more information on the risks to which Gunnebo is exposed, see Notes 3 and 35 and the section on Risk and sensitivity analysis on pages 88–91.
Corporate governance report The Corporate Governance Report, which is on pages 74–80, consti-tutes a separate document from the Annual Report under the Annual Accounts Act, Chapter 7, §8.
Future prospects Gunnebo is making no comment on prospects for 2012.
Events after the closing dayNo significant events affecting the content of this Annual Report have occurred between December 31, 2011 and the publication of this Annual Report, except that Bernt Ingman became CFO on March 1, 2012.
30
60
90
120
150
Capital expenditureDepreciation excl. goodwill
Capital expenditure and depreciationMSEK
Figures refer to continuing operations.
09 10 11
0.4
0.8
1.2
1.6
2.0
times
09 10 11
Debt/equity ratio
1,200
2,400
3,600
4,800
6,000
MSEK
09 1110
Balance sheet total and equity
Balance sheet totalOf which equity
1,600
3,200
4,800
6,400
8,000
Number
09 10 11
No. of employees at year-end
TotalOf whom in Sweden
Figures refer to continuing operations.

38
>> FINANCIAL REPORTING > DEFINITIONS
DEFINITIONSCapital employed: Total assets less non-interest bearing provisions and liabilities.
Capital turnover rate: Net sales in relation to average capital employed.
Cash flow per share:Cash flow from operating activities divided by the average number of shares in issue after dilution.
Debt/equity ratio:Net debt in relation to equity.
Dividend yield: Dividend in relation to listed price on December 31.
Earnings per share: Profit/loss after tax attributable to the parent company’s shareholders divided by the average number of shares.
Equity per share: Equity attributable to the shareholders of the parent company divided by the number of shares at the end of the period.
Equity ratio: Equity as a percentage of the balance sheet total.
Gross margin:Gross profit as a percentage of net sales.
Interest coverage ratio: Profit/loss after financial items plus interest costs, divided by interest costs.
Net debt:Interest-bearing provisions and liabilities less liquid funds and interest-bearing receivables.
Operating cash flow:Cash flow from operating activities, after capital expendi-ture but before net financial items affecting cash flow and tax paid.
Operating margin: Operating profit/loss as a percentage of net sales.
P/E ratio: Listed price on December 31 divided by earnings per share after dilution.
Profit margin: Profit/loss after financial items as a percentage of net sales.
Return on capital employed: Operating profit/loss plus financial income as a percentage of average capital employed.
Return on equity:Profit/loss for the year as a percentage of average equity.
CONTENTS
Group Income Statements 39Group Statement of Comprehensive Income 39Group Balance Sheets 40Change in Group Equity 42Group Cash Flow Statements 43Parent Company Income Statements 44Parent Company Statement of Comprehensive Income 44Parent Company Balance Sheets 45Change in Parent Company’s Equity 47Parent Company Cash Flow Statements 48Notes 49Proposed Distribution of Earnings 72Auditor’s Report 73

39
MSEK Note 2011 2010
Net sales 5 5,137.1 5,262.5Cost of goods sold –3,572.5 –3,722.8Gross profit 1,564.6 1,539.7
Selling expenses –757.0 –743.6Administrative expenses 33 –592.6 –614.4Share of profit of associated companies 16 3.5 5.8Other operating income 6 117.1 37.5Other operating expenses 7 –11.4 –28.3Operating profit 5, 8, 9, 10, 22, 27, 32 324.2 196.7
Financial itemsInterest income 11.6 4.9Other financial income 11 0.5 2.8Interest expenses –12.9 –45.2Other financial expenses 11 –25.7 –38.0Total financial items –26.5 –75.5
Profit after financial items 297.7 121.2
Taxes 12 –52.5 –40.1Profit for the year from continuing operations 245.2 81.1
Discontinued operations 31Profit/loss for the year from discontinued operations –15.5 97.2Profit for the year 229.7 178.3
Of which attributable to:Parent company shareholders 227.4 178.3Non-controlling interest 2.3 0.0Total 229.7 178.3
Earnings per share before dilution, SEK 13 3.00 2.35Of which continuing operations 3.20 1.07Of which discontinued operations –0.20 1.28
Earnings per share after dilution, SEK 13 3.00 2.35Of which continuing operations 3.20 1.07Of which discontinued operations –0.20 1.28
GROUP STATEMENT OF COMPREHENSIVE INCOMEMSEK Note 2011 2010
Profit for the year entered in the income statement 229.7 178.3
Other comprehensive income during the yearTranslation differences in foreign operations* 21 2.4 29.5Reversal of accumulated currency differences from discontinued operations 21 –3.5 6.1Hedging of net investments 21 –32.5 –25.4Cash flow hedges 21 –0.3 3.0Total other comprehensive income, net of tax –33.9 13.2
Comprehensive income for the year 195.8 191.5
Of which attributable to:Parent company shareholders 193.8 191.5Non-controlling interest 2.0 0.0Total 195.8 191.5
* Of which MSEK –0.3 (0.0) refers to non-controlling interest.
GROUP INCOME STATEMENTS

40
>> FINANCIAL REPORTING > FINANCIAL STATEMENTS
ASSETS, MSEK Note 2011 2010
Non-current assets
Intangible assetsGoodwill 14 1,104.0 952.1Other intangible assets 14 110.7 96.2Total intangible assets 1,214.7 1,048.3
Property, plant and equipmentBuildings and land 15 145.1 201.1Machinery 15 96.3 80.0Equipment 15 71.7 77.5Construction in progress 15 3.1 8.9Total property, plant and equipment 316.2 367.5
Financial assetsHoldings in associated companies 16 29.1 58.9Other shares and participations 5.1 0.1Other long-term receivables 105.0 35.0Total financial assets 139.2 94.0
Deferred tax assets 12 252.5 240.6
Total non-current assets 1,922.6 1,750.4
Current assets
Inventories 17 564.1 543.3
Current receivablesAccounts receivable 18 1,005.6 1,066.0Current tax receivables 40.7 48.6Other receivables 130.0 83.0Prepaid expenses and accrued income 19 63.0 55.0Total current receivables 1,239.3 1,252.6
Liquid funds 20 238.8 188.7
Total current assets 2,042.2 1,984.6
TOTAL ASSETS 3,964.8 3,735.0
GROUP BALANCE SHEETS

41
EQUITY AND LIABILITIES, MSEK Note 2011 2010
EquityShare capital (75,855,598 shares with a quota value of SEK 5) 379.3 379.3Other contributed capital 978.4 977.4Reserves 21 —115.0 –81.4Retained earnings 520.0 330.4Total equity attributable to the shareholders of the parent company 1,762.7 1,605.7
Non-controlling interest 12.7 0.1Total equity 1,775.4 1,605.8
Long-term liabilitiesDeferred tax liabilities 12 37.3 32.7Pension commitments 22 199.0 198.9Borrowings 24 563.9 407.8Total long-term liabilities 800.2 639.4
Current liabilitiesAccounts payable 538.6 582.1Current tax liabilities 25.6 32.5Other liabilities 181.9 208.7Accrued expenses and deferred income 25 443.4 468.9Borrowings 24 78.5 76.5Other provisions 23 121.2 121.1Total current liabilities 1,389.2 1,489.8
TOTAL EQUITY AND LIABILITIES 3,964.8 3,735.0
Pledged assets — —Contingent liabilities 26 191.8 206.5

42
>> FINANCIAL REPORTING > FINANCIAL STATEMENTS
Attributable to the shareholders of the parent company
MSEKShare
capital
New share
issue in progress
Other contrib-
uted capital Reserves
Retained earnings Total
Non-controlling
interestTotal
equity
Opening balance Jan 1, 2011 379.3 — 977.4 –81.4 330.4 1,605.7 0.1 1,605.8
Profit for the year — — — — 227.4 227.4 2.3 229.7Other comprehensive income during the year — — — –33.6 — –33.6 –0.3 –33.9Comprehensive income for the year — — — –33.6 227.4 193.8 2.0 195.8
Share-based remuneration — — — — 0.0 0.0 — 0.0New share issue** — — 1.0 — — 1.0 — 1.0Transactions with shareholders with non-controlling interest — — — — 0.1 0.1 10.6* 10.7Dividend — — — — –37.9 –37.9 — –37.9Total transactions with shareholders — — 1.0 — –37.8 –36.8 10.6 –26.2
Closing balance Dec 31, 2011 379.3 — 978.4 –115.0 520.0 1,762.7 12.7 1,775.4
Attributable to the shareholders of the parent company
MSEKShare
capital
New share
issue in progress
Other contrib-
uted capital Reserves
Retained earnings Total
Non-controlling
interestTotal
equity
Opening balance Jan 1, 2010 378.1 1.2 976.1 –94.6 152.1 1,412.9 0.1 1,413.0
Profit for the year — — — — 178.3 178.3 0.0 178.3Other comprehensive income during the year — — — 13.2 — 13.2 0.0 13.2Comprehensive income for the year — — — 13.2 178.3 191.5 0.0 191.5
Share-based remuneration — — — — 0.0 0.0 — 0.0New share issue** 1.2 –1.2 1.3 — — 1.3 — 1.3Total transactions with shareholders 1.2 –1.2 1.3 — 0.0 1.3 — 1.3
Closing balance Dec 31, 2010 379.3 — 977.4 –81.4 330.4 1,605.7 0.1 1,605.8
* Of which MSEK 10.7 refers to identifiable net assets in Gateway Security SA at the acquisition date belonging to shareholders with non-controlling interest.** Refers to the issue of warrants to participants in incentive programmes.
CHANGE IN GROUP EQUITY

43
MSEK Note 2011 2010
OPERATING ACTIVITIESOperating profit from continuing operations 324.2 196.7Profit/loss from discontinued operations, net of tax –15.5 97.2Adjustment for items not included in cash flow etc. 29 15.3 17.4Net financial items affecting cash flow 28 –28.9 –79.4Taxes paid –61.5 –55.1Cash flow from operating activities before changes in working capital 233.6 176.8
Cash flow from changes in working capitalChange in inventories –156.4 –9.7Change in operating receivables –49.5 –7.9Change in operating liabilities 37.2 –14.6Total change in working capital –168.7 –32.2
Cash flow from operating activities 64.9 144.6
INVESTING ACTIVITIESCapital expenditure on intangible assets 14 –24.7 –25.1Capital expenditure on property, plant and equipment 15 –65.0 –63.2Sale of property, plant and equipment 1.6 9.8Acquisition of operations 30 –99.7 –24.7Divestiture of operations 31 171.9 296.8Investment in shares and participations –4.6 —Cash flow from investing activities –20.5 193.6
FINANCING ACTIVITIESChange in interest-bearing receivables –0.8 1.2Change in interest-bearing liabilities 58.6 –319.1New share issue 1.0 1.3Dividend –37.9 —Cash flow from financing activities 20.9 –316.6
Cash flow for the year 65.3 21.6
Liquid funds at the beginning of the year 188.7 172.1Translation differences in liquid funds –15.2 –5.0Liquid funds at year-end 20 238.8 188.7
GROUP CASH FLOW STATEMENTS

44
>> FINANCIAL REPORTING > FINANCIAL STATEMENTS
MSEK Note 2011 2010
Net sales 50 142.3 87.4Administrative expenses 37, 45, 47, 48, 50 –123.6 –117.0Operating profit/loss 18.7 –29.6
Financial itemsProfit/loss from participations in Group companies 38 23.8 –34.0Interest income 38 15.4 21.7Group contributions received 74.0 101.0Group contributions paid — –46.0Interest expenses 38 –20.9 –48.1Other financial expenses 38 –13.4 –32.4Total financial items 78.9 –37.8
Profit/loss after financial items 97.6 –67.4
Taxes — —Profit/loss for the year 97.6 –67.4
PARENT COMPANY STATEMENT OF COMPREHENSIVE INCOMEMSEK Note 2011 2010
Profit/loss for the year entered in the income statement 97.6 –67.4Other comprehensive income, net of tax — —Comprehensive income for the year 97.6 –67.4
PARENT COMPANY INCOME STATEMENTS
45
ASSETS, MSEK Note 2011 2010
Non-current assets
Intangible assetsOther intangible assets 39 12.1 16.3Total intangible assets 12.1 16.3
Property, plant and equipmentEquipment 40 3.7 0.6Total property, plant and equipment 3.7 0.6
Financial assetsShares in subsidiaries 41 1,838.2 1,838.2Other long-term receivables 31.5 29.1Total financial assets 1,869.7 1,867.3
Total non-current assets 1,885.5 1,884.2
Current assets
Current receivablesAccounts receivable 1.0 —Receivables from Group companies 49 679.1 674.4Other receivables 6.5 5.5Prepaid expenses and accrued income 42 3.2 4.5Total current receivables 689.8 684.4
Liquid funds 0.1 0.1
Total current assets 689.9 684.5
TOTAL ASSETS 2,575.4 2,568.7
PARENT COMPANY BALANCE SHEETS

46
>> FINANCIAL REPORTING > FINANCIAL STATEMENTS
EQUITY AND LIABILITIES, MSEK Note 2011 2010
Equity
Restricted equityShare capital (75,855,598 shares with a quota value of SEK 5) 379.3 379.3Statutory reserve 539.3 539.3Total restricted equity 918.6 918.6
Unrestricted equityShare premium reserve 439.1 438.1Retained earnings 131.2 236.5Profit/loss for the year 97.6 –67.4Total unrestricted equity 667.9 607.2
Total equity 1,586.5 1,525.8
Current liabilitiesAccounts payable 11.6 10.4Liabilities to Group companies 952.4 997.5Other liabilities 1.0 1.0Accrued expenses and deferred income 43 23.9 34.0Total current liabilities 988.9 1,042.9
TOTAL EQUITY AND LIABILITIES 2,575.4 2,568.7
Pledged assets — —Contingent liabilities 44 820.3 678.1
Parent Company Balance Sheets, cont.

47
Restricted equity Unrestricted equity
MSEK Share capitalNew share issue
in progressStatutory
reserveShare premium
reserve
Retained earn-ings and profit/loss for the year Total equity
Opening balance Jan 1, 2011 379.3 — 539.3 438.1 169.1 1,525.8
Profit/loss for the year — — — — 97.6 97.6Other comprehensive income during the year — — — — — —Comprehensive income for the year — — — — 97.6 97.6
Dividend — — — — –37.9 –37.9New share issue* — — — 1.0 — 1.0Total transactions with owners — — — 1.0 –37.9 –36.9
Closing balance Dec 31, 2011 379.3 — 539.3 439.1 228.8 1,586.5
Restricted equity Unrestricted equity
MSEK Share capitalNew share issue
in progressStatutory
reserveShare premium
reserve
Retained earn-ings and profit/loss for the year Total equity
Opening balance Jan 1, 2010 378.1 1.2 539.3 436.8 236.5 1,591.9
Profit/loss for the year — — — — –67.4 –67.4Other comprehensive income during the year — — — — — —Comprehensive income for the year — — — — –67.4 –67.4
New share issue* 1.2 –1.2 — 1.3 — 1.3Total transactions with owners 1.2 –1.2 — 1.3 — 1.3
Closing balance Dec 31, 2010 379.3 — 539.3 438.1 169.1 1,525.8
* Refers to the issue of warrants to participants in incentive programmes.
CHANGE IN PARENT COMPANY’S EQUITY

48
>> FINANCIAL REPORTING > FINANCIAL STATEMENTS
MSEK Note 2011 2010
OPERATING ACTIVITIESOperating profit/loss 18.7 –29.6Adjustment for items not included in cash flow 4.9 4.3Net financial items affecting cash flow 46 –1.0 –62.0Cash flow from operating activities before changes in working capital 22.6 –87.3
Cash flow from changes in working capitalChange in operating receivables –84.8 –2.0Change in operating liabilities –8.5 –17.9Total change in working capital –93.3 –19.9
Cash flow from operating activities –70.7 –107.2
INVESTING ACTIVITIESCapital expenditure on intangible assets 39 –0.1 –0.3Capital expenditure on property, plant and equipment 40 –3.8 –0.2Sale of property, plant and equipment 0.1 —Divestiture of subsidiaries — 200.0Cash flow from investing activities –3.8 199.5
FINANCING ACTIVITIESChange in interest-bearing receivables 100.9 109.7Change in interest-bearing liabilities –44.5 –383.0Group contributions received 101.0 186.7Group contributions paid –46.0 –7.0New share issue 1.0 1.3Dividend –37.9 —Cash flow from financing activities 74.5 –92.3
Cash flow for the year 0.0 0.0
Liquid funds at the beginning of the year 0.1 0.1Liquid funds at year-end 0.1 0.1
PARENT COMPANY CASH FLOW STATEMENTS

49
NOTES Amounts in MSEK except where otherwise stated
Note 1 General information
Gunnebo AB (publ) is a Swedish public limited company registered with the Swedish Companies Registration Office under the company registration number 556438-2629. The Board has its registered office in Göteborg Municipality in Sweden.
The Group’s main activities are described in the Board of Directors’ Report and in the notes to this Annual Report. The company’s shares are listed on the OMX Nordic Exchange’s Mid Cap list.
The consolidated accounts for the financial year ending December 31, 2011 were approved by the Board on March 2, 2012 and will be submitted to the Annual General Meeting on April 26, 2012 for adoption.
Note 2 Summary of important accounting principles
Foundations for preparing the statementsThis Annual Report has been prepared in accordance with the Swedish Annual Accounts Act and the International Financial Reporting Standards (IFRS), as adopted by the EU. The Annual Report also contains additional information in accordance with the recommendation of the Swedish Financial Reporting Board, RFR 1 Supplementary Accounting Regulations for Groups, which specifies infor-mation required in addition to the IFRS information in accordance with the pro-visions of the Swedish Annual Accounts Act.
The consolidated accounts have been prepared in accordance with the cost method, with the exception of financial instruments measured at fair value.
Reports prepared in compliance with IFRS require the use of accounting estimates. Furthermore, the management is required to make certain assess-ments upon application of the company’s accounting principles. The areas which include estimates and assessments of significant importance to the consolidated accounts are given in Note 4.
New and amended accounting principlesWith effect from January 1, 2011, Gunnebo has begun to apply a number of new standards, interpretations and amendments.
Amendments to IAS 24 Related Party Disclosures: The definition of a related party has been amended and some relaxations have been introduced regarding the disclosure requirements for companies with links to the state.
Amendment to IAS 32 Financial Instruments: Presentation: The amendment means that rights issues, for example, in foreign currencies issued to all share-holders should be classified as equity instruments.
Improvements to IFRS 2010: The IASB’s annual improvement work to simplify and clarify the International Financial Reporting Standards has resulted in amendments to several standards.
Amendment to IFRIC 14 IAS 19 The Limit on a Defined Benefit Asset, Mini-mum Funding Requirements and their Interaction: This interpretation concerns funds for securing pension commitments through a defined benefit plan and specifically how minimum funding requirements interact with IAS 19 and its cover for a defined benefit asset. As a result of the amendment, prepayments intended to cover minimum funding requirements may be recognised as an asset, which was not permitted under previous rules.
IFRIC 19 Extinguishing Financial Liabilities with Equity Instruments: IFRIC 19 addresses how a debtor shall measure equity instruments issued to extinguish a financial liability following a renegotiation of the terms of the financial liability.
The above-mentioned new amendments to standards and interpretations applied by Gunnebo as of January 1, 2011 have not had any material effect on the Group’s results and financial position.
Standards, interpretations and amendments that have been issued but have not yet come into force or been adopted by the EUOn preparing the consolidated accounts as at December 31, 2011, several standards, interpretations and amendments have been published which have not yet come into force or been adopted by the EU. The Group has still not begun to apply these new, amended standards and interpretations.
The most significant amendment for Gunnebo relates to IAS 19 Employee Benefit. The amendments to this recommendation require that actuarial gains and losses are recognised immediately via other comprehensive income, and consequently the ‘corridor approach’ applied by Gunnebo is being removed. Furthermore, the expected return on plan assets is calculated using the same discount rate used to calculate the pension commitment. This means it will no
longer be permitted to recognise expected return on plan assets based on an estimated return.
When Gunnebo begins to apply the amendments to IAS 19 in the 2013 finan-cial year, UFR 4, Reporting of special employer’s contribution and tax on returns, will no longer be applied. Instead special employer’s contribution and tax on returns will be measured in accordance with the rules of IAS 19, which means that the actuarial assumptions made when calculating defined benefit pension plans must also include the taxes levied on pension benefits.
The corporate management’s preliminary assessment is that the amend-ments to IAS 19 will result in a higher recognised pension liability. A detailed analysis of the effects of applying the amendments to IAS 19, however, has yet to be carried out and therefore the effects cannot be quantified.
Other new and amended standards and interpretations are not expected to have a material impact on the Group’s financial statements when they are applied for the first time. The corporate management is, however, assessing how IFRS 9 Financial Instruments will impact on the Group’s financial state-ments when it is applied for the first time.
Financial reportingThe consolidated accounts relate to Gunnebo AB and those companies in which the company directly or indirectly owns shares controlling more than 50% of the votes, or over which the company exercises control in some other way.
The consolidated accounts have been drawn up in accordance with the acquisition method, whereby the Group equity includes the parent company’s equity, equity in subsidiaries belonging to holdings without a controlling influ-ence at the time of acquisition, and subsidiary companies’ equity generated after acquisition.
In the case of corporate acquisitions where the sum of the purchase sum, any holdings without a controlling influence and fair value at the time of the acqui-sition of former shareholdings exceeds the fair value at the time of acquisition of identifiable acquired net assets, the difference is recognised as goodwill in the report on financial position. If the difference is negative, it is recognised as a gain on an acquisition at a low price directly as income after reviewing the difference. Intra-Group transactions and balance items as well as non-realised gains on transactions between Group companies are eliminated.
For every corporate acquisition, holdings without a controlling influence in the acquired company are measured either at fair value, or at the value of the percentage of the holding without a controlling influence of the acquired com-pany’s identifiable net assets.
With gradual acquisitions, the former equity percentages in the acquired company are re-measured at their fair value at the time of acquisition (i.e. when a controlling influence is obtained). Any gain or loss is reported as income.
Accounting treatment of associated companiesIn the accounts, associated companies are companies that are not subsidiaries but in which Gunnebo has a significant but not controlling influence, which generally entails a shareholding or participation corresponding to between 20% and 50% of the number of votes. Shareholdings in associated companies are rec-ognised using the equity interest method. This means that the cost of shares, adjusted to take into account the Group’s share of the associated companies’ result, is entered in the Group’s balance sheet, under financial assets, after deduction for dividend received. The Group’s share of the associated company’s result after tax is recognised in the income statement under Share of profit of associated companies. The Group’s carrying amount for holdings in associated companies includes goodwill as identified on acquisition, net of write-downs.
Translation of foreign currenciesa) Functional currency and presentation currencyItems in the financial statements for the various Group units are measured in the currency used in the economic environment in which each company primarily operates (functional currency). In the consolidated accounts the Swedish krona is used, which is the parent company’s functional and presentation currency.
b) Transactions and balance sheet itemsTransactions in foreign currencies are translated into the functional currency using the exchange rates in force on the transaction date. Exchange rate gains and losses arising upon payment of such transactions and upon translating monetary assets and liabilities in foreign currencies at the closing day exchange rate are recognised in the income statement. The exceptions are transactions comprising hedges which fulfil the conditions for hedge reporting of cash flows or net investments, whereby gains/losses are recognised in other comprehen-

50
>> FINANCIAL REPORTING > NOTES
sive income. The equivalent also applies for monetary items which form part of a net investment in a foreign operation.
c) Group companiesThe income statement and balance sheet of all Group companies with a func-tional currency different to the presentation currency are retranslated into the Group’s presentation currency as follows:
(i) assets and liabilities for each of the balance sheets are translated at the closing day rate;
(ii) income and expenses for each of the income statements and statements of comprehensive income are translated at the average exchange rate (provided this average exchange rate is a reasonable approximation of the accumulated effect of the rates in effect on the transaction date, other-wise income and expenses are translated on the transaction date);
(iii) all currency differences which arise are recognised in other comprehensive income. Upon consolidation, currency differences which arise as a result of translating net investments in foreign operations and of borrowing and other currency instruments identified as hedges of such investments, are recognised in other comprehensive income. On divestment of a foreign operation, such currency differences are recognised in the income state-ment along with the gain/loss entailed by the transaction. Goodwill and adjustments of fair value arising upon acquisition of a foreign operation are treated as assets and liabilities in the operation in question, and are translated at the closing day rate.
Discontinued operationsA discontinued operation is a part of a company that has either been divested or is classified as being held for sale and constitutes a considerable, independent business line or an operation run within a geographical region. The profit for a discontinued operation is recognised separately from continuing operations in the income statement.
The divestments of Perimeter Protection in 2011 and Gunnebo Troax in 2010 have been recognised as discontinued operations. In the consolidated income statement the profit from discontinued operations is reported separately under “Profit for the year from discontinued operations”.
This means that income and costs for the discontinued operations have been excluded from other income statement items for all reported periods.
In the consolidated cash flow statement the discontinued operations have not been separated in the corresponding way. Information about cash flows for dis-continued operations is instead reported in Note 31. The balance sheet only includes the assets and liabilities that remain in the Group after the divestments.
Derivative instrumentsThe Group applies accounting standard IAS 39, Financial Instruments: Recogni-tion and Measurement. This means that all derivative instruments are recog-nised in the balance sheet at fair value. Changes in value relating to derivative instruments are recognised in the income statement except where the deriva-tive instrument is a hedging instrument in a cash flow hedge or in a hedge of a net investment in a foreign company. In these cases the effective portion of the change in value regarding the derivative instrument is recognised via other com-prehensive income and is accumulated under equity until the point where the hedged transaction has an effect on profit. With regard to the derivative instru-ments relating to hedging of fair value, the changes in value both from deriva-tive instruments and the hedged item are recognised in the income statement, where they neutralise one another to the extent that the hedge is effective.
Other long-term receivablesAssets in this category mainly comprise long-term financial receivables and they are initially recognised at fair value including transaction costs. After that they are recognised at accrued cost with the application of the effective interest method.
InventoriesInventories are measured at the lower of cost and net selling price in accordance with the first-in first-out principle (FIFO). The value of inventories includes an attributable share of indirect costs.
Accounts receivableA reserve for doubtful receivables is made when it is likely that the Group will not receive the amounts due in accordance with the receivables’ original terms. The size of the reserve comprises the difference between the assets’ carrying amount and the present value of assessed future cash flows.
Liquid fundsLiquid funds include cash, bank deposits and other short-term investments which mature within three months of the date of acquisition.
Income taxThe stated income tax comprises tax that is to be paid or received for the finan-cial year in question, adjustments to previous years’ taxes and changes in deferred tax. All tax liabilities and assets are measured at nominal amounts in accordance with the tax rules and at the tax rates that have been decided or announced and will almost certainly be approved.
Tax effects relating to items in the income statement are also recognised in the income statement. The tax effects of items recognised under other compre-hensive income are reported under other comprehensive income and accumu-lated under equity. Deferred tax is calculated based on the difference between the tax written-down value and the carrying amount of assets and liabilities (temporary differences), and on tax loss carry-forwards. Deferred tax is also calculated on the basis of the unrealised result of loans and forward contracts entered into to hedge the net assets of foreign subsidiaries. The change in the item is recognised under other comprehensive income and accumulated under equity. Deferred tax assets attributable to loss carry-forwards are only recognised if it is probable that the loss carry-forward can be netted against a surplus in future taxation.
Pension commitmentsIAS 19 is applied in Gunnebo’s reporting of pensions, healthcare benefits and other employee benefits after the period of employment. The recommendation makes a distinction between defined contribution and defined benefit pension plans. Defined contribution pension plans are defined as plans where the com-pany makes pre-determined payments to a third party and has no other obliga-tion once the premiums have been paid. Such plans are recognised as costs when the premiums are paid. Other plans are defined benefit plans in which the obligations remain within the Group. These obligations and costs regarding employment during the current period are based on actuarial calculations in accordance with the projected unit credit method. External actuaries are engaged for these calculations. The actuarial assumptions used to calculate the obligations and costs vary with the economic factors that reflect conditions in the countries where the defined benefit plans are located.
The Group’s defined benefit plans are either non-funded or funded externally. Provisions for non-funded plans in the balance sheet comprise the present value of the defined benefit obligations adjusted for the unrecognised actuarial gains and losses and the unrecognised costs for employment during earlier periods.
As regards the funded plans, the plan assets of the plans are separated from the Group’s assets in externally managed funds. Liabilities or assets recognised in the balance sheet relating to funded plans represent the amount by which the market value of the plan assets exceeds or falls short of the present value of the defined benefit obligations, adjusted for unrecognised actuarial gains or losses and costs relating to employment during earlier periods. However, a net asset is only recognised to the extent that it represents future financial benefits which the Group can utilise, for example in the form of reduced contributions in the future or repayment of funds paid into the plan. When it is not possible to utilise such surpluses, they are not recognised but presented in the notes.
Actuarial gains or losses arise in the event of changes in actuarial assump-tions and differences between actuarial assumptions and the outcome in real-ity. The part of the accumulated actuarial gains and losses exceeding 10% of the higher of the obligations’ present value and the plan assets’ market value at the end of the previous year, is recognised in the figure for the expected average remaining period of employment for the employees covered by the plan. For all defined benefit plans, the actuarial costs, which burden the result, comprise the cost regarding employment during the current period, interest cost, expected return on plan assets (funded plans only), cost regarding employment during previous periods and any amortisation of actuarial gains or losses. The cost of employment during previous periods, which refers to changes in pension terms, is realised once these changes have become vested or is amortised during the period until this happens.
Some of the plans for supplementary pensions for salaried employees in Sweden are financed through insurance premiums paid to Alecta/Collectum. This arrangement constitutes a defined benefit plan encompassing several employers. Alecta is currently unable to provide the information required to report the plan as a defined benefit plan. Consequently, supplementary pensions for salaried employees insured with Alecta are stated as defined contribution plans.
Note 2, cont.

51
ProvisionsLiabilities that are uncertain in terms of amount or when they will be settled are entered as provisions. It must also be considered likely that an outflow of resources will be required in order to service the commitment and that the amount can be reliably estimated. Provisions for restructuring expenses include costs for terminating lease agreements and severance pay and are recognised when the Group has a definite detailed restructuring plan which it has made known to interested parties. Provisions for legal requirements are estimates of the future cash flows required in order to settle obligations. These estimates are based on the nature of the legal proceedings and take into account the assess-ments and opinions of legal advisers with regard to their outcome. Provisions to cover guarantee costs are estimates of warranty claims made and have been estimated using statistics for previous claims, the expected costs of measures and the average time interval between the occurrence of a fault and a claim being made against the company.
Accounting treatment of revenueRevenue from the sale of goods and services is stated when an agreement has been reached with a customer and the products have been delivered or the services provided and when all significant risks have transferred to the cus-tomer. Revenue is stated net after value added tax (VAT), discounts and returns. Intra-Group sales are eliminated in the Group. Income for major ongoing projects of long duration on behalf of outside parties is recognised on the basis of the degree of completion, which is determined by comparing costs incurred on the closing date with the estimated total cost.
Other operating incomeOther operating income mainly comprises income in the form of royalties, rent, capital gains on sales of non-current assets, and currency gains on receivables and liabilities that are operational in character.
GoodwillIn the case of corporate acquisitions where the sum of the purchase sum, any holdings without a controlling influence and fair value at the time of the acqui-sition of former shareholdings exceeds the fair value at the time of acquisition of identifiable acquired net assets, the difference is recognised as goodwill in the report on financial position. If the difference is negative, it is recognised as a gain on an acquisition at a low price directly as income after reviewing the dif-ference. Goodwill has an indefinite economic life and is recognised at cost less accumulated write-downs. When a business is sold, goodwill related to this business is recognised in the capital gain/loss calculation.
Other intangible assetsOther intangible assets are primarily product development costs and the costs of purchasing and developing software. Internally developed intangible assets are only recognised as assets if an identifiable asset has been created, it is likely that the asset will generate future financial benefits and the cost of developing the asset can be calculated in a reliable way. If it is not possible to recognise an internally developed intangible asset, the development costs are recognised as a cost in the period in which they arise.
Expenditure on product developmentExpenditure on development projects is capitalised under intangible assets to the extent it is expected to generate economic benefits in the future. Other development expenditure is expensed in the income statement as it is incurred and is included in cost of goods sold. Development expenditure previously stated as a cost in the income statement is not capitalised as an asset in later periods. Capitalised development expenditure is written off linearly over the estimated economic life of 3–5 years.
Expenditure on softwareExpenditure on software is capitalised as an asset if it is likely to have economic benefits in excess of the cost after one year. Other software is recognised as a cost. Capitalised expenditure on purchasing and developing software is written off linearly over the estimated economic life of 3–5 years.
Property, plant and equipmentProperty, plant and equipment are recognised at cost less accumulated deprecia-tion and any write-down. The cost includes expenses directly attributable to bring-ing the asset to the location and into the condition required for it to be used for its
intended purpose. Costs for improvements to the asset’s performance increase the asset’s carrying amount if the investment is expected to generate economic bene-fits. Expenditure on repairs and maintenance is recognised as costs.
Property, plant and equipment are depreciated linearly over the asset’s expected useful life down to the asset’s estimated residual value. In instances where property, plant and equipment comprise elements with different useful lives, each part is treated as a separate component with regard to depreciation.
The following useful lives are used for calculating scheduled depreciation:Vehicles 5 yearsComputers 3–5 yearsMachinery and other equipment 5–15 yearsBuildings and land 20–50 years
Write-downsOn the occasion of each report, an assessment is made as to whether there is any indication of a reduction in the value of the Group’s assets.
If this is the case, an estimate is made of the asset’s recoverable amount. Goodwill has been allocated to the smallest cash-generating units and is subject to annual write-down reviews even if there is no indication of a reduction in value. The need for write-down is reviewed more often, however, if there are indications of a reduction in value. The recoverable amount is calculated as the higher of the value in use of the asset in the business and the net selling price. The value in use consists of the present value of all income and payments attrib-utable to the asset during the period it is expected to be used in the business plus the present value of the net selling price at the end of its useful life. If the recov-erable amount calculated is less than the carrying amount, the asset is written down to its recoverable amount. A previous write-down is reversed if there has been a change in the assumptions that formed the basis for determining the asset’s recoverable amount when it was written down and which mean that the write-down is no longer considered necessary. The reversal of previous write-downs is reviewed on an individual basis and is recognised in the income state-ment. Write-downs of goodwill may not be reversed in any subsequent period.
BorrowingsBorrowing is initially recognised at fair value after transaction costs. Subse-quently, borrowing is recognised at accrued cost and any difference between the amount received and the repayment amount is recognised in the income statement, distributed across the loan period, with the application of the effec-tive interest method.
LeasingWhen a lease contract means that the financial benefits are, in all essentials, passed on to the Group, as the lessee, and the Group bears the economic risks attributable to the leased object (known as financial leasing), the object is recog-nised as a non-current asset in the consolidated balance sheet. The correspond-ing undertaking to pay leasing charges in the future is recognised as a liability.
Leasing where a significant portion of the risks and benefits of ownership are retained by the lessor is classified as operational leasing. Payments made during the lease term are expensed systematically over the term of the lease.
Share-based payments to employeesThe Group has applied IFRS 2 to a share-based payment scheme which finished in 2011. As a result of national adaptations, the scheme was divided into two different structures. Instruments issued were shares, employee stock options and warrants. Shares and warrants were issued at market price, while employee stock options were allocated to the participants free of charge. The total amount expensed for employee stock options during the earning period is based on the fair value of the allocated options, excluding the effects on earn-ings of non-market-related conditions. These conditions have instead been taken into account in the assumptions for the number of options expected to be earned. On every closing date, the assessments of the number of options expected to be earned have been reviewed and deviations from earlier assess-ments recognised in the income statement.
In addition to this, the Group has made provisions for social security charges for schemes based on the estimated benefit value for the participants.
Reporting by segmentAn operating segment is a part of a company that engages in business activities from which it may earn revenues and incur expenses, whose operating results are reviewed regularly by the company’s chief operating decision-maker and for

52
>> FINANCIAL REPORTING > NOTES
which discrete financial information is available. Gunnebo’s reporting of operat-ing segments agrees with internal reporting to the chief operating decision-maker and the definition of operating segment is also based on the manage-ment’s decision to organise the Group based on products and services that differ as regards the risks they are subject to and the income they earn. With effect from January 1, 2011, the Group’s Business Areas constitute operating segments. The Business Areas are consolidated using the same principles that apply for the Group as a whole and disclosures regarding the year 2010 have been recalculated in accordance with the new segment-based division.
EquityTransaction costs that can be directly attributed to the issue of new shares or options are recognised, net of tax, in equity as a reduction in the issue amount. Expenses for buying back treasury shares reduce retained earnings. If these shares are later divested, the sale amount is recognised as an increase in retained earnings.
PARENT COMPANY’S ACCOUNTING PRINCIPLESThe parent company has drawn up its Annual Report in accordance with the Annual Accounts Act and the recommendation of the Swedish Financial Report-ing Board, RFR 2 Accounting for Legal Entities, as well as the applicable state-ments of the Swedish Financial Reporting Board. RFR 2 means that in its annual report for the legal entity, the parent company applies all IFRS and statements approved by the EU as far as possible, within the framework of the Annual Accounts Act and the Act on Safeguarding Pension Obligations with regard to the relationship between accounting and taxation.
The parent company mainly applies the principles described above in relation to the Group. The differences between the accounting principles of the Group and the parent company are described below.
New and amended accounting principlesThe amendments to RFR 2 which have come into effect and apply for the 2011 financial year have resulted in the withdrawal of UFR 2 Group contributions and shareholders’ contributions. As a result of the new rules a Group contribution from a subsidiary received by the parent company shall be recognised according to the same principles as a dividend received. This means that a Group contribu-tion received is recognised as financial income in the income statement rather than as before directly in equity. Group contributions paid by the parent com-pany to subsidiaries are recognised either as an increase in the carrying amount of the participations in the receiving subsidiary or in the income statement in accordance with a voluntary exception introduced by the Swedish Financial Reporting Board. Gunnebo has chosen to apply this exception, which means a Group contribution paid by the parent company is recognised as a financial expense in the income statement.
The amendment to RFR 2 regarding Group contributions has not had any effect on the parent company’s equity but it has resulted in the income state-ment for 2010 being recalculated according to the new principles. Group contri-butions received totalling MSEK 74.0 (101.0) and Group contributions paid total-ling MSEK 0.0 (46.0) have been recognised as financial income and a financial expense respectively in the income statement. Under previous rules they would have been recognised directly in equity.
Other amendments to RFR 2 have not had a material effect on the parent company’s financial reports.
Shares in subsidiariesShares in subsidiaries are measured at cost less any write-down. Acquisition costs are included in the cost.
PensionsThe parent company’s pension commitments have been calculated and recog-nised on the basis of the Act on Safeguarding Pension Obligations. The application of the Act on Safeguarding Pension Obligations is a condition of tax relief law.
NOTES – GROUP
Note 3 Financial risk management and financial instruments
Financial risk management The financial activities are carried out in accordance with the finance policy established by the Board, which regulates how financial risks are to be managed and the limits within which the internal bank and Gunnebo’s subsidiaries may operate.
Objective and policy for risk management Financing risk Financing risk refers to the risk that financing of the Group’s capital requirement and refinancing of its outstanding borrowing are rendered more difficult or more expensive. In order to limit the financing risk, the Group’s finance policy stipulates that the total outstanding volume of borrowing must be covered by long-term credit facilities of at least 12 months at any given time.
Interest rate risk The interest rate risk refers to the negative effect on the Group’s income and cash flow of a lasting change in market interest rates. The sensitivity of the result can, however, be limited in the short term by the selected interest matu-rity structure. According to the finance policy, the average duration of the Group’s fixed interest rate period can be 0 to 12 months.
Liquidity risk Liquidity risk refers to the risk of not having access to liquid funds or undrawn lines of credit in order to fulfil payment obligations. The finance policy stipu-lates that liquid funds and unused lines of credit shall always amount to a mini-mum of MSEK 350.
Liquidity in the Group shall be deposited with the internal bank or in local cash pools. Gunnebo has centralised its liquidity management in cash pools in the main European countries where it operates. The Group uses these cash pools to match the local subsidiaries’ surpluses and deficits in each country and currency. Because the Group is a net borrower, the surplus liquidity is used to pay installments on external liabilities.
Currency risk Gunnebo’s accounts are prepared in Swedish kronor, but the Group has opera-tions in a large number of countries worldwide. Consequently, the Group is exposed to currency risks. In order to manage these risks, the Group can hedge its currency risks within the framework of the finance policy.
Transaction exposure
Gunnebo has export income and import costs in several currencies and is there-fore exposed to exchange rate fluctuations. This currency risk is called transac-tion exposure and has an impact on the Group’s operating result. In accordance with the finance policy, Gunnebo does not ordinarily hedge transaction expo-sure. Hedging may, however, be carried out for large projects and for a large, stable currency flow, provided the exposure is deemed considerable and the hedging can be entered into at a reasonable cost. Any hedging should not usu-ally be done with a time horizon longer than 12 months.
Translation exposure (net investments)
On consolidation, the net assets of foreign subsidiaries are translated to Swed-ish kronor, which can result in translation differences. In order to limit the nega-tive effects of translation differences on Group equity, hedging may take place through borrowing and currency derivative contracts, provided the exposure is deemed considerable and the hedging can be entered into at a reasonable cost.
Translation exposure (income statement) Exchange rate fluctuations also affect Group results when income statements of foreign subsidiaries are translated into Swedish kronor. Expected future profit/loss in foreign subsidiaries is not hedged.
Note 2, cont.

53
Credit risk Financial credit risk
Credit risk refers to the risk of a loss if the counterparty fails to fulfil its obliga-tions. Exposure arises both when investing surplus liquidity and in receivables from banks which arise via derivative instruments. Gunnebo’s finance policy includes a special list of permitted counterparties and maximum credit expo-sure with each approved counterparty. Gunnebo has also entered into general agreements (ISDAs) with all of its counterparties for transactions in derivative instruments.
Liquid funds shall primarily be used to reduce outstanding liabilities, in order to limit the volume of outstanding surplus liquidity.
Customer credit risk
Gunnebo has formulated a credit policy regulating the management of cus-tomer credit, which partly encompasses decision-making levels for granting credit limits. Each subsidiary is responsible for checking and controlling credit risk with customers, within given frameworks. The rules applicable for issuing credit locally are documented in a local credit policy regulating credit limits, terms of payment and collection procedures.
The Group’s maximum exposure to credit risk is equivalent to the book val-ues of financial assets, as shown in the table below.
2011 2010
Long-term receivables 105.0 35.0 Accounts receivable 1,005.6 1,066.0 Other receivables 130.0 83.0Liquid funds 238.8 188.7Maximum exposure to credit risk 1,479.4 1,372.7
Financial instruments – Risk management during the year Interest-bearing liabilities Gunnebo had credit facilities totalling MSEK 1,717 at the end of the year, of which MSEK 642 was drawn.
During the third quarter of 2011 Gunnebo agreed on a renewed credit frame-work of MEUR 140. The new borrowing facility became available in July 2011 and replaced credit facilities of MEUR 180. The average duration of the agreed credit facilities was 2.5 years.
The long-term credit facilities mainly comprise of bilateral loans of MEUR 140 which fall due in July 2014. Furthermore, the Group has approximately MSEK 440 in primarily short-term credit facilities and external local financing in subsidiaries. The reason for individual subsidiaries having external financing is that taxes and other regulations in certain countries make it unfavourable to take up loans from foreign Group companies.
Loan maturity structure
Credit facility Of which drawn
2012 437 782013 6 62014 1,274 5582015 — —2016 and later — —Total 1,717 642
Interest rate riskAt the end of the year, Gunnebo’s loan portfolio had an average fixed interest term* of 4 (9) months, and the average rate of interest on the loan portfolio* was 2.7% (4.0%). Given the same borrowing liability and the same fixed interest terms as at the end of the year, a one percentage point change in the market interest rate would change the Group’s interest cost by approximately MSEK 4 on an annual basis.
A one percentage point change in the market interest rate would also result in a change in the market value of outstanding interest derivatives of approxi-mately MSEK 5, which affects other comprehensive income.
* Including margins and interest rate derivatives related to the loan portfolio through hedge accounting.
Currency risksExchange rate effects have influenced operating profit by approximately MSEK –34 in total.
Transaction exposureThe forecast commercial currency flow after net calculations of opposite flows in the same currencies amounts to MSEK 595 on an annual basis. On the closing day, the proportion of this flow hedged was 15% (55%). Forward contracts that matured during the year had a positive effect of MSEK 2.8 (31) on the result, when compared with the conversion of currency flows at the spot rates prevail-ing at the time of conversion. Total outstanding forward cover at the year-end was nominally MSEK 88.6. Forward cover is effective and recognised at fair value excluding hedging premiums/discounts in other comprehensive income and accumulated under equity. The market value of forward cover is MSEK 0.6. All outstanding contracts mature during 2012. The accumulated amount in equity is reversed to the income statement at the point the hedged item affects the income statement.
A change of 10% in the value of the euro, US dollar and pound sterling would affect operating profit by a total of approximately MSEK 19, of which MSEK 2 would be transaction exposure, without taking the Group’s forward cover into account. The remaining MSEK 17 is attributable to translation exposure.
Transaction exposureThe table below shows how outstanding forward cover on the closing date matures in 2012.
EUR/SEK
Other currency pairings
Currency flow hedging VolumeExchange
rate Volume
Quarter 1 3,000 9.13 10,734Quarter 2 3,000 9.12 10,734 Quarter 3 — — 8,945Quarter 4 — — 4,472Total 6,000 9.12 34,885
Exchange rate Dec 31, 2011 8.94Unrealised profit reported in the hedging reserve (MSEK) 0.3 0.1
The volume is expressed in thousands in the local currency for EUR, and volumes in other currencies are given in SEK thousands.
Translation exposureThe net assets of foreign subsidiaries amounted to MSEK 2,539 (2,294) on December 31, 2011. The Group hedges a proportion of these assets through loans and forward contracts in corresponding currencies. This hedging includes the tax effect.
Accounting treatment of derivative instruments and hedgesDerivative instruments are reported in the balance sheet on the contract date at fair value, both initially and upon subsequent revaluations. The method for reporting the gain or loss arising upon revaluation depends on whether the derivative is identified as a hedging instrument and, if that is the case, the nature of the item being hedged. The Group identifies derivatives as: (1) a hedge of fair value of an identified asset or liability or a firm commitment (fair value hedge); (2) a hedge of a highly probable forecast transaction (cash flow hedge); or (3) a hedge of a net investment in a foreign operation (net investment hedge). When the transaction is entered into, the relationship between the hedging instrument and the hedged item is documented, as is the aim of the risk management and the strategy for taking various hedging measures. The Group documents at the beginning of the hedge and continuously thereafter whether the derivative instruments used in the hedging transactions are effec-tive in evening out changes in the fair value or cash flow of hedged items.
Information about the fair value for derivative instruments used for hedging is provided in a summary on page 55.

54
>> FINANCIAL REPORTING > NOTES
Liquidity risk The contracted maturity dates for the Group’s financial instruments are shown below. The amounts are nominal and include interest payments.
Financial assets and liabilitiesLess than 6 months
6–12 months
1–2 years
2–3 years
2–6 years
Total contracted
cash flow
Long-term financial receivables — 14 66 — 66 146Current financial receivables 25 — — — — 25Accounts receivable 1,006 — — — 1,006Liquid funds 239 — — — — 239Bank loans and overdraft facilities –651 –8 –17 –17 –693Accounts payable –539 — — — –539
Derivatives - Interest-rate swap agreements outflow –5 –2 –3 –1 –11
inflow 3 2 3 1 9 - Currency forward contracts included in hedge accounting outflow –693 –13 — — –706
inflow 730 13 — — 743 - Currency forward contracts not included in hedge accounting outflow –589 — — — –589
inflow 599 — — — 599Total 125 6 49 –17 66 229
For financial liabilities with a long contracted term but a short/variable fixed interest, the variable interest has been adopted as the quoted interbank rate as at December 31, 2011. The base currency of the currency forward contract has been re-measured at the applicable closing rate as at December 31, 2011 while the future flow of the other currency is measured at the con-tracted rate.
Hedge accountingFair value hedgeChanges in the fair value of derivatives which are identified as fair value hedges and which fulfil the terms of hedge accounting are reported in the income statement together with changes in fair value of the asset or liability which has given rise to the hedged risk.
Cash flow hedgeThe effective portion of changes in fair value of derivative instruments which have been identified as cash flow hedges and which fulfil the terms of hedge accounting are recognised via other comprehensive income and accumulated under equity. The gain or loss attributable to the ineffective portion is reported directly in the income statement.
Accumulated amounts in equity are reversed to the income statement in the periods during which the hedged item affects the result (for example when the forecast hedged sale takes place).
When a hedging instrument expires or is sold or when the hedge no longer fulfils the terms of hedge accounting and there are accumulated gains or losses regarding the hedge in equity, these gains/losses remain in equity until the forecast transaction is finally reported in the income statement. When a fore-cast transaction is no longer expected to take place, the accumulated gain or loss recognised in equity is immediately transferred to the income statement.
Hedging of net investments in foreign operationsNet investment hedges in foreign operations are reported in a similar way to cash flow hedges. Gains or losses regarding hedging instruments relating to the effective portion of hedging are recognised via other comprehensive income and accumulated under equity, and gains or losses attributable to the ineffec-tive portion are recognised in the income statement. Accumulated gains and losses in equity are recognised in the income statement when the foreign oper-ation is sold.
Receivables and liabilities in foreign currenciesCurrency forward contracts are used to hedge receivables and liabilities in for-eign currencies. To protect against such currency risks, hedge accounting is not applied since a financial hedge is reflected in the accounts in that both the hedged item and the hedging instrument are recognised at the exchange rate on the closing day, and that exchange rate fluctuations are recognised in the income statement.
Note 3, cont.
Interest-rate swapsThe nominal value of outstanding interest-rate swap agreements relating to cash flow hedges amounted to MSEK 443 on December 31, 2011. There were no interest-rate swap agreements relating to fair value hedges on the closing date.
Currency forward contracts – transaction exposureOutstanding currency forward contracts relating to cash flow hedges mature during 2012. The accumulated amount in equity is reversed to the income state-ment at the point the hedged item affects the income statement.
Derivative instruments
Nominal amounts 2011 2010
Interest-rate swap agreementsTerm of less than 1 year 219 90Term 1–2 years 45 221Term 2–5 years 179 —Interest-rate swap agreements total 443 311
Currency forward contracts* 1,343 1,859Total 1,786 2,170
* Gross amount calculated at future forward rate.
The capital structure of the Group One of Gunnebo’s long-term financial goals is to have an equity ratio of no less than 30%. The equity ratio at the end of the year was 45% (43%). Another of Gunnebo’s aims is to achieve a return of 15% at least on capital employed. The return on capital employed for 2011 was 13.5%.
Gunnebo’s borrowing is mostly unsecured. Borrowing is limited, however, by financial obligations in the loan agreements in the form of covenants*. These mainly relate to the key ratios of interest coverage ratio and net debt/EBITDA. With regard to the prevailing terms in the loan agreements, available credit facilities amounted to MSEK 1,075 at the end of the year.
* During 2011 all financial commitments in the form of covenants were fulfilled.

55
MEASUREMENT AT FAIR VALUEThe carrying amounts and fair values of the Group’s financial instruments are shown in the table below.
Financial instruments measured at fair value For all assets and liabilities measured at fair value, which comprise of derivative instruments, the fair value has been established based on measurement tech-niques which are, in all essentials, based on observable market data. According to the fair value hierarchy of IFRS 7, such measurement methods are referred to as Level 2*.
The table below presents the assets and liabilities measured at fair value.
Other financial instruments The carrying amount of interest-bearing assets and liabilities in the balance sheet can deviate from their fair value, as a result of changes to market interest rates among other things. The fair value has been calculated by discounting future payment flows at current interest rates and exchange rates for equiva-lent instruments.
For financial instruments such as accounts receivable, accounts payable and other non-interest-bearing financial assets and liabilities, which are recognised at accrued cost less any write-down, the fair value is deemed to be the same as the carrying amount due to the short anticipated duration.
The Group’s long-term borrowing primarily relates to long-term credit facili-ties but with short fixed interest rate periods. The fair value is therefore deemed to be the same as the carrying amount.
* In IFRS 7, financial instruments are classified in a hierarchy of three levels, based on the information used to establish the fair value. Level 1 refers to fair values based on quoted prices on an active market for similar financial assets and liabilities. Level 2 refers to fair values established based on directly observable market inputs other than Level 1 inputs. Level 3 refers to fair values based on valuation models with inputs not based on observ-able market data.
2011 2010
Financial assets Carrying amount Fair value Carrying amount Fair value
Financial assets measured at fair value* 48.6 48.6 18.6 18.6 - of which derivatives for which hedge accounting does not apply 10.5 10.5 12.8 12.8 - of which interest-rate swap agreements for which hedge accounting at fair value applies — — — — - of which currency derivatives regarding commercial exposure for which hedge accounting of cash flows applies 0.9 0.9 4.9 4.9 - of which currency derivatives for hedging net investment abroad 37.2 37.2 0.9 0.9Other financial liabilities** 1,374.4 1,374.4 1,289.8 1,289.8Total financial assets 1,423.0 1,423.0 1,308.4 1,308.4
Financial liabilitiesFinancial liabilities measured at fair value*** 3.8 3.8 30.4 30.4 - of which derivatives for which hedge accounting does not apply 0.7 0.7 3.3 3.3 - of which interest-rate swap agreements for which hedge
accounting of cash flows applies 2.7 2.7 5.9 5.9 - of which currency derivatives regarding commercial exposure
for which hedge accounting of cash flows applies 0.3 0.3 1.1 1.1 - of which currency derivatives for hedging net investment abroad 0.1 0.1 20.1 20.1Other financial liabilities**** 1,181.0 1,181.0 1,066.4 1,066.4 - of which financial liabilities for which hedge accounting does not apply 738.0 738.0 755.4 755.4 - of which financial liabilities for which hedge accounting of cash flows applies 443.0 443.0 311.0 311.0 - of which financial liabilities for which hedge accounting at fair value applies — — — —Total financial liabilities 1,184.8 1,184.8 1,096.8 1,096.8
* These assets are recognised as other current receivables in the consolidated balance sheet.
** These assets are recognised as other long-term and current receivables, accounts receiv-able and liquid funds in the consolidated balance sheet.
*** These liabilities are recognised as other current liabilities in the consolidated balance sheet.
**** These liabilities are recognised as accounts payable as well as short-term and long-term borrowing.

56
>> FINANCIAL REPORTING > NOTES
Note 4 Critical accounting estimates and assessments
When drawing up the annual report in accordance with IFRS and good account-ing practice, the Group has made estimates and assumptions about the future which affect the carrying amounts of assets and liabilities. These estimates and assessments are continuously evaluated and are based on historical experience and other factors considered reasonable under the prevailing conditions. Where it is not possible to establish the carrying amount of assets and liabilities using information from other sources, these estimates and assumptions are used as the basis for valuations. Different assumptions and estimates may give different results and the predicted outcome will rarely correspond exactly to the actual result. The assumptions and estimates considered to have the greatest impact on Gunnebo’s financial position and results are discussed below.
Review of write-down requirement for goodwillThe Group conducts a write-down review each year to assess whether there is a write-down requirement for goodwill, in accordance with the accounting princi-ples described in Note 2 above. The review requires an estimate of the parame-ters affecting future cash flow as well as the specification of a discounting fac-tor. The recoverable amounts for cash-generating units have then been established by calculating value in use. Note 14 contains details of the impor-tant assumptions made when reviewing the goodwill write-down requirement, as well as a description of the effect of possible changes to the assumptions that form the basis of the calculations. As at December 31, 2011, the carrying amount of goodwill in the Group was MSEK 1,104.
Valuation of deferred tax assetsDeferred tax assets relating to temporary differences of MSEK 217 have been entered in the Group based on the assessment that it is likely they will be able to be utilised and that they will entail lower tax payments in the future.
Furthermore, deferred tax assets reported in relation to loss carry-forward were MSEK 35 as at December 31, 2011. The carrying amount of these tax assets has been reviewed on the closing date and it has been considered likely that the deduction can be used against a surplus in future taxation. The greater part of the tax assets relate to countries with an unlimited period in which the loss carry-forwards can be used. The Group’s business in these countries is either profitable or is expected to generate a surplus in the future. Gunnebo therefore believes that there are major factors to indicate that it will be possible to utilise the loss carry-forwards to which the tax assets can be attributed against future taxable surpluses.
Furthermore, at December 31, 2011 the Group had unused loss carry- forwards and other deductible temporary differences totalling just over MSEK 700, for which no deferred tax assets were recognised.
Changes to the above assumptions and assessments may result in significant differences in the valuation of deferred tax assets.
Guarantee commitmentsMany of the products sold by Gunnebo are covered by guarantees that apply for a period specified in advance. Provisions for these product guarantees are based on historical data and on the expected costs of quality issues that are known or can be predicted. Provisions are also made for guarantees of a goodwill nature and extended guarantees. Total provisions for guarantees were MSEK 38 on December 31, 2011. Even though changes to the assumptions may result in dif-ferent valuations, it is considered unlikely that these will have a significant effect on the Group’s profits or financial position.
Capitalised product development costsExpenditure on development projects is capitalised to the extent it is expected to generate economic benefits. Capitalisation begins when the management considers that the product will be technically or economically sound. This means that specific criteria must be met before a development project can be capitalised as an intangible asset. Capitalisation ends and depreciation of the capitalised development expenditure begins when the product is ready for sale. Capitalised development costs are subject to write-down review when there is any indication of a reduction in value. The management decides on the depreci-ation period as well as the write-down requirement review. On December 31, 2011, the Group’s capitalised development costs were MSEK 59.
DisputesProvisions for disputes are estimates of the future cash flows required in order to settle obligations. Disputes mainly relate to contractual obligations attribut-able to contracts with customers and suppliers, but other kinds of dispute may arise in the normal course of business. The outcome of complex disputes can be difficult to predict and the disputes can be both time-consuming and costly. It cannot therefore be ruled out that an unfavourable outcome in a dispute may have a significant effect on the Group’s profits and financial position. The man-agement considers it unlikely, however, that any disputes of which it is currently aware in which Gunnebo is involved will have a significant effect on the Group’s accounts. The Group’s provisions for disputes was MSEK 23 at the closing date.
Remuneration after the end of employmentReporting of provisions for defined benefit pension plans and other pension benefits are based on actuarial calculations using the assumptions for discount rates, expected return on plan assets, future salary increases, personnel turn-over and demographic conditions.
The assessments made in relation to these assumptions affect the total value of the pension commitments and major changes in these assessments could have a significant impact on the Group’s profits and financial position. The same is true of any changed assessment in relation to whether or not pension insur-ance with Alecta should be recognised as a defined contribution plan. On December 31, 2011, the Group’s provisions for pensions were MSEK 199 net.
Obsolescence reserveInventory is measured at the lower of cost and net selling price in accordance with the first-in first-out principle (FIFO). The value of inventory is adjusted by an estimated reduction in value for physical damage, discontinued items, over-dimensioned stock and other forms of obsolescence.
In 2011 the Group initiated a programme to increase the rate of capital turn-over in inventory, and as a result of the programme activities have been carried out with the aim of selling and disposing of products that have been written down. Consequently, some assumptions which form the basis for calculating a provision for obsolescence in inventories have been adjusted, and this has resulted in the reversal of MSEK 25 against “Cost of goods sold” in the income statement.
Accounts receivableA reserve for doubtful receivables is made when it is likely that the Group will not receive the amounts due in accordance with the receivables’ original terms. The size of the reserve comprises the difference between the assets’ carrying amount and the present value of assessed future cash flows. The assessments made in relation to these future cash flows affect the value of the accounts receivable item and a major change in these assessments could have a signifi-cant impact on the Group’s profits and financial position.
The Group’s accounts receivable after reserve for doubtful receivables was MSEK 1,006 on the closing day.
Revaluation of previously owned participation in Gateway Security SAOn acquiring further participations in Gateway Security SA, Gunnebo obtained a controlling influence in the company which has subsequently been recognised as a subsidiary. The previously owned share has hereby been revalued to fair value, resulting in a positive profit effect of MSEK 86 which has been reported under operating profit. The fair value of the previously owned participation has been calculated based on the price paid on acquisition of the additional partici-pations.

57
Note 5 Reporting by segment
Operating segments
2011 Bank Security &
Cash Handling Secure Storage Global Services Entrance ControlDeveloping Businesses
Non-allocated items and
eliminations Total
Net salesExternal sales 2,276 731 1,120 720 290 — 5,137Internal sales — — — — — — —Total net sales 2,276 731 1,120 720 290 — 5,137
Operating profit/loss* 147 15 121 36 –35 40 324Financial income 12Financial expenses –39Tax –52Profit for the year from continuing operations 245
Capital employedTotal assets 1,271 541 743 497 242 671 3,965Non-interest-bearing liabilities –469 –179 –240 –163 –113 –184 –1,348Total capital employed 802 362 503 334 129 487 2,617
Other informationCapital expenditure 36 14 10 12 9 4 85Depreciation 33 11 10 10 13 4 81
2010 Bank Security &
Cash Handling Secure Storage Global Services Entrance ControlDeveloping Businesses
Non-allocated items and
eliminations Total
Net salesExternal sales 2,427 750 1,120 691 275 — 5,263Internal sales — — — — — —Total net sales 2,427 750 1,120 691 275 — 5,263
Operating profit/loss* 166 38 91 –1 –37 –60 197
Financial income 8
Financial expenses –83
Tax –41Profit for the year from continuing operations 81
Capital employed**Total assets 1,093 503 582 453 232 872 3,735Non-interest-bearing liabilities –533 –179 –210 –170 –110 –244 –1,446Total capital employed 560 324 372 283 122 628 2,289
Other informationCapital expenditure 45 3 10 10 2 1 71Depreciation 32 12 10 13 11 4 82
Geographical regions Net sales*** Assets Capital expenditure
2011 2010 2011 2010 2011 2010
Europe 3,518 3,760 3,020 3,019 50 52North America 269 288 192 168 1 1Asia 750 698 432 376 27 16Africa 337 379 113 68 1 1Australia/Oceania 175 113 83 102 1 1South America 88 25 125 2 5 —Total 5,137 5,263 3,965 3,735 85 71
With effect from January 1, 2011, the Group’s Business Areas constitute operating segments. Figures for 2010 have been recalculated in accordance with the new division of segments.
Developing Businesses comprises the operating segments SafePay and Gateway.
* Income and expenses of a non-recurring nature had an effect on Group profit for continuing operations of MSEK 7 (–127). Business Area Bank Security & Cash Handling has been bur-dened by MSEK –20 (–33), Secure Storage by MSEK –1 (–10), Global Services by MSEK –17 (–16), Entrance Control by MSEK –15 (–36) and Developing Businesses by MSEK 0 (–5). The remain-ing sums relating to items of a non-recurring nature amount to MSEK 60 (–27) and have not been allocated to the Business Areas.
** Capital employed attributable to discontinued operations is recognised under the sub-header ‘Non-allocated items and eliminations’.*** In the geographical representation of sales, the customer’s location determines the geographical region to which the sale is allocated.

58
>> FINANCIAL REPORTING > NOTES
Note 6 Other operating income
2011 2010
Capital gains 0.8 1.4Currency gains 13.5 32.1Other 102.8 * 4.0Total 117.1 37.5
* Of which MSEK 86.4 refers to the revaluation of the previously owned participation in associated company Gateway Security SA in connection with Gunnebo’s acquisition of further participations, resulting in the Group obtaining a controlling influence.
Note 7 Other operating expenses
2011 2010
Capital losses 1.5 —Currency losses 7.3 15.1Other 2.6 13.2Total 11.4 28.3
Note 8 Depreciation by function
Depreciation has been charged against the operating profit as follows:
2011 2010
Cost of goods sold 47.9 43.1Selling expenses 7.0 4.9Administrative expenses 26.0 34.2Total 80.9 82.2
Note 9 Expenses of a non-recurring nature
Expenses of a non-recurring nature have been charged against the operating profit as follows:
2011 2010
Cost of goods sold 19.3 48.4Selling expenses 18.6 24.4Administrative expenses 38.6 49.9Other operating expenses 2.9 4.2Total 79.4 126.9
Note 10 Expenses allocated by type of cost
2011 2010
Direct material costs 1,613.6 1,678.3Change in stock 12.2 –2.7Remuneration for employees 1,877.5 1,942.3Temporary personnel and subcontractors 311.4 308.6Transport costs 137.1 141.6Vehicle and travel costs 218.1 217.3Depreciation and write-down of non-current assets 80.9 83.1Other costs 671.3 712.3Total operating expenses* 4,922.1 5,080.8
* Relates to cost of goods sold, selling expenses and administrative expenses.
Note 11 Other financial income and expenses
2011 2010
Other financial incomeCurrency gains 0.5 2.6Other 0.0 0.2Total 0.5 2.8
Other financial expensesCurrency losses –2.0 –5.1Bank charges and bank guarantee costs –23.5 –32.5Other –0.2 –0.4Total –25.7 –38.0
Note 12 Taxes
2011 2010
Current tax –59.9 –52.5Deferred tax 7.4 12.4Total –52.5 –40.1
The Group’s tax expense amounted to MSEK–52.5 (–40.1) and the tax rate to 17.6% (33.1%). The tax rate has been positively affected by non-taxable income of a non-recurring nature and by a more favourable composition of Group profit, with profit improvements in countries where the profit improvements have not yet been achieved to the extent required to report deferred tax assets.
Tax calculated on Group profit before tax differs from the theoretical amount which would have been produced from a weighted average tax rate for profits in the consolidated companies as described below.
2011 2010
Tax calculated in accordance with national tax rates for each country –81.7 –33.8Tax attributable to previous years –1.3 2.3Effects of tax deficits for which no deferred tax assets has been stated –1.3 –15.4Change in assessment of deferred tax assets — —Effects of non-deductible expenses and non-taxa-ble income etc. 31.8 6.8Tax cost –52.5 –40.1
Deferred tax assets and liabilities are attributable to the following items:
Deferred tax assets 2011 2010
Loss carry-forward 35.3 17.2Hedging transactions 155.0 146.0Inventories 1.7 5.9Pension commitments 25.8 35.0Provisions 19.8 28.4Other deductible temporary differences 16.1 14.0Offset against deferred tax liabilities –1.2 –5.9Total 252.5 240.6
Deferred tax liabilities 2011 2010
Non-current assets 30.3 27.1Other taxable temporary differences 8.2 11.5Offset against deferred tax assets –1.2 –5.9Total 37.3 32.7
Deferred tax assets and tax liabilities, net 215.2 207.9

59
The change pertaining to deferred taxes is as follows:
2011 2010
Opening value, net 207.9 201.2Translation differences –1.9 –2.6Deferred tax in the income statement, continuing operations 7.4 12.4Deferred tax in the income statement, discontin-ued operations — 0.1Deferred tax recognised directly against equity 9.0 –3.2Acquisition of operations –6.1 —Divestiture of operations –1.1 —Closing value, net 215.2 207.9
Deferred tax assets attributable to loss carry-forwards are only reported if it is probable that the deduction can be netted against a surplus in future taxation. At the end of 2011, loss carry-forwards totalled over MSEK 700 where no deferred tax assets have been observed. MSEK 0 of this is due within five years. There are both timing and other constraints which mean that these loss carry-forwards are not expected to be able to be utilised.
Note 13 Earnings per share
2011 2010
Net profit for the year attributable to the shareholders of the parent company, MSEK 227.4 178.3Average no. of shares (in thousands) 75,856 75,856Earnings per share, SEK* 3.00 2.35
Earnings per share are calculated by dividing the profit/loss attributable to the parent company shareholders by the average number of outstanding shares during the period.
A dividend of SEK 1.00 (0.50) per share is proposed.
* Earnings per share before and after dilution.
Note 14 Intangible assets
2011 GoodwillOther
intangible assets
Opening cost Jan 1, 2011 1,043.6 303.5Capital expenditure — 24.7Acquisitions 173.1 25.3Divestiture of operations –102.8 –30.4Sales/disposals — –1.5Translation differences –9.9 –1.7Closing accumulated cost Dec 31, 2011 1,104.0 319.9
Opening amortisation and write-downs Jan 1, 2011 91.5 207.3Divestiture of operations –91.8 –26.2Sales/disposals — –0.9Amortisation for the year — 29.7Translation differences 0.3 –0.7Closing accumulated amortisation and write-downs Dec 31, 2011 0.0 209.2
Closing carrying amount Dec 31, 2011 1,104.0 110.7
2010 GoodwillOther intangible
assets
Opening cost Jan 1, 2010 1,196.8 324.3Capital expenditure — 25.1Acquisitions 7.8 —Divestiture of operations –34.8 –3.0Sales/disposals — –14.3Translation differences –126.2 –28.6Closing accumulated cost Dec 31, 2010 1,043.6 303.5
Opening amortisation and write-downs Jan 1, 2010 105.6 216.0Divestiture of operations — –2.7Sales/disposals — –14.2Amortisation for the year — 31.2Translation differences –14.1 –23.0Closing accumulated amortisation and write-downs Dec 31, 2010 91.5 207.3
Closing carrying amount Dec 31, 2010 952.1 96.2
Other intangible assets in the Group consist primarily of expenditure on soft-ware and capitalised expenditure on product development. The useful life is limited for all asset types included in this item. Amortisation is linear over the useful life. Amortisation during the year of other intangible assets has been charged in its entirety to costs of goods sold.
Capitalised expenditure on product development amounted to MSEK 59.1 (61.9). During the course of the year, capital expenditure on product develop-ment projects totalled MSEK 16.4 (16.0).
Review of write-down requirement for goodwillGoodwill is distributed across the Group’s operating segments as follows:
Specification of goodwill 2011 2010
Bank Security & Cash Handling 401.7 288.9Secure Storage 188.5 189.5Global Services 283.6 244.8Entrance Control 200.9 168.9Gateway 29.3 49.3Perimeter Protection* — 10.7Book value 1,104.0 952.1
* Perimeter Protection was divested in September 2011.
The write-down requirement for goodwill is reviewed annually and when there are indications that a write-down is necessary.
The recoverable amount for cash-generating units has been established by calculating the value in use. In terms of the write-down test, this has been car-ried out at the lowest level where separable cash flows have been identified.
The value in use of goodwill in relation to Gunnebo’s cash-generating units has been calculated on the basis of discounted cash flows. Cash flows for the first year are based on a budget set by the Board of Directors, and for the two subsequent years cash flows have been calculated based on financial plans for-mulated by the respective Business Area and approved by the Board of Direc-tors. For the cash-generating units that contain goodwill, cash flows beyond this period have been established with a growth rate equivalent to 0%. This growth rate is based on a cautious assumption and is expected to be lower than the security industry’s long-term growth rate in the countries where Gunnebo operates business.
The forecast cash flows have been computed at present value with a dis-count rate of 10.5% before tax. The discount rate equates to the Group’s weighted average cost of capital, WACC, for the required return on equity and the cost of external borrowing. The calculation of required return on equity is based on a risk-free interest rate of 2.0% and a risk premium of 7.3%.
Using a discount rate of 10.5%, the value in use exceeds the carrying amount for all cash-generating units.

60
>> FINANCIAL REPORTING > NOTES
Sensitivity analysis Bank Security & Cash Handling Secure Storage Global Services Entrance Control Gateway
Carrying amount* 802 362 503 334 66Value in use 1,661 515 1,413 611 72Discount rate before tax is increased to 11.5%
Value in use decreases by MSEK 124 but still exceeds the carrying amount
Value in use decreases by MSEK 41 but still exceeds the carrying amount
Value in use decreases by MSEK 107 but still exceeds the carrying amount
Value in use decreases by MSEK 45 but still exceeds the carrying amount
Value in use decreases by MSEK 5 and roughly equals the carrying amount
Operating margin decreases by 20%
Value in use decreases by MSEK 332 but still exceeds the carrying amount
Value in use decreases by MSEK 103 but still exceeds the carrying amount
Value in use decreases by MSEK 283 but still exceeds the carrying amount
Value in use decreases by MSEK 122 but still exceeds the carrying amount
Value in use decreases by MSEK 14 and falls short of the carrying amount
*Carrying amount equates to the Business Area’s capital employed in accordance with Note 5.
Note 15 Property, plant and equipment
2011Buildings and land Machinery
Equip-ment
Construction in progress
Opening cost Jan 1, 2011 559.4 431.4 325.8 8.9Capital expenditure 4.0 35.2 18.8 7.0Acquisitions — 16.9 7.8 —Divestiture of operations –93.2 –133.3 –31.4 —Sales/disposals –0.1 –5.2 –12.0 —Reclassifications 0.8 10.2 1.6 –12.6Translation differences –2.1 –4.5 –2.8 –0.2Closing accumulated cost Dec 31, 2011 468.8 350.7 307.8 3.1
Opening depreciation and write-downs Jan 1, 2011 358.3 351.4 248.3 —Divestiture of operations –46.4 –110.9 –24.0 —Sales/disposals –0.1 –4.7 –10.8 —Depreciation for the year 13.7 21.7 25.0 —Write-downs — — — —Reclassifications — — — —Translation differences –1.8 –3.1 –2.4 —Closing accumulated depreciation and write-downs Dec 31, 2011 323.7 254.4 236.1 —
Closing carrying amount Dec 31, 2011 145.1 96.3 71.7 3.1
2010Buildings and land Machinery
Equip-ment
Construction in progress
Opening cost Jan 1, 2010 763.1 664.8 424.3 23.8Capital expenditure 3.2 21.6 17.2 21.2Acquisitions — — 3.7 —Divestiture of operations –133.0 –143.4 –65.1 –25.2Sales/disposals –2.2 –66.1 –26.7 –0.3Reclassifications — 5.8 4.1 –9.9Translation differences –71.7 –51.3 –31.7 –0.7Closing accumulated cost Dec 31, 2010 559.4 431.4 325.8 8.9
Opening depreciation and write-downs Jan 1, 2010 485.0 526.2 318.3 —Divestiture of operations –99.7 –99.9 –53.6 —Sales/disposals –1.0 –62.8 –24.0 —Depreciation for the year 20.8 30.4 30.9 —Write-downs 0.9 — — —Reclassifications — –0.6 0.6 —Translation differences –47.7 –41.9 –23.9 —Closing accumulated depreciation and write-downs Dec 31, 2010 358.3 351.4 248.3 —
Closing carrying amount Dec 31, 2010 201.1 80.0 77.5 8.9
Specification, buildings and land 2011 2010
Carrying amount, buildings 115.2 156.1Carrying amount, land 29.9 45.0Total carrying amount 145.1 201.1
Note 14, cont.

61
Note 16 Holdings in associated companies
2011 2010
Opening book value 58.9 55.5Share of profit of associated companies 3.5 5.8Reclassification to subsidiary* –26.7 —Dividends –3.7 –1.4Currency differences –2.9 –1.0Closing book value 29.1 58.9
Book value
Group’s holdings in associated companies% share
of capital 2011 2010
FBH Fichet Ltd, UK 49 1.4 2.0Ritzenthaler Ltd, UK 45 0.0 0.0Chubb Malaysia Sdn Bhd, Malaysia 30 16.9 16.5Gateway Security Portugal Ltda, Portu-gal 55 4.8 5.2Gateway Security SA, Brazil* — 30.1Prodimo AB, Sweden 48 6.0 5.1Total 29.1 58.9
Gunnebo’s share in the income and net profit of the associated companies amounts to MSEK 88.6 (154.8) and MSEK 3.5 (5.8) respectively. The share of their total assets is MSEK 66.4 (131.0) and the share of their liabilities is MSEK 37.3 (72.1).
The statutory specification of holdings in associated companies with infor-mation concerning the company registration numbers and registered offices may be obtained from Gunnebo’s head office in Gothenburg, Sweden.
* In early November 2011 a further 30% of both the capital and the votes in Gateway Security SA was acquired. On increasing its ownership of the associated company, Gunnebo obtained a controlling influence in the company which has subsequently been recognised as a subsidiary.
Note 17 Inventories
2011 2010
Raw materials 164.5 193.1Work in progress 32.0 33.7Finished goods 415.7 409.4Installation work in progress 69.9 70.1Less advance payments from customers –118.0 –163.0Total 564.1 543.3
Of the inventories, MSEK 503.1 is measured at cost and MSEK 61.0 at net selling price. On December 31, 2011, the Group’s reserve for obsolescence amounted to MSEK 58.6 (133.9). See also Note 4 Obsolescence reserve.
Note 18 Accounts receivable
2011 2010
Accounts receivable, not yet due 798.1 853.3Of which overdue 1–30 days 148.4 149.5Of which overdue 31–60 days 49.5 52.1Of which overdue 61–90 days 15.9 16.0Of which overdue over 90 days 35.5 52.9Total 1,047.4 1,123.8
Provision for doubtful receivables 2011 2010
Provision at the beginning of the year –57.8 –68.6Reserve for anticipated losses –17.7 –19.9Confirmed losses 13.1 15.0Discharged payment of reserved receivables 13.3 4.3Divestiture of operations 6.0 4.5Acquisition of operations –0.5 —Currency differences 1.8 6.9Provision at the end of the year –41.8 –57.8
Closing carrying amount 1,005.6 1,066.0
Note 19 Prepaid expenses and accrued income
2011 2010
Prepaid rent 13.4 9.3Accrued interest 9.1 3.4Other items 40.5 42.3Total 63.0 55.0
Note 20 Liquid funds
2011 2010
Short-term investments 42.5 13.1Cash and bank 196.3 175.6Total 238.8 188.7
Note 21 Equity reserves
Hedging reserve
Translation reserve
Total reserves
Opening balance Jan 1, 2011 –1.7 –79.7 –81.4Currency differences:- Subsidiaries — 2.1** 2.1- Associated companies — –2.9 –2.9Hedging of net investments* — –32.5 –32.5Cash flow hedges:- Changes in fair value during the
year 2.0 — 2.0- Tax on changes in fair value –0.5 — –0.5- Transfers to income statement –2.4 — –2.4- Tax on transfers to income
statement 0.6 — 0.6Closing balance Dec 31, 2011 –2.0 –113.0 –115.0

62
>> FINANCIAL REPORTING > NOTES
Important actuarial assumptions, % 2011 2010
Discount rateUK 5.0 5.5Sweden 3.7 4.2Other countries (weighted average) 5.0 5.3
Expected return on plan assetsUK 5.6 5.8Sweden — —Other countries (weighted average) 5.8 6.0
Expected wage increase rateUK 3.4 4.0Sweden 3.0 3.0Other countries (weighted average) 3.5 3.5
Inflation UK 2.9 3.5Sweden 2.0 2.0Other countries (weighted average) 2.7 2.7
Reconciliation of pension commit-ments UK Sweden
Other countries
2011Total
2010 Total
2009 Total
2008Total
Present value of obligations 433.4 82.7 263.5 779.6 712.8 717.2 617.7Fair value of plan assets — –100.3 –455.4 –431.6 –412.8 –348.6Total 78.3 82.7 163.2 324.2 281.2 304.4 269.1
Unrecognised actuarial gains (+) and losses (–) –63.7 –23.8 –26.7 –114.2 –70.5 –59.2 –25.6
Unrecognised past service costs — — –12.1 –12.1 –11.8 — —
Effect of restric-tions in plan assets — — 1.1 1.1 — — —Net provision in balance sheet 14.6 58.9 125.5 199.0 198.9 245.2 243.5
Of the present value of obligations, MSEK 595.0 (536.9) relates to funded pen-sions and other plans, and MSEK 184.6 (175.9) to non-funded pensions and other plans.
In 2012 the Group expects to make MSEK 33.4 (35.5) in payments relating to defined benefit plans.
Note 21, cont.
Hedging reserve
Translation reserve
Total reserves
Opening balance Jan 1, 2010 –4.7 –89.9 –94.6Currency differences:- Subsidiaries — 36.6*** 36.6- Associated companies — –1.0 –1.0Hedging of net investments* — –25.4 –25.4Cash flow hedges:- Changes in fair value during
the year 25.6 — 25.6- Tax on changes in fair value –6.7 — –6.7- Transfers to income statement –21.5 — –21.5- Tax on transfers to income
statement 5.6 — 5.6Closing balance Dec 31, 2010 –1.7 –79.7 –81.4
* Hedging of net investments primarily relates to net assets in EUR and CHF.** Of which MSEK –3.5 refers to reversal of accumulated currency differences from
discontinued operations.*** Of which MSEK 6.1 refers to reversal of accumulated currency differences from
discontinued operations.
No. of shares 2011 2010
Opening balance 75,855,598 75,855,598Closing balance 75,855,598 75,855,598
Note 22 Pension commitments
Remuneration to employees after the end of employment, such as pensions, healthcare benefits and other remuneration, is predominantly funded through payments to insurance companies or authorities which thereby take over the obligations to the employees; these are known as defined contribution plans. The remainder is carried out through defined benefit plans whereby the obliga-tions remain within the Group. The main defined benefit plans are in the UK and Sweden (FPG/PRI provision).
In the UK, pension obligations are mainly secured through payments into an independent pension plan.
There are other defined benefit plans in Canada, France, Germany, the Nether-lands, Italy, Indonesia, India and South Africa.
With regard to defined benefit plans, the company’s costs and the value of out-standing obligations are estimated using actuarial calculations, which aim to establish the present value of obligations issued. Plan assets mainly comprise shares and interest-bearing current receivables. No plan assets comprise financial instruments in Gunnebo AB or assets used within the Group.

63
Specification of plan assets 2011 2010
Government bonds 88.2 59.0Commercial papers 145.6 151.3Shares 212.9 210.9Liquid funds 8.7 10.4Total plan assets 455.4 431.6
Specification of changes in defined benefit obligations 2011 2010
Opening balance 712.8 717.2Costs pertaining to employment during the current year 15.8 17.1Interest on obligations 36.8 38.3Contributions made by pension plan members 2.2 2.5Payment of pension benefits –21.3 –31.3Redemption of pension commitment — –9.9Unrecognised actuarial gains (–) and losses (+) 31.5 34.7Unrecognised past service costs 1.1 11.8Curtailments — 4.0Divestiture of operations –1.7 –20.2Currency differences on foreign plans 2.4 –51.4Closing balance 779.6 712.8
Specification of changes in plan assets 2011 2010
Opening balance 431.6 412.8Expected return on plan assets 24.7 25.3Contributions to the plan made by the company 20.5 27.4Contributions made by pension plan members 2.2 2.5Payment of pension benefits –13.9 –18.6Unrecognised actuarial gains (+) and losses (–) –13.2 14.2Divestiture of operations –0.6 —Currency differences on foreign plans 4.1 –32.0Closing balance 455.4 431.6
Specification of changes in provisions for pensions 2011 2010
Opening balance 198.9 245.2Net cost entered in the income statement 30.9 38.2Payment of benefits –7.4 –12.7Redemption of pension commitment — –9.9Contributions into funded plans –20.5 –27.4Divestiture of operations –1.3 –17.5Currency differences on foreign plans –1.6 –17.0Closing balance 199.0 198.9
Specification of pension costs in the income statement 2011 2010
Costs pertaining to defined benefit plans:Costs pertaining to employment during the current year 15.8 17.1Interest on obligation 36.8 38.3Expected return on plan assets –24.7 –25.3Actuarial gains (–) and losses (+) recognised during the year 1.2 4.1Past service cost 0.7 —Gains (–) and losses (+) on curtailments — 4.0Effect of restrictions in plan assets 1.1 —Costs pertaining to defined benefit plans 30.9 38.2
Costs pertaining to defined contribution plans 56.1 59.3Total pension costs in the income statement 87.0 97.5of which:Amount charged against operating profit/loss, con-tinuing operations 71.1 73.0Amount charged against operating profit/loss, dis-continued operations 3.8 11.5Amount charged against financial expenses, con-tinuing operations 12.1 12.2Amount charged against financial expenses, dis-continued operations 0.0 0.8Total pension costs in the income statement 87.0 97.5
Actual return on plan assets 11.8 40.3
Interest and expected return are classified as a financial expense. Other cost items are recognised under operating profit/loss and are allocated between cost of goods sold, selling expenses or administrative expenses depending on the employee’s function. MSEK 4.0 (5.2) of the cost for defined contribution plans comprises premiums to Alecta/Collectum. This insurance policy encom-passes several employers in Sweden, and insufficient information is available from Alecta/Collectum to be able to report the plan as a defined benefit plan.
Alecta’s collective funding ratio at the end of the year was 113% (146%). The collective funding level is the difference between the company’s assets and insurance commitments, based on Alecta’s calculation assumptions for insur-ance purposes, which do not comply with IAS 19.
Note 23 Other provisions
2011Restructuring
programme DisputesGuaran-
tees Taxes Other Total
Opening balance 45.7 11.9 47.1 4.8 11.6 121.1Acquisition of operations — — 0.1 — — 0.1Divestiture of operations –7.3 –1.4 –4.0 — –0.7 –13.4Provisions during the year 30.6 17.7 12.6 1.0 5.7 67.6Utilised during the year –18.5 –4.4 –13.7 –0.3 –2.9 –39.8Reversed during the year –2.5 –0.6 –3.6 –2.0 –5.4 –14.1Currency differences –0.3 0.1 –0.3 0.0 0.2 –0.3Closing balance 47.7 23.3 38.2 3.5 8.5 121.2

64
>> FINANCIAL REPORTING > NOTES
2010
Restruc-turing
programmeDis-
putesGuaran-
tees Taxes Other Total
Opening balance 57.5 9.8 43.7 5.3 13.4 129.7Divestiture of operations — — — — –0.1 –0.1Reclassifications –1.2 — 0.8 — 0.4 —Provisions during the year 36.8 8.0 20.0 — 3.4 68.2Utilised during the year –37.0 –2.8 –12.4 –0.1 –3.1 –55.4Reversed during the year –4.0 –1.6 –0.4 — –1.5 –7.5Currency differences –6.4 –1.5 –4.6 –0.4 –0.9 –13.8Closing balance 45.7 11.9 47.1 4.8 11.6 121.1
Provisions for restructuring measures have been made mainly for discontinued operations and reorganisation. The provisions are expected to be utilised during 2012.
For information relating to the assumptions and assessments made in reporting provisions, see Note 4.
Note 24 Borrowings
Long-term borrowing 2011 2010
Liabilities to credit institutions 563.9 407.8Total 563.9 407.8
Short-term borrowing
Overdraft facilities 16.8 42.0Liabilities to credit institutions 61.7 34.5Total 78.5 76.5
Total borrowing* 642.4 484.3
* Loan maturity structure for the Group is reported in Note 3.
Note 25 Accrued expenses and deferred income2011 2010
Holiday pay liability 113.1 118.8Accrued wages and salaries 79.2 94.6Social security charges 65.8 66.3Deferred income 52.3 57.9Accrued interest 3.2 0.4Other items 129.8 130.9Total 443.4 468.9
Note 26 Contingent liabilities
2011 2010
Guarantees 191.8 206.5Total 191.8 206.5
Guarantees for the fulfilment of various contractual obligations are part of the Group’s normal business activities. At the time of publication of this annual report, there were no indications that guarantees provided will result in pay-ments.
Note 27 Operating lease contracts
Leased assetsFuture payment commitments for operating lease contracts have the following breakdown by year:
2012 83.72013 55.62014 37.52015 28.02016 16.92017 and later 13.9Total 235.6
The year’s cost in continuing operations relating to leased assets amounted to MSEK 103.4 (106.8).
Note 28 Net financial items affecting cash flow
2011 2010
Interest received 6.3 2.3Interest paid –10.0 –46.5Other items affecting cash flow –25.2 –35.2Total –28.9 –79.4
Note 29 Adjustment for items not included in cash flow etc.
2011 2010
Amortisation of intangible assets 29.7 31.2Depreciation of property, plant and equipment 60.4 82.1Write-down of property, plant and equipment — 0.9Share in profit of associated companies, not distributed 0.2 –4.4Adjustment for provisions 1.2 5.6Restructuring costs not affecting cash flow 34.1 83.7Restructuring costs paid, previously recognised as costs –22.6 –65.0Revaluation to fair value of previously owned participation in associated company –86.4 —Reversal of accumulated translation differences from discontinued operations –3.5 6.1Capital gain from divestiture of operations 1.5 –120.6Capital gain from sale/disposal of property, plant and equipment 0.7 –2.2Adjustment for items not included in cash flow etc. 15.3 17.4
Note 23, cont.
65
Note 30 Acquisition of operations
Assets and liabilities of acquired operations 2011 2010
Intangible assets 25.3 —Property, plant and equipment 24.7 3.7Financial assets 0.5 —Inventories 29.9 11.9Current receivables 48.1 8.3Liquid funds 21.7 —Current liabilities –34.2 –7.0Long-term liabilities –43.9 —Identifiable net assets 72.1 16.9
Goodwill 173.1 7.8Holdings without controlling influence –10.7 —Group value of associated company at acquisition date –26.7 —Revaluation of previously owned participation in associated company –86.4 —Total purchase sums 121.4 24.7
Less:
Liquid funds in acquired operations –21.7 —Effect on Group liquid funds 99.7 24.7
Acquisitions in 2011Acquisition of AlltechOn August 31, 2011 Gunnebo acquired Alltech (Pty) Ltd, a market-leading com-pany in South Africa in the field of entrance control. The acquired operation has annual net sales of approximately MSEK 40 and 28 employees. The purchase sum totalled MSEK 41.5. Goodwill arising from the acquisition amounted to MSEK 34.8 and can be attributed to geographic expansion in the entrance con-trol product area.
Alltech
Carrying amount
in Group
Intangible assets 9.3Property, plant and equipment 0.2Financial assets 0.5Inventories 4.0Current receivables 1.7Liquid funds 0.0Current liabilities –5.8Long-term liabilities –3.2Identifiable net assets 6.7
Goodwill 34.8Total purchase sums 41.5
Less:
Liquid funds in acquired operation 0.0Effect on Group liquid funds 41.5
Acquisition of further holdings in Gateway Security SA*In early November 2011 a further 30% of both the capital and the votes in asso-ciated company Gateway Security SA was acquired. The company is a leading supplier of security solutions for the retail sector in Brazil and has sales in the region of MSEK 130 and 90 employees. The purchase sum was MSEK 79.9 and payment was in cash. Acquisition costs totalled MSEK 1.9.
On increasing its ownership of the Brazilian associated company, Gunnebo obtained a controlling influence in the company which has subsequently been recognised as a subsidiary. The previously owned share has hereby been revalued to fair value, resulting in a positive profit effect of MSEK 86.4 which has been reported under other operating income. Goodwill arising from the acquisi-tion and the revaluation of the previously owned share amounted to MSEK 138.3 and can primarily be attributed to geographical expansion. After the acquisition the company has had sales of MSEK 47.5 and an operating profit of MSEK 15.0.
* The acquisition has partially been carried out through a new share issue and targeted dividends to shareholders without a controlling influence.
Gateway Security SA
Carrying amount
in Group
Intangible assets 16.0Property, plant and equipment 24.5Inventories 25.9Current receivables 46.4Liquid funds 21.7Current liabilities –28.4Long-term liabilities –40.7Identifiable net assets 65.4
Goodwill 138.3Holdings without controlling influ-ence –10.7Group value of associated company at acquisition date –26.7Revaluation of previously owned participation in associated company –86.4Total purchase sums 79.9
Less:
Liquid funds in acquired operation –21.7Effect on Group liquid funds 58.2
Acquisitions in 2010Acquisition of API Security ProductsOn August 31, 2010, Gunnebo Australia took over the Security Products division from API Security Holdings. The purchase sum was MSEK 24.7 and the acquisi-tion costs were MSEK 3.1. The goodwill arising from the acquisition amounted to MSEK 7.8 and is attributable to various synergy effects, which do not fulfil the criteria for recognition as other intangible assets.
API Security Products
Carrying amount in
Group
Property, plant and equipment 3.7Inventories 11.9Current receivables 8.3Current liabilities –7.0Identifiable net assets 16.9
Goodwill 7.8Total purchase sums 24.7
Less:
Liquid funds in acquired operation —Effect on Group liquid funds 24.7
Note 31 Divestment of operations
The divestments below are reported separately as discontinued operations in the income statement, with retroactive effect for previous periods, in accordance with IFRS 5, Non-current assets held for sale and discontinued operations.
Divestment of Perimeter ProtectionIn September 2011, Perimeter Protection was sold to Swedish venture capital company Procuritas Capital Investors. The purchase sum after transaction costs amounted to MSEK 268.4 and the Group capital loss totalled MSEK –1.5. Further-more, profit was recompensed by MSEK 3.5 relating to accumulated translation differences in equity which were reclassified as profit in connection with the divestment.

66
>> FINANCIAL REPORTING > NOTES
Income statementThe income statements for discontinued operations are shown below.
Perimeter Protection Troax Total
Income statement for discontinued operations 2011 2010 2011 2010 2011 2010
Net sales 443.1 675.5 — 446.5 443.1 1,122.0Cost of goods sold –374.0 –588.3 — –281.4 –374.0 –869.7Gross profit 69.1 87.2 — 165.1 69.1 252.3
Selling and administrative expenses –82.4 –136.2 — –126.9 –82.4 –263.1Other operating income and operating expenses –0.4 2.3 — 3.4 –0.4 5.7Operating profit/loss –13.7 –46.7 — 41.6 –13.7 –5.1
Net financial items –3.7 –2.9 — –6.5 –3.7 –9.4Profit/loss after financial items –17.4 –49.6 — 35.1 –17.4 –14.5
Taxes –0.1 –0.5 — –2.3 –0.1 –2.8Profit/loss from the operation for the period –17.5 –50.1 — 32.8 –17.5 –17.3
Gain from divestiture of operations 7.9 — — 131.4 7.9 131.4Tax on gain from divestiture of operations 0.0 — — 0.0 0.0 0.0Transaction costs –9.4 — — –10.8 –9.4 –10.8Profit/loss from translation differences and hedges 3.5 — — –6.1 3.5 –6.1Profit/loss for the period –15.5 –50.1 — 147.3 –15.5 97.2
Cash flowThe cash flows for discontinued operations are shown below. The figures are stated excluding cash flow from discontinued operations of MSEK 171.9 in 2011 and MSEK 296.8 in 2010.
Perimeter Protection Troax Total
Cash flow for discontinued operations 2011 2010 2011 2010 2011 2010
Cash flow from operating activities –77.4 8.7 — 21.2 –77.4 29.9Cash flow from investing activities –5.0 –8.1 — –9.4 –5.0 –17.5Cash flow from financing activities 83.4 –0.7 — –11.8 83.4 –12.5Cash flow for the period 1.0 –0.1 — 0.0 1.0 –0.1
Divestment of TroaxIn December 2010, Troax was sold to Swedish venture capital company Accent Equity Partners. Gunnebo thereby left the Indoor Perimeter Protection segment which comprised the three product areas Automation & Robotics, Storage & Property Protection and Material Handling & Logistics. The purchase sum after
Assets and liabilities in discontinued operationsAssets and liabilities that were included in discontinued operations at the time of sale are presented below.
Assets and liabilities in discontinued operations 2011 2010
Goodwill 11.0 34.8Other intangible assets 4.2 0.3Property, plant and equipment 76.6 113.5Financial assets 1.4 1.8Inventories 163.6 56.1Current receivables 124.3 122.3Liquid funds 2.0 4.4Long-term liabilities –1.9 –17.5Current liabilities –111.3 –106.0Divested net assets 269.9 209.7
Capital gains/losses –1.5 120.6Purchase sum received after transaction costs and tax 268.4 330.3
Of which purchase sums not paid –94.5 –29.1Purchase sum paid in cash 173.9 301.2
Liquid funds in discontinued operations –2.0 –4.4Effect on Group liquid funds 171.9 296.8
transaction costs and tax amounted to MSEK 330.3 and the Group capital gain totalled MSEK 120.6. Furthermore, profit was burdened by MSEK 6.1 relating to accumulated translation differences in equity which were reclassified as a loss in connection with the divestment.
Note 31, cont.

67
Note 32 Personnel
Average number of employees 2011 2010
Sweden 187 228Australia 83 44Austria 9 9Belgium 88 98Brazil 35 —Canada 154 149China/Hong Kong 45 15Czech Republic 16 17Denmark 77 79Finland 8 8France 1,151 1,161Germany 287 308Hungary 10 9India 829 755Indonesia 814 818Italy 161 176Lebanon — 4Luxembourg 6 5Mexico 24 2Netherlands 293 315Norway 40 43Poland 39 36Portugal 56 55Saudi Arabia 1 —Singapore 14 14South Africa 202 178Spain 364 385Switzerland 40 41Turkey 1 —United Arab Emirates 12 14UK 251 264USA 18 18Total for continuing operations 5,315 5,248
Total for discontinued operations 268 656Total 5,583 5,904
Of the average number of employees in continuing operations, 880 (821) were female. Women occupy 6% of the senior management positions in the Group. The average number of employees abroad in continuing operations was 5,128 (5,020).
Incentive programme for employees and Board membersIncentive programme 2007An extraordinary general meeting in October 2007 voted in favour of introduc-ing a long-term incentive programme for senior executives and other key per-sonnel as well as for Board members.
The basic structure was a combined share and warrants programme where senior executives and other key personnel were given the opportunity to sub-scribe to and tie up newly issued shares or shares already held (‘saving shares’) until the date of publication of Gunnebo’s year-end release for the 2010 finan-cial year. For every 200 saving shares, participants were given the opportunity to acquire a maximum of 1,600 warrants at market price. The acquisition price of the warrants was determined using the Black & Scholes valuation model.
In those countries where tax rules are unfavourable for the acquisition and exercising of warrants, the participants have instead been allocated employee stock options. The employee stock options were issued free of charge in eight tranches and could only be redeemed if the financial programme conditions
were achieved for every financial year from 2007 to 2010. The exercising of employee stock options was also conditional on the continued holding of saving shares and employment on the day of publication of Gunnebo’s year-end release for the 2010 financial year.
Board programme 2007The programme had the same structure as the incentive programme for senior executives and other key personnel. For every 200 saving shares, participants were given the opportunity to acquire a maximum of 800 warrants at market price.
Subscription conditionsA warrant/employee stock option gave the holder the right, during certain peri-ods of 2011, to subscribe to 1.28 shares in Gunnebo AB at a price of SEK 63.80.
Changes to the Incentive programme 2007 and Board programme 2007 Incentive
programme 2007 Board
programme 2007
2011 2011 2011
WarrantsEmployee
stock options Warrants
Opening balance 397,800 11,460 88,000Allocated — — —Forfeited — –11,460 —Exercised — — —Matured –397,800 — –88,000Closing balance — — —
Incentive programme 2010 At the 2010 Annual General Meeting, an incentive programme was decided on for 46 senior executives and other key personnel within the Group through an issue of warrants which entitle the holder to subscribe for new shares in Gunnebo AB. The acquisition price of the warrants was determined using the Black & Scholes valuation model and amounted to SEK 3.30 per warrant. A war-rant gives the holder the right to subscribe to a share in Gunnebo AB at a price of SEK 32.00 during certain periods in 2013–2014.
Since the participants have been offered the opportunity to acquire warrants at market price, the programme will not entail payroll costs for accounting pur-poses in accordance with IFRS 2. Costs in the form of social security charges may, however, arise in certain countries.
Changes to the incentive programme 2010Incentive
programme 2010
2011
Warrants
Opening balance 381,500Exercised —Closing balance 381,500
Specification of the incentive programme 2010 Warrants
President and CEO 30,000Other senior executives (7 people) 80,000Other 271,500Closing balance 381,500
Incentive programme 2011In connection with the 2011 Annual General Meeting, a new incentive pro-gramme was adopted for 49 senior executives, structured along the same prin-ciples as the programme adopted at the 2010 Annual General Meeting. The market value of the warrants was determined by an external financial institute using the Black & Scholes valuation model and the price was set at SEK 6.30 per warrant. A warrant gives the holder the right to subscribe to a share in Gunnebo AB at a price of SEK 44.20 during certain periods in 2014–2015.

68
>> FINANCIAL REPORTING > NOTES
Changes to the incentive programme 2011 Incentive
programme 2011
2011
Changes to the incentive programme 2011 Warrants
Opening balance —Allocated 154,500Closing balance 154,500
Specification of the incentive programme 2011 Warrants
President and CEO 30,000Other senior executives (7 people) 35,000Other 89,500Closing balance 154,500
Personnel costs
Wages, salaries, other remuneration and social security charges 2011
Wages, salaries and other
remuneration
Social security charges
of which pension costs
Continuing operations 1,446.4 431.1 71.1Discontinued operations 104.5 30.9 3.8Group total 1,550.9 462.0 74.9
Wages, salaries, other remuneration and social security charges 2010
Wages, salaries and other
remuneration
Social security charges
of which pension costs
Continuing operations 1,490.4 451.9 73.0Discontinued operations 265.2 75.8 11.5Group total 1,755.6 527.7 84.5
Of the above amount, a total of MSEK 47.8 (55.8) was paid in salaries and other remuneration to Presidents within the Group’s continuing operations, of which MSEK 5.0 (5.1) consisted of performance-related pay. Of the Group’s pensions costs, MSEK 4.5 (5.1) relates to Presidents within the Group’s continuing operations.
Remuneration to the BoardRemuneration to the Board of the parent company amounted to TSEK 1,700 (1,625), of which TSEK 150 (100) comprises remuneration for committee work. A Board fee of TSEK 425 was paid to Chairman of the Board Martin Svalstedt. Board fees of TSEK 267.5 and TSEK 262.5 were paid to Mikael Jönsson and Bo Dankis respectively. A Board fee of TSEK 252.5 per person was paid to members Göran Bille and Katarina Mellström, and a Board fee of TSEK 240 was paid to Björn Eriksson.
Remuneration to senior executives
Remuneration and other benefits for senior executives during the year
SEK '000 Salary
Per-formance-
related payOther
benefitsPension
cost Total
Per Borgvall, President 3,794 186 235 1,239 5,454Other senior executives (9 people)* 15,719 1,392 1,824 4,248 23,183Total 19,513 1,578 2,059 5,487 28,637
Other benefits relate mainly to housing allowances and company cars.
* Includes the number of people who have received remuneration during the year while active as senior executives.
Pensions and severance payThe retirement age for the President is 65. The pension solution is premium-based and the pension cost amounts to 35% of salary, excluding performance-related pay. If the President resigns the notice period is 6 months. The President is entitled to a notice period of 12 months, during which the normal salary and other benefits shall be paid, in the event of the contract being terminated by the company. At the end of the notice period, severance pay amounting to one year’s salary (excluding performance-related pay) shall be paid out in equal amounts over the course of 12 months.
For other senior executives (seven people who, together with the President, constitute the Group Executive Team), the notice period is a maximum of one year, during which full salary and other benefits are payable. If the senior executive resigns the notice period is 6 months.
The retirement age is 65. A premium-based pension plan is in place for senior executives in Sweden (three people). The agreed premium provision may amount to a maximum of 35% of the basic salary, depending on age and salary level.
Note 33 Fees to auditors
Deloitte is appointed auditor for the Group.
2011 2010
Fees to DeloitteAuditing 7.3 6.5Auditing assignments in addition to auditing 1.0 0.4Tax advice 0.6 0.6Other services 0.8 0.2Total fees to Deloitte 9.7 7.7
Audit fees to other audit firms 1.0 0.8Total fees to auditors 10.7 8.5
Auditing refers to the auditors’ remuneration for the statutory audit. Auditing assignments in addition to auditing constitutes any examination of administra-tion or financial information resulting from statutes, the Articles of Association, regulations or agreements which result in a report or some other document intended to form a basis for assessment for a party other than the ordering client, as well as advice or other assistance prompted by observations in an auditing assignment. An example of an auditing assignment that is not part of the audit is the auditors’ general review of an interim report. Tax advice is self evident. Other services are advice not related to any of the previously specified services.
Note 34 Transactions with related parties
A royalty of MSEK 1.0 (1.0) was received from Chubb Malaysia Bnd Sdn, an asso-ciated company.
Information on remuneration to Board members is provided in Note 32. Over and above these, there were no other transactions with related parties.
Note 35 Business risks
Risk management in Gunnebo aims to identify, control, prevent and thereby minimise the Group’s potential risks.
Operational and strategic risks are mainly related to risks in the business environment, country-specific and political risks, as well as specific risks related to customers, suppliers, employees and competitors.
The local management is responsible for developing strategies and identify-ing risks in their local market or area of responsibility. The Group’s total risk

69
analysis and exchange of relevant information are assured by the inclusion of Group management representatives on the internal board of each sales or prod-uct company.
Market risksGunnebo has a relatively broad product range and customer structure, as well as presence in a high number of geographic markets. This provides a good risk distribution preventing the Group from being dependent on a limited number of major customers or suppliers.
Representation on several markets with a broad product range means that the Group is exposed to business environment risks such as political risks in individual countries or regions, risks in raw material prices and also risks related to business cycles. Economic conditions in the construction and property sec-tors are of most importance to the Entrance Control product area, while the market situation in the bank and retail markets have the greatest impact on the product areas of Secure Storage, Electronic Security and Cash Automation.
Raw material risksGunnebo is exposed to risk when the prices of materials change. Competition on the market may limit the ability to fully compensate for increased costs through price rises. Steel is the single largest raw material component in the Group, which purchases many different types and grades on various markets, resulting in differentiated price development. With the aim of limiting the short-term effect of price fluctuations, a large part of the Group’s steel require-ment is purchased via index-based contracts.
Production risksGunnebo’s production operation takes place in 11 production units and com-prises of a chain of processes where stoppages or disruptions in one stage, such as breakdown or industrial disputes, can have consequences on Gunnebo’s abil-ity to fulfil its obligations to customers.
Gunnebo deals with risks relating to the Group’s property and operational stoppages through a far-reaching programme for identifying and assessing such risks. The programme is applied at all of Gunnebo’s production plants and aims to prevent these types of risk or, if an event is beyond Gunnebo’s control, to mit-igate the consequences. The production plants are also continuously inspected by Gunnebo’s insurers within the framework of a special risk assessment sys-tem called Gunnebo Blue.
Distribution risksOn markets where Gunnebo has its own sales company, that company is responsible for all marketing and sales to the customer. On other markets Gunnebo collaborates with a network of agents and distributors. Their capacity can affect Group sales, but Gunnebo is not dependent on a single agent or dis-tributor.
Product risksThe majority of the Group’s products have limited risk in their application. It should also be noted that many of the products and systems are installed to strengthen protection in security-critical environments. Their function and quality are therefore of the utmost importance in securing the intended level of protection.
InsuranceGunnebo has a Group-wide insurance programme which includes general liabil-ity and product liability, property and business interruption insurance, transport insurance and policies for crime against property. The Group has also taken out indemnity insurance for the Board and senior executives.
Legal risksNo company in the Group is a party in legal proceedings or any other dispute where the outcome may be supposed to have anything but a limited effect on the Group’s overall results and financial position. Any legal disputes and risks of legal disputes are reported to the Group Legal Affairs function. Legal disputes
are handled by a qualified legal representative under the supervision of Group Legal Affairs.
Sensitivity analysisProfit is affected by changes in certain factors of importance to the Group, as explained below. The calculation is made on the basis of the Group’s structure at the year-end and assuming all other factors remain unchanged.
Selling pricesA 1% change in selling prices affects income and operating profit by approxi-mately MSEK 50.
Labour costsA 1% change in labour costs, including social security charges, affects operating profit by approximately MSEK 20.
Steel pricesSteel is the single largest raw material component in the Group, which pur-chases many different types and grades, resulting in differentiated price devel-opment. A general change in the steel price of 10% affects profits by around MSEK 30 for the subsequent 12 months.
Note 36 Events after the closing day
No significant events occurred after the closing day, except that Bernt Ingman became CFO on March 1, 2012.

>> FINANCIAL REPORTING > NOTES
70
Note 37 Expenses allocated by type of cost
2011 2010
Remuneration for employees 48.6 56.9Temporary personnel and subcontractors 51.3 30.9Vehicle and travel costs 7.8 5.3Depreciation and write-downs 4.4 4.3Other costs 11.5 19.6Total operating costs 123.6 117.0
Note 38 Financial items
2011 2010
Profit/loss from participations in Group companiesDividends 23.8 —Capital gains/losses — –34.0Total 23.8 –34.0
Interest incomeInterest income, external 3.9 0.1Interest income, Group companies 11.5 21.6Total 15.4 21.7
Interest expensesInterest expenses, external 0.0 –4.9Interest expenses, Group companies –20.9 –43.2Total –20.9 –48.1
Other financial expensesCurrency losses –6.0 –31.5Cost of credit facilities — –0.9Other financial expenses –7.4 0.0Total –13.4 –32.4
Note 39 Intangible assets
Other intangible assets 2011 2010
Opening cost 23.7 23.4Capital expenditure 0.1 0.3Sales/disposals –0.6 —Closing accumulated cost 23.2 23.7
Opening amortisation 7.4 3.7Sales/disposals 0.0 —Amortisation for the year 3.7 3.7Closing accumulated amortisation 11.1 7.4
Closing carrying amount 12.1 16.3
Note 40 Property, plant and equipment
Equipment 2011 2010
Opening cost 7.0 6.8Capital expenditure 3.8 0.2Sales/disposals –4.5 —Closing accumulated cost 6.3 7.0
Opening depreciation 6.4 5.8Sales/disposals –4.5 —Depreciation for the year 0.7 0.6Closing accumulated depreciation 2.6 6.4
Closing carrying amount 3.7 0.6
Note 41 Shares in subsidiaries
2011 2010
Opening book value 1,838.2 2,101.3Sales — –263.1Closing book value 1,838.2 1,838.2
Specification of shares in subsidiaries
No. of shares
% of capital
% of votes
Book value
Gunnebo Nordic AB 251,000 100 100 388.2Gunnebo Treasury SA 7,200 100 100 1,233.0Gunnebo Entrance Control AB 48,000 100 100 8.5Gunnebo Sverige AB 5,500 100 100 1.3Gunnebo Holding ApS 1,000 100 100 91.4Gunnebo India Pvt Ltd 15,554,961 100 100 115.4Gunnebo SafePay AB 1,000 100 100 0.1Hidef Industri AB 1,000 100 100 0.1Gunnebo Holding AB 1,000 100 100 0.1Gunnebo Holding GmbH 1 100 100 0.1Total 1,838.2
A specification of shares in subsidiaries with information concerning the company registration numbers and registered offices may be obtained from Gunnebo’s head office in Gothenburg, Sweden.
Note 42 Prepaid expenses and accrued income
2011 2010
Accrued interest — 2.7Prepaid rent 0.8 0.6Other items 2.4 1.2Total 3.2 4.5
NOTES – PARENT COMPANY

71
Note 43 Accrued expenses and deferred income
2011 2010
Holiday pay liability 3.1 3.3Social security charges 10.6 10.4Accrued salaries 3.6 13.5Accrued interest 0.0 0.1Other items 6.6 6.7Total 23.9 34.0
Note 44 Contingent liabilities
2011 2010
Guarantees regarding subsidiaries 820.3 678.1Total 820.3 678.1
Note 45 Operating lease contracts
Leased assetsFuture payment commitments for operating lease contracts have the following breakdown by year:
2012 3.32013 2.42014 2.22015 2.12016 2.12017 and later 0.7Total 12.8
Leasing costs at the parent company amounted to MSEK 3.7 (3.1).
Note 46 Net financial items affecting cash flow
2011 2010
Interest received 10.5 19.5Interest paid –21.9 –49.1Dividends received 23.8 —Other items affecting cash flow –13.4 –32.4Total –1.0 –62.0
Note 47 Personnel
Average number of employeesIn 2011, the average number of parent company employees was 26 (27), of whom 11 were female (10).
There is one woman on the Board of the parent company and one in the executive management team.
Personnel costs
Salaries, other remuneration and social security charges 2011
Salaries and other
remuneration
Social security charges
of which pension costs
Total 28.0 20.6 9.5
Salaries, other remuneration and social security charges 2010
Salaries and other
remuneration
Social security charges
of which pension costs
Total 32.1 24.8 11.3
Information on remuneration to senior executives and the Board is provided in Note 32.
Note 48 Fees to auditors
2011 2010
Fees to Deloitte
Auditing 1.0 0.8Auditing assignments in addition to auditing 0.5 0.1Tax advice 0.1 0.1Other services — —Total fees to Deloitte 1.6 1.0
Auditing refers to the auditors’ remuneration for the statutory audit. Auditing assignments in addition to auditing constitutes any examination of administra-tion or financial information resulting from statutes, the Articles of Association, regulations or agreements which result in a report or some other document intended to form a basis for assessment for a party other than the ordering client, as well as advice or other assistance prompted by observations in an auditing assignment. An example of an auditing assignment that is not part of the audit is the auditors’ general review of an interim report. Tax advice is self evident. Other services are advice not related to any of the previously specified services.
Note 49 Current receivables from Group companies
The company is part of Gunnebo Treasury AB’s Group account system whereby the company’s authorised credit amounts to MSEK 107.3. The liability at the end of the year totalled MSEK 6.2 (8.3) and is net accounted in the item ‘Current receivables from Group companies’.
Note 50 Transactions with related parties
Of the parent company’s invoiced sales, 98% (99%) related to Group companies, while purchases from Group companies accounted for 19% (8%) of the total. A royalty of MSEK 1.0 (1.0) was received from Chubb Malaysia Bnd Sdn, an associ-ated company.
Information on remuneration to Board members is provided in Note 32. Over and above these, there were no other transactions with related parties.

72
>> FINANCIAL REPORTING > PROPOSED DISTRIBUTION OF EARNINGS
PROPOSED DISTRIBUTION OF EARNINGSUnrestricted equity in the parent company at the disposal ofthe Annual General Meeting:
Share premium reserve 439.1Retained earnings 131.2Profit for the year 97.6Total 667.9
The Board and the Chief Executive Officer propose:
that a dividend of SEK 1.00 per share be paid to shareholders* 75.9and that the remaining sum be carried forward 592.0Total 667.9
* For shareholders registered with VPC, the proposed record date for dividends is May 2, 2012. The number of shares carrying entitlement to dividends on the record date is estimated to amount to 75,855,598.
The Board’s statement: The Board has proposed a dividend of SEK 1.00 per share, or atotal of approximately MSEK 76. As a result of the dividend, unrestricted equity will bealtered in the manner described above. The company and the Group maintain a solidfinancial position. The proposed dividend is comfortably covered by unrestricted equityand is in line with the company’s dividend policy. Furthermore, the company and the
Group will maintain a satisfactory equity ratio and liquidity following the proposed dividend. With reference to the above, the content of the Board of Directors’ Report andwhat has otherwise come to the Board’s attention, it is the opinion of the Board that theproposed dividend is justifiable with reference to the demands that the nature, scale andrisks associated with its operations place on the amount of the company’s and Group’sequity and the company’s and Group’s consolidation requirements, liquidity and positionotherwise. No amount of the Parent Company’s equity on the closing date is dependentupon assets and liabilities being measured at fair value in accordance with Chapter 4,Section 14 of the Annual Accounts Act.
Gothenburg, March 2, 2012
Martin SvalstedtChairman
Göran Bille Bo Dankis Björn Eriksson Mikael Jönsson Katarina MellströmBoard member Board member Board member Board member Board member
Bo Anders Hansson Per Borgvall Crister CarlssonBoard member President and CEO Board member
Our audit report was submitted on March 2, 2012Deloitte AB
Jan NilssonAuthorised Public Accountant
The Board of Directors and President hereby give their assurance that the consolidated financial statements have been prepared in accordance with the InternationalFinancial Reporting Standards (IFRS) adopted by the EU and provide a true and fair view of the financial position and result of the Group. The annual accounts have beenprepared in accordance with generally acceptable accounting principles and thus provide a true and fair view of the financial position and results of the Parent Company.The Board of Directors’ Report for the Group and the Parent Company provides a true and fair view of the Group’s and the Parent Company’s operations, financial positionsand results and describe the significant risks and uncertainties facing the Parent Company and the companies included in the Group.

73
AUDITOR’S REPORTTo the annual meeting of the shareholders of Gunnebo ABCorporate identity number 556438-2629
This is a direct translation of the Swedish Audit Report.
Report on the annual accounts and consolidated accountsWe have audited the annual accounts and consolidated accounts of Gunnebo AB for the year 2011. The annual accounts and consolidated accounts of the company are included in the printed version of this document on pages 34–72.
Responsibilities of the Board of Directors and the Managing Director
for the annual accounts and consolidated accounts
The Board of Directors and the Managing Director are responsible for the prepa-ration and fair presentation of these annual accounts and consolidated accounts in accordance with International Financial Reporting Standards, as adopted by the EU, and the Annual Accounts Act, and for such internal control as the Board of Directors and the Managing Director determine is necessary to enable the preparation of annual accounts and consolidated accounts that are free from material misstatement, whether due to fraud or error.
Auditor’s responsibility
Our responsibility is to express an opinion on these annual accounts and consol-idated accounts based on our audit. We conducted our audit in accordance with International Standards on Auditing and generally accepted auditing standards in Sweden. Those standards require that we comply with ethical requirements and plan and perform the audit to obtain reasonable assurance about whether the annual accounts and consolidated accounts are free from material misstate-ment. An audit involves performing procedures to obtain audit evidence about the amounts and disclosures in the annual accounts and consolidated accounts. The procedures selected depend on the auditor’s judgement, including the assess-ment of the risks of material misstatement of the annual accounts and consoli-dated accounts, whether due to fraud or error. In making those risk assessments, the auditor considers internal control relevant to the company’s preparation and fair presentation of the annual accounts and consolidated accounts in order to design audit procedures that are appropriate in the circumstances, but not for the purpose of expressing an opinion on the effectiveness of the company’s internal control. An audit also includes evaluating the appropriateness of accounting policies used and the reasonableness of accounting estimates made by the Board of Directors and the Managing Director, as well as evaluating the overall presentation of the annual accounts and consolidated accounts. We believe that the audit evidence we have obtained is sufficient and appro-priate to provide a basis for our audit opinion.
Opinions
In our opinion, the annual accounts have been prepared in accordance with the Annual Accounts Act and present fairly, in all material respects, the financial position of the parent company as of 31 December 2011 and of its financial performance and its cash flows for the year then ended in accordance with the Annual Accounts Act, and the consolidated accounts have been prepared in
accordance with the Annual Accounts Act and present fairly, in all material respects, the financial position of the group as of 31 December 2011 and of their financial performance and cash flows in accordance with International Financial Reporting Standards, as adopted by the EU, and the Annual Accounts Act. The statutory administration report is consistent with the other parts of the annual accounts and consolidated accounts. We therefore recommend that the annual meeting of shareholders adopt the income statement and balance sheet for the parent company and the group.
Report on other legal and regulatory requirementsIn addition to our audit of the annual accounts and consolidated accounts, we have examined the proposed appropriations of the company’s profit or loss and the administration of the Board of Directors and the Managing Director of Gunnebo AB for the year 2011.
Responsibilities of the Board of Directors and the Managing Director
The Board of Directors is responsible for the proposal for appropriations of the company’s profit or loss, and the Board of Directors and the Managing Director are responsible for administration under the Companies Act.
Auditor’s responsibility
Our responsibility is to express an opinion with reasonable assurance on the proposed appropriations of the company’s profit or loss and on the administra-tion based on our audit. We conducted the audit in accordance with generally accepted auditing standards in Sweden. As a basis for our opinion on the Board of Directors’ proposed appropriationsof the company’s profit or loss, we examined the Board of Directors’ reasoned statement and a selection of supporting evidence in order to be able to assess whether the proposal is in accordance with the Companies Act. As a basis for our opinion concerning discharge from liability, in additionto our audit of the annual accounts and consolidated accounts, we examined significant decisions, actions taken and circumstances of the company in order to determine whether any member of the Board of Directors or the Managing Director is liable to the company. We also examined whether any member of the Board of Directors or the Managing Director has, in any other way, acted in contravention of the Companies Act, the Annual Accounts Act or the Articles ofAssociation. We believe that the audit evidence we have obtained is sufficient and appro-priate to provide a basis for our opinion.
Opinions
We recommend to the annual meeting of shareholders that the profit be appro-priated in accordance with the proposal in the statutory administration report and that the members of the Board of Directors and the Managing Director be discharged from liability for the financial year.
Gothenburg, March 2, 2012 Deloitte AB
Jan NilssonAuthorised Public Accountant

74
>> CORPORATE GOVERNANCE > CORPORATE GOVERNANCE REPORT
Corporate governance structured around the Group’s operations is essential to commercial success and increased profitability. In 2011, Gunnebo endeavoured to adapt the governance of the Group so that it best supports the Group strategy and the new organisation which was fully implemented on 1 January 2011.
CORPORATE GOVERNANCE REPORT
G
OVERVIEW OF GUNNEBO’S CORPORATE GOVERNANCE
ShareholdersAnnual General Meeting
Nominations Committee
External auditors Board of Directors Remuneration Committee
Audit CommitteeFinance Committee
President & CEO and Group Executive Team
Operational boards
Management teams of the Business Areas, sales regions, sales companies, Operations and Business Units within Developing Businesses
Corporate Functions
Important external regulationsSwedish lawNASDAQ OMX Stockholm AB rules for issuersSwedish Code of Corporate Governance
Important internal governing documentsArticles of AssociationInstructions and procedures (Board, CEO and Board committees)Policies and guidelinesThe Group Code of Conduct and Core Values
unnebo AB (publ) is listed on the NASDAQ OMX Nordic Exchange Stockholm and, in addition to Swedish law, the Group’s corporate governance is based on the Swedish Code
of Corporate Governance (referred to below as “the Code”), NASDAQ OMX Stockholm AB’s Rule Book for Issuers and the Swedish Securities Council’s statements.
This Report summarises the structure of corporate governance and how corporate governance has been performed and developed within
For more information Swedish Companies Act, www.regeringen.se
Nasdaq OMX Stockholm, www.nasdaqomxnordic.com
the Group during the 2011 financial year. Gunnebo complies with the regulations of the Code in all respects.
Governance and division of responsibilitiesEffective corporate governance involves a well-defined division of duties and responsibilities, transparency vis-à-vis the shareholders and efficient governance and control of the Group’s operations to ensure that it meets established targets. The following groups are
Swedish Code of Corporate Governance and special
rules for corporate governance:
www.corporategovernanceboard.se

75
primarily in charge of the governance, management, control and divi-sions of responsibilities at Gunnebo:
Shareholders Board of DirectorsPresident Group Executive TeamOperational boardsManagement teams of the Business Areas, sales regions, sales companies, Operations and Business Units within Developing BusinessesCorporate functions
Shareholders At year-end 2011, the number of shareholders in Gunnebo amounted to 10,196. The percentage of Swedish financial ownership was approximately 24% and foreign ownership was 11%. Some 12% of the share capital was owned by Swedish natural persons, meaning that 88% of the company was owned by legal entities or foreign nat-ural persons. A table of shareholders representing holdings of 0.5% or more of the share capital and further information about Gunnebo’s ownership structure is available under the section “The Gunnebo Share” on pages 92–93.
General MeetingsShareholders exercise their influence at the Annual General Meeting or, if held, at Extraordinary General Meetings, which are Gunnebo’s highest decision-making bodies. All shareholders registered in the transcript or other statement of the shareholders’ register and who have registered their attendance at the Meeting before the stipu-lated deadline in the notice to attend are entitled to participate in the Meeting and exercise full voting rights. Shareholders who are unable to attend the Meeting in person may appoint a proxy.
Shareholders wishing to have an issue addressed by a General Meeting should submit their request to the Chairman of the Board by e-mail to [email protected] or by post to Gunnebo AB to the address printed on the back cover of this Annual Report.
2011 Annual General MeetingThe 2011 Annual General Meeting was held on 28 April at the Chalmers Student Union building in Gothenburg. A total of 60 share-holders took part in the Meeting, together representing 59.8% of the number of shares and votes in the company.
Martin Svalstedt, Göran Bille, Bo Dankis, Björn Eriksson, Mikael Jönsson and Katarina Mellström were re-elected as members of the Board of Directors. The Annual General Meeting also re-elected Martin Svalstedt as Chairman of the Board. In addition to resolutions in ordinary matters, the Annual General Meeting resolved on guide-lines for remuneration to senior executives, the introduction of a
share-based incentive programme for senior executives and key individuals, and an amendment of the Articles of Association. The Annual General Meeting resolved on a dividend of SEK 0.50 per share to the shareholders.
2012 Annual General MeetingThe next Annual General Meeting for shareholders of Gunnebo will be held at the Liseberg Theatre, Örgrytevägen 5 in Gothenburg on 26 April 2012. More information about the Annual General Meeting is available on the back cover of this annual report and will be pub-lished on www.gunnebogroup.com.
Nomination Committee The task of the Nomination Committee is to present proposals to the Annual General Meeting for decisions in such matters as the election of the Chairman of the Meeting, Board members (number, name and Chairman), fess to the Board of Directors, remuneration for Committee work, auditor’s fees and procedures for the appointment of the Nomination Committee and, where applicable, the election of auditor. It was decided at the 2011 Annual General Meeting that, for the period until the 2012 Annual General Meeting, Gunnebo’s Nomination Committee would consist of one representative from each of the three largest shareholders as of 30 September 2011 as well as the Chairman of the Board.
This means that the following shareholder representatives consti-tuted the Nomination Committee for the period until the 2012 Annual General Meeting: Dan Sten Olsson (Stena Adactum AB), Nils-Olov Jönsson (Vätterledens Invest AB), Ricard Wennerklint (If Skadeförsäkrings AB) and Martin Svalstedt, Chairman of the Board and convener. The Chairman of the Nomination Committee is Dan Sten Olsson.
In the Nomination Committee’s opinion, all of the Committee members are independent of the company and its executive management. Furthermore, Nils-Olov Jönsson and Ricard Wenner-klint are independent of the company’s largest shareholder. At the end of the third quarter, the Nomination Committee represented 57% of the number of shares and votes in the company.
No remuneration is paid by the company to the members for their work on the Nomination Committee. The Nomination Committee held one meeting prior to the date of this Annual Report.
Contact the Nomination Committee by post to Gunnebo AB to the address printed on the back cover of this Annual Report or by e-mail to [email protected].
Board of Directors The overall task of the Board of Directors is to manage the interests of the shareholders. It is also the Board’s duty and responsibility to ensure that this Corporate Governance Report is prepared. The

76
>> CORPORATE GOVERNANCE > CORPORATE GOVERNANCE REPORT
Articles of Association stipulate that the Board shall comprise no fewer than five and no more than seven members, with no more than two deputies.
The 2011 Annual General Meeting resolved that, for the period until the 2012 Annual General Meeting, Gunnebo’s Board would comprise six ordinary members and no deputies. In addition, Gunnebo’s Swedish trade unions are entitled to appoint two ordinary Board members, each with one deputy.
The Chairman of the Board is appointed by the Annual General Meeting. None of Gunnebo’s senior executives are members of the Board. The Group’s President and CEO, and the CFO, participate at Board meetings, the latter also serving as secretary. Furthermore, other senior executives participate at meetings whenever required.
Independence of Board membersPursuant to the Code, the majority of Board members elected at the Annual General Meeting must be independent of the company and its executive management. At least two members who are independ-ent of the company and its executive management must also be independent of the company’s major shareholders. The sharehold-ings of the individual Board members and their independence of the company, its executive management and the major shareholders, and other significant professional commitments are presented in the table on page 79.
The Board’s rules of procedureThe Board’s work is primarily governed by the Swedish Companies Act, the Code and the Board’s rules of procedure. The rules of proce-dure are adopted every year at the statutory meeting of the Board and the current rules of procedure state that the Board shall hold at least five scheduled meetings between Annual General Meetings and describe the matters to be addressed at each meeting. The rules of procedure also outline the division of work and responsibilities between the Board, the Chairman, the Committees and the Presi-dent. The Board’s tasks include establishing strategies, business plans, operational targets, interim reports and year-end reports. Further-more, it is the Board’s duty to decide on significant changes to the organisation of Gunnebo and its business activities and continuously evaluate the work of the President.
Meetings’ reportIn 2011, the Board held ten scheduled and two extra meetings at which minutes were taken. During these meetings, reports from the President, the accounts at the close of interim periods, the budgets for 2011 and 2012, interim and annual reports, financial statements,
reports from the Board’s Committees and the Nomination Commit-tee, and items pertaining to the Annual General Meeting were addressed. The following topics were also discussed:
Follow-up of the Get It Right action programmeStrategic issues Investment issuesNew financingDivestment of Perimeter Protection Corporate acquisitions Investments in China and India Board evaluationsEvaluation of CEO Rules of procedure
No Board members registered reservations against any decisions dur-ing the year.
Evaluation of the Board’s workThe work of the Board is evaluated every year by a survey, the results of which form the basis for continuous improvements to the Board’s work. The evaluation includes issues regarding the composition of the Board, meetings, material, Committees and the manner in which the Chairman of the Board and the Board perform their main duties in accordance with the Code.
ChairmanMartin Svalstedt was re-elected the Chairman of the Board of Directors at the Annual General Meeting held on 28 April 2011. It is the Chairman of the Board’s responsibility to ensure that the Board’s work is conducted efficiently. This includes ensuring that the Board com-pletes its duties, and monitoring the progress of the company and ensuring that the other members continuously receive the information required for the Board to perform its work to the necessary standard and in accordance with the relevant regulations. The Chairman does not participate in the operational management of the company.
PresidentPer Borgvall is the CEO of Gunnebo and leads the company in accord-ance with the rules of procedure adopted by the Board. The CEO is also responsible for ensuring that the Board receives the information and material necessary for making decisions. Furthermore, he presents reports at Board meetings and continuously keeps the Board and Chairman informed of the Group’s and company’s finan-cial position and performance. The President’s work in 2011 focused on implementing the strat-egy prepared and implemented in 2010. This process encompassed

77
the introduction of a new organisation and, from the first quarter of 2011, also changes to the reporting structure. These changes were carried out to create an organisation that sup-ports the new strategy and has a greater focus on business. During the year, the CEO also developed an acquisition strategy and imple-mented a number of activities that support the growth of the Group’s business outside Europe.
Group Executive TeamThe implementation of the new strategy has entailed that the com-position of Gunnebo’s Group Executive Team changed three times during the year. All changes made were communicated by press releases and are available on www.gunnebogroup.com (the Group’s website). The Group Executive Team presented on pages 84–85 of this Annual Report is the composition as of 1 March 2012 and comprises the President and the Senior Vice Presidents of the Business Areas, the Regions of EMEA and the Americas and Operations, and the CFO.
The task of the Group Executive Team is to establish, implement and monitor strategies and guidelines for the Group’s operations fol-lowing decisions made by the Board. This work is ensured by having the SVPs of the Business Areas, Regions and Operations represented in the Group Executive Team.
The Group Executive Team’s work in 2011 focused on implement-ing the chosen strategy, the divestment of Perimeter Protection, corporate acquisitions, business development, purchasing savings and the formulation of Gunnebo’s new service offering. The Group Executive Team is also responsible for continuously assessing and deciding on the tenders Gunnebo submits for major transactions.
New organisationGunnebo implemented a new organisation from 1 January 2011 to support the new strategy and contribute to intensifying focus on business activities. The organisation is based on four Business Areas: Bank Security & Cash Handling, Secure Storage, Global Services and Entrance Control; three sales regions – EMEA (Europe, Middle East and Africa), Americas and Asia, which encompass the Group’s 31 sales companies; Operations, which is responsible for production, purchas-ing, logistics, quality and environmental issues, and Developing Busi-nesses (SafePay, Gateway and Perimeter Protection, where the latter was divested in September 2011). The new organisation also comprises the Group’s operating report-ing structure from 1 January 2011.
Operational managementGunnebo’s operational management comprises the four Business Areas Bank Security & Cash Handling, Secure Storage, Global Services
and Entrance Control, as well as Operations, the two management groups within Developing Businesses (the third, Perimeter Protection, was divested during the year) and the 31 sales companies, which are divided into the regions of EMEA, Americas and Asia Pacific.
Operational BoardsEach region, sales company and Business Area, as well as Operations and Developing Businesses, has an operational board. These boards are responsible for controlling their respective operations and are bodies under the Group Executive Team, which is responsible for the operational governance of the Group. The President, the SVPs of the Business Areas and regions, and the SVP Operations share the Chair-manship of the operational boards. Other members of the opera-tional boards are representatives from the respective management groups of each of these parts of the business.
The focus of the operational boards in 2011 was also on imple-menting the common strategy and adapting the business to the new organisation. In addition, the boards followed up on observations noted in internal and external audits.
Management teams of the Business Areas, sales regions, sales companies, Operations and Business Units within Developing BusinessesThe management groups of the Business Areas, sales regions, sales companies, Operations and the Business Units within Developing Businesses are responsible for the management of daily operations. These management groups comprise the three to five most impor-tant heads of corporate functions and the relevant SVP.
Corporate functionsGunnebo’s head office houses the corporate functions for the coordi-nation of Operations (research and development, production, environ-mental issues, quality, logistics and purchasing), finance, financial control, business control, legal affairs, IT, HR, communications and investor relations.
These functions are responsible for preparing relevant Group-wide strategies and business plans for their respective areas of responsibil-ity and for assisting and further developing the organisation based on their respective areas of expertise.
Committees During 2011, the Board of Directors of Gunnebo had three Commit-tees: the Remuneration Committee, the Audit Committee and the Finance Committee. The representatives sitting on these Commit-tees are appointed by the Board from among its own ranks.

78
>> CORPORATE GOVERNANCE > CORPORATE GOVERNANCE REPORT
meetings during the year. Issues including new financing and the Group financial policy were addressed during the year. The attend-ance of the committee members at meetings is presented in the table on page 79.
Financial reportingEach Business Area, sales region and sales company as well as Opera-tions and Developing Businesses report on their financial outcome every month. The major sales companies also report certain key fig-ures on a weekly basis. These reports are compiled by Gunnebo AB’s finance, financial control and business control corporate functions, and form the basis of further analyses and interim reporting to shareholders and the stock market.
Incentive programme The 2010 Annual General Meeting resolved to adopt an initial com-ponent of a “rolling” incentive programme comprising warrants (Incentive Programme 2010/2014). A total of 550,000 warrants were offered to 46 senior executives and other key individuals in the Group. The warrants were valued at market value externally in accordance with Black & Scholes valuation model and the price per warrant was set at SEK 3.30. A warrant entitles the holder to subscribe for a share in Gunnebo AB for SEK 32.00 during certain fixed periods during 2013–2014.
In conjunction with the 2011 Annual General Meeting, a second component of the “rolling” incentive programme (Incentive Pro-gramme 2011/2015) was adopted. A total of 575,000 warrants were offered to 49 senior executives and other key individuals in the Group. The warrants were valued at market value externally in accordance with Black & Scholes valuation model and the price per warrant was set at SEK 6.30. A warrant entitles the holder to sub-scribe for a share in Gunnebo AB for SEK 44.20 during certain fixed periods during 2014–2015.
Since the participants, within the scope of the above incentive pro-gramme, have been offered acquisition of warrants at market price, the programme is not deemed to entail any accounting salary costs or similar costs in accordance with IFRS 2 for the Group. However, costs in the form of social security charges may be payable in certain countries.
External auditGunnebo’s auditors are elected at the Annual General Meeting. The current election was conducted in 2008 and is valid until the 2012 Annual General Meeting. Deloitte was elected auditor at the 2008 Annual General Meeting with Jan Nilsson as Auditor in Charge. The auditors’ report on their audit to the Audit Committee and the Board of Directors. In addition to their standard audit assignments, Deloitte provides assistance in the form of advisory and investigative assign-
Remuneration CommitteeThe Remuneration Committee’s task includes preparing issues per-taining to the conditions of employment for the Group Executive Team, succession planning and other personnel development issues prepared by the Group Executive Team and the Group’s SVP HR. The Remuneration Committee also evaluates the application of the guidelines for remuneration to senior executives adopted by the Annual General Meeting. The Remuneration Committee follows writ-ten rules of procedure.
Following the Annual General Meeting held on 28 April 2011, the Committee comprised Martin Svalstedt (Chairman), Mikael Jönsson and Göran Bille. All of the members of the Remuneration Committee are independent of the company and company management and one member is also independent of the company’s major shareholders. The Remuneration Committee held two meetings in 2011. Issues including performance requirements, bonus models and the incen-tive programme for senior executives were discussed during the year.
The attendance of the members of the Audit Committee at meet-ings is presented in the table on page 79.
Audit CommitteeThe Audit Committee is a preparatory body for contact between the Board and the auditors. The Audit Committee follows written rules of procedure. The Committee’s duties also include examining and moni-toring the Group’s financial reporting, external reporting, internal control and ensuring the management and reporting of financial risks.
Following the Annual General Meeting held on 28 April 2011, the Committee comprised Bo Dankis (Chairman), Katarina Mellström and Björn Eriksson. All of the members of the Audit Committee are inde-pendent of the company, company management and the company’s major shareholders. The Committee held three meetings during the year. The Group’s auditors also participated at one Board meeting to present an account of their audit. Issues including the annual and interim accounts, the auditors’ audit, risk management and internal audit were discussed during the year. The attendance of the mem-bers of the Audit Committee at meetings is presented in the table on page 79.
Finance CommitteeThe Finance Committee’s main task is to prepare matters of a signifi-cant nature in the area of finance on issues concerning the compa-ny’s financing, financial policy, management of financial risks and so on. The Committee’s written rules of procedure are annually set by the Board.
In 2011, the Committee comprised Mikael Jönsson (Chairman) and Martin Svalstedt. Both of the members of the Finance Committee are independent of the company and company management, although not the company’s major shareholders. The Committee held two
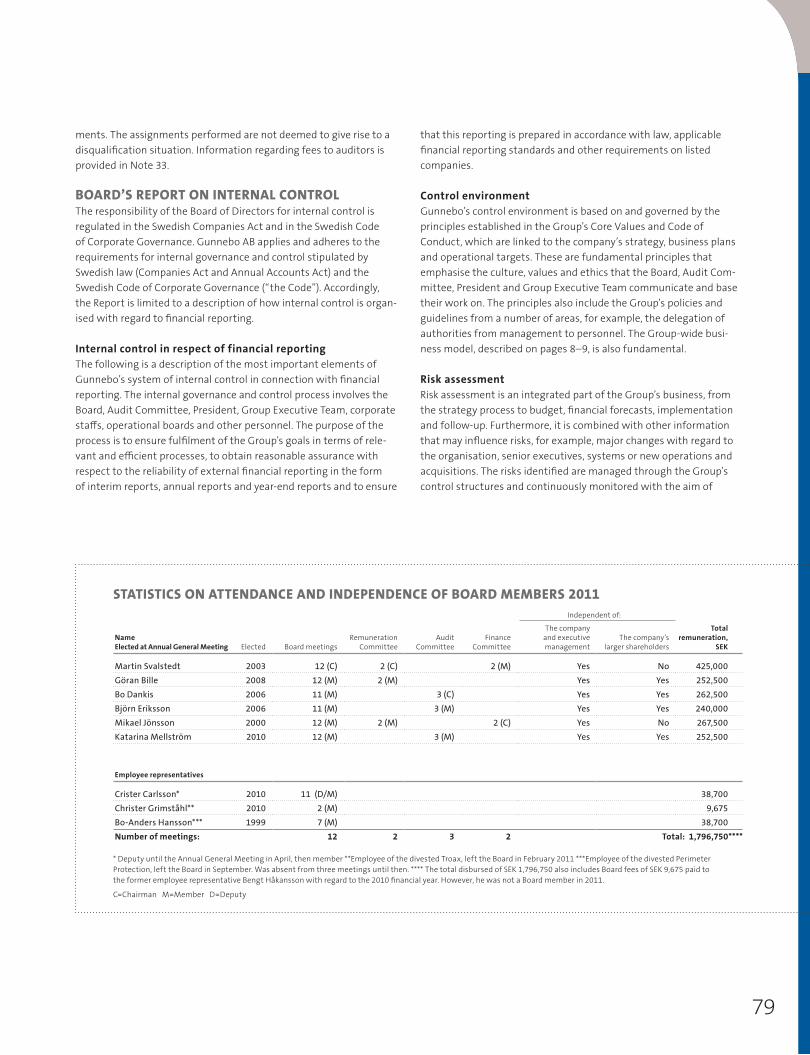
79
ments. The assignments performed are not deemed to give rise to a disqualification situation. Information regarding fees to auditors is provided in Note 33.
BOARD’S REPORT ON INTERNAL CONTROLThe responsibility of the Board of Directors for internal control is regulated in the Swedish Companies Act and in the Swedish Code of Corporate Governance. Gunnebo AB applies and adheres to the requirements for internal governance and control stipulated by Swedish law (Companies Act and Annual Accounts Act) and the Swedish Code of Corporate Governance (“the Code”). Accordingly, the Report is limited to a description of how internal control is organ-ised with regard to financial reporting.
Internal control in respect of financial reporting The following is a description of the most important elements of Gunnebo’s system of internal control in connection with financial reporting. The internal governance and control process involves the Board, Audit Committee, President, Group Executive Team, corporate staffs, operational boards and other personnel. The purpose of the process is to ensure fulfilment of the Group’s goals in terms of rele-vant and efficient processes, to obtain reasonable assurance with respect to the reliability of external financial reporting in the form of interim reports, annual reports and year-end reports and to ensure
STATISTICS ON ATTENDANCE AND INDEPENDENCE OF BOARD MEMBERS 2011Independent of:
NameElected at Annual General Meeting Elected Board meetings
Remuneration Committee
Audit Committee
Finance Committee
The company and executive management
The company’s larger shareholders
Total remuneration,
SEK
Martin Svalstedt 2003 12 (C) 2 (C) 2 (M) Yes No 425,000Göran Bille 2008 12 (M) 2 (M) Yes Yes 252,500Bo Dankis 2006 11 (M) 3 (C) Yes Yes 262,500Björn Eriksson 2006 11 (M) 3 (M) Yes Yes 240,000Mikael Jönsson 2000 12 (M) 2 (M) 2 (C) Yes No 267,500Katarina Mellström 2010 12 (M) 3 (M) Yes Yes 252,500
Employee representatives
Crister Carlsson* 2010 11 (D/M) 38,700Christer Grimståhl** 2010 2 (M) 9,675Bo-Anders Hansson*** 1999 7 (M) 38,700Number of meetings: 12 2 3 2 Total: 1,796,750****
* Deputy until the Annual General Meeting in April, then member **Employee of the divested Troax, left the Board in February 2011 ***Employee of the divested Perimeter Protection, left the Board in September. Was absent from three meetings until then. **** The total disbursed of SEK 1,796,750 also includes Board fees of SEK 9,675 paid to the former employee representative Bengt Håkansson with regard to the 2010 financial year. However, he was not a Board member in 2011.
C=Chairman M=Member D=Deputy
that this reporting is prepared in accordance with law, applicable financial reporting standards and other requirements on listed companies.
Control environmentGunnebo’s control environment is based on and governed by the principles established in the Group’s Core Values and Code of Conduct, which are linked to the company’s strategy, business plans and operational targets. These are fundamental principles that emphasise the culture, values and ethics that the Board, Audit Com-mittee, President and Group Executive Team communicate and base their work on. The principles also include the Group’s policies and guidelines from a number of areas, for example, the delegation of authorities from management to personnel. The Group-wide busi-ness model, described on pages 8–9, is also fundamental.
Risk assessment Risk assessment is an integrated part of the Group’s business, from the strategy process to budget, financial forecasts, implementation and follow-up. Furthermore, it is combined with other information that may influence risks, for example, major changes with regard to the organisation, senior executives, systems or new operations and acquisitions. The risks identified are managed through the Group’s control structures and continuously monitored with the aim of

80
>> CORPORATE GOVERNANCE > BOARD’S REPORT ON INTERNAL CONTROL
implementing measures, identifying and evaluating processes and ensuring good quality in financial reporting. More information about the Group’s risks is available in the section “Risk and Sensitivity Analysis” (pages 88–91) and in Note 3 Financial Risk Management and Financial Instruments.
Control activitiesControl activities are performed at various levels within Gunnebo. The Group Executive Team is ultimately responsible for implement-ing and ensuring that controls are performed at both a general and detailed operational level. This is achieved by on-going governance and control of the accounts and financial reporting carried out by the finance functions of the local companies, Business Areas and the finance corporate function in conjunction with reporting and consol-idation. The controller network in the various organisational units performs detailed financial analyses of earnings, key ratios, tied-up capital, trends and the follow-up of budgets and forecasts. In addi-tion, more detailed analyses are performed as required.
The Group’s risks with regard to financial reporting are related to the risk that material misstatements may arise in the reporting of the company’s financial position and performance. The company’s reporting instructions and established monitoring procedures aim to minimise these risks.
Information and communicationGunnebo’s external and internal information and communication in the form of reporting to various authorities, financial reporting and information to the Board and employees takes place in accordance with the requirements of the business environment, the Group’s internal governing documents and the Communications Policy. Accordingly, all external and internal information and communica-tion are to be appropriate, up-to-date and correct, and should be available to the target groups as and when required.
Internal informationInternal governing documents and guidelines pertaining to financial reporting are available to the relevant personnel on Gunnebo’s intranet and are also communicated at meetings and through other channels. The intranet contains policies, guidelines and specific instructions for financial reporting, internal control, closing of accounts, budget and forecasts.
The Gunnebo Training Centre (GTC) is a tool used for training and facilitating communication of, for example, the Group’s vision, tar-gets, strategies and ethical dilemmas linked to the Code of Conduct and Core Values.
The Board receives regular reports on the financial statements and earnings trends, analyses and comments on outcomes, plans and forecasts. It also receives feedback from Audit Committee meetings at which the auditors present the results of their audits. Additionally, there are various internal meeting forums, such as the International Management Conference (IMC), and internal boards that also include the monitoring of financial information and other important internal matters on their fixed agendas.
External informationInformation about the Group’s business is continuously communi-cated to external stakeholders on Gunnebo’s website, which contains publications, interim reports and other financial information, press releases and information about Gunnebo’s organisation and prod-ucts. This information is also supplemented by meetings with inves-tors and analysts, which are logged in an internal database.
MonitoringRegular monitoring of and reporting on operations is carried out at different levels by the Board, Audit Committee, Finance Committee, President, Group Executive Team, corporate finance function and operational boards. Monitoring of Group companies includes monthly and quarterly reviews of outcomes compared with budget and forecasts, the results of audits, etc. In addition to this, special efforts are monitored such as activities linked with the implementa-tion of the new strategy, acquisitions and divestments.
The Group’s internal control function is an integrated part of the corporate finance function.
Gunnebo has not established a separate internal audit function to date. The Board, which annually evaluates the need for such a func-tion, has deemed that existing structures for monitoring, control and evaluation provide satisfactory documentation. For some special audits, external efforts may be conducted.
See the section “Information for the Capital Market” on pages 86–87 for information about how communication and monitoring of the Group’s financial reporting are carried out externally.

81
To the Annual General Meeting of Gunnebo ABCorporate Registration Number 556438-2629
This is a direct translation of the Swedish statement.
It is the Board of Directors who is responsible for the Corporate Governance Report for the year 2011 included in the printed version of this document on pages 74–80 and that it has been prepared in accordance with the Annual Accounts Act.
We have read the Corporate Governance Report and based on that reading and our knowledge of the company and the group we believe
that we have a sufficient basis for our opinions. This means that our statutory examination of the Corporate Governance Report is differ-ent and substantially less in scope than an audit conducted in accordance with International Standards on Auditing and generally accepted auditing standards in Sweden.
In our opinion, the Corporate Governance Report has been prepared and its statutory content is consistent with the annual accounts and the consolidated accounts.
AUDITOR’S REPORT ON THE CORPORATE GOVERNANCE REPORT
Gothenburg, March 2, 2012DELOITTE AB
Jan NilssonAuthorised Public Accountant
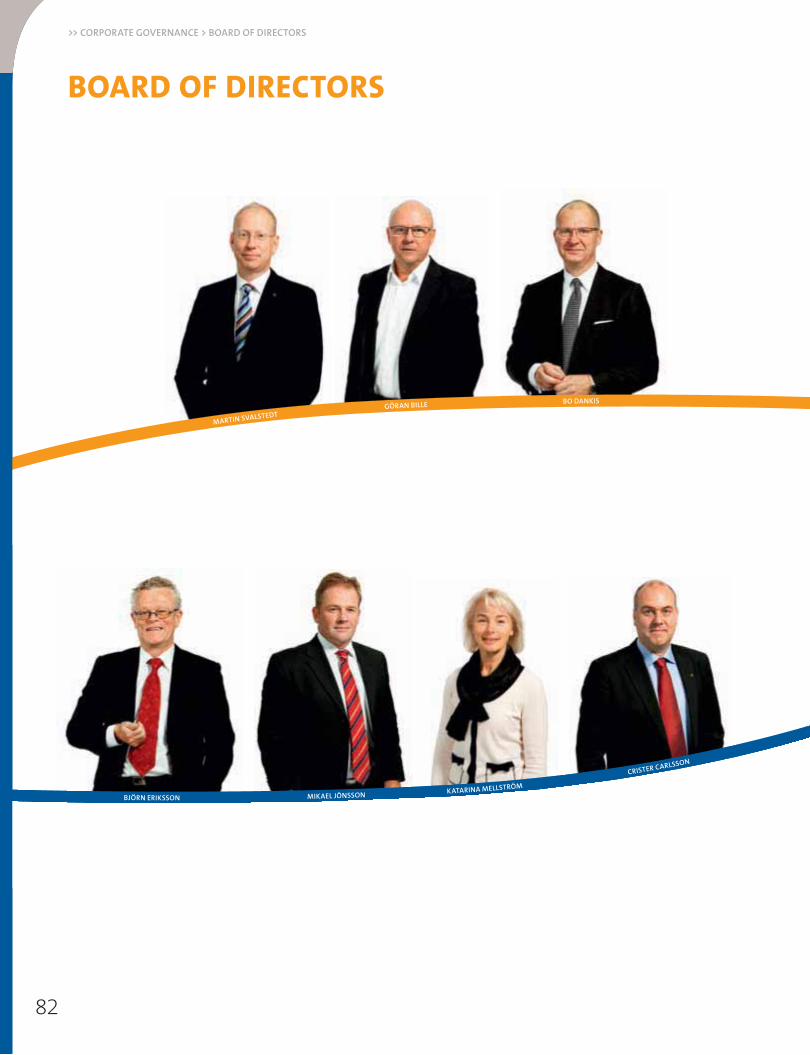
82
>> CORPORATE GOVERNANCE > BOARD OF DIRECTORS
BOARD OF DIRECTORS
MARTIN SVALSTEDTGÖRAN BILLE BO DANKIS
BJÖRN ERIKSSON MIKAEL JÖNSSON KATARINA MELLSTRÖM
CRISTER CARLSSON
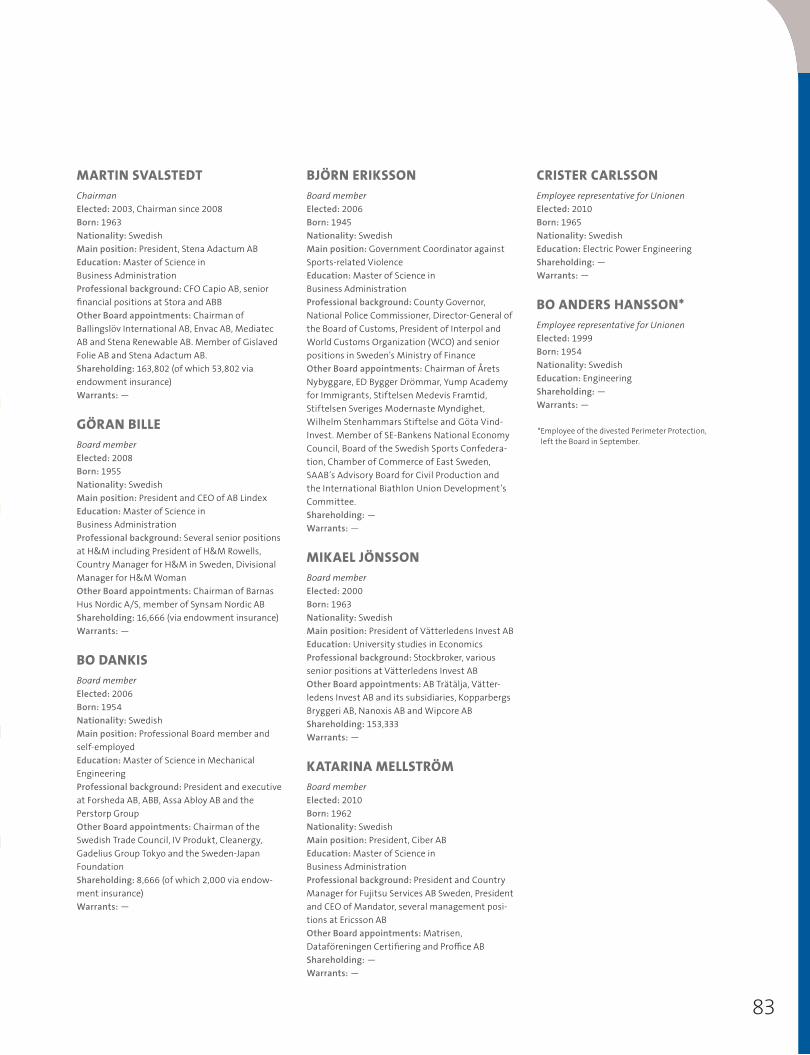
83
MARTIN SVALSTEDTChairman
Elected: 2003, Chairman since 2008Born: 1963Nationality: SwedishMain position: President, Stena Adactum ABEducation: Master of Science in Business AdministrationProfessional background: CFO Capio AB, senior financial positions at Stora and ABBOther Board appointments: Chairman of Ballingslöv International AB, Envac AB, Mediatec AB and Stena Renewable AB. Member of Gislaved Folie AB and Stena Adactum AB.Shareholding: 163,802 (of which 53,802 via endowment insurance)Warrants: —
GÖRAN BILLEBoard member
Elected: 2008Born: 1955Nationality: SwedishMain position: President and CEO of AB LindexEducation: Master of Science in Business AdministrationProfessional background: Several senior positions at H&M including President of H&M Rowells, Country Manager for H&M in Sweden, Divisional Manager for H&M WomanOther Board appointments: Chairman of Barnas Hus Nordic A/S, member of Synsam Nordic AB Shareholding: 16,666 (via endowment insurance)Warrants: —
BO DANKISBoard member
Elected: 2006Born: 1954Nationality: SwedishMain position: Professional Board member and self-employedEducation: Master of Science in Mechanical EngineeringProfessional background: President and executive at Forsheda AB, ABB, Assa Abloy AB and the Perstorp GroupOther Board appointments: Chairman of the Swedish Trade Council, IV Produkt, Cleanergy, Gadelius Group Tokyo and the Sweden-Japan FoundationShareholding: 8,666 (of which 2,000 via endow-ment insurance)Warrants: —
BJÖRN ERIKSSONBoard member
Elected: 2006Born: 1945Nationality: SwedishMain position: Government Coordinator against Sports-related ViolenceEducation: Master of Science in Business AdministrationProfessional background: County Governor, National Police Commissioner, Director-General of the Board of Customs, President of Interpol and World Customs Organization (WCO) and senior positions in Sweden’s Ministry of FinanceOther Board appointments: Chairman of Årets Nybyggare, ED Bygger Drömmar, Yump Academy for Immigrants, Stiftelsen Medevis Framtid, Stiftelsen Sveriges Modernaste Myndighet, Wilhelm Stenhammars Stiftelse and Göta Vind-Invest. Member of SE-Bankens National Economy Council, Board of the Swedish Sports Confedera-tion, Chamber of Commerce of East Sweden, SAAB’s Advisory Board for Civil Production and the International Biathlon Union Development’s Committee.Shareholding: —Warrants: —
MIKAEL JÖNSSONBoard member
Elected: 2000Born: 1963Nationality: SwedishMain position: President of Vätterledens Invest ABEducation: University studies in EconomicsProfessional background: Stockbroker, various senior positions at Vätterledens Invest AB Other Board appointments: AB Trätälja, Vätter-ledens Invest AB and its subsidiaries, Kopparbergs Bryggeri AB, Nanoxis AB and Wipcore AB Shareholding: 153,333Warrants: —
KATARINA MELLSTRÖMBoard member
Elected: 2010Born: 1962Nationality: SwedishMain position: President, Ciber ABEducation: Master of Science in Business AdministrationProfessional background: President and Country Manager for Fujitsu Services AB Sweden, President and CEO of Mandator, several management posi-tions at Ericsson AB Other Board appointments: Matrisen, Dataföreningen Certifiering and Proffice ABShareholding: —Warrants: —
CRISTER CARLSSONEmployee representative for Unionen
Elected: 2010Born: 1965Nationality: SwedishEducation: Electric Power Engineering Shareholding: —Warrants: —
BO ANDERS HANSSON*Employee representative for Unionen
Elected: 1999Born: 1954Nationality: SwedishEducation: EngineeringShareholding: —Warrants: —
* Employee of the divested Perimeter Protection, left the Board in September.

84
>> CORPORATE GOVERNANCE > GROUP EXECUTIVE TEAM
PER BORGVALLPresident and CEO
Employed: 2009Born: 1958Nationality: SwedishEducation: Master of Science in Civil Engineering, Chalmers 1982Professional background: President and CEO of AB Fagerhult, Divisional President of the Indoor Climate division of IMI Plc, President of Tour & Andersson AB and Uponor AB.Board appointments: Nederman Holding AB Shareholding: 130,000 (of which 98,000 via endowment insurance)Warrants: 60,000
ANNA ALMLÖFSVP Global Services
Employed: 2011Born: 1967Nationality: SwedishEducation: MSc in Business Administration from Stockholm School of Economics and Executive MBA from Instituto de Empresa, MadridProfessional background: Director of Product Management, Ericsson Global Services and other senior sales and service positions at Ericsson and Unisys in Sweden and abroad.Board appointments: —Shareholding: —Warrants: 5,000
MORTEN ANDREASENSVP Region EMEA (Europe, Middle East and Africa)
Employed: 2012 (began 16 January)Born: 1958Nationality: DanishEducation: MSc in Business Administration from-Copenhagen Business School and PED from IMD (Lausanne)Professional background: President Munters Moisture Control Services (MCS), Senior Vice Presi-dent Lufthansa Service Gesellschaft (LSG), and CEO TOP Flight Catering. Board appointments: Kosan Crisplant A/SShareholding: 5,000Warrants: —
CHRISTIAN GUILLOUSVP Business Area Bank Security & Cash Handling,
SVP Business Area Secure Storage
Employed: 2008Born: 1967Nationality: FrenchEducation: Paris ESLSCA Business School, IMD (marketing degree), INSEAD (general management & strategy degree)Professional background: Senior positions at Franciaflex, BPB Placo and Pergo.Board appointments: —Shareholding: 7,941Warrants: 20,000
ROBERT HERMANSSVP Business Area Entrance Control
Employed: 1996Born: 1968Nationality: SwedishEducation: MSc in Business Administration and MBA, HHSProfessional background: Country Manager Gunnebo South Africa, President Gunnebo Lifting, Managing Director Cargo Control Systems (South Africa) and other senior management positions in marketing and sales in the Gunnebo Industries Group.Board appointments: Tsarmedia AB and Satpack Travel, South AfricaShareholding: 2,000Warrants: 20,000
BERNT INGMAN*CFO
Employed: 2012 (acting)Born: 1954Nationality: SwedishEducation: INSEAD/CEDEP (France), MsC in Business Administration, Uppsala University Professional background: CFO Husqvarna AB and Munters AB. Executive Vice President Inter Scan Group, senior management positions within finance and administration within Metric Group, Carlor Vanadis AB and Celpap International AB. Board appointments: Chairman Schneidler-företagen AB, board member G & L Beijer AB Shareholding: —Warrants: —
*Replaced Fredrik Östman March 1, 2012
GROUP EXECUTIVE TEAMBJÖRN NERGÅRDSVP Operations
Employed: 2011Born: 1948Nationality: SwedishEducation: Bachelor of Science in Economics and Behavioural ScienceProfessional background: Many years’ experience of managing change in production operations from the Cardo Group and Plc. Forsheda. Board appointments: —Shareholding: —Warrants: —
TOMAS WÄNGBERGSVP Business Development, SVP Region Americas
Employed: 2009Born: 1958Nationality: SwedishEducation: Marine Engineering, Chalmers 1981 Professional background: President and CEO ABS Group, AB Pharmadule, ABB Carbon AB; senior positions in marketing, sales and production management at ABB .Board appointments: —Shareholding: 2,850Warrants: 40,000

85
PER BORGVALL
CHRISTIAN GUILLOUMORTEN ANDREASEN ROBERT HERMANS
ANNA ALMLÖF TOMAS WÄNGBERGBERNT INGMAN
BJÖRN NERGÅRD

86
>> CAPITAL MARKET > INFORMATION FOR THE CAPITAL MARKET
unnebo’s objective is to provide the market with open, con-sistent and transparent financial information. All external and internal communication shall be fair and appropriate.
Relevant information shall be made accessible to all stakeholders simultaneously and at the time promised.
Communication in the form of reporting to various authorities, financial reporting and information for employees, takes place in accordance with external rules and requirements, the Group’s inter-nal governing documents, and IR and communication policies.
Information channelsGunnebo AB’s website, www.gunnebogroup.com, contains publica-tions, financial information, press releases, and information about Gunnebo’s organisation and offering.
Shareholders are asked what information they would like to see from the company and therefore make an active choice in receiving the required information. The information channel available to shareholders, in addition to interim reports and annual reports, is the customer magazine Global. Shareholders can also participate at Gunnebo’s Annual General Meeting.
Questions may be sent directly to [email protected] or submit-ted by telephone on +46 10 209 50 00. It is also possible to order printed annual reports and interim reports from the Group head office on +46 10 209 50 00, from the website or via the aforemen-tioned e-mail address.
Annual General MeetingGunnebo’s Annual General Meeting will be held at 4.00 pm CET on Thursday April 26, 2012 at Liseberg Theatre, Örgrytevägen 5, Gothenburg, Sweden.
RegistrationShareholders who wish to participate in the Annual General Meeting must have their names entered in the register of shareholders maintained by Euroclear AB by no later than April 20, 2012, and must notify Gunnebo AB by no later than 4.00 pm CET on April 20, 2012, either online at www.gunnebogroup.com, by post to Gunnebo AB, Box 5181, SE-402 26 Göteborg, by fax on +46 10 209 50 10, or by phone on +46 10 209 50 00. Shareholders whose shares are regis-
tered in nominee names must, if they wish to exercise their right to vote at the Meeting, have their shares re-registered in their own names by April 20, 2012.
DividendThe Board and the President propose a dividend of SEK 1.00 (0.50) for 2011.
IR policyThe goal of Gunnebo’s IR activities is, through communication activi-ties, to help give all stakeholders as fair a picture as possible of the Group’s business and financial results.
Building trust with the market lays the foundations for a smoothly functioning internal reporting system that provides fast, accurate reporting from all the Group’s businesses.
Gunnebo keeps important financial information secret until it is disclosed – simultaneously and consistently – to the stock market and to OMX Nordic/Stockholm Stock Exchange.
All external financial information about Gunnebo is handled centrally. Financial reports are distributed by Group Communications with comments from the President and CEO, the Chief Financial Officer and the Communications Director. One of these people is always available.
Confidence in the Gunnebo share is based on compliance with OMX Nordic/Stockholm Stock Exchange rules for listed companies and on Gunnebo’s ability and willingness to provide clear, compre-hensive information.
Activities 2011During the year, Gunnebo has held around 35 individual meetings with analysts and has arranged roadshows to Stockholm, Gothen-burg, Copenhagen, London and Kunshan, China. The company has also participated in six seminars, breakfast, lunch or dinner meetings and three shareholder meetings, and has taken part in lectures at the Swedish Shareholders’ Association’s Stock Market and Funds Day in Gothenburg.
After each interim report Gunnebo arranges a telephone confer-ence with around 20–30 participants. The conference is recorded and is available via the website for a month after the report date.
Gunnebo strives to give all stakeholders as fair a picture as possible of the Group’s business and financial results. The goal is to provide owners and the stock market with information that supports these parties in the process of evaluating Gunnebo’s business.
INFORMATION FOR THE CAPITAL MARKET
G

87
Profitability goalsGunnebo’s financial goals have remained unchanged since 2005.
Gunnebo shall earn a long-term return on capital employed of at least 15% and an operating margin of at least 7%.The Group shall achieve organic growth of at least 5% a year. The equity ratio shall not fall below 30%.
With the current capital structure, an operating margin of 7% equates to a return on capital employed in excess of 15%.
The capital structure of the GroupOne of Gunnebo’s long-term financial goals is to have an equity ratio of no less than 30%. The equity ratio at the end of the year was 45%. Another of Gunnebo’s aims is to achieve a return of at least 15% on
capital employed. The return on capital employed for 2011 was 13.5%.Gunnebo’s borrowing is mostly unsecured. Borrowing is limited, however, by financial obligations in the loan agreements in the form of covenants. These mainly relate to the key ratios of interest cover-age ratio and net debt/EBITDA. With regard to the new financing and prevailing terms in the loan agreements, available credit facilities amounted to just over MSEK 1,075 at the year-end.
Dividend policy and proposed dividendThe Board’s dividend proposal shall take into account Gunnebo’s long-term development potential, its financial position and its investment needs. The Board has decided that the target for the divi-dend is that in the long term it shall amount to 30–40% of the profit after tax. The proposed dividend for 2011 is SEK 1.00 per share.
April 26, 2012 Interim report January–March 2012
April 26, 2012 2012 Annual General Meeting
July 20, 2012 Interim report January–June 2012
FINANCIAL INFORMATION AND REPORTS 2012ANALYSTS WHO FOLLOW GUNNEBO
Danske BankPeter Trigarszky +46 8 568 805 57 [email protected]
Carnegie Investment Bank ABMikael Löfdahl+46 8 676 88 00 [email protected]
SEB Enskilda Equities Stefan Mattsson +46 8 522 297 94 [email protected]
Swedbank Markets Mats Liss +46 8 585 900 00 [email protected]
RemiumErik Rolander+46 8 454 32 [email protected]
Karin Wallström, +46 10 209 50 [email protected]
IR CONTACT
October 25, 2012 Interim report January–September 2012
January 31, 2013 2012 Year-End Release

88
>> CAPITAL MARKET > RISK AND SENSITIVITY ANALYSIS
s an international corporation, Gunnebo is exposed to busi-ness and financial risks.
Business risks primarily include strategic and operational risks, such as business environment risks, raw material risks, product risks and legal risks. The financial risks are mainly linked to changes in interest rates and exchange rates, as well as refinancing and counter-party risks. Risk management in Gunnebo aims to identify, control, prevent and thereby minimise the Group’s potential risks.
The management groups in Gunnebo’s Business Areas and sales companies are responsible for developing strategies and identifying risks in their market or area of responsibility. The inclusion of repre-sentatives of the Group Executive Team on all internal boards ensures that relevant information is compiled and analysed.
Business risks Operational and strategic risks are mainly related to risks in the busi-ness environment, country-specific risks and political risks, as well as specific risks relating to customers, suppliers, employees and com-petitors.
Market risks Gunnebo has a relatively broad product range and customer struc-ture, as well as presence on a high number of geographic markets, which provides a good distribution of risk and prevents the Group from being dependent on a limited number of major customers or suppliers. Representation on several markets with a broad product range does mean, however, that the Group is exposed to business environment risks such as political risks in individual countries or regions, risks in raw material prices as well as risks related to busi-ness cycles. Banks currently represent the Group’s single largest customer group. The security market in the bank sector has, however, proved to be relatively resilient to economic downturns.
The Entrance Control Business Area is influenced by the construc-tion sector, which is sensitive to fluctuations in the economy.
Demand for Gunnebo’s products, systems and services is also influenced by changes in customers’ investment plans. Customers’ investment patterns can change considerably if the economic situa-tion in a country, industry or region changes. Political decisions can also have an impact on customers’ investment patterns.
Raw material risks Gunnebo is exposed to risk when the prices of materials change. Competition in the market may limit the ability to fully compensate for increased costs through price increases. Steel is the single largest raw material component in the Group, which purchases many differ-ent types and grades on various markets, resulting in a differentiated
price development. With the aim of limiting the short-term effect of price fluctuations, a large part of the Group’s steel requirement is purchased via index-based contracts.
Production risks Gunnebo’s production operation takes place in eleven production units and comprises of a chain of processes where business interruptions or disruptions in one stage of the production, such as shipping or industrial disputes, can have consequences on Gunnebo’s ability to fulfil its obligations to customers. Gunnebo deals with risks relating to the Group’s property and business interruptions through a far-reaching programme for identifying and assessing such risks. The programme is applied at all of Gunnebo’s production plants and aims to prevent these types of risk or, if an event is beyond Gunnebo’s con-trol, to mitigate the consequences. The production plants are also continuously inspected by Gunnebo’s insurers within the framework of a special risk assessment system called Gunnebo Blue.
Distribution risks On markets where Gunnebo has its own sales companies, the Group is responsible for marketing and sales to the customer. On other markets Gunnebo collaborates with a network of agents and distrib-utors. Their capacity can impact Group sales, but Gunnebo is not dependent on a single agent or distributor.
Product risks The majority of the Group’s products have limited risk in their appli-cation. It should however be noted that many of the products and systems are installed to strengthen protection in security-critical environments. Their function and quality are therefore of the utmost importance in securing the intended level of protection.
Insurance Gunnebo has a Group-wide insurance programme including indem-nity insurance, which covers among other things general liability and product liability, property and business interruption insurance, trans-port insurance and policies for crime against property. The Group has also taken out indemnity insurance for the Board and senior execu-tives.
Legal risks No company in the Group is a party in legal proceedings or any other dispute where the outcome may be supposed to have anything but a limited effect on the Group’s overall results and financial position. Any legal disputes and risks of legal disputes are reported to the Group Legal Affairs department. Legal disputes when applicable are han-dled by qualified legal representatives.
Risk awareness is a prerequisite in creating long-term value for the Group’s stakeholders and for securing good profitability. Gunnebo therefore continuously evaluates the risks to which the business is exposed, and carefully monitors the development of factors which influence the main risks that have been identified.
RISK AND SENSITIVITY ANALYSIS
A

89
IMPORTANT CHANGES TO THE RISK PROFILEIMPORTANT CHANGES TO THE RISK PROFILE
A new organisation with more centralised manA new organisation with more centralised man--agement of strategic development withinagement of strategic development withinselected business segments. This is continuouslyselected business segments. This is continuouslyexpected to lead to a stronger business focus onexpected to lead to a stronger business focus onthe core operations, a concentration of managethe core operations, a concentration of manage--ment resources and harmonisation of businessment resources and harmonisation of businessprocesses, and thereby a lower business risk. Theprocesses, and thereby a lower business risk. Thedivestment of Perimeter Protection strengthensdivestment of Perimeter Protection strengthensthis.this.
A lower number of factories leads to more secureA lower number of factories leads to more secureshared processes and assurance of product qualshared processes and assurance of product qual--ity, as well as lower fixed costs, higher flexibility,ity, as well as lower fixed costs, higher flexibility,and lower build-up of stock, i.e. less risk.and lower build-up of stock, i.e. less risk.
Continued mapping of managerial expertise andContinued mapping of managerial expertise andthe R&D organisation, along with completedthe R&D organisation, along with completedtraining initiatives, is expected to bring an increasedtraining initiatives, is expected to bring an increasedlevel of expertise and education within Gunnebo.level of expertise and education within Gunnebo.This in turn is expected to lead to lower businessThis in turn is expected to lead to lower businessrisks through a more systematic and professionalrisks through a more systematic and professionalwork approach.work approach.
Lower net financial items thanks to a lower averLower net financial items thanks to a lower aver--age volume of borrowing as well as lower interestage volume of borrowing as well as lower interestcosts have resulted in lower financial risk alongcosts have resulted in lower financial risk alongwith a higher interest coverage ratio, which is anwith a higher interest coverage ratio, which is animportant component in the terms of the loanimportant component in the terms of the loanagreements.agreements.
Savings programmes within production, purchasSavings programmes within production, purchas--ing and fixed costs protect the operating resulting and fixed costs protect the operating resultand cash flow.and cash flow.
Expanded operations within emerging marketsExpanded operations within emerging markets(China, Brazil and South Africa) have led to a(China, Brazil and South Africa) have led to awider geographical distribution and, thereby,wider geographical distribution and, thereby,lower sensitivity to business cycles, although alsolower sensitivity to business cycles, although alsoto increased currency exposure.to increased currency exposure.
Other risks In addition to the operational risks outlined above, the following risks are continuously monitored, primarily in the markets where the Group has its own sales companies and production units:
Environmental risks Fraud risk Development of pricing and cost structures Competition Technical advancement/development New security legislation, standards and requirements Competence supply Tax risks
Financial risks The objective of Gunnebo’s financial activities is to minimise the Group’s long-term financing costs and effectively manage and control its financial risks such as changes in interest and exchange rates, as well as refinancing and counterparty risks.
Organisation and activities Gunnebo’s financial operations are managed through the subsidiary Gunnebo Treasury AB which acts as the Group’s internal bank, is responsible for the Group’s currency and interest rate risk manage-ment, and is tasked with supporting the subsidiary companies in cur-rency transactions. Gunnebo Treasury AB is also responsible for the Group’s liquidity management and external borrowing, and assists the subsidiaries with loans and investments. Through this centralisa-tion the Group is able to benefit from economies of scale and syner-gies within the financial area.
The financial activities are carried out in accordance with the finance policy established by the Board, which regulates how finan-cial risks are to be managed and the limits within which the internal bank and Gunnebo’s subsidiaries may operate. The following finan-cial risks are covered, and regulated, by the finance policy:
Financing risk refers to the risk that financing of the Group’s capital requirement and refinancing of its outstanding borrowing are ren-dered more difficult or more expensive. In order to limit the financing risk, the Group’s finance policy stipulates that the total outstanding volume of borrowing must be covered by long-term credit facilities of at least twelve months at any given time.

90
>> CAPITAL MARKET > RISK AND SENSITIVITY ANALYSIS
Interest rate risk refers to the negative effect on the Group’s income and cash flow of a lasting change in market interest rates. The sensitivity of the result can, however, be limited in the short term by the interest maturity structure. According to the finance policy, the average duration of the Group’s fixed interest rate period can be 0 to 12 months.
Liquidity risk refers to the risk of not having access to liquid funds or undrawn lines of credit in order to fulfil payment obligations. The Group finance policy stipulates that liquid funds and unused lines of credit shall always amount to a minimum of MSEK 350. Liquidity in the Group shall be invested with the internal bank or in local cash pools. Gunnebo has centralised its liquidity management in cash pools in the main European countries where it operates.
Currency risk The Group has operations in a large number of coun-tries and is therefore exposed to currency risks. This is partly offset by hedging transactions in foreign currencies within the framework of the finance policy. For more detailed information about financial risk management and reporting of financial instruments, see Note 3 “Financial risk management and financial instruments”.
SENSITIVITY ANALYSISProfit is affected by changes in certain factors of importance to the Group, as explained below. The calculation is made on the basis of the Group’s structure at the year-end and assuming all other factors remain unchanged.
Change Effect
Selling prices A 1% change in the selling price … … would affect income and operating profit by approximately MSEK 50.
Labour costs A 1% change in labour costs, including social security charges …
… would affect operating profit by approximately MSEK 20.
Steel pricesSteel is the single largest raw material component in the Group, which purchases many different types and grades, resulting in differentiated price development.
A general change in steel prices of 10% … … would affect profit by around MSEK 30 for the subsequent twelve months.
Currencies A 10% change in the value of the EUR, USD and GBP … … would affect operating profit by approximately MSEK 19 in total, of which MSEK 2 would be transaction exposure, without taking the Group’s hedging into account. The remaining MSEK 17 is attributable to translation exposure.
Interest expenses On the basis of the average fixed interest term of the Group’s total loans at the year-end, a simultaneous change of one percentage point in all of Gunnebo’s loan currencies …
… would affect profit by approximately MSEK 4 for the subsequent twelve months.
Counterparty risk Counterparty risk or credit risk refers to the risk of a loss if the counterparty fails to fulfil its obligations.
• Financial credit risk Exposure to credit risk arises both when investing surplus liquidity, and in receivables from banks which arise via derivative instruments. Gunnebo’s finance policy includes a special list of permitted counterparties and maximum credit exposure with each approved counterparty. Gunnebo has also entered into general agreements regarding netting (ISDAs) with all of its counterparties for transactions in derivative instru-ments. Financial credit risk is also reduced in that liquid funds shall primarily be used to reduce outstanding liabilities, which limits the volume of outstanding surplus liquidity.
• Customer credit risk Gunnebo has formulated a credit policy reg-ulating the management of customer credit, which partly encompasses decision-making levels for granting credit limits. Each subsidiary is responsible for checking and controlling credit risk with customers, within given limits. The rules applicable for issuing credit locally are documented in a local credit policy regu-lating credit limits, terms of payment and collection procedures. For further information, see Note 18 “Accounts receivable”.

91
Risk management within the Gunnebo Group
Potential risk Description RiskOppor-tunities Risk management 2011
Strategic risks
Economic growth Demand correlates to economic growth in terms of major investments in security
Medium Low Focus on the cost base Recovery in the global economy strengthened demand
Natural disasters, terror attacks, conflicts and epidemics
Security solutions can benefit from increased demand in connection with certain events
Low Medium Gunnebo Blue, risk management programmes, and developing new tailor-made products
Gunnebo has not been adversely affected by the tsunami in Japan. If anything, conflicts and uncertainty in the world increase demand for Gunnebo’s products.
Market risks
Market influence The Gunnebo Group has a presence on many markets, and is therefore exposed to different economic cycles, which limits the Group’s exposure
Medium Medium The Group adapts its production and sales activities to ensure the right capacity and to match demand in each market in order to restrict its business risk
Growth in Asia has balanced lower demand in Europe
Competition and pricing
Competition within Business Areas on some markets
Medium Medium Gunnebo needs to reduce its cost base and ensure the highest possible quality and customised products and service solutions
Programmes for cost reduction, efficiency and quality control have begun to have effects
Capacity changes Demand increases in new parts of the world
Low Medium Expanded production in growth markets in order to achieve proximity to new demand
Establishment of production in China along with investments in other growth markets such as South Africa and Brazil
Operational risks
Employee turnover Gunnebo is an attractive employer Low Low Market rates of pay, training, managers programme and incentive programmes
Loyalty and motivation at high levels
Strikes Historically very rare within the Group Low Low Good relations with employees and union organisations
No strikes targeted at Gunnebo
Incidents and accidents Fire and natural disasters can affect production capacity
Medium Medium Gunnebo Blue, risk management programme (business interruption planning, comprehensive glo-bal insurance programme) and safety are top priorities
No significant incidents in 2011
Crime against property and fraud
The Group has some exposure which could have a financial effect
Low Low Code of Conduct, internal control, audits and work on security
No significant incidents in 2011
IT security Gunnebo is dependent on IT systems both for economic transactions and operational activities
Low Low Solid IT security, constantly being improved No security problems logged in 2011
Environment
Environmental directives and requirements
Laws and regulations, but also public opinion, place requirements on lower environmental impact
Low Low Gunnebo focuses on environmentally sustainable development and actively strives to reduce its impact on the environment
The Group’s environmental work has continued according to plan in 2011
Legal and political risk
Taxes and fees Gunnebo is exposed to changes in taxes and other fees
Low Low Proactively following developments, dialogue and negotiations with authorities and organisations
No major negative changes in 2011
Compliance risk Violation of laws or internal rules Medium Low Code of Conduct, internal control, audits, monitoring of international developments and own legal department
No significant new lawsuits or legal disputes in 2011
Financial risks
Counterparty risk Gunnebo is exposed to its counterparties’ solvency through loans, lease agreements, sales agreements, bank balances and derivatives
Medium Medium The Group’s exposure is regulated in the finance policy, and risk and exposure are controlled and min-imised on an ongoing basis
No major counterparty losses in 2011
Liquidity Gunnebo has some degree of a seasonal cycle, which affects cash flow
Low Low The finance policy stipulates that a financial contin-gency of MSEK 350 must always be retained via a combination of cash and credit agreements
A new three-year financing agreement was signed in July 2011, and the finan-cial contingency was maintained throughout the year
Raw material costs Changes in raw material prices (special steel in particular) affect profit margins
Medium Medium The purchasing department works with long contracts, including currency clauses, to mitigate the effects
The entire negative effect of higher raw material prices was avoided
Interest rate levels The Group is a net borrower, which results in exposure to changes in interest rates
Medium Medium The finance policy stipulates a mixture of variable and fixed interest rates up to a maximum of 12 months interest duration in the loan portfolio
Net interest costs decreased through lower interest rate levels and lower margins in the new financing agree-ment
Exchange rates A considerable proportion of income/costs and assets/liabilities are in foreign currencies, which gives rise to exchange rate effects
Medium Medium Active monitoring and, in some cases, hedging of exposure, proceeding both from transactions and equity
Thanks to the diversified geographical spread of the operation, the exchange rate effects were well balanced

92
>> CAPITAL MARKET > THE GUNNEBO SHARE
The Gunnebo share has been listed on Stockholm Stock Exchange since 1993, and can be found on the NASDAQ OMX Nordic Exchange Stockholm in the Mid Cap segment and the Industrials sector. A trading lot comprises 200 shares. The abbreviated name is GUNN and the ISIN code is SE0000195570.
THE GUNNEBO SHARE
t the end of 2011 Gunnebo had 10,196 shareholders. Swedish financial shareholders owned approximately 24%, and foreign shareholders 11% of the capital. 12% of the
share capital was owned by Swedish natural persons, which means that 88% was owned by legal entities or foreign natural persons.
Holding and votesOn December 31, 2011 Gunnebo had a share capital of MSEK 379.3 divided into 75,855,598 shares, each with a quota value of SEK 5. All shares have equal voting rights and share equally in the company’s assets and earnings.
Share priceAt the end of the year the Gunnebo share was trading at SEK 24.00, which is a decrease during the year of 55%. During the same period, Stockholm Stock Exchange’s general index decreased by 16.6%. The lowest share price paid during the year was SEK 21.20 (November 25) and the highest was SEK 54.75 (January 17).
Trading and market valueA total of 20,086,681 shares (28,586,492) were traded in 2011 at a value corresponding to MSEK 734 (976). The average volume traded each trading day was 79,394 shares (112,990), equating to TSEK 2,900 (3,858). The market value on December 30, 2011 was MSEK 1,821.
A
THE GUNNEBO SHARE 201155
35
30
25 600
800
1,000
400
200
50
45
40
20DECJAN FEB MAR APR MAY JUN JUL AUG SEP OCT NOV
©NASDAQ OMX
©NASDAQ OMX
70
30
20
4,0005,0006,0007,000
3,0002,0001,000
50
40
60
1020082007 2009 2010 2011
Share/SEK OMX Stockholm_PI Trading (no. of shares in thousands)
THE GUNNEBO SHARE 2007–2011

93
Number of shares1) 2011 2010 2009 2008 2007
Closing no. of shares, x 1,000 75,856 75,856 75,856 59,398 59,398Average no. of shares, x 1,000 75,856 75,856 59,974 59,398 59,118
Largest shareholders, grouped No. of shares Proportion, %
Stena Adactum 19,852,329 26.2Vätterledens Invest, with associates 15,067,913 19.9IF Skadeförsäkring 8,849,114 11.7Enter funds 2,656,815 3.54th AP fund 1,675,067 2.2Odin funds 1,315,090 1.7Avanza Pension 1,034,150 1.4Carlsson funds 976,535 1.3Skandia funds 887,273 1.2Muirfield Invest 850,000 1.1JPM Chase NA 747,506 1.0Handelsbanken funds 641,371 0.8KLP Verdipapirfondet 600,000 0.8AMF 583,000 0.8Bjarne Holmqvist 488,004 0.6SEB Life 475,416 0.6Euroclear Bank 410,000 0.5Folksam 359,700 0.5Others 18,386,315 24.2Total 75,855,598 100.0
Changes in share capital, MSEK Change Share capital
Total no. of shares
1991 Formation 4 4,0001992 Split 100:1 4 400,0001992 New share issue +96 100 10,000,0001995 New share issue +50 150 15,000,9341995 Conversion +3 153 15,280,7831996 Conversion +10 163 16,275,8191997 New share issue +4 167 16,715,8191997 Conversion +27 194 19,351,1211998 Conversion +4 198 19,813,1501998 New share issue +2 200 19,973,1501999 Conversion 0 200 19,982,3101999 New share issue +6 206 20,625,8812000 Conversion +6 212 21,204,5282001 Conversion 0 212 21,211,1982003 Conversion +7 219 21,889,9742004 Split 2:1 0 219 43,779,9482005 New share issue 0 219 43,854,5482006 New share issue +4 223 44,578,5232007 New share issue +5 228 45,513,3592009 New share issue +151 379 75,855,598
Shareholders by sizeNo. of
shareholders No. of sharesHolding and
votes, %
1–500 6,391 1,041,570 1.37501–1,000 1,643 1,329,494 1.751,001–5,000 1,659 3,799,783 5.015,001–10,000 241 1,818,978 2.4010,001–20,000 103 1,530,495 2.0220,001– 159 66,335,278 87.45Total 10,196 75,855,598 100.00
2
–2
–4
4
6
8
10
Kr
07 08 09 1110
Earnings per share after dilution
0.5
1.0
1.5
2.0
2.5
Kr
07 08 09 10 11*
Dividend per share
10
20
30
40
50
Kr
1107 08 09 10
Equity per share
2.0
4.0
6.0
8.0
10.0
Kr
07 08 09 10 11
Cash flow per share
Share price related share data1) 2011 2010 2009 2008 2007
Share price at year-end (last price paid), SEK 24.00 53.00 27.30 11.90 49.80Highest price during the year (price paid), SEK 54.75 53.50 34.40 52.70 69.75Lowest price during the year (price paid), SEK 21.20 25.10 11.30 9.95 48.50Market value at year-end, MSEK 1,821 4,020 2,071 667 2,958P/E ratio, times 8 23 neg. 6 23Dividend yield, %2) 4.2 0.9 — — 2.5
1) The figures have been adjusted for the bonus issue effect resulting from the new share issue.2) The Board and the President propose a dividend of SEK 1.00 per share for the year 2011.
Data per share1) 2011 2010 2009 2008 2007
Earnings per share incl. items of non-recurring nature, SEK 3.00 2.35 –3.42 1.93 2.16Equity per share, SEK 23.24 21.17 18.63 18.06 19.23Cash flow per share, SEK 0.86 1.91 10.06 3.64 0.35Dividend, SEK2) 1.00 0.50 0.00 0.00 1.25
* Board proposal.

94
>> CAPITAL MARKET > FIVE-YEAR REVIEW
FIVE-YEAR REVIEWExcluding discontinued operations Including discontinued operations
2011 2010 2009 2011 2010 2009 2008 2007
Income statement, MSEKNet sales 5,137 5,263 5,480 5,580 6,384 6,788 6,903 7,025Cost of goods sold –3,572 –3,723 –3,928 –3,947 –4,592 –4,958 –4,957 –5,040Gross profit 1,565 1,540 1,552 1,633 1,792 1,830 1,946 1,985Goodwill write-down — — — — — –106 — —Other operating expenses, net —1,241 –1,343 –1,493 –1,321 –1,486 –1,812 –1,665 –1,636Operating profit/loss* 324 197 59 312 306 –88 281 349Net financial items —27 –75 –68 –30 –85 –79 –101 –95Profit/loss after financial items 297 122 –9 282 221 –167 180 254Taxes –52 –41 –36 –52 –43 –38 –65 –126Profit/loss for the year 245 81 –45 230 178 –205 115 128* Of which items of a non-recurring nature 7 –127 –175 7 –31 –302 –47 –5
Margins, excl. items of a non-recurring natureGross margin, % 30.8 30.2 29.0 29.6 29.0 28.2 28.2 28.3Operating margin before depreciation, (EBITDA), % 7.7 7.7 6.1 7.1 7.1 5.1 6.6 7.0Operating margin (EBIT), % 6.2 6.1 4.3 5.5 5.3 3.2 4.7 5.0Profit margin (EBT), % 5.7 4.7 3.0 4.9 3.9 2.0 3.3 3.7
Margins, incl. items of a non-recurring natureGross margin, % 30.5 29.3 28.3 29.3 28.1 27.0 28.2 28.3Operating margin before depreciation, (EBITDA), % 7.9 5.3 2.9 7.2 6.6 2.3 6.0 6.9Operating margin (EBIT), % 6.3 3.7 1.1 5.6 4.8 –1.3 4.1 5.0Profit margin (EBT), % 5.8 2.3 –0.2 5.1 3.5 –2.5 2.6 3.6
Other information Foreign sales ratio, % 96 96 96 95 94 94 93 94Order intake, MSEK 5,091 5,271 5,346 5,573 6,462 6,573 6,965 6,938Capital expenditure, MSEK 85 71 58 90 88 77 119 126Depreciation, MSEK 81 82 99 90 113 134 130 127Average number of employees 5,315 5,248 5,314 5,583 5,904 6,041 6,455 6,719

95
Including discontinued operations2011 2010 2009 2008 2007
Balance sheet, MSEK Intangible assets 1,215 1,048 1,199 1,360 1,232Property, plant and equipment 316 367 547 625 584Financial assets 139 94 66 58 48Deferred tax assets 253 241 240 288 120Inventories 564 543 644 913 789Current receivables 1,239 1,253 1,468 1,849 1,846Liquid funds 239 189 172 169 218Total assets 3,965 3,735 4,336 5,262 4,837
Equity 1,776 1,606 1,413 1,073 1,142Long-term liabilities 800 639 584 2,142 1,604Current liabilities 1,389 1,490 2,339 2,047 2,091Total equity and liabilities 3,965 3,735 4,336 5,262 4,837
Cash flow statement, MSEK Cash flow from operating activities before changes in working capital 234 177 99 208 150Cash flow from changes in working capital –169 –32 504 8 –130Cash flow from operating activities 65 145 603 216 20
Operating cash flow, MSEK Operating cash flow 71 214 683 255 66
Returns, excl. items of a non-recurring natureReturn on capital employed, % 13.2 13.5 7.5 10.7 12.0Return on equity, % 13.7 14.3 8.5 14.6 12.1
Returns, incl. items of a non-recurring nature Return on capital employed, % 13.5 12.3 –2.5 9.2 11.9Return on equity, % 14.1 12.2 –18.0 10.4 11.7
Other key ratiosCapital turnover rate, times 2.3 2.5 2.2 2.2 2.3Equity ratio, % 45 43 33 20 24Interest coverage ratio, times 18.0 5.0 –1.1 2.9 3.7Debt/equity ratio, times 0.3 0.3 0.7 1.8 1.5Capital employed, MSEK1) 2,617 2,289 2,642 3,219 3,115Net debt, MSEK1) 498 460 1,048 1,967 1,746
Share data2)
Earnings per share before dilution, SEK 3.00 2.35 –3.42 1.93 2.16Earnings per share after dilution, SEK 3.00 2.35 –3.42 1.93 2.16Equity per share, SEK 23.24 21.17 18.63 18.06 19.23Cash flow per share, SEK 0.86 1.91 10.06 3.64 0.35Dividend, SEK3) 1.00 0.50 0.00 0.00 1.25
1) Closing balance.2) The figures for 2009-2007 have been adjusted for the bonus issue effect resulting from the new share issue.3) The Board and the President propose a dividend of SEK 1.00 per share for the year 2011.

HHEEAADD OOFFFFIICCEEGUNNEBO ABBox 5181SE-402 26 GOTHENBURGwww.gunnebogroup.comTel: +46 10 209 50 00E-mail: [email protected] President and CEO: Per Borgvall
SSAALLEESS RREEGGIIOONNRReeggiioonn EEMMEEAA ((EEuurrooppee,,MMiiddddllee EEaasstt aanndd AAffrriiccaa))SVP: Morten Andreasen
BELGIUM, LUXEMBOURGGunnebo Belgium SA/NVwww.gunnebo.beTel: +32 2 464 19 11E-mail: [email protected] Manager: Frederik De Broyer
DENMARKA/S Gunnebo Nordicwww.gunnebo.dkTel: +45 70 10 56 00E-mail: [email protected] Country Manager: Tom Christensen
EASTERN EUROPEGeneral Manager: Jurek Szkalej
CCZZEECCHH RREEPPUUBBLLIICCGunnebo CZ s.ro.www.gunnebo.czTel: +420 266 190 200E-mail: [email protected] Manager: Viktor Bartusek
HHUUNNGGAARRYYGunnebo Magyarorzág Kft.www.gunnebo.huTel: +36 1 465 6080E-mail: [email protected] Country Manager: István Roszmann
PPOOLLAANNDDGunnebo Polska Sp. z o.o.www.gunnebo.plTel: +48 62 76 85 570E-mail: [email protected] Manager: Jurek Szkalej
FRANCEGunnebo France S.A.Swww.gunnebo.frTel: +33 810 000 800E-mail: [email protected] Manager: Jean-David Soual
GERMANY, AUSTRIAGunnebo Deutschland GmbHwww.gunnebo.dewww.gunnebo.atTel: +49 89 95 960 (DE)Tel: +43 7229 820 50 (AT)E-mail: [email protected]: [email protected] Managers: Carsten Heidenreich, Stephan Seifert (from February 1, 2012)
ITALYGunnebo Italia S.p.A.www.gunnebo.itTel: +39 02 267 101E-mail: [email protected] Manager: Marco Depaoli
MIDDLE EASTGunnebo Middle East FZEwww.gunnebo.aeTel: +971 4 701 7837E-mail: [email protected] Manager: Jacob Touma
THE NETHERLANDSGunnebo Nederland BVwww.gunnebo.nlTel: +31 203 988 988E-mail: [email protected] Manager: Patrick van Aart
NORDIC REGIONGeneral Manager: Bengt Nordén
FFIINNLLAANNDDGunnebo Nordic Oywww.gunnebo.fiTel: +358 10 617 1700E-mail: [email protected] Manager: Päivi Laaksomies
NNOORRWWAAYYGunnebo Nordic A/Swww.gunnebo.noTel: +47 22 90 03 00E-mail: [email protected] Manager: Kjell Olav Teig
SSWWEEDDEENNGunnebo Nordic ABwww.gunnebo.seTel: +46 10 209 51 00E-mail: [email protected] Manager: Bengt Nordén
PORTUGALGunnebo Portugal S.A.www.gunnebo.ptTel: +351 218 315 600E-mail: [email protected] Manager: Carlos Valpradinhos
UK, IRELANDGunnebo UK Ltdwww.gunnebo.co.ukTel: +44 1902 455 111E-mail: [email protected] Manager: Paul Hutchinson (from June 1, 2011)
SOUTH AFRICAGunnebo South Africa (Pty) Ltdwww.gunnebo.zaTel: +27 11 878 23 00E-mail: [email protected] Manager: Martin Houseman
SPAINGunnebo España S.A.www.gunnebo.esTel: +34 902 100 076E-mail: [email protected] Manager: Dario Vicario
SWITZERLANDGunnebo Suisse SAwww.gunnebo.chTel: +41 840 888 777E-mail: [email protected] Manager: Mike Finders
RReeggiioonn AAmmeerriiccaassSVP: Tomas Wängberg
BRAZILGunnebo Gateway S.Awww.gunnebo.com.brTel: +55 11 3732 6626E-mail: [email protected] Manager: Rubens Bulgarelli Filho
CANADA, USAGunnebo Canada Inc.www.gunnebo.ca www.gunnebo.usTel: +1 905 595 4140E-mail: [email protected] Manager: John Haining
RReeggiioonn AAssiiaa PPaacciifificcAUSTRALIA, NEW ZEALANDGunnebo Australia Pty Ltdwww.gunnebo.com.auTel: +61 2 9852 0700E-mail: [email protected] Manager: Dan Turner
CHINAGunnebo Security (China) Co., Ltd.www.gunnebo.cnTel: +86 21 54662978 (Sales and purchasing)Tel: +86 512 50338950 (Factory)E-mail: [email protected] Manager: Chris Dai
INDIAGunnebo India Ltd.www.gunnebo.inTel: +91 22 67 80 35 00E-mail: [email protected] Manager: Sandeep Deshpande
INDONESIAGunnebo Indonesiawww.gunnebo.com/idTel: +62 21 314 8383E-mail: [email protected] Manager: Hindra Kurniawan
SINGAPOREGunnebo Singapore Pte Ltdwww.gunnebo.sgTel: +65 6327 91 19E-mail: [email protected] Manager: Elsie Tay
BBUUSSIINNEESSSS AARREEAASSBANK SECURITY & CASH HANDLINGwww.gunnebo.comTel: +33 1 34 65 65 34SVP: Christian Guillou
SECURE STORAGEwww.chubbsafes.comwww.fichet-bauche.comwww.rosengrens.comwww.gunnebo.comTel: +33 1 34 65 65 34SVP: Christian Guillou
GLOBAL SERVICESwww.gunnebo.comTel: + 34 93 316 26 00SVP: Anna Almlöf
ENTRANCE CONTROLwww.gunnebo.comTel: +44 1825 746 124SVP: Robert Hermans
DEVELOPING BUSINESSESwww.gunnebo.comTel: +46 10 209 50 00SVP: Tomas Wängberg
SSAAFFEEPPAAYY AABBwww.gunnebo.comTel: +46 10 209 55 00General Manager: Claes Hall
GGUUNNNNEEBBOO GGAATTEEWWAAYY AABBwww.gateway-security.comTel: +46 141 21 50 70General Manager: Kent Schölin
OOPPEERRAATTIIOONNSSwww.gunnebo.comTel: +46 10 209 50 00SVP: Björn Nergård
Printing: INEKO
Paper, cover: Tom&Otto Silk 300g
Paper, insert: Tom&Otto Silk 150g
This product can be recycled as paper
DISCLAIMERThis report contains future-oriented information. It reflects the management’s current perceptions of certain future events and the possible ensuing results. No guarantees can be given that these perceptions will prove to be correct. Actual future results may vary considerably from the information supplied in this report, partly due to changes in circumstances regarding the economy, market and competition, changed legal require-ments and other political measures, variations in exchange rates, business risk assessments and other factors mentioned in this annual report.
INVITATION TO THE ANNUAL GENERAL MEETINGGunnebo’s Annual General Meeting will be held at 4.00 pm CET on Thursday April 26, 2012 at Liseberg Theatre, Örgrytevägen 5, Gothenburg, Sweden.
RegistrationShareholders who wish to participate in the Annual General Meeting must have their names entered in the register of shareholders main-tained by Euroclear AB by no later than April 20, 2012, and must notify Gunnebo AB by no later than 4.00 pm CET on April 20, 2012, either online at www.gunnebogroup.com, by post to Gunnebo AB, Box 5181, SE-402 26 Göteborg, by fax on +46 10 209 50 10, or by phone on +46 10 209 50 00.
Shareholders whose shares are registered in nominee names must, if they wish to exercise their right to vote at the Meeting, have their shares re-registered in their own names by April 20, 2012.
DividendThe Board and the President propose a dividend of SEK 1.00 (0.50) for 2011.

Automated safe deposit lockerAn automated safe deposit locker, such as SafeStore Auto, is available around the clock. Can be installed in the bank’s self-service area.
Bank automationMachines for storing cash and valuables or making with-drawals, e.g. ATMs, in banks. Gunnebo supplies safes to manufacturers of bank automation.
BiometricsAutomated technology which identifies people using their physiological characteristics, such as fingerprints, face and iris.
Business AreasGunnebo focuses on four main Business Areas: Bank Security & Cash Handling, Secure Storage, Global Services and Entrance Control.
Cash automationGunnebo offers the closed cash handling system SafePay™. The solution protects cash from the moment a customer makes payment all the way to the counting centre, with no manual handling of cash at all.
Cash handlingSweden’s central bank, Riksbanken, supplies money to banks and businesses using cash-in-transit companies. The public then gains access to the cash through the banks and retail sector. Once the banknotes are worn they go via the banks and businesses, and are returned to Riksbanken for destruction with the help of the cash-in-transit companies. Gunnebo offers comprehensive cash handling solutions which make large parts of the process more secure and efficient.
Cash-in-transit companyA company that transports money between different units in the cash handling process, such as from a shop or a central bank to a counting centre. Abbreviated to CIT.
CCTVClosed Circuit Television. An internal video surveillance system.
Certified safesMany of Gunnebo’s safes are classed as ‘certified’. This means they have undergone independent tests that grade them based on the level of protection they offer against fire and/or burglary.
Counting centreA secure depot where cash-in-transit companies collect cash before it is counted and authenticated.
Electronic article surveillance (EAS)Hard tags placed on products in stores which sound an alarm if they are still activated when the products pass the antennas at the entrance. Gateway AB offers a complete range of electronic article surveillance solu-tions.
Entrance controlSolutions that prevent unauthorised access to high-risk sites such as embassies and prisons, office buildings, airports, metro systems, arenas and logistics centres.
Face recognitionBiometric technology that scans a face and compares it with images in a database to authenticate a person’s identity. Applications include automated passport control at airports.
Fire-resistant safesProtect documents and/or digital media from fire. All Gunnebo fire-resistant safes have been subject to independent tests and are certified.
High-security locks (HSL)Certified electronic locks that have undergone extensive testing. Used on safes, vaults and doors.
Immigration gateAn automated solution for airports which makes border control faster and more secure.
OperationsThe unit responsible for product sourcing, production, logistics, environment and quality within the Gunnebo Group.
R&DResearch and development. Manages development projects and provides new designs and efficient security solutions as well as product cost analyses, risk analyses and certifications.
Region AmericasThe region for all business within the sales companies for Canada, the US and Brazil.
Region Asia PacificThe region for all business within the sale companies for Indonesia, India, Australia, New Zealand, Singapore and China.
Region EMEA (Europe, Middle East and Africa)The region for all business within the sales companies for Denmark, Finland, Norway, Sweden, Netherlands, Poland, UK, Ireland, Czech Republic, Hungary, Germany, Austria, France, Spain, Italy, Portugal, Switzerland, Belgium, Luxembourg, South Africa and the Middle East.
Safe deposit lockerA mechanical or electronic locker which is normally found in a vault or machine for storing cash and valuables in a bank environment.
SafePay™A system developed by Gunnebo for efficient, completely closed, recycled cash handling in retail environments. Consists of technology for cash handling in checkout environments, transport cassettes, a cash transfer unit and software for cash-handling management.
Sales companyThe sales company is responsible for local sales contacts including deliveries, installation and service for all customer segments.
Security portalsA door solution which acts like a gate. People go in through a door and the next door is only opened when the first door is closed. This prevents several people pushing through at the same time without authorisation.
Single-person detectionChiefly used at airports to prevent two people passing through an automated control at the same time.
TCP/IPTransmission Control Protocol/Internet Protocol. An architecture for data communication across networks used, for example, by integrated electronic security systems to transfer data between different facilities.
MAIN BRAND: UMBRELLA BRANDGunneboAll operating companies in the Group are called Gunnebo, all business is conducted under the Gunnebo brand and the majority of all products bear this brand name.
OTHER BRANDSAlltech by Gunnebo is a brand used on a series of more basic products within entrance control.
Chubbsafes is a licensed brand used in the sale of products and solutions within secure storage.
elkosta™ is a product brand owned by Gunnebo but used under licence by Perimeter Protection.
Fichet-Bauche is used in the sale of products and solu-tions within secure storage.
Gateway™ is a product brand used for Gunnebo’s electronic article surveillance solutions.
Rosengrens is used in the sale of products and solutions within secure storage.
SafePay™ is a product brand used for Gunnebo’s systems for closed and recycled cash handling in the retail sector.
Steelage is used in the marketing and sale of safes on the Indian market.
GUNNEBO’S BRAND
GUNNEBO GLOSSARY

GUNNEBO AB (publ)Reg. no. 556438-2629Box 5181, 402 26 GOTHENBURGTel: +46 10 209 50 00E-mail: [email protected]
www.gunnebogroup.com