docs2.health.vic.gov.audocs2.health.vic.gov.au/.../vidb-14-2-june2011.docx · web viewvictorian...
TRANSCRIPT

Victorian Infectious Diseases BulletinISBN 1 441 0575 Volume 14 Issue 2 June 2011
ContentsThe epidemiology of cryptosporidiosis in Victoria, 2001–2009 38Murray Valley encephalitis virus sero-survey of northern Victoria, 2008 43There is more to chickens than KFC! 45Trends in Haemophilus influenzae serotyping, Victoria, 2006–2010 46Increase in reports of Salmonellosis in Victoria, 2011 49Improving infectious disease notification project: an update 52Immunisation coverage report, Victoria, March 2011 54Communicable disease surveillance in Victoria, January–March 2011 57

The epidemiology of cryptosporidiosis in Victoria, 2001–2009Lillian Kent1,2, Nasra Higgins1, Michelle McPherson2
1 Communicable Disease Prevention and Control Unit, Victorian Department of Health2 National Centre for Epidemiology and Public Health, College of Medicine, The Australian National University, Canberra
IntroductionCryptosporidiosis is a protozoan parasitic infection that most commonly presents as gastroenteritis and less commonly infects the respiratory and biliary tracts. Enteric symptoms usually include diarrhoea, bloating, cramping, abdominal pain, vomiting and fever. The disease is usually mild and self-limiting but in immunocompromised individuals is prolonged and can lead to death.1 The infective dose in humans is low and the incubation period ranges from one to 12 days, with an average of seven days.1–3 The infectious period lasts from the onset of symptoms, as the oocysts are excreted in the stool, until several weeks after symptoms resolve.1 The oocysts are widespread and may remain infective outside the body for two to six months, particularly if the environment is moist. They are highly resistant to standard levels of chemical disinfection of water such as chlorine.1,3 Outbreaks have been reported in day care centres, and been associated with drinking water, recreational water (waterslides, swimming pools and lakes) and consumption of contaminated beverages.1,4–12 In Australia, increases in notifications tend to occur in the warmer months and over irregular cycles, with more than 3000 cases notified in Australia in 2002, 2005 and 2006.13
Cryptosporidiosis became notifiable in both Australia and Victoria in 2001, with more than 15,000 cases notified between 2002 and 2009. The aim of this study was to describe the epidemiology of notified cases of cryptosporidiosis in Victoria for the period 2001 to 2009 in terms of age, sex, location and season.MethodsCase definitionCryptosporidiosis is a Group B notifiable disease in Victoria. The Public Health and Wellbeing Regulations 2009 require that medical practitioners and pathology laboratories notify cases to the Department of Health within five days of diagnosis.14 A confirmed case requires laboratory definitive evidence, the criterion of which is the detection of Cryptosporidium spp oocysts.14 Data extraction and manipulationConfirmed cryptosporidiosis cases with a date or estimated date of illness onset from 1 January 2001 to 31 December 2009 were extracted from the Victorian Department of Health Notifiable Infectious Diseases Surveillance System (NIDS). If no onset date was available the earliest date entered into the system was used. Dates of onset were adjusted by the average incubation period of seven days to provide an estimated date of infection Data analysisDescriptive analysisData were analysed using Excel and Intercooled STATA version 9.0. Age and region specific rates per 100,000 population were determined using the Australian Bureau of Statistics estimated resident population (ERP) for each year (2001–2008).15 Statistical analysisThe binomial test was used to examine differences in notifications by sex. The student’s t-test was used to test for difference in mean age and univariate analysis of categorical variables was conducted using the chi-squared statistic. Due to over-dispersion of the notifications over time a negative binomial regression, using a log-linear model, was employed to examine whether age, sex and location (region) of cryptosporidiosis notifications differed over time. The outbreak years of 2006 and 2009 were analysed using multinomial logistic regression to identify any differences in age, sex, region and season in the outbreak years compared to non-outbreak years. For all statistical tests a p-value of <0.05 was considered significant.

ResultsBetween 2001 and 2009, 4,957 cryptosporidiosis cases were notified in Victoria. The largest numbers of cases were notified in 2006 (1,078 cases) and 2009 (1,031 cases). The overall notification rate for Victoria between 2001 and 2009 was 10.9 cases per 100,000 population. The rate of notifications for the two outbreak years (2006 and 2009) was approximately 20 per 100,000 population compared to four to 12 per 100,000 for other years. Over the study period the number of notifications of cryptosporidiosis increased four per cent each year (95 per cent CI 1.03–1.05). This did not change after adjusting for sex, age and location. The greatest number of notified cases occurred in February, March and April, the warmest months of the year for Victoria (Figure 1). During the study period 2,188 notifications occurred over this three month period. There were an equal number of notifications for males and females and this did not change over time (95 per cent CI 0.98–1.09). The mean age was 17.7 years for males and 22.7 years for females (p<0.001). Forty eight per cent of cryptosporidiosis cases were in children aged less than 10 years, at a rate of 40.7 per 100,000 population compared to 6.5 per 100,000 for those aged 10 years and older. Among children, the largest proportion of notifications was in those aged two years and younger (18 to 30 per cent of the total cryptosporidiosis notifications per year). The age specific notification rate showed a bimodal distribution, peaking at two years and younger and at 30 to 34 years for females and 35 to 39 years for males (Figure 2). The highest age and sex specific notification rate was for males aged two years or less(68 cases per 100,000 population) compared with 52.9 per 100,000 population for females in the same age group (Figure 2). Two-thirds of cryptosporidiosis notifications (3,273) occurred in metropolitan regions. North and West (25.2 per cent) and Southern (22.6 per cent) Metropolitan Regions each had a larger proportion of total notifications than Eastern Metropolitan Region (18.9 per cent). Of the rural regions, Gippsland had the highest number of notifications, with the next highest number in Barwon South Western. The lowest number of notified cases occurred in the Grampians Region, followed by Loddon Mallee. The region with the highest rate of cryptosporidiosis was Gippsland (24.9 per 100,000), followed by Hume (14.7 per 100,000) and Barwon South Western (13.3 per 100,000). Rates between metropolitan regions were comparable (around 10 per 100,000 for each) (Figure 3). Multiple regression analysis indicated that in the outbreak years of 2006 and 2009, the odds of being notified with cryptosporidiosis were significantly higher for those aged 20 years and over, those residing in metropolitan regions and during autumn compared with non-outbreak year notifications. The odds were significantly lower for cases occurring in spring and there was no difference by gender (Table 1).
DiscussionThis report describes the epidemiology of cryptosporidiosis in Victoria in the first nine years since the disease became notifiable in 2001. The large number of cases found in 2006 and 2009 illustrates the interannual nature of cryptosporidiosis in Victoria which has also been observed in other Australian jurisdictions.16–19 Despite these peak years, the number of notifications in Victoria increased over this time, by four per cent per year. There were no overall differences by sex, and the highest notification rates were among infants and children (zero to nine years), peaking with the zero to two year age group. The bimodal age distribution of cryptosporidiosis notifications may be attributed to the susceptibility of children to infection and their tendency to visit the doctor more regularly, thereby increasing the chance of being diagnosed and notified.20 It is not clear why the notification rate for males in this age group is higher than the rate for females. A possible explanation could be differences in immunity between the two genders.21 The second mode was for adults aged 30 to 39 years, particularly women. This age group may be more likely to be parents of infected children. Notifications may be higher in this group for two reasons: an increased likelihood of disease transmission from child to parent, and an increased likelihood of diagnosis in adults attending the doctor with a sick child. During late summer and early autumn the largest number of notifications was found in the metropolitan regions; this is not unexpected as these regions have the largest proportion of the Victorian population. One explanation of this seasonal increase is increased waterborne recreation activities during this time; a known risk factor for cryptosporidiosis.4–6,9 Increased recreational water activities in the summer months may also explain the high rates in the zero to two year age group, as they may be more likely to attend swimming pools for lessons or recreational use.22

During the cooler months of winter and spring the largest numbers of notifications were found in the rural regions of Gippsland and Barwon South Western. Farming practices including calving of large mammals such as cattle and sheep may lead to increased rates at this time of the year in these areas.23 Large numbers of notifications were also observed in the warmer months in these areas; these are large tourism areas that promote water sports activities in the summer. A mixture of exposures could be at play here.Multivariate analysis showed that during outbreak years adults were more likely to be notified with cryptosporidiosis. This finding was unexpected as this is different to the usual pattern of cryptosporidiosis among infants and children discussed above. The finding that metropolitan areas were more likely to have notifications during autumn was not unexpected. Information on risk factors is not routinely entered into NIDS so it is difficult to establish the reasons for this. It may be due to increased waterborne recreational activities by adults during unusually warmer times during the study period.
ConclusionIn Victoria, between 2001 and 2009, the highest rate of cryptosporidiosis notifications was among infants and children, except during the outbreak years, where adults were more likely to be notified. The greatest number of notifications occurred in metropolitan areas during late summer/early autumn. In the rural regions, Gippsland and Barwon South Western, the largest number of notifications were in late winter/early spring and late summer/early autumn suggesting dual risk factors. Policies are being developed to guide the Environmental Health Unit of the Department of Health in the environmental investigation of outbreaks. An early warning system needs to be developed to pre-empt outbreaks during high risk periods, in order to minimise their progression.
AcknowledgementsThe authors would like to thank the staff of the Communicable Disease Prevention and Control Unit for assistance provided in this analysis.Lillian Kent is a Master of Applied Epidemiology (MAE) scholar at the National Centre for Epidemiology and Population Health, at The Australian National University. The MAE program is funded by the Australian Government Department of Health and Ageing.
References1. Heymann DL, editor. 2008. Control of Communicable Disease Manual. 19 ed. Washington, DC: American
Public Health Association2. Kay D. CDC says there are ways to reduce enteric pathogen transmission in swimming pools. Clinical
Infectious Diseases. 2001;33(2):i–iv3. Peuch MC, McAnulty JM, Lesjak M, Shaw N, Heron L, Watson JM. A statewide outbreak of cryptosporidiosis
in New South Wales associated with swimming at public pools. Epidemiology and Infection. 2001;126(3):389–96
4. Centers for Disease Control and Prevention. Cryptosporidiosis outbreaks associated with recreational water use – Five states, 2006. Morbidity and Mortality Weekly Report 2007;56(29):729–32
5. Centers for Disease Control and Prevention. Outbreak of cryptosporidoisis associated with a splash park – Idaho, 2007. Morbidity and Mortality Weekly Report. 2009;58(22):615–8
6. Clark BT. Cryptosporidiosis: A recreational water threat that hasn’t gone away. Journal of Environmental Health. 2007;69(10):65–6
7. Craun GF, Calderon RL, Craun MF. Outbreaks associated with recreational water in the United States. International Journal of Environmental Health Research. 2005;15(4):243–62
8. Mac Kenzie WR, Hoxie NJ, Proctor ME, Gradus MS, Blair KA, Peterson DE, et al. A massive outbreak in Milwaukee of Cryptosporidium infection transmitted through the public water supply. New England Journal of Medicine. 1994 July 21, 1994;331(3):161–7
9. Wheeler C, Vugia DJ, Thomas G, Beach MJ, Carnes S, Maier T, et al. Outbreak of cryptosporidiosis at a California waterpark: employee and patron roles and the long road towards prevention. Epidemiology and Infection. 2007;135(2):302
10.Yoder JS, Roberts V, Craun GF, Hill V, Hicks L, Alexander NT, et al. Surveillance of waterborne disease and outbreaks associated with drinking water and water not intended for drinking – United States, 2005–2006. Morbidity and Mortality Weekly Report Surveillance Summaries. 2008;57(9):1–29
11.Cordell RL, Addiss DG. Cryptosporidiosis in child care settings: a review of the literature and recommendations for prevention and control. Pediatric Infectious Disease Journal. 1994;13:310–7

12.Semenza JC, Nichols G. Cryptosporidiosis surveillance and water borne outbreaks in Europe. Eurosurveillance. 2007;12(5):E13–E4
13.Department of Health and Ageing. Australia’s notifiable diseases status: Annual report of the National Notifiable Diseases Surveillance System. Canberra: Commonwealth of Australia; 2009 [updated 2009; cited 2010 16/06/2010]; Available from: http://www.health.gov.au/internet/main/publishing.nsf/Content/cda-pubs-annlrpt-nndssar.htm.
14.Communicable Diseases Network Australia. Australian national notifiable diseases and case definitions. Canberra: Commonwealth of Australia; 2010 [updated 2010; cited 14 December 2010]; Available from: http://www.health.gov.au/casedefinitions
15.Estimated Resident Population [database on the Internet]. Australian Bureau of Statistics. [cited 12/10/2010]. Available from: www.abs.gov.au
16.Communicable Disease Control Branch. 5 year, YTD comparisons; Year to date comparison as at 04/12/2010. Weekly report. Adelaide: South Australia Department of Health; 2010 [updated 2010; cited 17/12/2010]; Accessed at: http://www.dh.sa.gov.au/pehs/notifiable-diseases-summary/
17.NSW Department of Health. Increase in cryptosporidiosis cases. Sydney: NSW Department of Health; 2009 [updated 2009; cited 17/12/2010]; Available from: http://www.health.nsw.gov.au/news/2009/20090226_02.html
18.NSW Health Department Notifiable Conditions Information Management System (NCIMS)(HOIST). Cryptosporidiosis notifications in NSW residents. Sydney: NSW Department of Health; 2010 [updated 2010; cited 15/12/2010]; Available from: http://www.health.nsw.gov.au/data/diseases/cryptosporidiosis.asp.
19.Queensland Health Communicable Diseases Unit. 1997–2001 Notifiable diseases report. Brisbane: Queensland Health; 2001 [updated 2001; cited 15/12/2010]; Available from: http://www.health.qld.gov.au/ph/Documents/cdb/15896.pdf
20.Snel SJ, Baker MG, Kamalesh V, French N, Learmonth J. A tale of two parasites: the comparative epidemiology of cryptosporidiosis and giardiasis. Epidemiology and Infection. 2009;137:1641–50
21.Drevenstedt GL, Crimmins EM, Vasunilashorn S, Finch CE. The rise and fall of excess male infant mortality. Proceedings of the National Academy of Sciences. 2008;105(13):5016–21
22.National Research Center for Environment and Health. Babies Swimming In Public Pools Linked To Infections, Study Shows. Journal [serial on the Internet]. 2007 Date 4 March 2011]; (October 8): Available from: http://www.sciencedaily.com/releases/2007/10/071004092121.htm
23.Harp JA, Goff JP. Strategies for the control of Cryptosporidium parvum infection in calves. Journal of Dairy Science. 1998;81(1):289–94
24.Britton E, Hales S, Venugopal K, Baker MG. Positive association between ambient temperature and salmonellosis notifications in New Zealand, 1065–2006. Australian and New Zealand Journal of Public Health. 2010;34(2):126–30
25.Hellard ME, Fairley CK. Gastroenteritis in Australia: who, what, where, and how much? Australian and New Zealand Journal of Medicine. 1997;27(2):147–9
26.Padiglione A, Fairley CK. Early detection of outbreaks of waterborne gastroenteritis. Water. 1998;25(6):11–5
27.Bureau of Meteorology. Victoria temperature change 2030 Summer. Canberra; 2007–2009 [updated 2007–2009; cited 20/08/2010]; Available from: http://climatechangeinaustralia.com.au/
28.Bureau of Meteorology. Australian climate variability & change – Trend maps. Canberra; 2010 [updated 2010; cited 20/08/2010]; Available from: http://www.bom.gov.au/cgi-bin/climate/change/trendmaps.cgi?map=tmean&area=vic&season=0112&period=1970
29.Commonwealth Scientific and Industrial Research Organisation. Climate change projections for Australia: Melbourne Climate Impact Group, CSIRO Division of Atmospheric Research; 2001

Murray Valley encephalitis virus sero-survey of northern Victoria, 2008Simon Slota-Kan, Department of Health and Jennie Leydon, Victorian Infectious Diseases Reference LaboratoryMurray Valley encephalitis (MVE) virus is a mosquito borne flavivirus that can cause serious human illness. In 2008, for the first time since sentinel chicken surveillance began 30 years ago, three sentinel chicken flocks tested positive for MVE virus antibodies in Victoria with ELISA flavivirus testing (Kerang in March 2008, Barooga in April 2008, and Mildura in March 2008). Of the samples tested from 121 individuals, only one sample was positive. This corresponds to a prevalence of 0.8 per cent (95 per cent CI 0.02–4.6). The result indicates that a prevalence of less than five per cent of sub-clinical infections is unlikely. However a significant number of the population aged 30 years and less may be at risk in northern Victoria if the MVE virus continues to circulate in subsequent seasons with higher rainfall and vector numbers.IntroductionMurray Valley encephalitis (MVE) virus is a mosquito borne flavivirus that can cause serious human illness. Viral encephalitis was the most common clinical manifestation in previous outbreaks in humans. MVE virus was first isolated from patients who died from encephalitis in the Murray Valley in Victoria and South Australia in 1951.1
In 2008, for the first time since sentinel chicken surveillance began 30 years ago, three sentinel chicken flocks tested positive for MVE virus antibodies in Victoria with ELISA flavivirus testing (Kerang in March 2008, Barooga in April 2008, and Mildura in March 2008). Subsequent opportunistic equine testing revealed 10 horses with positive MVE virus serology (in Cohuna, Mildura, and Wangaratta). A human case of MVE was detected in March 2008 in the Macquarie Marshes region of NSW.The last known human outbreak of MVE virus in Victoria was in 1974 with 58 patients in South Eastern Australia, of whom 22 were admitted to the Fairfield Infectious Diseases Hospital in Melbourne.2,3 In Victoria the admitted patients came from a large area along the Murray Valley from Mildura to Corowa and as far south as Horsham and Cobram. The patients were of all ages but most commonly children. Serological studies at the time indicated that only 1 in 800 to 1 in 1000 people with serological evidence of infection develop clinical disease.2,3
A sero-survey undertaken in 1974 and 1975 in Echuca, following the 1974 epidemic, estimated a one per cent a year conversion rate.4 A study in northern Victoria and western NSW with samples from Merbein, Cohuna and Nathalia indicated negligible sero-conversions between 1981 and 1991.5 These sero-surveys seem to indicate minimal circulating MVE virus leading to infections in the human population since the 1974 outbreak.We aimed to determine if there has been substantial undetected sub-clinical infection in the community associated with the detection in sentinel chickens and if people 30 years of age and less remain an at-risk, naïve population to MVE virus.
MethodologyThis opportunistic sero-survey was undertaken in people aged 30 years or younger in local communities in northern Victoria. The samples were collected with the assistance of private pathology providers from Kerang and Mildura. Based on a five per cent prevalence of MVE virus, a sample of 292 was necessary for a 2.5 per cent precision with a confidence level of 95 per cent. Due to a limited time frame for the sero-survey, and the need to undertake a rapid risk assessment, a target sample size of 300 was set.The 121 individuals tested were volunteers aged less than thirty years sourced opportunistically from pathology providers in Mildura and Kerang when attending for other clinical reasons. The samples were collected between 11 August and 28 November 2008. Samples were collected with the written consent of the person (or guardian) for the purpose of determining community risk. The volunteers were telephoned with the result if they indicated on the consent form that they would like to be informed.The serum testing followed the Victorian Infectious Diseases Reference Laboratory protocol that was

developed according to the method described by Hall6. An in-house blocking EIA was used. The monoclonal antibody was developed from infected cell cultures infected with MVE (10C6) virus. The testing wells were coated with MVE viral antigen and then the patient sera added with MVE antibodies binding to the antigen. Subsequently the MVE 10C6 monoclonal antibody was added and allowed to bind the complexes formed. These were detected using enzyme activity that was visualised using an OPD substrate that creates a colour change inversely proportional to the MVE antibody present.Serum that inhibited binding of the monoclonal antibodies by more than 50 per cent, when compared to the non reactive control serum, was considered positive (compared with 20 per cent in Hall’s methodology). This increased the specificity of the assay compared to Hall’s.6
It was difficult to estimate specificity and sensitivity because of the small number of tests and small number of positive results. Confirmation was performed in Western Australia laboratories by repeating the serum testing.Sero-prevalence was calculated with a 95 per cent confidence interval utilising a binomial distribution.
ResultsThe samples were obtained from 121 people from 6 months to 30 years of age as shown in Figure 1. Sixty samples were collected from people attending the Kerang pathology collection centres, of which 21 were male. Sixty-one samples were collected from people attending the Mildura pathology collection centres, of which 22 were male.Of the 121 samples tested only one sample was positive, corresponding to a prevalence of 0.8 per cent (95 per cent CI 0.02–4.6), Table 1: Multivariate logistic regression model: comparison between notifications from outbreak years and notifications from non-outbreak years, Victoria 2001–2009
Characteristic*(n=3,395)
Outbreak years (per cent)
Non-outbreak years ( per cent)
OR (95%CI)Outbreak years vs non-outbreak
years p value
Sex 0.384
Male 557 (33.5) 1,106 (66.5) 1.0
Female 630 (36.4) 1,102 (63.6) 1.1 (0.9–1.2)
Age group <0.001
0–9 406 (28.0) 1,046 (72.0) 1.0
10–19 132 (32.6) 273 (67.4) 1.2 (1.0–1.6)
20–39 389 (40.4) 574 (59.6) 1.6 (1.4–1.9)
40+ 260 (45.2) 315 (54.8) 2.0 (1.6–2.4)
Region <0.001
Rural 387 (28.6) 965 (71.4) 1.0
Metropolitan 800 (39.2) 1,243 (60.8) 1.4 (1.2–1.6)
Season <0.001
Summer 335 (34.6) 632 (65.4) 1.0
Autumn 524 (45.1) 639 (54.9) 1.5 (1.3–1.8)
Winter 200 (30.2) 463 (69.8) 0.9 (0.7–1.1)
Spring 128 (21.3) 474 (78.7) 0.5 (0.4–0.7)
* Notifications with missing values for any of the variables were excluded

DiscussionThis rapid opportunistic sero-survey obtained samples from 121 people; which is less than optimal with regard to the sample size calculations.The samples were obtained from a population that were too young to be exposed to the last recorded Murray Valley encephalitis outbreak in Victoria in 1974 (34 years previously). In this sero-survey a single reactive serum sample was found in samples collected from pathology collection centres in two towns of northern Victoria. This result is comparable to a previously unreported 2002 Victorian sero-survey that had 116 samples from people under 40 years of age from various regions around Victoria with none that were reactive, therefore a prevalence rate of zero, with a 95 per cent confidence interval of 0.0–3.1 (Mike Catton VIDRL, personal communication). This result is also consistent with previous sero-surveys that indicated minimal circulating Murray Valley virus (or asymptomatic disease) in northern Victoria since 1974.5 Since a population 30 years of age or younger appears to be naïve to the MVE virus it is likely to form an at-risk population with a re-emergence of MVE.Spread of the virus to humans may have been limited by the unprecedented drought conditions that persisted in northern Victoria in 2008.The drought meant that there were low numbers of mosquito vectors (Culex annulirostris). Amplification of the MVE virus may have occurred in the bird populations clustered around the remaining water sources, but low vector numbers may have limited the spread to humans. This may change in subsequent seasons if there is significant rain and increased mosquito numbers. In the summer of 2010/2011 there has been unprecedented rain and flooding. This has resulted in detections of MVE virus antibodies in sentinel chickens along the Murray River. There have been large mosquito vector numbers and detections in opportunistic equine testing. To date no human cases have been confirmed and a further sero-prevalence study is planned.The main limitation of this study is the small sample size due to practical and logistical difficulties in obtaining specimens in a limited time frame. Testing had to be completed before the next mosquito season giving only a limited number of months to collect samples. The target sample size of 300 could not be obtained. However the study is consistent with and builds on previous surveys. It adds to the information needed to guide a rational risk management approach to management of MVE in northern Victoria.
AcknowledgementsWe are grateful to the colleagues who collaborated in the supply and testing of sera for this survey, particularly St John of God Pathology, Gribbles Pathology and the Victorian Infectious Diseases Reference Laboratory.
References1. French EL. Murray Valley encephalitis isolation and characterization of the aetiological agent. Med J Aust.
1952; 1(4): 100–32. Bennett NM. Murray Valley encephalitis, 1974: clinical features. Med J Aust 1976; 2(12): 446–50.3. Bennet N. Murray Valley encephalitis: indeed a ‘Mysterious disease’. Victorian Infectious Diseases Bulletin.
2008 Dec;11(4):94–107
4. Fraser JR, Christie DG et al. ‘Arbovirus infection in a Murray Valley community.’ Aust N Z J Med. 1986; 16(1): 52–7
5. Hawkes RA, Pamplin J et al. Arbovirus infections of humans in high-risk areas of south-eastern Australia: a continuing study. Med J Aust. 1993; 159(3): 159–62
6. Hall RA, Broom AK et al. Immunodominant epitopes on the NS1 protein of MVE and KUN viruses serve as targets for a blocking ELISA to detect virus-specific antibodies in sentinel animal serum. J Virol Methods. 1995; 51(2–3): 201–10

There is more to chickens than KFC!Rodney Moran, Communicable Disease Prevention and Control Unit, Health Protection Branch, Department of Health, Victoria
Around 490 million chickens are produced and processed for chicken meat each year in Australia1. This equates to more than 750 million kg of chicken meat. Consumption (and production) of chicken meat has steadily increased over the past 50 years to reach about 33kg per annum per person, roughly equal to the consumption of red meat.Now that you know that, did you know that each year in late October until around mid March the Department of Health in partnership with the Department of Primary Industry (DPI) uses 200 chickens across 10 sites along the Murray River, bleeding them weekly for a range of mosquito borne infections? These are known as sentinel chickens.The major infection we are looking for is Murray Valley encephalitis (MVE). This is a potentially fatal disease in humans which occurs sporadically in the Murray Darling Basin. Mosquitoes act as the vector for the virus, and the mosquitoes can spread the virus to the human population from infected birds in the environment. A drop of blood is collected from the wing vein of the chicken onto filter paper, dried, and forwarded to the DPI for rehydrated and testing for antibodies.Why chickens? – Two reasons:Poultry are a natural host for MVE, therefore the chickens will not suffer any adverse impacts due to infection by the mosquito borne infection. The sentinel chicken flocks can provide up to six weeks warning prior to MVE entering the human population. Finding MVE early in the poultry allows time to implement prevention and control activities. The chickens are easy to catch, hold and get blood from. The poultry are maintained on private property and are given adequate security, food and water supplies by the poultry manager. The poultry manager keeps the eggs and keeps the chickens at the end of each season. So while not only tasting good (if cooked properly) and being very nutritional, next time you see a chicken remember it may be playing an important part in human disease surveillance.1. Australian Chicken Meat Federation at http://www.chicken.org.au

Trends in Haemophilus influenzae serotyping, Victoria 2006–2010Janet Strachan, Marion Easton, Margaret Whipp and Geoff Hogg, Microbiological Diagnostic Unit, Public Health Laboratory, University of MelbourneHaemophilus influenzae (Hi) can be differentiated into six serotypes, a to f, based on its capsular polysaccharide. Prior to the introduction of conjugate vaccines, Haemophilus influenzae type b (Hib) was a common cause of invasive infection in young children. Since the inclusion of Hib vaccine in the immunisation schedule in the 1990s, incidence of Hib disease has dramatically declined. There has been concern for possible disease replacement with either capsulated strains of Hi types other than b, or non-capsulated strains (ncHi). An earlier report summarised Victorian Hi infections in the period shortly after the introduction of the Hib conjugate vaccine.1 Here we present Hi typing data from the Microbiological Diagnostic Unit – Public Health Laboratory (MDU) from bloodstream and meningeal infections in Victoria from 2006–2010 and compare data with the earlier period.
MethodsThe MDU is a reference facility in the state of Victoria. It performs isolation, identification and epidemiological typing on a range of bacteria of public health importance. The MDU also co-ordinates the Victorian Hospital Pathogens Surveillance Scheme (VHPSS), a voluntary laboratory-based reporting system for bacteria and fungi isolated from human bloodstream and cerebrospinal fluid (CSF) infections. We analysed VHPSS reports received at MDU from 1 January 2006 to 31 December 2010. Submitting laboratories included public and private facilities, large metropolitan tertiary referral hospitals and smaller regional centres. Laboratories were actively encouraged to submit strains for typing.Cultures were initially confirmed as Hi using gram, oxidase and X and V requirements. Isolates were biotyped on the basis of test results for indole, urease and ornithine decarboxylase.2 Serotyping was performed using the Phadebact co-agglutination test, and standard slide agglutination with Difco (polyvalent) and Remel (individual a, b, c, d, e, and f) rabbit antisera. Polymerase chain reaction (PCR) was performed on a subset of non-capsulated strains for: the ompP2 gene to confirm isolates were Hi;3 bexAI/AII genes to determine ability to produce capsule;4,5,6 and presence of type gene capB (for type b).5
ResultsAfter the exclusion of duplicates (Hi cultured from a patient within 14 days of an earlier isolation), there were 222 Hi episodes reported to the VHPSS from 2006 to 2010, with 210 of the 222 isolates submitted to MDU from 21 labs. Of the 210 Hi received, 16 (7.6 per cent) were Hib, 24 (11.4 per cent) were other capsulated Hi, and 170 (81.0 per cent) were non-capsulated Hi (ncHi). Hi type f (Hif) was the most common capsulated type (19/210; 9.0 per cent). Of the additional twelve Hi notifications made to the VHPSS where no isolate was submitted, four were reported as “non-type b” (Table 1). Non-capsulated Hi were more common than capsulated Hi in all age groups (Table 2). There were eight infections reported in neonates less than four weeks old. All eight occurred within two days of birth. Seven were ncHi, and the eighth isolate was not submitted but was reported as non-type b. There were two Hib infections in infants less than one year old (two and ten months old).Overall, there was little difference in the number of infections in males (n=100) and females (n=122), except among persons aged 20 to 44 with ncHi, where the male to female ratio was one to five, and for those over 60 years of age with Hif, where the ratio was one to 11. Most reports (61.7 per cent) did not include clinical information, although for four of the women in the 20 to 44 age group, details of pre- or post-natal conditions were provided. There was a clear seasonal pattern for the ncHi, with most infections (50.3 per cent) occurring in late winter to early spring (July to October). Most Hib and Hif were biotype I (Table 3). The 13 ncHi biotype I, plus the additional 36 ncHi of other biotypes from persons less than 20 years old were tested further for ompP2, bexAI / AII and capB. They were all positive for ompP2, but negative for the capsular expression genes bex AI/II

and capsular type gene capB.There were 11 isolates from patients with meningitis. Most meningitis was caused by ncHi (72.7 per cent) (Table 4). Clinical notes from three of the patients indicate they had shunt infections.Cefotaxime/ceftriaxone and amoxycillin susceptibility was reported for 202 and 212 of the 222 Hi infections respectively. There were no reports of resistance to the third generation cephalosporins, but 52 of the 212 isolates (24.5 per cent) were reported as resistant to amoxycillin, with an additional isolate reported as having intermediate susceptibility. Five of the sixteen Hib isolates (31.3 per cent) were reported as amoxycillin resistant.Table 1: Typing results of Victorian Hi bloodstream and CSF infections reported to VHPSS 2006–2010, by year
Year Type b Type d Type e Type f ncHi
Isolate not submitted (non-type b)
Isolate not submitted (not typed) Total
2006 2 1 31 4 4 42
2007 3 1 2 6 23 35
2008 5 2 37 1 45
2009 2 2 3 31 1 39
2010 4 7 48 2 61
Total 16 1 4 19 170 4 8 222
Table 2: Typing results of Victorian Hi bloodstream and CSF infections reported to the VHPSS 2006–2010, by age group
Age (years) Type b Type d Type e Type f ncHi
Isolate not submitted (non-type
b)
Isolate not submitted (not typed) Total
0 2 1 1 13 1 18
1 1 1 5 7
2 7 7
3 2 2
4 1 1 2 4
5–14 2 9 1 13
15–59 8 1 4 41 4 58
60+ 2 3 12 91 2 3 113
Total 16 1 4 19 170 4 8 222
Table 3: Type and biotype for Victorian Hi bloodstream and CSF isolates submitted to MDU 2006–2010
Biotype Type b Type d Type e Type f ncHi Total
I 15 1 2 17 13 48
II 1 1 94 96
III 47 47
IV 2 3 5
V 10 10

VI 1 2 3
VII 1 1
Total 16 1 4 19 170 210
Table 4: Age, Type and Biotype of Victorian Hi meningitis infections reported to the VHPSS 2006–2010
Age Type Biotype
4 mth Hie I
10 mth Hib I
2 y ncHi V
5 y Hib I
6 y ncHi I
22 y ncHi II
29 y ncHi II
30 y ncHi II
39 y ncHi III
46 y ncHi II
82 y ncHi II
DiscussionThe Victorian data presented here are from voluntarily submitted VHPSS reports and isolates. All diagnostic laboratories within the state were represented. Previous VHPSS audits indicate that nearly all Hi isolates are referred to MDU (personal communication Marion Easton, VHPSS coordinator). The 2006 to 2010 VHPSS data for Hib correlate with the number of notifications received by the National Notifiable Diseases Surveillance Scheme System (NNDSS).7
As with other states and territories in Australia, notification of invasive disease with Hi to the Victorian Department of Health is restricted to type b. Only South Australia and the Northern Territory require notification of invasive disease of all Hi. Data on non-type b Hi infections are not systematically collected in Australia. Hospital statistics data collated by the Australian Institute of Health and Welfare (AIHW) include ICD-10-AM coded information for a variety of Hi infections, but such data generally underestimate the true incidence of disease.8 Since the introduction of the Hib conjugate vaccine, most Hib now occurs in adults. The majority of meningeal and bloodstream Hi infections in both children and adults in Victoria are due to ncHi, as has been found elsewhere.9,10,11 The proportion of Victorian Hi disease due to non-capsulated strains has been steadily increasing since the mid 1990s.1 The marked seasonality in ncHi observed in the 2006 to 2010 period was also apparent in the previous decade.1
The predominance of Hif among non-type b encapsulated isolates is similar to European data,9 although in other populations Hia 11 or Hie 10 are slightly more common. A US study found that Hif strains causing invasive disease were genetically similar and possibly represent a hypervirulent clone.12
It has been suggested that childbearing women may be at risk for invasive ncHi infection.9 Although the number of reports among 20 to 44 year olds was low, there were over four times as many infections for females as males in this age group.There have been reports of non-haemolytic Haemophilus haemolyticus which are phenotypically indistinguishable from Hi found in patients with chronic respiratory illness.13 The ompP2 gene is considered

specific for Hi,3 with PCR for this gene confirming that the ncHi we tested were not H. haemolyticus. The absence of bex AI/AII or capB genes excluded type b capsule deficient strains which have been previously described.14
The level of reported amoxycillin resistance (24.5 per cent) among Victorian Hi is unchanged from earlier years.1 Analysis of Hi strains overseas has shown a change in the mechanism of Hi amoxycillin resistance.10,15
While previously resistance was beta-lactamase mediated, it is now commonly due to an altered PBP3.10 The level of resistance of Hib (31.3 per cent) was higher than found elsewhere, although the numbers were low. Although ncHi is an important and possibly increasing cause of severe invasive infection,9 in children it more commonly causes non-invasive infections such as otitis media, sinusitis and conjunctivitis.16 Promising results showing reduction in Hi carriage and incidence of otitis media have been obtained from clinical vaccine trials with pneumococcal capsular polysaccharide conjugated to Hi protein D.17 It is not yet known if a reduction in Hi invasive disease may also occur. Despite only Hib being notifiable in Victoria, we encourage the ongoing submission of all Hi isolates from invasive infections. Surveillance is necessary to monitor the effectiveness of immunisation programs, and to identify the need for future vaccines.
Acknowledgements We gratefully acknowledge the contributions of Hi isolates and data from Victorian laboratories, and the technical assistance of Jocelyn Hibberd, Julia Griffith, Jenny Davis, Kerrie Stevens, Despina Stylianos, Samantha Tawil and Erin Lysaght. All data are subject to revision.1. Easton M, Veitch M. Ten years of Haemophilus influenzae bloodstream infections and meningitis in
Victoria: reports to the Victorian Hospital Pathogens Surveillance Scheme, 1996–2005. Victorian Infectious Diseases Bulletin 2006; 9 (4): 94–95
2. Winn WC, Allen SD, Janda WM, Koneman EW, Procop GW, Schreckenberger PC and Woods GL (2006) , Miscellaneous fastidious gram-negative bacilli: Haemophilus species in Koneman’s Color Atlas and Textbook of Diagnostic Microbiology, Chapter 9, 6th Edition, Lippincott William & Wilkins, Baltimore, MD 21201, pp 431–452
3. Hobson RP, Williams A, Rawal K, Pennington TH, Forbes KJ. Incidence and spread of Haemophilus influenzae on an Antarctic base determined using the polymerase chain reaction. Epidemiol Infect. 1995; 114:93–103
4. Van Ketel RJ, De Wever B, Van Alphen L. Detection of Haemophilus influenzae in cerebrospinal fluids by polymerase chain reaction DNA amplification. J Med Microbiol 1990; 33:271–276
5. Falla TJ, Crook DWM, Brophy LN, Maskell D, Kroll JS, Moxon ER. PCR for capsular typing of Haemophilus influenzae. J Clin Microbiol 1994; 32:2382–2386
6. Zhou Jianwei, Law DKS, Sill ML, Tsang RSW. Nucleotide sequence diversity of the bexA gene in serotypeable Haemophilus influenzae strains recovered from invasive disease patients in Canada. J Clin Microbiol 2007; 45 (6): 1996–1999
7. Australian Government Department of Health and Ageing National Notifiable Diseases Surveillance Scheme (NNDSS) http://www9.health.gov.au/cda/Source/Rpt_4.cfm (accessed 12/5/2011)
8. Stevens S, Unwin CE, Codde J P. A review of hospital medical record audits: implications for funding and training. Aust Health Rev 1998; 21(3):78–91
9. Ladhani S, Slack MPE, et al. Invasive Haemophilus influenzae disease, Europe, 1996–2006. Emerg Infect Dis 2010; 16(3): 455–463
10. Giufrè M, Cardines R, et al. Ten years of Hib vaccination in Italy: Prevalence of non-encapsulated Haemophilus influenzae among invasive isolates and the possible impact on antibiotic resistance. Vaccine 2011; 29(22): 3857–3862
11. Shuel M, Hoang L, et al. Invasive Haemophilus influenzae in British Columbia: non-Hib and non-typeable strains causing disease in children and adults. Int J Infect Dis 2011; 15(3): e167–173.
12. Omikunle A, Takahashi S, Ogilvie CL, Wang Y, Rodriguez CA, et al. Limited genetic diversity of recent invasive isolates of non-serotype b encapsulated Haemophilus influenzae. J Clin Microbiol 2002; 40 (4) 1264–1270
13. Murphy T F, Brauer AL, et al. Haemophilus haemolyticus: a human respiratory tract commensal to be distinguished from Haemophilus influenzae. J Infect Dis 2007; 195(1): 81–89
14. Falla T J, Anderson EC, et al. Cross-reaction of spontaneous capsule-deficient Haemophilus influenzae

type b mutants with type-specific antisera. Eur J Clin Microbiol Infect Dis 1993; 12(2): 147–14815. Institute of Environmental and Science and Research (ESR) Report on Antimicrobial susceptibility of
invasive Haemophilus influenzae, 2009 http://www.surv.esr.cri.nz/PDF_surveillance/Antimicrobial/HIN/HIN_2009.pdf (accessed 17/05/2011)
16. Murphy T F, Faden H, et al. Nontypeable Haemophilus influenzae as a pathogen in children. Pediatr Infect Dis J 2009; 28(1): 43–48
17. Prymula R, Kriz P, et al. Effect of vaccination with pneumococcal capsular polysaccharides conjugated to Haemophilus influenzae-derived protein D on nasopharyngeal carriage of Streptococcus pneumoniae and H. influenzae in children under 2 years of age. Vaccine 2009; 28(1): 71–78.

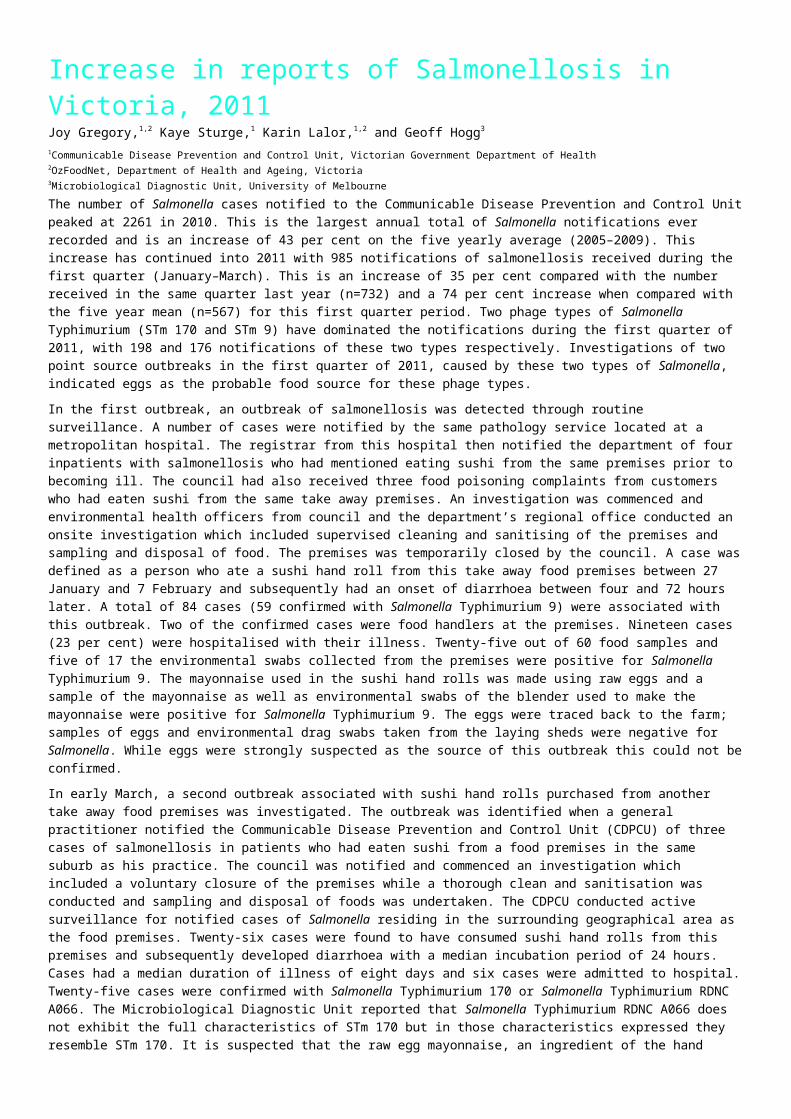
Increase in reports of Salmonellosis in Victoria, 2011Joy Gregory,1,2 Kaye Sturge,1 Karin Lalor,1,2 and Geoff Hogg3 1Communicable Disease Prevention and Control Unit, Victorian Government Department of Health2OzFoodNet, Department of Health and Ageing, Victoria3Microbiological Diagnostic Unit, University of MelbourneThe number of Salmonella cases notified to the Communicable Disease Prevention and Control Unit peaked at 2261 in 2010. This is the largest annual total of Salmonella notifications ever recorded and is an increase of 43 per cent on the five yearly average (2005–2009). This increase has continued into 2011 with 985 notifications of salmonellosis received during the first quarter (January–March). This is an increase of 35 per cent compared with the number received in the same quarter last year (n=732) and a 74 per cent increase when compared with the five year mean (n=567) for this first quarter period. Two phage types of Salmonella Typhimurium (STm 170 and STm 9) have dominated the notifications during the first quarter of 2011, with 198 and 176 notifications of these two types respectively. Investigations of two point source outbreaks in the first quarter of 2011, caused by these two types of Salmonella, indicated eggs as the probable food source for these phage types. In the first outbreak, an outbreak of salmonellosis was detected through routine surveillance. A number of cases were notified by the same pathology service located at a metropolitan hospital. The registrar from this hospital then notified the department of four inpatients with salmonellosis who had mentioned eating sushi from the same premises prior to becoming ill. The council had also received three food poisoning complaints from customers who had eaten sushi from the same take away premises. An investigation was commenced and environmental health officers from council and the department’s regional office conducted an onsite investigation which included supervised cleaning and sanitising of the premises and sampling and disposal of food. The premises was temporarily closed by the council. A case was defined as a person who ate a sushi hand roll from this take away food premises between 27 January and 7 February and subsequently had an onset of diarrhoea between four and 72 hours later. A total of 84 cases (59 confirmed with Salmonella Typhimurium 9) were associated with this outbreak. Two of the confirmed cases were food handlers at the premises. Nineteen cases (23 per cent) were hospitalised with their illness. Twenty-five out of 60 food samples and five of 17 the environmental swabs collected from the premises were positive for Salmonella Typhimurium 9. The mayonnaise used in the sushi hand rolls was made using raw eggs and a sample of the mayonnaise as well as environmental swabs of the blender used to make the mayonnaise were positive for Salmonella Typhimurium 9. The eggs were traced back to the farm; samples of eggs and environmental drag swabs taken from the laying sheds were negative for Salmonella. While eggs were strongly suspected as the source of this outbreak this could not be confirmed. In early March, a second outbreak associated with sushi hand rolls purchased from another take away food premises was investigated. The outbreak was identified when a general practitioner notified the Communicable Disease Prevention and Control Unit (CDPCU) of three cases of salmonellosis in patients who had eaten sushi from a food premises in the same suburb as his practice. The council was notified and commenced an investigation which included a voluntary closure of the premises while a thorough clean and sanitisation was conducted and sampling and disposal of foods was undertaken. The CDPCU conducted active surveillance for notified cases of Salmonella residing in the surrounding geographical area as the food premises. Twenty-six cases were found to have consumed sushi hand rolls from this premises and subsequently developed diarrhoea with a median incubation period of 24 hours. Cases had a median duration of illness of eight days and six cases were admitted to hospital. Twenty-five cases were confirmed with Salmonella Typhimurium 170 or Salmonella Typhimurium RDNC A066. The Microbiological Diagnostic Unit reported that Salmonella Typhimurium RDNC A066 does not exhibit the full characteristics of STm 170 but in those characteristics expressed they resemble STm 170. It is suspected that the raw egg mayonnaise, an ingredient of the hand rolls, was the source of this outbreak. Since 2007, there has been a sharp increase in the number of egg associated Salmonella outbreaks notified to and investigated by CDPCU. In the four years between 2003 and 2006 inclusive, seven outbreaks were associated with the consumption of foods containing raw or lightly cooked eggs. In the subsequent four years this number more than tripled to 23 outbreaks. Foods containing raw egg implicated in these outbreaks included chocolate mousse, aioli and mayonnaise, tiramisu and milkshakes. Foods which contain minimally cooked eggs such as hollandaise sauce and desserts with a custard or crème anglaise base have also been
implicated. It is also suspected that eggs play a role in Salmonella outbreaks in aged care facilities through cross contamination; food processing equipment may be contaminated with Salmonella from uncooked eggs if inadequately cleaned before being used to process foods which are ready-to-eat. Of 32 egg associated outbreaks investigated between 2003 and 2011 year to date (31 March 2011) at least 429 people have been affected and approximately 92 (21 per cent) have been hospitalised. In 17 of these outbreaks the food was prepared in commercial food premises such as restaurants and take away food stores; 14 were associated with foods prepared in private homes and one was related to food prepared in an aged care facility. In several of these investigations eggs were collected and submitted to MDU for analysis. Salmonella was isolated from a wash of the outside of eggs collected in relation to three separate outbreaks. The true number of people ill as a result of consuming contaminated egg products is likely to be much greater than these figures suggest as this only represents confirmed and suspected Salmonella cases associated with identified point source outbreaks and not single sporadic cases for which a source is not as easily identified. In addition, for every confirmed case of Salmonella that is notified to the surveillance system it has been estimated that there are approximately seven undiagnosed cases in the community.1 In 2008, an eggs and Salmonella communication strategy was initiated. The campaign ‘Buy Clean, Keep Cool and Cook Well’ involved a working group comprising stakeholders from the department (CDPCU and Food Safety and Regulatory Activities Unit), OzFoodNet, Department of Primary Industries and the Victorian Farmers Federation Egg Group. The communication strategy included a pre and post campaign survey of consumers about their awareness and understanding of egg food safety, a pre and post campaign survey of food service businesses about their use of raw eggs in ready-to-eat foods; and a pre and post campaign survey of egg retailers about their egg storage and display temperatures. A series of egg safety brochures targeted at consumers, food service businesses, egg retailers and distributors and egg producers was developed as part of this campaign. Associated media releases and a launch of the campaign occurred over the summer of 2008/2009.2 Food Standards Australia and New Zealand have developed an Egg Primary Production Standard to address food safety within the egg supply chain. The standard sets out a number of food safety requirements for the primary production and processing of eggs, egg pulp and other egg products for human consumption.3 The implementation phase for this standard is 18 months from the gazettal date. In April 2011, a working group of senior staff from the department’s Health Protection Branch and the Microbiological Diagnostic Unit was formed to address the current increase in egg-related salmonellosis and decide on appropriate public health action. Some of the actions arising from this meeting include: the development of an options paper to look at long term strategies addressing policy and possible regulatory options; the development of an audit tool to complement this approach; and a communication strategy to complement and enhance the messages provided in the previous strategy conducted in 2008. Part of this strategy will include networking with local government environmental health officers who will play a key role in communicating to registered food businesses, the hazards associated with preparing and serving ready-to-eat foods containing raw or lightly cooked eggs and encouraging safer alternatives to this practice.
The department would like to acknowledge; Leanne Johnson (Whitehorse City Council), Troy Palmer (Boroondara City Council) Houa Tia and Richard Gonsal-Nichols (Eastern Metropolitan Region, Department of Health) for their on-site investigation of the two point source outbreaks; Andrew Mahony, Melissa Wright, Rebecca Katiforis, Dania Thaker, Sara Radwan, Aicha Brahmi, Nathalie Allaz-Barnett and David Rodda (Communicable Disease Prevention and Control Unit) for interviewing cases associated with these outbreaks; Mira Antoniou and Cameron Laidlaw (Food Safety and Regulation Unit); and staff from the Microbiological Diagnostic Unit, University of Melbourne involved with testing of food, faecal specimens and isolates and their participation on the department’s Salmonella working group.
References1. Hall G, Yohannes K, Raupach J, et al, Estimating community incidence of Salmonella, Campylobacter, and
Shiga toxin-producing Escherichia coli infections, Australia. Emerging Infectious Diseases. 2008; 14(10): 1601–1609
2. Victorian Government Department of Health, Victorian Egg Communication Strategy. Victorian Infectious Diseases Bulletin. 2009; 11(4): 108
3. Food Standards Australia New Zealand. Final Assessment Report Proposal P301, Primary Production and
Processing Standard For Eggs and Egg Products. Available from: http://www.foodstandards.gov.au/foodstandards

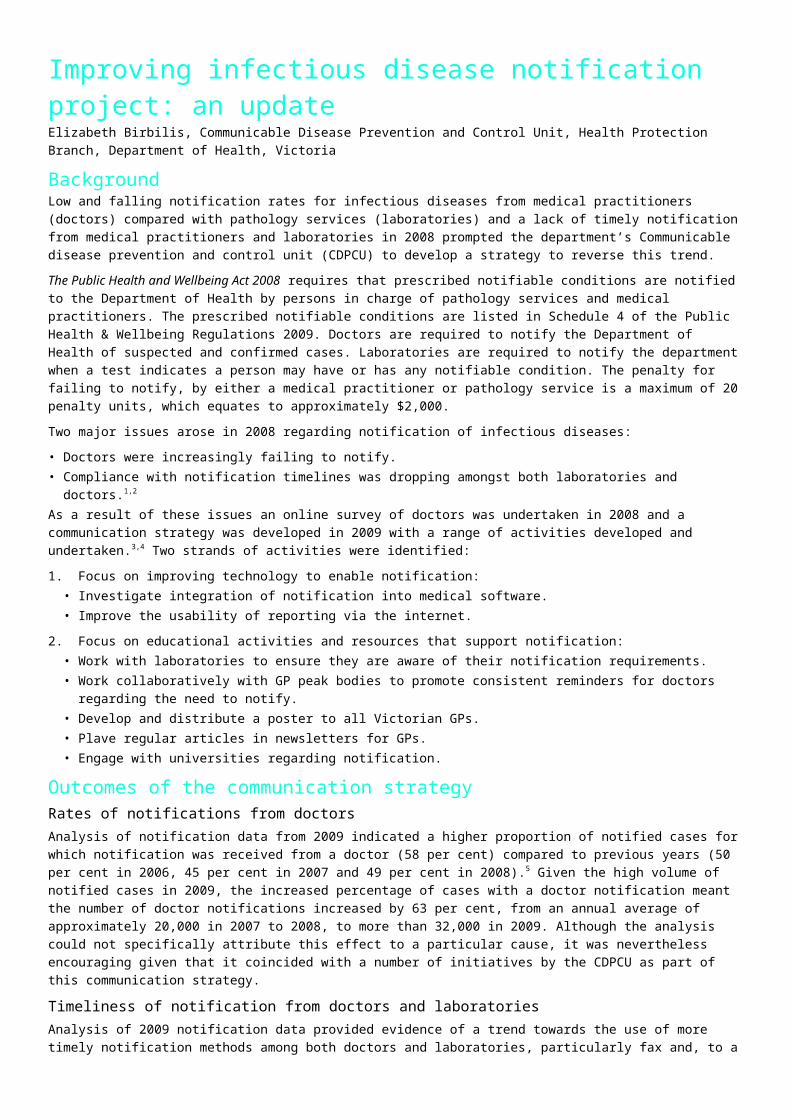
Improving infectious disease notification project: an updateElizabeth Birbilis, Communicable Disease Prevention and Control Unit, Health Protection Branch, Department of Health, Victoria
BackgroundLow and falling notification rates for infectious diseases from medical practitioners (doctors) compared with pathology services (laboratories) and a lack of timely notification from medical practitioners and laboratories in 2008 prompted the department’s Communicable disease prevention and control unit (CDPCU) to develop a strategy to reverse this trend. The Public Health and Wellbeing Act 2008 requires that prescribed notifiable conditions are notified to the Department of Health by persons in charge of pathology services and medical practitioners. The prescribed notifiable conditions are listed in Schedule 4 of the Public Health & Wellbeing Regulations 2009. Doctors are required to notify the Department of Health of suspected and confirmed cases. Laboratories are required to notify the department when a test indicates a person may have or has any notifiable condition. The penalty for failing to notify, by either a medical practitioner or pathology service is a maximum of 20 penalty units, which equates to approximately $2,000.Two major issues arose in 2008 regarding notification of infectious diseases:• Doctors were increasingly failing to notify.• Compliance with notification timelines was dropping amongst both laboratories and doctors.1,2
As a result of these issues an online survey of doctors was undertaken in 2008 and a communication strategy was developed in 2009 with a range of activities developed and undertaken.3,4 Two strands of activities were identified:1. Focus on improving technology to enable notification:
• Investigate integration of notification into medical software.• Improve the usability of reporting via the internet.
2. Focus on educational activities and resources that support notification:• Work with laboratories to ensure they are aware of their notification requirements.• Work collaboratively with GP peak bodies to promote consistent reminders for doctors regarding the
need to notify.• Develop and distribute a poster to all Victorian GPs.• Plave regular articles in newsletters for GPs.• Engage with universities regarding notification.
Outcomes of the communication strategyRates of notifications from doctorsAnalysis of notification data from 2009 indicated a higher proportion of notified cases for which notification was received from a doctor (58 per cent) compared to previous years (50 per cent in 2006, 45 per cent in 2007 and 49 per cent in 2008).5 Given the high volume of notified cases in 2009, the increased percentage of cases with a doctor notification meant the number of doctor notifications increased by 63 per cent, from an annual average of approximately 20,000 in 2007 to 2008, to more than 32,000 in 2009. Although the analysis could not specifically attribute this effect to a particular cause, it was nevertheless encouraging given that it coincided with a number of initiatives by the CDPCU as part of this communication strategy. Timeliness of notification from doctors and laboratoriesAnalysis of 2009 notification data provided evidence of a trend towards the use of more timely notification methods among both doctors and laboratories, particularly fax and, to a lesser extent, the internet (available for doctor notifications only).5 A corresponding decrease was seen in postal notifications, which among laboratory notifiers has decreased from 71 per cent in 2006 to 51 per cent in 2009. The percentage of notifications from doctors received via the post has also decreased considerably from 58 per cent in 2006, to 54 per cent in 2007, 50 per cent in 2008, and 40 per cent in 2009. The increasing use of rapid notification technologies is encouraging and allows for more timely investigation and assessment of infectious diseases

epidemiology in Victoria. However, opportunities for improvement are yet to be fully exploited, particularly with regard to electronic notification of laboratory results. The CDPCU is continuing to develop such a system, to be incorporated into the major redevelopment of the Notifiable Infectious Disease System (NIDS) database currently being undertaken.In general, the timeliness of notification for each method, as assessed the length of time between the signature date on a notification and the receipt of that notification by the department, differed little from that observed from 2006 to 2008.
DiscussionImproving notification rates is an ongoing role of the CDPCU, therefore these activities will be updated every two years based on notification trends and practices. An on-line survey will be undertaken every four years followed by a strategy review.The activities listed above were updated and revised:1. Focus on improving technology to enable notification – this is an ongoing activity. 2. Focus on educational activities and resources that support notification
• Work with laboratories to ensure they are aware of their notification requirements – communication has been made with laboratories in the form of a letter as well as through a laboratory liaison group.
• Work collaboratively with GP peak bodies to promote consistent reminders for doctors regarding the need to notify – this is an ongoing activity.
• Develop and distribute a poster to all Victorian GPs – the poster was updated and resent to general practices.
• Place regular articles in newsletters for GPs – this is an ongoing activity.• Engage with universities and education providers regarding notification – this is an ongoing activity.
Having both doctors and laboratories notify provides an important safety net for the capture of these crucial data on prescribed conditions affecting the Victorian community. This information is used to respond to cases with appropriate public health action, detect clusters and outbreaks and prevent further cases (through case control, contact tracing and identification of sources of exposure) and monitor disease epidemiology to implement interventions that to protect public health.
Acknowledgments We acknowledge and appreciate general practice peak bodies for their continued collaboration in this important project.
References1. Fielding J. Infectious diseases notification trends and practices in. Victoria, 2004. Victorian Infectious
Diseases Bulletin 2005; 8:72–752. Fielding J. Infectious diseases notification trends and practices in Victoria, 2006. Victorian Infectious
Diseases Bulletin 2007 10:4; 86–93. Birbilis E and Moran R. Improving infectious disease notification rates: a medical practitioner survey,
Victorian Infectious Diseases Bulletin 2009; 12:12–144. Berzins R and Fielding J. Medical practitioner notification trends and practices in Victoria, 2007–2008.
Victorian Infectious Diseases Bulletin. 2009; 12:7–115. Fielding J. Infectious diseases notification trends and practices in Victoria, 2009, Victorian Infectious
Diseases Bulletin 2010; 13:85–90
Further InformationInformation on notifying cases of infectious diseases, including why, what and how (for
example, electronic notification) and the Quick guide for notifiable conditions in Victoria is available at:
http://www.health.vic.gov.au/ideas/notifying
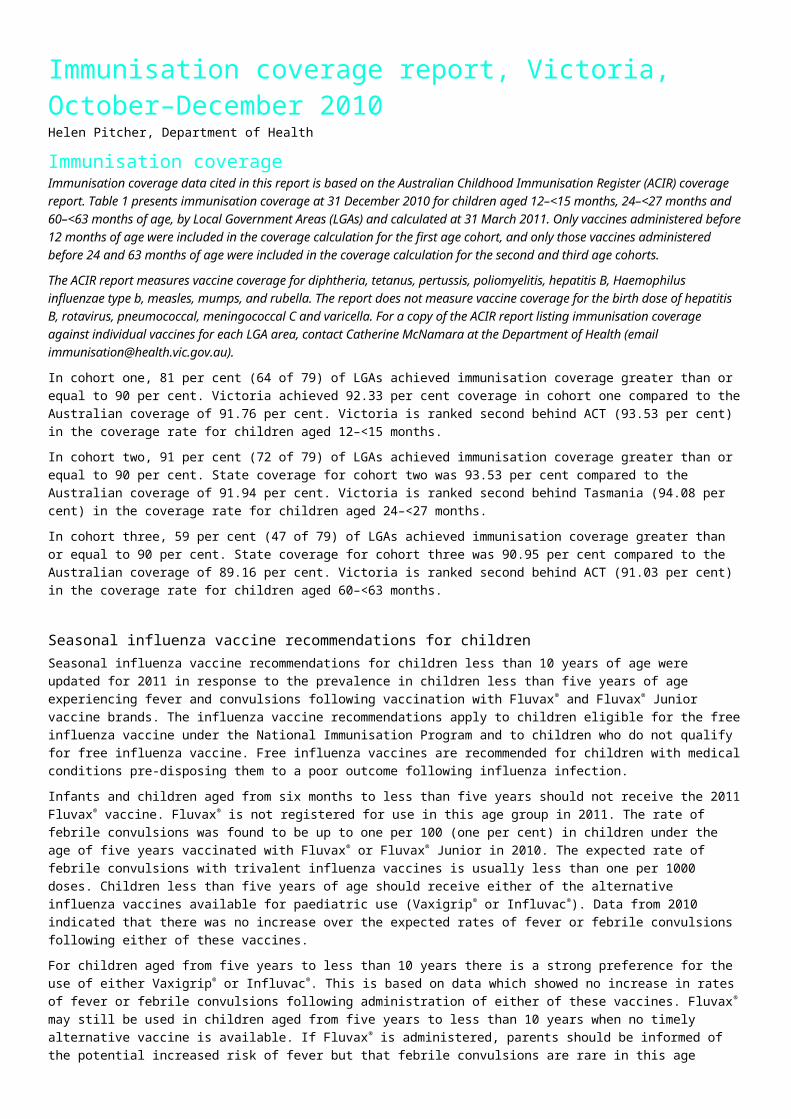
Immunisation coverage report, Victoria, October–December 2010Helen Pitcher, Department of Health
Immunisation coverageImmunisation coverage data cited in this report is based on the Australian Childhood Immunisation Register (ACIR) coverage report. Table 1 presents immunisation coverage at 31 December 2010 for children aged 12–<15 months, 24–<27 months and 60–<63 months of age, by Local Government Areas (LGAs) and calculated at 31 March 2011. Only vaccines administered before 12 months of age were included in the coverage calculation for the first age cohort, and only those vaccines administered before 24 and 63 months of age were included in the coverage calculation for the second and third age cohorts.
The ACIR report measures vaccine coverage for diphtheria, tetanus, pertussis, poliomyelitis, hepatitis B, Haemophilus influenzae type b, measles, mumps, and rubella. The report does not measure vaccine coverage for the birth dose of hepatitis B, rotavirus, pneumococcal, meningococcal C and varicella. For a copy of the ACIR report listing immunisation coverage against individual vaccines for each LGA area, contact Catherine McNamara at the Department of Health (email [email protected]).
In cohort one, 81 per cent (64 of 79) of LGAs achieved immunisation coverage greater than or equal to 90 per cent. Victoria achieved 92.33 per cent coverage in cohort one compared to the Australian coverage of 91.76 per cent. Victoria is ranked second behind ACT (93.53 per cent) in the coverage rate for children aged 12–<15 months.In cohort two, 91 per cent (72 of 79) of LGAs achieved immunisation coverage greater than or equal to 90 per cent. State coverage for cohort two was 93.53 per cent compared to the Australian coverage of 91.94 per cent. Victoria is ranked second behind Tasmania (94.08 per cent) in the coverage rate for children aged 24–<27 months.In cohort three, 59 per cent (47 of 79) of LGAs achieved immunisation coverage greater than or equal to 90 per cent. State coverage for cohort three was 90.95 per cent compared to the Australian coverage of 89.16 per cent. Victoria is ranked second behind ACT (91.03 per cent) in the coverage rate for children aged 60–<63 months.
Seasonal influenza vaccine recommendations for childrenSeasonal influenza vaccine recommendations for children less than 10 years of age were updated for 2011 in response to the prevalence in children less than five years of age experiencing fever and convulsions following vaccination with Fluvax® and Fluvax® Junior vaccine brands. The influenza vaccine recommendations apply to children eligible for the free influenza vaccine under the National Immunisation Program and to children who do not qualify for free influenza vaccine. Free influenza vaccines are recommended for children with medical conditions pre-disposing them to a poor outcome following influenza infection. Infants and children aged from six months to less than five years should not receive the 2011 Fluvax® vaccine. Fluvax® is not registered for use in this age group in 2011. The rate of febrile convulsions was found to be up to one per 100 (one per cent) in children under the age of five years vaccinated with Fluvax® or Fluvax® Junior in 2010. The expected rate of febrile convulsions with trivalent influenza vaccines is usually less than one per 1000 doses. Children less than five years of age should receive either of the alternative influenza vaccines available for paediatric use (Vaxigrip® or Influvac®). Data from 2010 indicated that there was no increase over the expected rates of fever or febrile convulsions following either of these vaccines. For children aged from five years to less than 10 years there is a strong preference for the use of either Vaxigrip® or Influvac®. This is based on data which showed no increase in rates of fever or febrile convulsions following administration of either of these vaccines. Fluvax® may still be used in children aged from five years to less than 10 years when no timely alternative vaccine is available. If Fluvax® is administered, parents should be informed of the potential increased risk of fever but that febrile convulsions are rare in this age group. Rotavirus vaccineThere is new evidence from Australia and overseas suggesting a small increased risk of intussusception in infants following rotavirus vaccine. The increased risk appears to occur mainly in the first one to seven days

following the first dose of rotavirus vaccine. Studies are continuing to check this and to determine whether the increased risk extends past the first week or occurs after other doses. Professor Jim Bishop, Australia’s former Chief Medical Officer, recommended that immunisation providers continue to vaccinate young infants against rotavirus but that they inform parents and carers of the rare risk of intussusception and how to be alert for the signs and symptoms of the condition. The key points for the immunisation provider to remember are:• Do not give rotavirus vaccine outside the recommended age limits. • Do not give rotavirus vaccine to a baby with a history of intussusception. • Report any cases of intussusception following rotavirus vaccination to the Surveillance of Adverse Events
Following Vaccination In the Community (SAEFVIC) www.saefvic.org.au.
National Immunisation Program schedule updateThe Minister for Health and Ageing, The Honourable Nicola Roxon, announced in February 2011 that two vaccines would be added to the National Immunisation Program schedule in the near future for eligible children. Prevenar 13® is a vaccine used to protect babies against thirteen strains of pneumococcal disease. Currently Prevenar® protects babies against seven strains of pneumococcal bacteria; it was replaced by Prevenar 13® on 1 July. It is a direct replacement for the three-dose course for babies aged two, four and six months. The other vaccine, Menitorix®, is a combination vaccine used to protect children against meningococcal C disease and Haemophilus influenzae type b (Hib). Menitorix® will replace two vaccines, Hiberix® and NeisVac C®. Menitorix® will be available as a single dose for children aged 12 months of age and will reduce by one the number of injections required. During the current increase in pertussis infections, timely immunisation with a pertussis containing vaccine has been promoted especially for the schedule points. The scheduled two month old vaccines can be given as early as six weeks of age. The four year old booster vaccines can be given as early as three years and six months of age for parental convenience if attending the clinic for another purpose. Free Boostrix® vaccine for parents continuesDue to the increasing rise in pertussis notifications in Victoria, the Department of Health now recommends that the free Boostrix® vaccine be administered to partners of pregnant women at any time before the birth of the baby. Earlier administration of the vaccine will reduce the risk of the exposure of the infant to pertussis from a close contact. Recent research in Victoria demonstrates about 50 per cent of fathers and 70 per cent of mothers had received Boostrix® vaccine after the birth of their baby. In light of this research it is important to take every opportunity to immunise the partner of the pregnant mother as soon as possible. Mothers should still be offered the Boostrix® vaccine as soon as possible after the birth of the baby and ideally before leaving hospital. Any partner who did not receive the vaccine before the birth should receive the free Boostrix® vaccine as soon as possible after the birth. The pertussis containing vaccine (Boostrix®) is available free for parents of newborn babies until 30 June 2012.Suspension of Pneumovax® 23 vaccine second dose The Therapeutic Goods Administration (TGA) is advising health professionals not to administer a second dose of Pneumovax® 23 vaccine. This is pending the outcome of a review of an increased rate of injection site reactions following administration of the second dose. Pneumovax® 23 vaccine is used to prevent life threatening bacterial infections. It has been funded in Victoria since 1998 and was included in the National Immunisation Program in 2005. It is recommended for persons aged four and over who are predisposed to invasive pneumococcal disease.The Immunisation Handbook currently recommends revaccination five years after the first dose. Pneumovax® 23 vaccine is known to be associated with a high rate of local injection site reactions. There is varying evidence from published trials as to whether injection site reactions are more common following revaccination. In March 2011, seven patients vaccinated in New South Wales were reported to have severe local site reactions including cellulitis and abscess. Since notification of this cluster the TGA has worked with the states and territories to determine whether this event was confined to a specific vaccine batch and has collated and analysed adverse event reports from all states and territories. The Australian Technical Advisory Group on Immunisation is currently reviewing the place of Pneumovax® 23 in the National Immunisation Program. All adverse events to Pneumovax® 23 vaccine should be reported to SAEFVIC at www.saefvic.org.au

Table 1: Immunisation coverage by age cohort and local government area, Victoria
Age group
per cent fully immunised Local Government area (LGA)
Total LGAs (% LGAs)
12<15 months
100 Loddon, Towong, West Wimmera 3 (4)
95+Ararat, Campaspe, Colac-Otway, Corangamite, Gannawarra, Hobsons Bay, Horsham,
Moonee Valley, Southern Grampians, Strathbogie, Warrnambool 11 (14)
90–<95
Ballarat, Banyule, Bass Coast, Baw Baw, Bayside, Boroondara, Brimbank, Casey, Central Goldfields, Darebin, East Gippsland, Frankston, Glen Eira Glenelg, Golden Plains, Greater Bendigo, Greater Dandenong, Greater Geelong, Greater Shepparton, Hume, Indigo, Kingston, Knox, Latrobe, Macedon Ranges, Manningham, Maribyrnong, Maroondah, Melbourne, Melton, Mildura, Mitchell, Moira, Monash, Moorabool, Moreland, Mornington Peninsula, Moyne, Nillumbik, Northern Grampians, Port Phillip, Pyrenees, Swan Hill, Wangaratta, Wellington, Whitehorse, Whittlesea, Wodonga, Wyndham, Yarra
50 (63)
85–<90 Buloke, Cardinia, Hindmarsh, Mansfield, Mount Alexander, Murrindindi, South Gippsland, Stonnington, Surf Coast, Yarra Ranges, Yarriambiack 11 (14)
80–<85 Benalla, Queenscliffe 2 (3)
75–<80 Alpine, Hepburn 2 (3)
24<27 months
100 Hindmarsh, Towong, Yarriambiack 3 (4)
95+Ararat, Colac-Otway, Corangamite, East Gippsland, Frankston, Golden Plains, Hepburn, Horsham, Indigo, Latrobe, Loddon, Melton, Moorabool, Murrindindi, Nillumbik, Southern Grampians
16 (20)
90–<95
Alpine, Ballarat, Banyule, Bass Coast, Baw Baw, Bayside, Boroondara, Brimbank, Buloke, Campaspe, Cardinia, Casey, Central Goldfields, Darebin, Gannawarra, Glen Eira, Glenelg, Greater Bendigo, Greater Dandenong, Greater Geelong, Greater Shepparton, Hobsons Bay, Hume, Kingston, Knox, Macedon Ranges, Manningham, Mansfield, Maribyrnong, Maroondah, Mildura, Moira, Monash, Moonee Valley, Moreland, Mornington Peninsula, Mount Alexander, Moyne, Port Phillip, South Gippsland, Stonnington, Strathbogie, Surf Coast, Wangaratta, Warrnambool, Wellington, West Wimmera, Whitehorse, Whittlesea, Wodonga, Wyndham, Yarra, Yarra Ranges
53 (67)
85–<90 Benalla, Mitchell, Northern Grampians, Pyrenees, Swan Hill 5 (6)
80–<85 Melbourne, Queenscliffe 2 (3)
60<63 months
100 Horsham, Loddon, Strathbogie, West Wimmera 4 (5)
95+ Campaspe, Golden Plains, South Gippsland, Southern Grampians, Wodonga 5 (6)
90–<95
Alpine, Ararat, Ballarat, Bass Coast, Bayside, Benalla, Boroondara, Brimbank, Buloke, Casey, Central Goldfields, Darebin, East Gippsland, Frankston Glen Eira, Glenelg, Greater Bendigo, Hindmarsh, Hume, Indigo, Kingston, Knox, Latrobe, Manningham, Maroondah, Melton, Mildura, Mitchell, Monash, Moonee Valley, Moreland, Moyne, Northern Grampians, Towong, Warrnambool, Wellington, Whittlesea, Wyndham
38 (48)
85–<90
Banyule, Baw Baw, Cardinia, Colac-Otway, Corangamite, Greater Dandenong, Greater Geelong, Greater Shepparton, Hepburn, Hobsons Bay, Macedon Ranges, Maribyrnong, Melbourne, Moira, Moorabool, Mornington Peninsula, Murrindindi, Nillumbik, Stonnington, Surf Coast, Wangaratta, Whitehorse, Yarra, Yarra Ranges
24 (30)
80–<85 Mansfield, Port Phillip, Pyrenees, Swan Hill 4 (5)
75–<80 Gannawarra, Queenscliffe, Yarriambiack 3 (4)
70–<75 Mount Alexander 1 (1)

Childhood Pneumococcal Immunisation – Provider guidelinesUpdated 4 July 2011
Summary table – pneumococcal vaccination schedule for children < 5 years of age)
Cohort 13vPCVPrevenar® 13
All states and territories except the Northern Territory
10vPCVSynflorix® Used in theNorthern Territory only
23vPPVPneumovax® 23
All children (except NT) 2, 4, and 6 months of age N/A Aboriginal and Torres Strait Islander children residing in QLD, SA and WA aged 18–24
months
All children residing in the NT N/A 2*, 4, 6 and 18 months of age N/A
Children with underlying medical conditions
2, 4, 6 and 12 months of age 2*, 4, 6 and 18 months of age 4–5 years
http://immunise.health.gov.au/internet/immunise/publishing.nsf/Content/4F22B5FB0B270E64CA2578C0000B191F/$File/pneumococca-guidelines-V3.pdf

Communicable disease surveillance, Victoria, January–March 2011We report a summary of infectious disease notifications received until March 2011. Table 8 includes historical comparisons of selected diseases for the period 1 January–31 March 2011 at both the State and regional levels. Data are provisional and subject to revision as further information becomes available.
There were no notifications of Murray Valley encephalitis, diphtheria, Japanese encephalitis, Kunjin virus, plague, rabies, poliomyelitis, viral haemorrhagic fevers or yellow fever in this reporting period.
For more information: More information about notifiable infectious diseases in Victoria, including details for medical practitioners and laboratories on how to notify, general information about disease prevention and control, and additional surveillance data, can be found on the Communicable Disease Prevention and Control Unit website at http://www.health.vic.gov.au/ideas/
Enteric diseasesJoy Gregory, Department of Health and OzFoodNet VictoriaOutbreaks of gastrointestinal illnessEighty-three outbreaks of gastrointestinal illness were reported to the Communicable Disease Prevention and Control Unit (CDPCU) during the first quarter of 2011 (Table 1). Of these, thirteen outbreaks were considered to be foodborne or probable foodborne. For the remaining 70 outbreaks, person-to-person transmission was suspected in 56 outbreaks and mode of transmission was unknown for 14 outbreaks. Table 1: Outbreaks of gastrointestinal illness, 1 January 2011–31 March 2011
SettingOutbreaks
Persons affected Pathogen/toxin (number of outbreaks)
Aged care 37 559
Norovirus (7)Suspected viral
(16)Salmonella Typhimurium 170 (1)
Campylobacter (1)Clostridium perfringens (2)
Unknown(10)
Child care/play centre 20 257
Norovirus (6)Suspected viral
(14)
Hospital 11 96
Norovirus (2)Adenovirus (1)
Rotavirus (2)Suspected viral (2)
Salmonella Typhimurium 135(1)*
Unknown (3)
Private residence 1 5 Unknown (suspected Salmonella)
**Residential facility (other) 6 24
Norovirus (2)Suspected viral (2)
Unknown (2)
Restaurant 4 40Salmonella Typhimurium 170 (1)
Norovirus (1)Unknown (2)

Take away food Premises 4 131
Salmonella Typhimurium 9 (2)Salmonella Typhimurium RDNC A066
and Salmonella Typhimurium 170 (1)Salmonella Typhimurium 135 (1)
Total 83 1112
Norovirus(18)
Suspected viral(34)
Salmonella Typhimurium 9 (2)Salmonella Typhimurium 170 (2)
Salmonella Typhimurium RDNC A066 and Salmonella Typhimurium 170 (1)
Salmonella Typhimurium 135 (2)Rotavirus (2)
Adenovirus (1)Campylobacter (1)
Clostridium perfringens (2)Unknown
(18)
* Denotes a foodborne outbreak where the food was prepared in a hospital kitchen but the majority of cases were residents of an adjoining aged care facility.
** Other residential facilities were supported services accommodation (3); supported residential services (2) and a disability service (1).
Foodborne disease outbreaksThirteen outbreaks were considered to be foodborne or probable foodborne this quarter, affecting at least 229 people. Eleven of these outbreaks are summarised below with a further two outbreaks summarised in the report Increase in Salmonellosis, Victoria, 2011 published in this issue.In January, an outbreak of diarrhoea affecting 21 residents and four staff members of an aged care facility occurred. Two of the residents had a second episode of diarrhoea a few days after the first. Five of seven faecal specimens collected tested positive for C. perfringens enterotoxin. This outbreak was atypical of a C. perfringens outbreak with onsets of illness spread over a 10 day period. However, the predominance of diarrhoea and a median duration of illness of one day were consistent with the aetiology.In January, an outbreak of diarrhoea affecting nine residents of an aged care facility was notified to CDPCU. Onset of illness ranged over an 18 hour period and symptoms and duration of illness were consistent with C. perfringens. The single faecal specimen collected was negative for bacterial and viral pathogens. A food source could not be identified for this outbreak.A cluster of seven cases of Salmonella Typhimurium 9 in persons living in a regional Victorian town was detected in January through routine surveillance. Of five cases interviewed, three reported onsets of illness between 10 and 13 December and recalled eating chicken sushi hand rolls from the same premises. An investigation at the premises by the local environmental health officer revealed that cooking procedures for the chicken appeared to be adequate, however, it was still possible that one batch of chicken had become cross contaminated after cooking. Salmonella surveillance in early February identified a family of four cases who reported consuming a Vietnamese dish containing salty fish, eggs and pork mince from a restaurant/take away food premise. A further three groups, who had eaten the same food item from this premises, were identified through active surveillance of notified Salmonella cases living in the same geographical area. In total, 15 cases (nine confirmed with Salmonella Typhimurium 170) who had consumed the food on either 26 or 27 January were associated with this outbreak. A review of the preparation and cooking methods for this food item revealed that it was probable that the batch eaten by the cases was undercooked. An outbreak of gastroenteritis in a family was identified during follow up of the point source outbreak linked to the Vietnamese restaurant (see above). A person with confirmed Salmonella Typhimurium 44 had attended a family barbeque with five others. Foods served included roasted meat, salads and a tiramisu for dessert. Five of the six attendees became unwell with diarrhoea between 27 January and 1 February and the sixth person, a child, had abdominal pain but no diarrhoea. The outbreak was suspected to have been caused by consumption of tiramisu containing raw eggs.

In February the CDPCU was notified of an outbreak of diarrhoea affecting seven residents of an aged care facility. Onsets of illness occurred over a nine hour period and symptoms and duration of illness were consistent with C. perfringens. Two of three faecal specimens collected were positive for C. perfringens enterotoxin. A food source could not be identified in this outbreak.In February, an outbreak of diarrhoea affecting four residents and one staff member of an aged care facility was investigated. Subsequently three of the residents were notified with Salmonella Typhimurium 135. Investigation revealed that food for the aged care facility and a community meals on wheels service was prepared by the local hospital. Active surveillance for cases in the hospital and community linked a further two confirmed Salmonella cases to the outbreak. One of these cases was a patient in the hospital and the other was a healthcare worker at the hospital. No cases were identified in community residents who received meals on wheels. Illness onsets for the seven cases ranged over a nine day period. A food source for this outbreak could not be identified. In February CDPCU investigated an outbreak of diarrhoea affecting 15 residents of an aged care facility. Onsets of illness ranged over a four day period. Six faecal specimens were collected and three were positive for Campylobacter jejuni. Food process information was collected for several meals eaten by cases during their incubation period but a source could not be identified. As only a small proportion of residents were affected it was possible that cross contamination of some foods caused this outbreak. In March, an outbreak of diarrhoea affecting nine residents of an aged care facility was notified to CDPCU. Onsets of illness ranged over a 24 hour period and symptoms and duration of illness were consistent with C. perfringens. Three faecal specimens collected were negative for bacterial and viral pathogens. A food source could not be identified in this outbreak.A hospital doctor notified CDPCU of five family members who had developed acute gastroenteritis symptoms approximately 24 hours after consuming Vietnamese chicken rolls from a bakery in the western suburbs of Melbourne and had subsequently presented to the emergency department. Faecal specimens collected from two of these cases were subsequently confirmed positive for Salmonella. Active case finding among confirmed Salmonella cases residing in this geographical area identified a total of 17 cases (13 confirmed Salmonella Typhimurium 135) who had eaten either chicken or pork rolls from this premise during their incubation period. An additional case, an asymptomatic food handler working at the premises, also had a faecal specimen positive for STm 135. Council environmental health officers undertook an on-site investigation which included supervised cleaning and sanitising, and sampling and disposal of high risk foods. Of 21 food samples submitted for analysis two samples of chicken liver pate were positive for STm 135. The rolls also contained raw egg butter but samples taken for analysis were negative for Salmonella. A review of the process for making the chicken liver pate did not determine any food safety issues. In late March, an outbreak of gastroenteritis affecting five residents and one staff member of an aged care facility was investigated by CDPCU. Salmonella Typhimurium 170 was subsequently identified as the aetiology of this outbreak with all five residents having positive faecal specimens. Illness onsets ranged over an 11 day period and symptoms lasted for a median of 12 days. A review of the menus and food process information revealed the likely cause as low dose sporadic contamination of a ready–to-eat food such as cream which had been processed (beaten) in a blender that had not been adequately cleaned and sanitised after being used to process raw foods such as eggs.Norovirus activityNorovirus and suspected viral activity this quarter (52 outbreaks) was the lowest first quarter activity since 2007 (49 outbreaks) (Figure 1). Sixty-one per cent of the norovirus outbreaks and sixty per cent of the suspected viral outbreaks were in aged care and healthcare settings.
Blood borne virusesEllen Donnan, Department of Health, Victoria Hepatitis B—newly acquired infectionsIn the first quarter of 2011, the department received notifications for 457 cases of hepatitis B, of which 13 (three per cent) were classified as newly acquired infections. This was a decrease of 24 per cent on the previous quarter (n=17), and a 43 per cent reduction compared with the first quarter of 2010 (n=23) (Figure 2).

Of the 13 newly acquired cases, 62 per cent (n=8) were in males and 38 per cent (n=5) were in females. Notified cases were in adults aged between 17 and 63 years with a median age of 29 years. Sixty-two per cent of the newly acquired cases were Australian born (n=8), 31 per cent were overseas born (n=4) and country of birth was not reported for the one remaining case. Indigenous status was reported for 100 per cent of the cases, and none were reported as Aboriginal and/or Torres Strait Islander.Eighty-five per cent of the cases (n=11) were from metropolitan Melbourne and 15 per cent were from regional Victoria (n=2). Among the 13 newly acquired cases, six reported being symptomatic for hepatitis and four reported having elevated liver function tests as the reason for testing for hepatitis B. Other reasons reported included having a medical condition (n=1), drug and alcohol screening (n=1), STI screening (n=1) and refugee screening (n=1); cases may have reported multiple reasons for testing. One case was co-infected with hepatitis C.Injecting drug use was reported for three cases (23 per cent) and in two cases a hepatitis B positive sexual partner (heterosexual) was identified. Other risk factors identified included a surgical procedure (n=2) tattooing (n=1), body piercing (n=1), a major dental procedure (n=1) and receiving blood products overseas (multiple risk factors are reported for cases with no history of injecting drug use or a hepatitis B positive sexual partner). Of these, one surgical procedure, the body piercing and dental procedure were conducted overseas. There was insufficient information regarding the other surgical procedure for an investigation to be conducted. For the remaining four cases, a definitive risk factor was not identified. Hepatitis C – newly acquired infections1 A total of 651 cases of hepatitis C were notified during the first quarter of 2011, of which 46 (eight per cent) were classified as newly acquired infections. This was a 28 per cent increase on the number of cases notified in the previous quarter but an 11 per cent decrease on the number of cases from the first quarter of 2010 (Figure 3). Of the 46 newly acquired hepatitis C cases reported in this quarter, 59 per cent (n=27) had a previous negative hepatitis C antibody testing history within the past 24 months. Seventy-nine per cent of cases (n=36) were in males and 21 per cent (n=10) were in females. The age range of males was 18 to 54 years, with a median age of 28.5 years and for females the age range was 14 to 30 years, with a median age of 22 years. Sixty-three per cent (n=29) of cases were from metropolitan Melbourne, 30 per cent (n=14) were from regional Victoria and for the remaining three cases postcode of residence was unknown or not reported. Of the 46 newly acquired cases, patients having elevated liver function tests (n=13), prisoner screening (n=12) and presenting with signs and symptoms of acute hepatitis (n=10) were the most common reasons for testing reported. Other reasons for testing reported included screening upon patient request (n=9), drug and alcohol screening (n=7), screening for sexually transmissible infections (n=6), screening as a result of medical illness (n=2), routine antenatal screening (n=1) and other reasons for screening (n=4). Multiple reasons for testing may be reported. Injecting drug use was the main risk factor reported for 32 cases (70 per cent). Risk factors reported for the remaining cases included tattooing (n=3), imprisonment (n=3), having a hepatitis C positive sexual partner (n=1), body piercing (n=1) and other risk factors (n=1) (multiple risk factors are reported for cases with no history of IDU). For three cases a risk factor could not be determined, and in four cases risk factors are pending follow-up.Hepatitis D Four cases of hepatitis D were notified during the first quarter of 2011. Cases were in three males and one female, with an age range of 19 to 42 years. This was a 50 per cent increase on the number of cases notified in the previous quarter. All of the cases were born overseas. All cases were co-infected with hepatitis B; two had been diagnosed with hepatitis B in 2006 and two were diagnosed in 2011.
Vaccine-preventable diseasesLucinda Franklin, Department of Health, VictoriaInfluenza

There were 347 cases of influenza notified in the first quarter of 2011, 282 more than for the same period in 2010. The age range of cases was six days to 94 years with a median age of 40 years. Twenty-six cases were in children under the age of 18 years, seven of whom were aged less than five years. Sixty-four cases were in persons aged 65 years or older. Fifty per cent of cases (n=174) were in males. A majority of cases were influenza type A virus infections (n=304), of which 46 were further subtyped as H1N1 (2009) pandemic strain. Thirty-one cases were attributable to type B virus, and 12 cases were identified as mixed (type A and B) infections. No deaths due to influenza were reported during the period. One outbreak was identified during the quarter, in an aged care facility in the North West Metropolitan Region. Eighteen out of the 57 residents were symptomatic and four required hospitalisation. Five staff were ill. Of five swabs obtained from symptomatic residents, three were positive for influenza A, subtyped as non H1N1 (2009). Of these three residents, two had been vaccinated with the current season’s influenza vaccine. No deaths were reported as a result of the outbreak.Invasive pneumococcal disease (IPD)A total of 46 cases of IPD were notified in the first quarter of 2011, six fewer than for the same period in 2010. Cases were in persons aged 11 months to 90 years with a median age of 49 years. Five cases were in children aged less than five years of whom one was aged less than 12 months. Fourteen cases were in persons aged 65 years or older (30 per cent), of whom 10 were aged 75 years or older, and seven were aged 85 years or older. Twenty-seven cases were in males (59 per cent), compared with nineteen in females. Indigenous status data were complete for 39 cases (85 per cent); none were reported as being Aboriginal and/or Torres Strait Islander. Three deaths due to IPD were reported during the quarter, in adults aged 49, 74 and 90 years.Serotyping was completed for 43 case isolates (93 per cent); one further case was not typable, and two were missing. Five cases were eligible for free conjugate vaccine under the National Immunisation Program; however none of these infants were infected with a serotype contained within the conjugate vaccine. Among the fourteen cases in persons aged 65 years or older, nine were infected with a serotype contained in the polysaccharide vaccine. Three of these cases were reported as vaccinated, three were not vaccinated, and three were of unknown vaccination status. Of the five cases in persons aged 65 years or older infected with non-polysaccharide vaccine serotypes, three were fully vaccinated and the vaccination status of the remaining two cases was unknown. Of the two deaths reported amongst persons aged 65 years or older both were due to serotypes contained within the polysaccharide vaccine. One case was fully vaccinated (considered a vaccine failure) and the other was not vaccinated. Both were immunocompromised.MeaslesNineteen confirmed cases of measles were notified to the department in the first quarter of 2011, an increase of 14 cases compared with the same period in 2010 (Figure 4). Cases were in three children aged less than five years, six persons aged five to 26 years, seven adults aged 31 to 37 years and three adults aged 45 to 66 years. A majority of the cases (n=12, 63 per cent) were in males. Eleven cases were not vaccinated for measles, three were too young to be vaccinated, two had previously received one dose of measles-containing vaccine, and three cases were of unknown vaccination status. Epidemiological investigations undertaken by the department and genotyping by the Victorian Infectious Diseases Reference Laboratory established five distinct chains of transmission. The index case in each of the five confirmed chains of transmission acquired their infection overseas (Southeast Asia, Pakistan, India, and the United Kingdom). Two of the index cases resulted in no further cases; two resulted in one further case and the remaining index case resulted in at least three generations of cases. Situations in which transmission occurred included household contacts, healthcare facilities and shopping centres. The department undertook a number of measures to control the spread of disease including the follow up of contacts of cases for measles vaccination or normal human immunoglobulin where indicated and health alerts to general practitioners, hospital emergency departments and the general public via the media. Of note are the two cases in their sixties, who fell well outside of the age group considered susceptible for measles infection (those born between the late 1960s and the mid 1980s.MumpsThirteen cases of mumps were notified to the department in the first quarter of 2011, compared with one case in the corresponding period in 2010. Cases were in adults aged between 17 and 80 years, with a median age of 36 years. Eight cases (62 per cent) were among females. Vaccination status for eight of the 13 cases was unknown, one case was fully vaccinated for age, one had received one dose of mumps-

containing vaccine, and two cases were not vaccinated. One cluster of mumps was detected during the quarter, among three overseas students who lived on campus at a local university. RubellaSix cases of rubella were notified to the department in the first quarter of 2011 compared with four in the corresponding period in 2010. Cases were aged between 19 and 56 years. Three of the six cases (50 per cent) were in males. Half of the cases were overseas born. Vaccination status was unknown for four cases and the remaining two cases were not vaccinated. PertussisA total of 2,918 confirmed and probable cases of pertussis were notified to the department in the first quarter of 2011, a 60 per cent increase on the 1,158 cases notified in the same quarter of 2010 (Figure 5). Notification rates amongst infants were again higher in the first quarter of 2011 with a total of 59 cases in zero to six month-olds, compared with 36 cases for the same period in 2010, and 35 cases for the same period in 2009. No outbreaks were reported in the quarter. One death due to pertussis occurred in a two week-old infant; this was the first death in an infant attributed to pertussis since 2004. Varicella zoster There were 889 notified cases of varicella zoster virus in the first quarter of 2011, compared with 918 cases in the previous quarter, and 819 cases in quarter one of 2010. Of these, 120 (14 per cent) were probable or confirmed cases of chickenpox and 281 (32 per cent) were probable or confirmed cases of herpes zoster (shingles). The clinical manifestation was unspecified for the remaining 488 cases (55 per cent). Chickenpox Of the 120 chickenpox cases, 52 per cent were in males, and sex was unknown for one case. Ages ranged from five months to 88 years (median age two years). Age was unknown for five cases. Region of residence was available for all cases. A majority of chickenpox cases resided in the metropolitan regions (73 per cent), with North West Metropolitan Region reporting the highest proportion of cases (28 per cent). Shingles Of the 281 shingles cases, 57 per cent were in females. Ages ranged from two to 96 years; age was unknown for four cases. Region of residence was available for all but one case. A majority of herpes zoster cases (78 per cent) resided in the metropolitan regions, with Southern Metropolitan Region reporting the highest proportion of cases (30 per cent).
Other notifiable diseasesInvasive meningococcal diseaseLucinda Franklin, Department of HealthTen confirmed and probable cases of invasive meningococcal disease were notified in the first quarter of 2011 compared with five cases for the same period in 2010. Ages ranged from four months to 58 years (median age 11 years). Four cases were in infants aged less than 12 months; two were aged four months, one was aged six months, and one was aged nine months. There was one case in a two year old and the remainder of the cases were in adults aged 19 to 58 years (median age 24.5 years). Seven of the ten cases (64 per cent) were in females. All cases were serogroup B infections. No deaths were reported during the quarter and no epidemiological links between cases were identified.LegionellosisLucinda Franklin, Department of Health, Victoria Twenty-two confirmed and probable cases of legionellosis were notified in the first quarter of 2011, three more than for the corresponding period in 2010. Ages ranged from 33 to 82 years (median age 65 years). Eighty-two per cent of cases were in males. Sixteen cases were Legionella pneumophila infections, thirteen of which were serogroup 1 infections; three cases could not be further serogrouped. Three cases were identified as L. longbeachae infections, two cases were identified as Legionella ‘other’ infections, and one case could not be further speciated (Table 1). One case, in a person aged 79 years, died due to his Legionella pneumophila (no further serogroup) infection complicated by end-stage chronic obstructive pulmonary

disease. Three cases of Legionella pneumophila serogroup 1 infection had a history of overseas travel reported during their incubation period (two to Indonesia and one to New Zealand). The cases who travelled to Indonesia stayed at the same hotel in Bali, Indonesia as two previous Victorian cases, notified in August and October 2010. The National Incident Room at the Australian Government Department of Health and Ageing was notified so that the Indonesian authorities could be informed; they advised that Western Australia had also reported cases from August and December 2010 and January 2011, all of whom had stayed at the same hotel. A European case of Legionella pneumophila serogroup 1 infection notified in January 2011 had also stayed at the same hotel. This brought the total number of cases linked to the Bali hotel to 10 cases. As a result, Victoria released a Health Alert from the Office of the Chief Health Officer on 14 January 2011 to alert intending travellers of the potential risk to individuals with chronic medical or other immunocompromising conditions, and so that active case-finding could be instigated. An alert was also issued by the Western Australian Government, and the cases were reported on ProMED. Table 1. Confirmed and probable cases of Legionella notified to the Department of Health Victoria, 1 January–31 March 2011
Legionella speciesNumber of cases
L. pneumophila 16
L. longbeachae 3
Legionella other species1 2
Legionella laboratory confirmed (NOS)2 1
Total 22
1. includes two cases of L. bozemanii2. NOS = not further speciated or serogrouped
Creutzfeldt-Jakob disease (CJD)Genevieve Klug, Australian National CJD RegistryDue to the nature of the disease, months or years may elapse between the notification date of suspected CJD cases and their subsequent confirmation (or rejection) by the Australian National Creutzfeldt-Jakob disease Registry (ANCJDR). Thus the figures reported here will differ from those in Table 8, which counts confirmed and probable cases by their notification date. Seven new suspect cases of CJD were notified to the ANCJDR between January and March 2011. All of these cases remain under investigation. Within the same period, two previously notified cases were re-classified from suspect to confirmed CJD and a further case was classified as non-CJD. The number of notified and confirmed cases was in keeping with the findings from previous quarters (Figure 6, Table 2).
Table 2: Notification of suspect and confirmed, definite and probable CJD cases by quarter, June 2004–March 2011
Suspect **Confirmed
Qtr*Notifie
d CJD Not CJD
Jun–04Sep–04Dec–04
131
1 1
Mar–05Jun–05
62
11

Sep–05Dec–05
102
44
2
Mar–06Jun–06Sep–06Dec–06
2234
32 5
2 3
Mar–07Jun–07Sep–07Dec–07
4355
1 1
21 2
Mar–08Jun–08Sep–08Dec–08
7574
6223
22 2
Mar–09Jun–09Sep–09Dec–09
4529
3 1
1211
Mar–10Jun–10Sep–10Dec–10
7344
3612
1
1
Mar–11 7 2 1
Total 121 55 26
* notified = suspect cases notified within the quarter**confirmed = cases confirmed as definite or probable reclassified within the quarter
Mycobacterial infectionsLynne Brown, Department of HealthTuberculosis Owing to the slow growing nature of Mycobacterium tuberculosis, data are preliminary and subject to change.
Eighty-six cases of tuberculosis were notified during the first quarter of 2011. This was seven fewer than for the first quarter in 2010 (n=93) and significantly fewer than the previous quarter (n=138) (Figure 7). Of the 86 cases, 45 were in males and 41 were in females. Patients aged 25 to 29 years comprised twenty-three per cent of the total notifications (n=20), with 49 per cent aged between 20 and 34 years. Six children aged fifteen years and under were notified with TB compared with only one child in the first quarter of 2010 and none in the previous quarter. Of these, one was a recently arrived refugee from Pakistan, four were household contacts of a parent with pulmonary TB who were found on contact tracing, and one, a four year old male from regional Victoria, had no known exposure to or risk factors for TB.
In the first quarter of 2011, 83 per cent (n=71) of cases notified were overseas born patients. Of these, 25 per cent were born in India and a further 17 per cent were born in Vietnam or the Philippines; twelve patients were from African countries and nine were born in source countries for Australia’s current humanitarian entry program. There were no notifications in Aboriginals or Torres Strait Islander people for this reporting period. Information about HIV testing was available for 76 of the 86 cases notified. Seventy percent of TB patients were reported to have been tested for HIV infection, a six per cent decrease from the same quarter last year. Of concern was the 21 per cent of patients reported not to have been tested for HIV infection. One patient

was known to have TB/HIV co-infection. Ten patients were notified with active tuberculosis as a result of a Tuberculosis Undertaking (TBU) investigation and one patient was notified a result of migrant/refugee screening. Five patients were identified by contact tracing, including the four children described above.
Site of diseaseTable 3: Notifications of tuberculosis, by site of disease, Victoria, January 2011–March 2011
Site Number
Pulmonary 35
Pulmonary and other sites 15
Lymph nodes 20
Bone / Joint 3
Pleural 5
Peritoneal 3
Other 5
Total 86
Pulmonary disease accounted for 58 per cent of all notifications (n=50) (Table 3). Additional sites, other than the lungs, were noted in fifteen notifications with pulmonary TB; most commonly lymph nodes (n=8) and pleural and miliary TB (n=6). Extra pulmonary disease was reported in 42 per cent of cases—the most common sites being lymphatic (56 per cent) and with pleural (14 per cent). Other sites of disease included two patients with TB of the skin (erythema induratum or nodosum), TB of the liver, the pituitary gland and the brain. Laboratory confirmation of diagnosis in some form (smear, culture, antigen detection or histology) was obtained for 85 per cent of notifications (Table 4). Only sixty-seven per cent of all cases were confirmed by culture, which was a 15 per cent decrease on the same period in 2010, and five per cent decrease of the previous quarter. The diagnosis was confirmed by culture in only 78 per cent of pulmonary notifications. Eighteen per cent of pulmonary disease was diagnosed on radiological grounds. At a time when there is increasing concern about the emerging threat of multi-drug resistant (MDR) disease in Australia, the decrease in culture confirmation and drug sensitivity testing is a serious issue. There was one case of MDR TB; a patient who was already on treatment for an initially drug susceptible isolate. Three other isolates had resistance to at least one first-line drug.
Vector borne diseasesNasra Higgins, Department of Health, VictoriaAlphavirus infectionRoss River virus infectionsThe department received 968 notifications for Ross River virus disease during the first quarter of 2011, representing a seven fold increase compared with the first quarter of 2010 (n=141). Of the 968 cases reported in the first quarter, 57 per cent were female. The median age of cases was 45 years (range: one to 92 years). Ninety-two per cent of cases (n=903) were from rural regions of Victoria with the highest number of cases from the Grampians Region (n=397). There were 386 cases from Loddon Mallee Region, 68 cases from Barwon South Western Region, 40 cases from Hume Region and 12 cases from Gippsland Region. Seventy-seven (eight per cent) cases were residents of metropolitan regions of whom 23 cases travelled to rural regions in Victoria and 11 cases reported interstate travel during their incubation

period. The travel history of 43 cases was unknown or not reported. Barmah Forest virus infection There were 147 cases of Barmah Forest virus disease notified during the first quarter of 2011 compared with 16 cases during the same reporting period in 2010 (Figure 8). The age range of the cases was 11 to 81 years. Ninety per cent of the cases (n=133) were from rural Victoria. The remaining 14 cases were residents of metropolitan regions, of which eight cases reported interstate travel, one reported overseas travel and five reported travel to rural Victoria. Travel history was unknown or not reported for the remaining case. Flavivirus infectionDuring the first quarter of 2011 the department received 47 notifications of flavivirus infection, of which 43 were dengue virus. The number of cases of dengue reported this quarter was more than a five-fold increase compared with the same period in 2010 (n=eight) (Figure 9). Twenty-five of the 43 cases were female (58 per cent). The median age was 42 years (range: three to 73 years). Forty-one of the 43 dengue cases acquired their illness overseas; in Indonesia (23 cases), East Timor (four cases), Thailand (four cases), South East Asia/mainland South East Asia (two cases), Cambodia, Fiji, Malaysia, Maldives, the Middle East, the Philippines, Singapore, and Vietnam (one case each). The remaining two cases reported travel to Queensland. No further testing was available for the remaining four flavivirus infections. All four cases were in returned travellers from Indonesia.MalariaDuring the first quarter of 2011 the department received notifications for 26 cases of malaria compared with 16 cases for the same period in 2010. Of the 26 cases, 20 were in males and six in females. The age range of the cases was 21 to 68 years with a median age of 30 years. Infection with Plasmodium vivax accounted for 14 cases (54 per cent). Five cases acquired their illness in Papua New Guinea, four cases reported India and one case each reported Thailand, South East Asia, Solomon Islands and Indonesia. Infection with P. falciparum accounted for 10 cases (38 per cent). Two cases acquired their illness in Sudan and one case each reported Ghana, Indonesia, mainland South East Asia, Malawi, Papua New Guinea, Sierra Leone, Sub-Saharan Africa and Uganda. The remaining two cases were a P. ovale infection acquired in Malawi and a P. malariae infection acquired in Sub-Saharan Africa. ChikungunyaSix cases of chikungunya were notified in the first quarter of 2011; the same number of cases notified for the same period in 2010. All six cases acquired their infection overseas; two in India and one case each in Sri Lanka, mainland South East Asia, Mauritius and East Timor.
ZoonosesLucinda Franklin, Department of Health, VictoriaBrucellosisNo cases of brucellosis were notified to the department in the first quarter of 2011. LeptospirosisFour cases of leptospirosis were notified to the department in the first quarter of 2011, compared with two cases for the same period in 2010. All four cases were identified as Leptospira hardjo infections and all were in males. The age range of the cases was 34 to 67 years. Three cases occurred in the Hume Region, and one in Barwon South-Western Region. All four cases were linked to local dairy farms.
PsittacosisEighteen confirmed and probable cases of psittacosis were notified to the department in the first quarter of 2011, compared with ten cases for the same period in 2010. Ages ranged from 26 to 74 years (median age 48 years) and ten (55 per cent) of the cases were in females.

There were cases across six of the eight Victorian regions during this quarter, with six cases (32 per cent) in Eastern Metropolitan Region, four in North West Metropolitan Region, three in Southern Metropolitan Region, three in Hume Region, and one case in each of Gippsland and Grampians Regions. Thirteen of the eighteen cases (72 per cent) reported exposure to domestic birds, eleven of whom also reported contact with wild birds. None of these cases were occupationally acquired. Five of the eighteen cases (28 per cent) reported exposure to wild birds only. Two of these cases worked in a high-risk occupation; a 54 year-old male and a 61 year-old male, both of whom worked as gardeners. Q feverOne case of Q fever was notified in the first quarter of 2011 compared with two cases for the same period in 2010. The case was in a male aged 19 years who was not vaccinated for Q fever. The case was a resident of the Grampians Region, and it is unknown if the infection was occupationally-acquired.
Sexually transmissible infections (STIs)Ellen Donnan, Department of Health, VictoriaChlamydiaThere were 4,733 cases of chlamydia notified to the department in the first quarter of 2011. This was a 20 per cent increase compared with the previous quarter (n=3,942), and a 12 per cent increase on the 4,216 cases notified in the first quarter of 2010 (Figure 10). Fifty-eight per cent of the cases (n=2,760) were in females and 41 per cent (n=1,939) were in males. Sex was not reported for 34 cases. The age range of females was 18 days to 78 years with a median age of 23 years. The age range of males was one month to 82 years with a median age of 23 years. Infections were most commonly reported in the 20 to 24 year age group for both females and males (39 per cent and 36 per cent respectively). Eighty per cent of chlamydia cases notified were aged 15 to 29 years. Indigenous status was reported for 51 per cent of the total cases, of which 28 (one per cent) were reported as being Aboriginal and/or Torres Strait Islander. The majority of cases (n=3,187, 67 per cent) had a metropolitan postcode of residence. Postcode of residence was not reported for 346 cases and the remainder (n=1,200) were from regional Victoria. Whilst the majority of notified cases resided in metropolitan Melbourne, the annualised notification rate (based on first quarter data) was highest in Barwon South Western Region (figure 11).Enhanced data were available for 880 cases (19 per cent). Of these, 52 (six per cent) were reported as being HIV positive. Fifty-one of these were males, of whom 50 reported being MSM (the gender of the sexual partner of one case was not reported) and one was a heterosexual female. Among the 880 cases, screening was reported as the main reason for testing for 58 per cent of the cases followed by clinical presentation (24 per cent) and contact tracing (11 per cent). Five per cent reported other reasons for testing while for 13 cases this information was unknown or not reported. Males Of the 444 males for whom enhanced surveillance data were available, 52 per cent (n=229) reported a female sexual partner, 43 per cent (n=189) reported a male sexual partner and one reported both male and female partners. Source of infection was unknown or not reported for six per cent of males (n=25). Among the males reporting a female sexual partner, 67 per cent (n=153) reported having a casual sexual partner, 26 per cent (n=59) reported having a regular sexual partner, one reported a sex worker as the likely source of infection, and sexual partner type was unknown or not reported for the remaining 17 cases. For those cases reporting a male sexual partner, 87 per cent (n=165) reported having a casual sexual partner and 10 per cent (n=19) reported having a regular sexual partner. For the remaining six cases this information was unknown or not reported. Seventy-nine per cent (n=352) of the cases reported Victoria as the place of infection; 10 per cent (n=44) reported overseas and nine cases reported interstate. This information was unknown or not reported for nine per cent of cases (n=38). Females Of the 433 females for whom enhanced surveillance data were available, 90 per cent (n=390) reported a male sexual partner and two per cent (n=8) reported a female sexual partner. Source of infection was

unknown or not reported for the remaining six per cent of the cases (n=35). Forty-eight per cent of the females (n=210) reported having a regular sexual partner and 37 per cent (n=160) reported a casual sexual partner as the source of the infection. Five identified as sex workers and two reported a sex worker as the source of infection. For the remaining 56 cases (13 per cent) this information was unknown or not reported. The majority of cases (n=369, 85 per cent) reported that the infection was acquired in Victoria. The remainder reported overseas acquisition (n=23, five per cent), interstate (n=7, two per cent) and unknown or not reported (n=34, eight per cent). GonorrhoeaThere were 449 cases of gonorrhoea notified in the first quarter of 2011; a 13 per cent increase on the 399 cases notified in the previous quarter, however a two per cent decrease when compared with the first quarter of 2010 (n=458) (figure 12). Eighty-seven per cent of the cases (n=392) were in males (age range 17 to 78 years) and 12 per cent (n=55) were in females (age range six to 59 years). Sex was not reported for two cases. The overall median age for males and females was 30 years. Infections continued to be most frequently notified in the 25 to 29 year age group (23 per cent of cases).Seventy-eight per cent of the cases (n=350) reported had a metropolitan postcode of residence. Postcode of residence was not reported for 61 cases (14 per cent) and the remainder were from regional Victoria.Indigenous status was reported for 71 per cent (n=314), with five cases (one per cent) notified as being Aboriginal and/or Torres Strait Islander. Enhanced surveillance data were received for 60 per cent (n=271) of the cases. Of these, 26 (10 per cent) were reported as being HIV positive; all males, 25 of whom reported a male sexual partner and one who reported a female sexual partner.Among the 271 cases, 55 per cent (n=147) were tested due to clinical signs and symptoms of STIs, followed by STI screening (n=99, 37 per cent) and contact tracing (n=11, four per cent). Four cases reported other reasons and reason for testing was unknown or not reported for the remaining eight cases. MalesAmong the 242 males for whom enhanced surveillance data were available, 62 per cent (n=149) reported a male sexual partner and 26 per cent (n=64) reported a female sexual partner. For the remaining 12 per cent (n=29) this information was unknown or not reported. Of the 149 males reporting a male sexual partner, 86 per cent (n=128) reported acquiring their infection from a casual sexual partner and six per cent (n=9) reported a regular partner. The source of infection was unknown or not reported for 12 cases (eight per cent). For those cases reporting a female sexual partner, 56 per cent (n=36) reported acquiring the infection from a casual partner, 19 per cent (n=12) reported a regular partner as the source of infection and 16 per cent (n=10) reported acquiring the infection from a female sex worker. This information was unknown for the remaining five cases.Seventy-nine per cent (n=192) reported that they acquired their infection in Victoria, 12 per cent reported overseas (n=28) and two per cent reported interstate (n=6). This information was unknown or not reported for 12 cases. Females Of the 27 females for whom enhanced surveillance data were available, 24 (88 per cent) reported acquiring their infection from a male sexual partner. This information was unknown or not reported for the remaining three cases. Thirty-three per cent (n=9) reported acquiring the infection from a regular partner, 30 per cent (n=8) from a casual partner and one case reported acquiring it from a sex worker. Five females identified as sex workers likely to have acquired the infection from a client. For the remaining four cases this information was unknown or not reported.Twenty-four of the females (89 per cent) reported that they acquired their infection in Victoria, one (four per cent) reported overseas and one (four per cent) reported interstate. For the remaining case this information
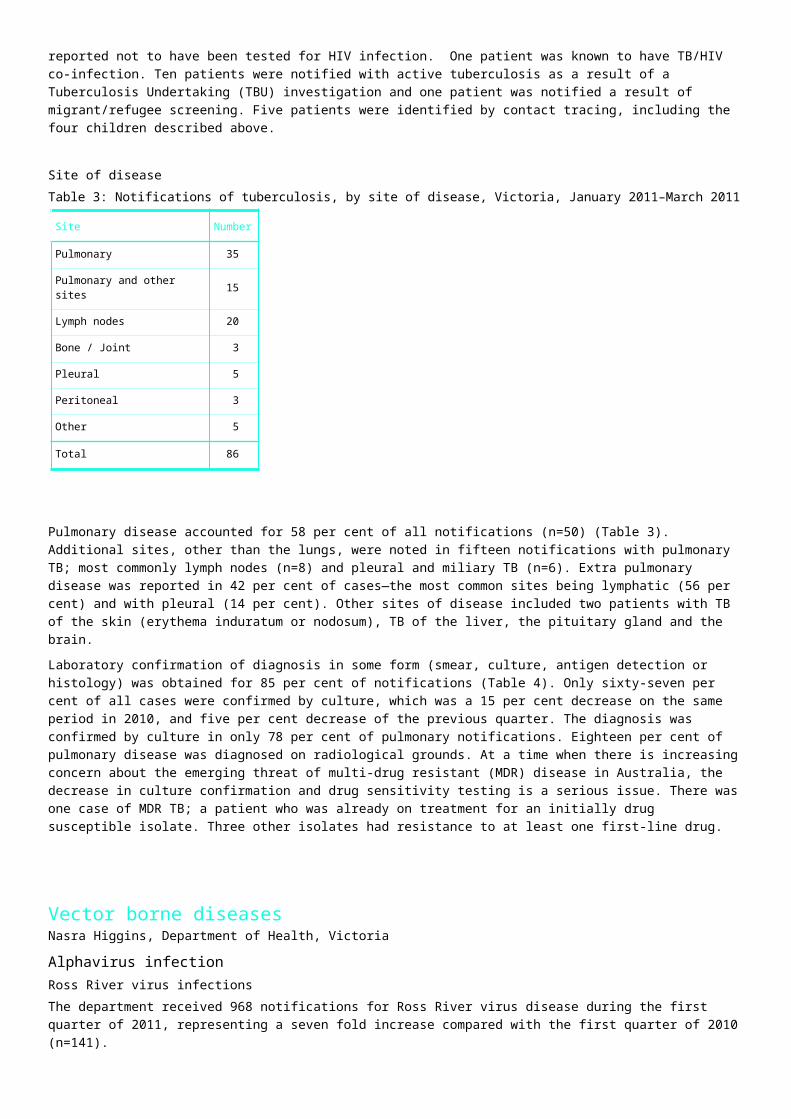
was unknown or not reported.Antibiotic resistance Testing for susceptibility to ceftriaxone and ciprofloxacin was conducted for 236 isolates. Of the 236 isolates tested for resistance to ceftriaxone, 95 per cent (n=223) were sensitive and the remaining 12 isolates were less sensitive or non-susceptible. Of the 234 isolates tested for ciprofloxacin, 68 per cent (n=158) were sensitive and 32 per cent (n=76) were resistant. Syphilis—infectious (less than two years duration)During the first quarter of 2011 the department received notifications for 228 cases of syphilis of which 81 were infectious syphilis1. This was a five per cent increase in comparison to the number of cases of infectious syphilis notified in the first quarter of 2010, and an 11 per cent increase on the number of cases in the previous quarter (Figure 13).Of infectious syphilis cases notified, 91 per cent (n=74) were in males, with an age range of 19 to 70 years, and a median age of 35 years. The seven cases in females (age range 23 to 45 years, median 31 years) notified this quarter was consistent with the number of female cases notified per quarter over the previous 12 months.Of the 81 cases, 32 were primary infections, 16 were secondary infections and 33 were early latent infections.
Eighty-three per cent of the cases were from metropolitan regions (n=67), four were from regional Victoria and postcode of residence was not reported or unknown for 10 cases. Indigenous status was reported for 79 cases (98 per cent), with none reported as Aboriginal and/or Torres Strait Islander. Enhanced data were completed for all infectious syphilis cases. Of the 81 infectious syphilis cases, 19 were HIV positive (23 per cent); all were males, of whom 18 reported a male sexual partner; partner gender was unknown or not reported for the remaining male. Re-infections of infectious syphilis were reported in 11 males, seven of whom were HIV positive. The most commonly reported reason for testing was screening (n=41) followed by cases presenting with signs and symptoms (n=27). Two cases were detected on antenatal screening, two were asymptomatic contacts of an infected individual and other reasons for testing were reported for nine cases. MalesOf the 74 males for whom enhanced surveillance data were available, 60 (81 per cent) indicated a male sexual partner, eight (11 per cent) indicated a female sexual partner, and for the remaining six cases this information was unknown or not reported. Among the males reporting a male sexual partner, 88 per cent (n=53) reported acquiring their infection from a casual sexual partner, three per cent (n=2) reported a regular sexual partner, and for the remaining five cases sexual partner type was unknown or not reported. Of the eight males reporting a female sexual partner, four reported acquiring the infection from a casual sexual partner and three reported a sex worker as the likely source of infection. This information was unknown or not reported for the remaining case. Eighty-two per cent (n=61) reported that they acquired their infection in Victoria, five reported overseas and for the remaining six cases this information was not reported or unknown.FemalesSeven cases in females were reported this quarter, of which four reported acquiring their infection from a male sexual partner and one reported a female sexual partner. This information was unknown or not reported for two cases. Four cases reported a regular sexual partner and one reported a casual sexual partner as the likely source of infection. For two cases this information was unknown or not reported. Three of the seven cases reported Victoria as the place of acquisition of infection and for the remaining four cases this information was unknown or not reported.
Human immunodeficiency virus (HIV) and acquired immunodeficiency

syndrome (AIDS)Carol El-Hayek and Anita Feigin, Burnet Institute, VictoriaPlease note that numbers are subject to change as a result of ongoing case investigations and annual audit of retrospective records.
There were 68 new HIV diagnoses1 during the first quarter of 2011, which was a 31 per cent increase on the number of diagnoses notified in the first quarter of 2010, and similar to the mean number of 65 HIV diagnoses per quarter between 2006–2009. (Figure 14).Age, sex and exposure categoriesOf the 68 new HIV diagnoses in the first quarter of 2011, 94 per cent (n=64) were male (Table 4). Similar to the first quarter of 2010, 80 per cent of males diagnosed were aged 30 years or over. The median age in males was 40 years, consistent with 39 years in the first quarter of 2010. In females, the median age at HIV diagnosis in this quarter was 36 years, compared with 30 years in the same quarter of 2010.Table 4: New HIV diagnoses by age group, Jan–Mar 2011, Jan–Mar 2010 and Jan–Dec 2010
Age group(years)
First quarter 2011January–March 2011
First quarter 2010January–March 2010
Annual total 2010January–December 2010
Males* Females Total Males Females Total Males Females Total
n % n % n % n % n % n % n % n % n %
0–12 0 0.0 0 0.0 0 0.0 0 0.0 0 0.0 0 0.0 1 0.5 1 5.0 2 0.9
13–19 0 0.0 0 0.0 0 0.0 0 0.0 0 0.0 0 0.0 2 1.0 0 0.0 2 0.9
20–29 13 20.3 1 25.0 14 20.6 8 17.0 3 60.0 11 21.2 52 24.8 6 30.0 58 25.2
30–39 19 29.7 2 50.0 21 30.9 16 34.0 1 20.0 17 32.7 64 30.5 8 40.0 72 31.3
40–49 21 32.8 0 0.0 21 30.9 12 25.5 1 20.0 13 25.0 53 25.2 2 10.0 55 23.9
50–59 6 9.4 1 25.0 7 10.3 9 19.2 0 0.0 9 17.3 27 12.9 3 15.0 30 13.0
60+ 5 7.8 0 0.0 5 7.4 2 4.3 0 0.0 2 3.9 11 5.2 0 0.0 11 4.8
Total 64 100 4 100 68 100 47 100 5 100 52 100 210 100 20 100 230 100
* Includes one individual whose reported sex was transgender
Table 5: New HIV diagnoses by exposure category, Jan–Mar 2011, Jan–Mar 2010 and Jan–Dec 2010
Exposure category
First quarter 2011January–March 2011
First quarter 2010January–March 2010
Annual total 2010January–December 2010
Males Females Total Males Females Total Males Females Total
n % n % n % n % n % n % n % n % n %
Male to male sex 56 87.5 0 0.0 56 82.4 38 80.9 0 0.0 38 73.1 175 83.3 0 0.0 175 76.1
Male to male sex and IDU 1 1.6 0 0.0 1 1.5 2 4.3 0 0.0 2 3.9 6 2.9 0 0.0 6 2.6
IDU 0 0.0 0 0.0 0 0.0 0 0.0 0 0.0 0 0.0 0 0.0 0 0.0 0 0.0
Heterosexual contact 5 7.8 4 100 9 13.2 6 12.8 5 100 11 21.2 23 11.1 19 95.0 42 18.3
Other /unknown 2 3.1 0 0.0 2 2.9 1 2.1 0 0.0 1 1.9 6 2.9 1 5.0 7 3.0
Total 64 100 4 100 68 100 47 100 5 100 52 100 210 100 20 100 230 100
Male-to-male sexual contact

Between January and March 2011, 82 per cent of all new HIV diagnoses (n=56) were among men who have sex with men (MSM) compared to 73 per cent (n=38) in the same quarter last year (Table 5). The median age at HIV diagnosis among MSM this quarter was 38 years compared with 37 years in the same quarter of 2010. In the first quarter of 2011, the majority of MSM diagnosed with HIV reported acquiring their HIV infection in Victoria (80 per cent, n=45) (Figure 15) and 64 per cent (n=36) reported acquiring their HIV infection from a casual or anonymous partner (Figure 16).
Heterosexual contactIn the first quarter of 2011, there were nine HIV notifications (five males) associated with heterosexual contact, similar to the first quarter of 2010 (Table 6). Two (22 per cent) of the heterosexual cases diagnosed this quarter were among people born in a high HIV prevalence country (HPC) 2, compared to 46 per cent (n=5) in the same quarter last year. Three of the nine heterosexual cases reported sexual contact with a person with HIV, and for three of the cases further information on the type of heterosexual exposure could not be ascertained.The median age at diagnosis in people with heterosexually acquired HIV infection between January and March 2011 was 46 years; 49 years among males and 36 years among females. In the same period in 2010, this was 46 years in males and 30 years in females.Table 6: New HIV diagnoses associated with heterosexual contact, Jan–Mar 2011, Jan–Mar 2010 and Jan–Dec 2010
Exposure category
First quarter 2011January–March 2011
First quarter 2010January–March 2010
Annual total 2010January–December 2010
Males Females Total Males Females Total Males Females Total
n % n % n % n % n % n % n % n % n %
Person from an HPC1 0 0.0 2 50.0 2 22.2 2 33.3 3 60.0 5 45.5 4 17.4 8 42.1 12 28.6
Hetero contact with person from an HPC1
1 20.0 0 0.0 1 11.1 0 0.0 0 0.0 0 0.0 3 13.0 1 5.3 4 9.5
Hetero contact with bisexual male 0 0.0 0 0.0 0 0.0 0 0.0 0 0.0 0 0.0 0 0.0 0 0.0 0 0.0
Hetero contact with an IDU 0 0.0 0 0.0 0 0.0 0 0.0 0 0.0 0 0.0 0 0.0 0 0.0 0 0.0
Hetero contact with person with HIV
1 20.0 2 50.0 3 33.3 0 0.0 0 0.0 0 0.0 1 4.4 3 15.8 4 9.5
Hetero contact, not otherwise specified
3 60.0 0 0.0 3 33.3 4 66.7 2 40.0 6 54.6 15 65.2 7 36.8 22 52.4
Total 5 100 4 100 9 100 6 100 5 100 11 100 23 100 19 100 42 100
Table 7: New HIV diagnoses in Victoria, by time since last negative test and/or seroconversion illness, Jan–Mar 2011, Jan–Mar 2010 and Jan–Dec 2010
Time between HIV diagnosis and negative test and/or seroconversion illness
First quarter 2011January–March 2011
First quarter 2010January–March 2010
Annual total 2010January–December 2010
Males Females Total Males Females Total Males Females Total
n % n % n % n % n % n % n % n % n %

Less than 1 year (Newly acquired) 34 53.1 2 50.0 36 52.9 21 44.7 2 40.0 23 44.2 98 46.7 6 30.0 10
4 45.2
1 year to less than 3 years 6 9.4 0 0.0 6 8.8 7 14.9 0 0.0 7 13.5 27 12.9 1 5.0 28 12.2
3 or more years 7 10.9 1 25.0 8 11.8 5 10.6 1 20.0 6 11.5 23 11.0 1 5.0 24 10.4
No previous negative test or seroconversion illness
11 17.2 1 25.0 12 17.7 11 23.4 2 40.0 13 25.0 42 20.0 5 25.0 47 20.4
History unknown 6 9.4 0 0.0 6 8.8 3 6.4 0 0.0 3 5.8 20 9.5 7 35.0 27 11.7
Total 64 100 4 100 68 100 47 100 5 100 52 10021
0 100 20 10023
0 100
Newly acquired infectionsIn the first quarter of 2011, 53 per cent of all new HIV diagnoses (n=36) were classified as newly acquired infections, compared to 44 per cent (n=23) in the first quarter of 2010 and 45 per cent in 2010 overall (Table 7). Ninety two per cent of the newly acquired infections in this quarter were among MSM (n=33) compared to 87 per cent in the same quarter in 2010 (n=20).
Acquired immunodeficiency syndrome (AIDS)Eleven AIDS notifications were received between January and March 2011, all of whom were for males. Of these cases, nine were among MSM.DeathsThere were seven deaths following HIV diagnosis in the first quarter of 2011. Six were in males, of whom five were MSM. Two of the seven deaths were attributed to AIDS.
CommentsThe first quarter of 2011 saw an increase in the number of HIV diagnoses compared to the same quarter in 2010, however this number was comparable with the same period of the four years prior to 2010. The proportion of MSM diagnosed and newly acquired infections among MSM increased compared with the first quarter of 2010. If high risk groups such as MSM are testing more frequently this could be leading to early detection.

Table 10: Notifications of infectious diseases, by Department of Health region, 1 January to 31 March 2011 and historical comparisonsNote—data are preliminary figures only and may be subject to revision (daily surveillance reports are available online at http://www.health.vic.gov.au/ideas)
Barwon South Western Grampians Loddon Mallee Hume Gippsland
North and West Metropolitan
Eastern Metropolitan
Southern Metropolitan Unknown Victoria
Notifiable disease 2011 ytd 2010 ytd 2011 ytd 2010 ytd 2011 ytd 2010 ytd 2011 ytd 2010 ytd 2011 ytd 2010 ytd 2011 ytd 2010 ytd 2011 ytd 2010 ytd 2011 ytd 2010 ytd 2011 ytd 2010 ytd 2011 ytd 2010 ytd2010 total
Blood borne diseasesHepatitis B – newly acquired 1 3 0 3 1 1 0 0 0 0 6 10 1 2 6 3 0 1 15 23 69Hepatitis B – unspecified 8 6 1 5 4 4 4 17 5 2 212 241 92 107 108 120 8 14 442 516 1916Hepatitis C – newly acquired 6 7 4 2 1 2 2 2 1 3 22 19 3 7 4 11 3 2 46 55 178Hepatitis C – unspecified 41 20 19 22 38 28 27 23 31 35 213 190 63 61 145 129 26 15 603 523 2454Hepatitis D 0 0 0 0 0 0 0 0 0 0 2 0 2 0 0 0 0 0 4 0 6Enteric diseasesCampylobacter infection 187 128 95 52 149 100 127 78 103 98 550 436 391 402 437 424 8 10 2047 1728 6635Cryptosporidiosis 3 5 2 2 0 6 0 6 3 7 18 35 7 35 9 35 0 0 42 131 443Food/water/environmental – other 3 3 1 2 3 2 0 4 0 12 40 48 4 14 11 37 49 70 111 192 1379Haemolytic uraemic syndrome 0 0 0 0 0 0 0 0 0 0 0 0 0 0 0 1 0 0 0 1 3Hepatitis A 1 0 0 8 1 2 2 4 0 0 4 10 3 4 2 13 0 3 13 44 94Hepatitis E 0 0 0 0 0 0 0 0 0 0 0 2 2 0 0 2 0 0 2 4 11Listeriosis 1 0 0 0 0 1 0 0 0 0 0 8 1 3 0 0 0 0 2 12 28Paratyphoid 0 0 0 1 0 0 0 0 0 0 5 6 1 5 1 3 0 0 7 15 27Salmonellosis 79 42 34 37 70 61 50 72 31 25 287 206 226 107 202 175 6 7 985 732 2261Shigellosis 2 1 0 1 0 1 1 0 0 0 8 9 5 4 7 17 0 0 23 33 87Typhoid 0 0 0 0 0 0 0 0 0 0 7 3 0 2 2 1 1 0 10 6 26Vero toxin producing E.coli 1 2 1 1 1 0 0 0 0 0 2 0 1 0 0 1 0 0 6 4 11Other notifiable conditionsBlood lead greater than 10µg/dL 0 13 3 2 1 1 0 0 2 1 3 112 2 10 4 123 2 2 17 264 752Creutzfeldt-Jakob disease 0 0 0 0 0 0 0 0 0 0 0 0 0 0 1 2 0 0 1 2 7Invasive meningococcal disease – group B 1 0 0 1 1 0 2 0 0 0 2 0 3 2 1 0 0 0 10 3 33Invasive meningococcal disease – group C 0 0 0 0 0 0 0 0 0 0 0 0 0 0 0 0 0 0 0 0 1Invasive meningococcal disease – other 0 0 0 0 0 0 0 0 0 0 0 1 0 1 0 0 0 0 0 2 9Legionella – other 0 0 0 0 1 0 0 0 1 0 1 0 0 0 0 0 0 0 3 0 4Legionella longbeachae 0 0 0 0 0 1 0 1 1 1 0 2 0 0 2 0 0 0 3 5 11Legionella pneumophila – indeterminate serotype 0 0 1 0 0 0 1 0 0 0 0 0 0 0 1 0 0 0 3 0 1Legionella pneumophila 1 1 2 0 0 0 1 1 2 0 0 6 7 0 1 5 2 0 0 13 15 51Leprosy 0 0 0 0 0 0 0 0 0 1 0 0 0 0 0 0 0 0 0 1 4Mycobacterium infection (non-TB) 0 0 0 0 1 0 1 0 0 0 1 2 1 1 4 0 0 0 8 3 28Mycobacterium ulcerans 2 2 0 0 1 1 0 1 0 0 0 0 0 2 1 0 0 0 4 6 32Mycobacterium infection (TB complex) 2 1 0 1 1 2 0 0 2 0 40 46 17 20 23 22 0 0 85 92 436Sexually transmissible infectionsChlamydia 384 256 171 151 237 190 227 171 181 179 1408 1374 683 595 1096 1089 346 210 4733 4215 16552Gonococcal infection 11 10 6 8 6 10 6 9 9 5 155 185 51 53 144 123 61 55 449 458 1757Syphilis – < 2 years duration (infectious) 1 1 2 1 1 1 1 2 0 1 33 29 8 5 25 27 10 10 81 77 289Syphilis – > 2 years duration 5 1 3 3 4 3 2 2 2 3 70 59 11 14 29 24 21 7 147 116 533Vaccine preventable diseasesHaemophilus influenzae type b 0 0 0 0 0 0 0 0 0 0 0 0 0 0 0 0 0 0 0 0 5Influenza 7 0 4 2 7 0 4 1 5 1 99 19 77 20 143 22 1 2 347 67 2051Invasive pneumococcal disease 3 2 1 2 1 5 2 2 4 3 15 9 6 16 9 10 4 3 45 52 403Measles 2 1 3 0 0 0 0 0 0 0 9 0 2 2 3 2 0 0 19 5 14Mumps 1 0 0 0 2 0 0 0 0 0 7 0 0 0 3 1 0 0 13 1 10Pertussis 172 183 101 44 241 72 269 102 274 114 638 344 527 185 665 206 32 5 2919 1255 7010Rubella 0 0 0 0 0 0 0 0 0 0 3 2 3 1 0 1 0 0 6 4 22Tetanus 0 1 0 0 0 0 0 0 0 0 0 0 0 0 0 0 0 0 0 1 1Varicella-zoster virus – Chickenpox 9 1 8 2 8 7 1 1 6 8 34 35 28 28 26 26 0 0 120 108 542Varicella-zoster virus – Shingles 12 14 12 7 9 8 13 11 15 20 62 60 74 62 83 33 1 1 281 216 694Varicella-zoster virus – Unspecified 32 28 12 14 12 12 13 15 17 23 124 126 123 103 143 158 12 16 488 495 2035Vector borne diseasesBarmah Forest 6 1 12 2 75 2 33 1 7 6 6 0 4 2 4 2 0 0 147 16 53Chikungunya 0 0 0 0 0 0 0 0 0 0 1 2 4 1 1 3 0 0 6 6 17Dengue 2 0 0 0 2 1 0 0 0 2 17 1 4 0 19 4 0 0 44 8 112Flavivirus infection – unspecified 0 0 0 0 0 0 0 0 0 0 3 0 0 0 1 0 0 0 4 0 12Malaria 3 0 0 1 2 0 1 1 0 0 12 5 3 3 4 6 1 1 26 17 67Ross River 68 1 397 6 386 36 40 26 12 30 29 12 17 14 30 11 2 5 984 141 409ZoonosesBrucellosis 0 0 0 0 0 0 0 0 0 0 0 2 0 0 0 0 0 0 0 2 2Leptospirosis 1 1 0 0 0 0 3 0 0 1 0 0 0 0 0 0 0 0 4 2 14Psittacosis 0 0 1 0 0 5 3 0 1 1 4 1 6 3 3 0 0 0 18 10 36Q Fever 0 0 1 0 0 2 0 0 0 0 0 2 0 0 0 0 0 0 1 4 192007 ABS est. resident population 359,560 216,779 307,450 263,674 250,907 1,561,798 1,001,907 1,242,657 5,204,826

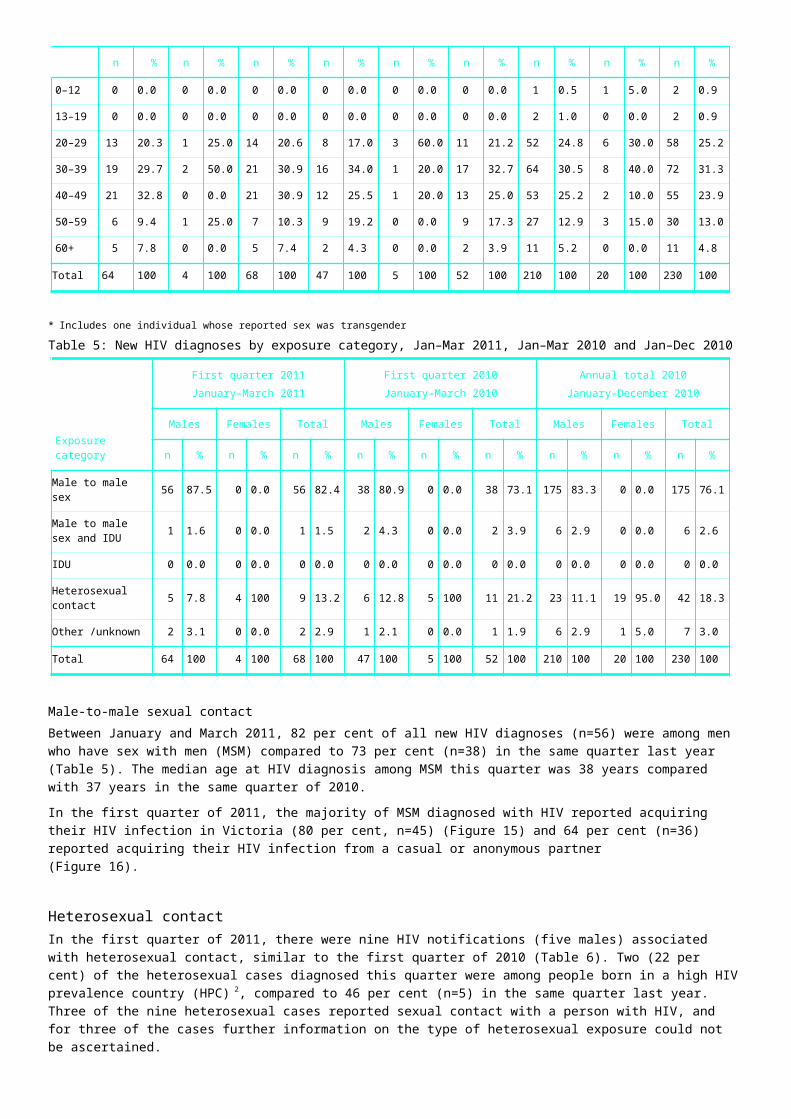
The Victorian Infectious Diseases Bulletin is published quarterly and provides summaries of infectious diseases surveillance data, local news, outbreak investigations, infection control procedures, clinical cases of general interest and brief reports on original clinical or laboratory based research. The bulletin is distributed free of charge to persons with an interest in the control and treatment of infectious diseases in Victoria.Contributions are invited on any topic dealing with the control of infectious diseases. These may be in the form of articles, short reports or letters. Lead articles will be subject to peer review. As a guide, lead articles should be no more than 2500 words with a 200 word abstract, non-peer reviewed articles 2000 words and short reports and letters 800 words. Submissions should be in Microsoft Word IBM-compatible format with Vancouver-style references. We encourage submissions in electronic format. Original data from which graphs and figures have been prepared should be included. Submissions will be edited to conform with the style of the bulletin. The editors recognise and thank the individuals and organisations who contribute to the surveillance and management of infectious diseases. We remind authors of their responsibility to cite appropriate persons as authors and to acknowledge separately those whose work contributed significantly but did not justify authorship.Any material included in the Victorian Infectious Diseases Bulletin may be reproduced in whole or part if appropriately acknowledged. Opinions expressed in the bulletin are those of the authors and not necessarily those of the Department of Health. Data are subject to revision.
Editorial correspondence and subscription enquiries should be directed to:The EditorVictorian Infectious Diseases BulletinCommunicable Disease Prevention and Control UnitDepartment of Health50 Lonsdale StreetMelbourne Victoria 3000Email [email protected]: 1300 651 160
This publication can be found online at: www.health.vic.gov.au/ideasPublished by the Health Protection Branch: Wellbeing, Integrated Care and Ageing, Victorian Government Department of HealthEditorial group: Hazel Clothier, Nasra Higgins, Marion Easton, Emma McBryde, James Fielding, and Rosemary LesterProduction editor: Judy BennettPlanning editor: Hazel Clothier© Copyright State of Victoria, Department of Health, 2010Authorised by the State Government of Victoria, 50 Lonsdale Street, Melbourne.Printed by Kosdown Printing, 63–71 Rouse Street Port Melbourne.August 2011